stakeholders customers · 2019. 12. 26. · • customer center (liaison office for responding to...
TRANSCRIPT

Stakeholders Customers
Data and Information
■The Fujifilm Group’s communications with stakeholders★: Further details are included in the Sustainability Report.
A brand showroom for imaging products, FUJIFILM Imaging Plaza, opened in Marunouchi, Tokyo
IR information on the web Communication with local residents (FUJIFILM Kyushu participated in Suiden-Otasuke-Tai)
In-house magazines for internal communication
Main Stakeholders Main Issues and Areas of Responsibility Methods of Communication
Customers
We have a diverse range of customers, from individuals, businesses, corporations to government offices, etc., since we have business deployed all over the world, and we offer such a wide lineup of products, ranging from digital cameras and cosmetics to office printers, medical systems, medicine, highly functional materials and equipment and materials for graphic arts.
• Securing the safety and quality of products• Design for Environment ★page 18• Provision of appropriate information on
services & products• Improvement of customer satisfaction
levels ★page 51• Customer response & support ★page 51
• Customer Center (liaison office for responding to inquiries)
• Usability evaluation meetings and monitor surveys
• Customer satisfaction surveys• Questionnaires at product purchase• Showrooms, exhibitions• Holding seminars• Websites and social media
Employees
Employees working for the Fujifilm Group total approx. 80,000 people in 283 companies. They are active all over the world and their composition by country is Japan 51%, the U.S. 8%, Europe 6% and Asia 35% (as of end-March 2018).
• Ensuring occupational health and safety ★page 30
• Respect for human rights ★page 45• Utilization and training of human resources
★page 39• Respect for diversity ★page 39
• Providing opportunities for dialogue with top management
• Personnel management division liaison & interviews
• Compliance & Sexual Harassment Helpline• Regular meetings between the company and
labor unions/Health & Safety Committee• Intranet; in-house magazines
Shareholders & investors
FUJIFILM Holdings has 117,386 shareholders, characterized by a high proportion of overseas and institutional investors. Japanese financial institutions account for 33.4% of our shareholders, while foreign companies constitute 31.9% (as of end-March 2018).
• Maintenance and expansion of corporate value
• Appropriate redistribution of profits• Timely & appropriate information disclosure• Measures for Socially Responsible
Investment (SRI) ★page 69
• General shareholders meetings/Business report briefings/Briefings for investors
• IR conferences/Individual meetings• Integrated reports/Shareholder communications• IR information website• Liaison office for responding to inquiries
(Corporate Communication Office)
Transaction partners
The Fujifilm Group conducts transactions worldwide with suppliers of raw materials and components and retailers of our products, etc.
• Thorough implementation of fairness & transparency in transactions
• Promotion of CSR issues in the supply chain, such as human rights and the environment ★page 42
• Briefings to suppliers (on CSR procurement including green supply, management of chemical substances contained, etc.)
• CSR Self-Check (self-audited)• Website for exclusive use of transaction partners• Regular discussions with partners• Liaison office for responding to inquiries (in each
procurement and sales division)
Future generations
& local societies
The Fujifilm Group has bases in approx. 40 countries across the world and conducts its activities by treating the local culture and customs with respect, as well as putting efforts into educational support for future generations.
• Contribution activities which make use of our main business strengths ★page 53
• Respecting local culture & customs and environmental conservation ★page 53
• Prevention of fires and accidents in the workplace
• Educational support for future generations ★page 53
• Environmental communication meetings/Factory tours
• Community volunteer activities• Regular discussions with local governments (city
hall, mayor, community association presidents, etc.)
• Liaison offices (at each factory & office)• Dispatch of lecturers to the academic
organization & endowed chairs• Environmental education activities in cooperation
with NGOs & NPOs
Government organizations & industrial
associations
The Fujifilm Group has businesses in countries all over the world. Each of these businesses belongs to several industrial associations and has active relations with the respective government organizations, including participating in collaborations and information exchanges, etc.
• Legal compliance ★page 49• Joint research & development and
cooperation in public policy aimed at the resolution of social issues ★pages 10, 23
• Participation in various industrial committees• Participation in the development of industry
guidelines• Announcement of public comments through
industry associations• Joint research & development of government or
industry association• Proposals aimed at the resolution of social
issues
NGOs & NPOs
We are conducting dialogues with NGOs & NPOs who are actively aiming for a sustainable society, for the resolution of social issues and environmental conservation.
• Dialogue, collaboration and support aimed at the resolution of social and environmental issues ★page 10
• Obtain views on the Sustainability Report• Participate in stakeholder dialogue• Administration committee of Public Trust Fujifilm
Green Fund• Review meetings on various CSR issues• Afflicted area support activities with NPO
■Mechanisms for communicating with customers
■CS program (Improvement activities based on the CS surveys)
■Customer satisfaction by business solutions
Customers
Top management’s CS activitiesDecisions on companywide policies and methods for resolving
important issues by the Management Council, etc.
Integrated Customer Support Center
ISO 10002Self audits based on the Complaints
Handling Management System
Employees who interfacewith customers
Marketresearches
Of�cialwebsite
CS program evaluations
CompetitiveBenchmarkingCS Program
User CS Program
Daily customer communication(complaints, claims, requests, inquiries, etc.)
Changes in the environment surroundingcustomers, economic trends, etc.
Customer evaluation
CS improvement activities by each core groupImprovement of operating processes based on remarks, opinions,
and requests; strengthening of product planning ability, etc.
Strengthening of relationships with individual customers; improvement ofoperating processes based on remarks, opinions, and requests, etc.
CS improvement activities at customer contact pointsSee
ThinkPlanDo
Complementary relations
The Two CS Programs Objectives for the Use of Survey Results
Competitive Benchmarking CS Program
Users CS Program
CS improvement activities extractedfrom issues when comparedwith competitive companies
CS improvement activities based onindividual customer evaluations
Cus
tom
ers
Activities linked to grasp the CS market position,enhance our strengths, and improve on our weaknesses.
Promote improvements based on customer evaluationsand enhance relationships with individual customers.
Company-wideimprovement activitiesas well as activities byeach site and function
S
P
DT
■�Customer satisfaction questionnaire survey results at the Customer Communication Center (Fujifilm)
Telephone inquiry handling
Ease in understanding the response
Willingness to use Fuji�lm products in the future
Willingness to recommend to friends and acquaintances
20172016
0(Customer Satisfaction Index) 10 20 30 40 50 60 70 80 90 100 120
7476
8994
8994
9893
Imaging 85.2
Healthcare and Materials 80
Document 93.2
0(Customer Satisfaction Index) 10 20 30 40 50 60 70 80 90 100
56 57FUJIFILM Holdings Corporation Sustainability Report 2018 FUJIFILM Holdings Corporation Sustainability Report 2018
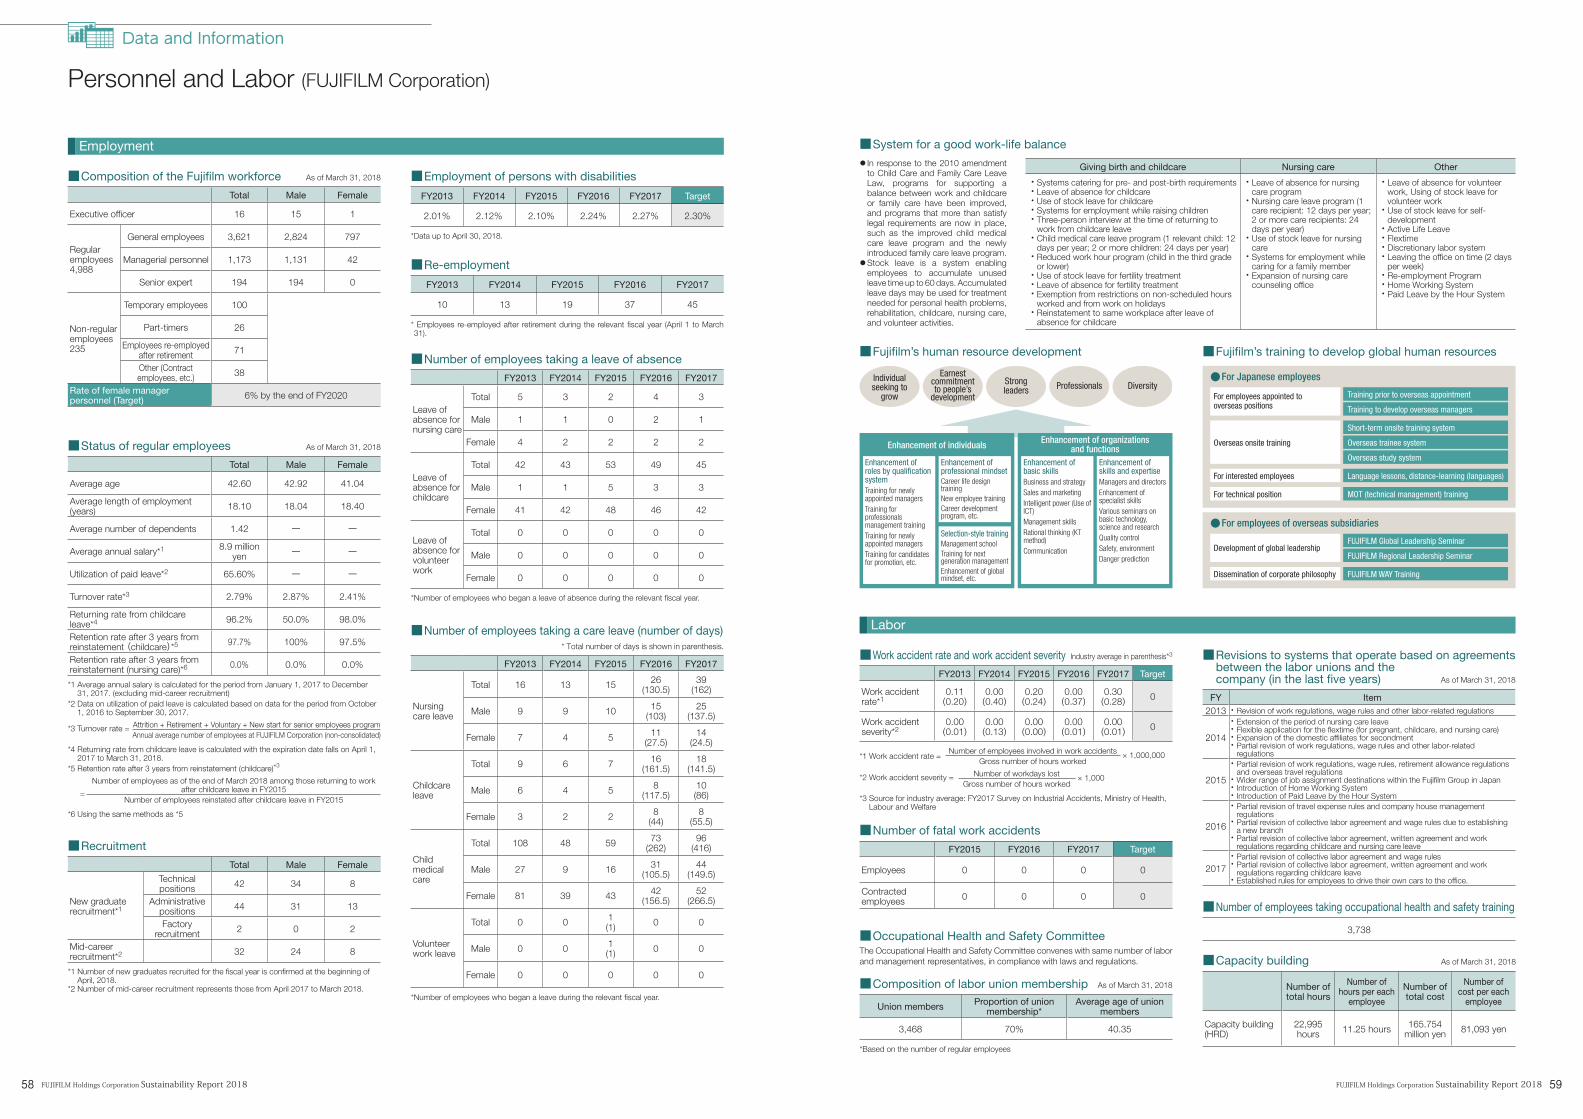
Personnel and Labor (FUJIFILM Corporation)
Employment
Labor
Union members Proportion of union membership*
Average age of union members
3,468 70% 40.35
*1 Average annual salary is calculated for the period from January 1, 2017 to December 31, 2017. (excluding mid-career recruitment)
*2 Data on utilization of paid leave is calculated based on data for the period from October 1, 2016 to September 30, 2017.
*3 Turnover rate = Attrition + Retirement + Voluntary + New start for senior employees programAnnual average number of employees at FUJIFILM Corporation (non-consolidated)
*4 Returning rate from childcare leave is calculated with the expiration date falls on April 1, 2017 to March 31, 2018.
*5 Retention rate after 3 years from reinstatement (childcare)*3
=
Number of employees as of the end of March 2018 among those returning to work after childcare leave in FY2015
Number of employees reinstated after childcare leave in FY2015
*6 Using the same methods as *5
FY2013 FY2014 FY2015 FY2016 FY2017 Target
2.01% 2.12% 2.10% 2.24% 2.27% 2.30%
FY2013 FY2014 FY2015 FY2016 FY2017
10 13 19 37 45
Total Male Female
Executive officer 16 15 1
Regular employees4,988
General employees 3,621 2,824 797
Managerial personnel 1,173 1,131 42
Senior expert 194 194 0
Non-regular employees235
Temporary employees 100
Part-timers 26
Employees re-employed after retirement 71
Other (Contract employees, etc.) 38
Rate of female manager personnel (Target) 6% by the end of FY2020
FY2013 FY2014 FY2015 FY2016 FY2017
Leave of absence for nursing care
Total 5 3 2 4 3
Male 1 1 0 2 1
Female 4 2 2 2 2
Leave of absence for childcare
Total 42 43 53 49 45
Male 1 1 5 3 3
Female 41 42 48 46 42
Leave of absence for volunteer work
Total 0 0 0 0 0
Male 0 0 0 0 0
Female 0 0 0 0 0
FY2013 FY2014 FY2015 FY2016 FY2017 Target
Work accident rate*1
0.11(0.20)
0.00(0.40)
0.20(0.24)
0.00(0.37)
0.30(0.28) 0
Work accident severity*2
0.00(0.01)
0.00(0.13)
0.00(0.00)
0.00(0.01)
0.00(0.01) 0
FY2015 FY2016 FY2017 Target
Employees 0 0 0 0
Contracted employees 0 0 0 0
FY2013 FY2014 FY2015 FY2016 FY2017
Nursing care leave
Total 16 13 15 26(130.5)
39(162)
Male 9 9 10 15(103)
25(137.5)
Female 7 4 5 11(27.5)
14(24.5)
Childcare leave
Total 9 6 7 16(161.5)
18(141.5)
Male 6 4 5 8(117.5)
10(86)
Female 3 2 2 8(44)
8(55.5)
Child medical care
Total 108 48 59 73(262)
96(416)
Male 27 9 16 31(105.5)
44(149.5)
Female 81 39 43 42(156.5)
52(266.5)
Volunteer work leave
Total 0 0 1(1) 0 0
Male 0 0 1(1) 0 0
Female 0 0 0 0 0
Total Male Female
New graduate recruitment*1
Technical positions 42 34 8
Administrative positions 44 31 13
Factory recruitment 2 0 2
Mid-career recruitment*2 32 24 8
Total Male Female
Average age 42.60 42.92 41.04
Average length of employment (years) 18.10 18.04 18.40
Average number of dependents 1.42 ー ー
Average annual salary*1 8.9 million yen ー ー
Utilization of paid leave*2 65.60% ー ー
Turnover rate*3 2.79% 2.87% 2.41%
Returning rate from childcare leave*4 96.2% 50.0% 98.0%
Retention rate after 3 years from reinstatement (childcare)*5 97.7% 100% 97.5%
Retention rate after 3 years from reinstatement (nursing care)*6 0.0% 0.0% 0.0%
*Number of employees who began a leave of absence during the relevant fiscal year.
*Number of employees who began a leave during the relevant fiscal year.
FY Item2013 • Revision of work regulations, wage rules and other labor-related regulations
2014
• Extension of the period of nursing care leave • Flexible application for the flextime (for pregnant, childcare, and nursing care) • Expansion of the domestic affiliates for secondment • Partial revision of work regulations, wage rules and other labor-related regulations
2015
• Partial revision of work regulations, wage rules, retirement allowance regulations and overseas travel regulations
• Wider range of job assignment destinations within the Fujifilm Group in Japan • Introduction of Home Working System • Introduction of Paid Leave by the Hour System
2016
• Partial revision of travel expense rules and company house management regulations
• Partial revision of collective labor agreement and wage rules due to establishing a new branch
• Partial revision of collective labor agreement, written agreement and work regulations regarding childcare and nursing care leave
2017
• Partial revision of collective labor agreement and wage rules • Partial revision of collective labor agreement, written agreement and work regulations regarding childcare leave
• Established rules for employees to drive their own cars to the office.
■Number of employees taking a leave of absence
■Number of employees taking a care leave (number of days)
■System for a good work-life balance
■�Revisions to systems that operate based on agreements between the labor unions and the company (in the last five years)
■Composition of the Fujifilm workforce
■Recruitment
■Composition of labor union membership
■Employment of persons with disabilities
■Re-employment
■Work accident rate and work accident severity
■Number of fatal work accidents
As of March 31, 2018
As of March 31, 2018
Industry average in parenthesis*3
As of March 31, 2018
■Occupational Health and Safety CommitteeThe Occupational Health and Safety Committee convenes with same number of labor and management representatives, in compliance with laws and regulations.
l In response to the 2010 amendment to Child Care and Family Care Leave Law, programs for supporting a balance between work and childcare or family care have been improved, and programs that more than satisfy legal requirements are now in place, such as the improved child medical care leave program and the newly introduced family care leave program.l Stock leave is a system enabling
employees to accumulate unused leave time up to 60 days. Accumulated leave days may be used for treatment needed for personal health problems, rehabilitation, childcare, nursing care, and volunteer activities.
■Status of regular employees As of March 31, 2018
* Total number of days is shown in parenthesis.
*1 Number of new graduates recruited for the fiscal year is confirmed at the beginning of April, 2018.
*2 Number of mid-career recruitment represents those from April 2017 to March 2018.
*Data up to April 30, 2018.
* Employees re-employed after retirement during the relevant fiscal year (April 1 to March 31).
Giving birth and childcare Nursing care Other
• Systems catering for pre- and post-birth requirements • Leave of absence for childcare • Use of stock leave for childcare • Systems for employment while raising children • Three-person interview at the time of returning to work from childcare leave
• Child medical care leave program (1 relevant child: 12 days per year; 2 or more children: 24 days per year)
• Reduced work hour program (child in the third grade or lower)
• Use of stock leave for fertility treatment • Leave of absence for fertility treatment • Exemption from restrictions on non-scheduled hours worked and from work on holidays
• Reinstatement to same workplace after leave of absence for childcare
• Leave of absence for nursing care program
• Nursing care leave program (1 care recipient: 12 days per year; 2 or more care recipients: 24 days per year)
• Use of stock leave for nursing care
• Systems for employment while caring for a family member
• Expansion of nursing care counseling office
• Leave of absence for volunteer work, Using of stock leave for volunteer work
• Use of stock leave for self-development
• Active Life Leave • Flextime • Discretionary labor system • Leaving the office on time (2 days per week)
• Re-employment Program • Home Working System • Paid Leave by the Hour System
*Based on the number of regular employees
Number of total hours
Number of hours per each
employee
Number of total cost
Number of cost per each
employee
Capacity building (HRD)
22,995 hours 11.25 hours 165.754
million yen 81,093 yen
■Capacity building As of March 31, 2018
Data and Information
3,738
■Number of employees taking occupational health and safety training
Enhancement of individuals Enhancement of organizationsand functions
Individualseeking to
grow
Earnestcommitmentto people’s
development
Strongleaders Professionals Diversity
Enhancement of roles by qualification systemTraining for newly appointed managersTraining for professionals management trainingTraining for newly appointed managersTraining for candidates for promotion, etc.
Enhancement of professional mindsetCareer life design trainingNew employee trainingCareer development program, etc.
Selection-style trainingManagement schoolTraining for next generation managementEnhancement of global mindset, etc.
Enhancement of basic skillsBusiness and strategySales and marketingIntelligent power (Use of ICT)Management skillsRational thinking (KT method) Communication
Enhancement of skills and expertiseManagers and directorsEnhancement of specialist skillsVarious seminars on basic technology, science and researchQuality controlSafety, environmentDanger prediction
■Fujifilm’s human resource development
For employees appointed to overseas positions
Overseas onsite training
For interested employees
For technical position
●For Japanese employees
●For employees of overseas subsidiaries
Training prior to overseas appointment
Training to develop overseas managers
Short-term onsite training system
Overseas trainee system
Overseas study system
Language lessons, distance-learning (languages)
Dissemination of corporate philosophy
FUJIFILM Global Leadership Seminar
FUJIFILM Regional Leadership Seminar
FUJIFILM WAY Training
MOT (technical management) training
Development of global leadership
■Fujifilm’s training to develop global human resources
*1 Work accident rate = Number of employees involved in work accidents × 1,000,000
Gross number of hours worked
*2 Work accident severity = Number of workdays lost × 1,000Gross number of hours worked
*3 Source for industry average: FY2017 Survey on Industrial Accidents, Ministry of Health, Labour and Welfare
58 59FUJIFILM Holdings Corporation Sustainability Report 2018 FUJIFILM Holdings Corporation Sustainability Report 2018

Personnel and Labor (Fuji Xerox)
Employment
Labor
FY2013 FY2014 FY2015 FY2016 FY2017 Target
2.07% 2.06% 2.09% 2.22% 2.18% More than 2.0% (throughout the year)
FY2013 FY2014 FY2015 FY2016 FY2017
524 506 554 554 173
Total Male Female
Regular employees8,334
Executive officer* 18 18 0
General employees 5,864 4,723 1,141
Managerial personnel 2,363 2,212 151
Senior expert 89 60 29
Non-regular employees844
Temporary employees 248
Part-timers 3
Employees re-employed after retirement 593
Rate of female manager personnel (Target) 14% by the end of FY2020
FY2013 FY2014 FY2015 FY2016 FY2017
Leave of absence for nursing care
Total 4 3 4 4 5
Male 1 1 2 2 2
Female 3 2 2 2 3
Leave of absence for childcare
Total 46 56 60 84 69
Male 8 9 10 11 14
Female 38 47 50 73 55
Leave of absence for volunteer work
Total 0 3 0 0 1
Male 0 2 0 0 1
Female 0 1 0 0 0
FY2013 FY2014 FY2015 FY2016 FY2017 Target
Work accident rate*1
0.11(0.18)
0.00(0.16)
0.20(0.11)
0.00(0.18)
0.37(0.38) 0
Work accident severity*2
0.00(0.00)
0.00(0.00)
0.00(0.00)
0.00(0.00)
0.01(0.01) 0
FY2015 FY2016 FY2017 Target
Employees 0 0 0 0
Contracted employees 0 0 0 0
FY2013 FY2014 FY2015 FY2016 FY2017
Nursing care leave*2
Total 26 26 44 59 84
Male 16 17 27 40 64
Female 10 9 17 19 20
Childcare leave*3
Total 284 298 314 373 386
Male 97 86 147 206 213*5
Female 187 212 167 167 173
Volunteer work leave*4
Total 15(54)
18(47)
20(62)
11(36)
7(22)
Male 11 12 16 8 5
Female 4 6 4 3 2
Total Male Female
Average age 46.0 46.9 41.3
Average length of employment (years) 20.6 21.3 17.0
Average number of dependents 1.19 ー ー
Average annual salary*1 9 million yen ー ー
Utilization of paid leave*2 65.9% ー ー
Turnover rate*3 2.7% 2.6% 3.3%
Returning rate from childcare leave*4 97.1% 100% 96.4%
Retention rate after 3 years from reinstatement (childcare)*5 92.4% 100% 91.2%
Retention rate after 3 years from reinstatement (nursing care)*6 25.0% 50.0% 0.0%
*Number of regular employees (including contracted employees) who began a leave of absence during the relevant fiscal year (April 1, 2017 1 to March 31, 2018).
*Number of employees who used the social service program.
*1 Number of regular employees who began a leave during the relevant fiscal year (from April 1, 2017 to March 31, 2018).
*2 Number of employees taking leave of nursing care leave under the “accumulated paid leave (nursing care for family members),” “nursing care for family members” and “one-day nursing care leave” programs
*3 Number of employees taking childcare leave under the “accumulated paid leave (child healthcare)” and “child medical care” programs
As a program equivalent to childcare leave, special leave (of 5 days at most) is granted for care of the eldest child at the time of birth of the second child.
*4 Volunteer work leave shows the number of employees who took “accumulated paid leave (volunteer activity)” and the number of days spent for such activities. Total number of days is shown in parenthesis.
*5 Including 53 taking a special leave when their wives’ gave birth on and after the second child
FY Item
2013 • Introduction of on-site irregular working hours support system for SEs
2014 • Introduction of new work style (co-working hour system, homeworking system, remote working system for domestic sales)
2015 • Revision of working conditions, work support and employee welfare with consolidation of various programs at Group companies in Japan
2016
• Agreement between labor and management regarding the terms and conditions for applying a program to transfer and a leave of absence due to accompanying a spouse’s transfer
• Revision of systems for childcare and nursing care due to the change of the related laws
• Change of starting point for reckoning on yearly paid vacation according to the systems at the Group companies in Japan
2017 • Labor-management agreement signed on the introduction of the Paid Leave by the Hour System on April 1, 2018 (February 2018)
■Number of employees taking a leave of absence
■Number of employees taking a care leave (number of days)*1
■System for a good work-life balance
■�Revisions to systems that operate based on agreements between the labor unions and the company (in the last five years)
■Composition of the Fuji Xerox workforce
■Recruitment
■Employment of persons with disabilities
■Re-employment
■Work accident rate and work accident severity
As of March 31, 2018
Industry average in parenthesis*3
As of March 31, 2018
All those systems provide for generous leave beyond that required by law.
*1 Accumulated paid leave: A system enabling employees to accumulate unused leave up to 60 days. Accumulated leave may be used for healthcare, childcare, nursing care, and volunteer activities.
*2 Double job program: This is not double duties by order, rather it is program, they are allowed engage in both their current work and work in another division through a system that matches the needs of divisions wanting to utilize senior workers’ skills and experience with the will of senior workers who wish to use their special skills or to take on new challenges.
*Executive officer = All executive officer—Directors
■Status of regular employees As of March 31, 2018
*Data up to March 31, 2018.
*As of March 31, 2018.
Giving birth and childcare Nursing care Other
• Maternity leave (paid) • Leave of absence for childcare program • Program for rehiring former employees who left the company for reasons such as spouse’s transfer or childcare
• Accumulated paid leave for healthcare of employees’ family*1
• Shortened working hours in pregnant and for childcare (from pregnancy to third grade of elementary school)
• Limited off-hours work for childcare (until sixth grade of elementary school)
• Limited late-night work for childcare (until six grade of elementary school)
• Special leave for supporting the wife during her childbirth period (first child’s birth: 2 days; second child’s birth and thereafter: 5 days)
• Leave of absence for birth support (one year leave system for fertility treatment)
• Leave of absence for caring for a family member (maximum 2 years)
• Limited off-hours work for caring for a family member
• Limited late-night work for caring for a family member
• One-day nursing care leave
• Accumulated paid leave*1 for caring for a family member
• Flextime • Homeworking system • Continuous service award special vacation; “refresh vacation”
• Social service system (leave of absence program for employees participating in socially beneficial activities)
• Accumulated paid leave*1 for volunteer activities
• Leave of absence for education • Leave of absence for senior theme (support for senior employees’ second career)
• Flexible work schedules (support for senior employees’ second career)
• Double job program*2 (support for senior employees’ second career)
• A program for transfer and a leave of absence due to accompanying a spouse’s transfer
Union members Proportion of union membership
Average age of union members
5,822 70.8% 43.2
■Composition of labor union membership As of March 31, 2018
*Based on the number of full-time worker excluding executive directors (8,227)*Including managerial staff
Number of total hours
Number of hours per each
employee
Number of total cost
Number of cost per each
employee
Capacity building (HRD)
95.623 thousand
hours10.9 hours 268,044,185
yen 30,676 yen
■Capacity building
*Including executive officers and employees on temporary assignment
As of March 31, 2018
9,928
■Number of employees taking occupational health and safety training
Total Male Female
New graduate recruitment*1
Technical positions
10239 16
Administrative positions 23 24
Mid-career recruitment*2 31 23 8
*1 Number of new graduates recruited for the fiscal year is confirmed at the beginning of April, 2018.
*2 Number of mid-career recruitment represents those from April 2017 to March 2018.
■Number of fatal work accidents
■Occupational Health and Safety CommitteeThe Occupational Health and Safety Committee convenes with same number of labor and management representatives, in compliance with laws and regulations.
Data and Information
Training and Education of Human ResourcesHuman resources empowered to rise to challenges of
growth and change and able to think and act on their own
Real Change Leader
Long term
Short term
Personal growth
Personnel systemthat encourages rising
to challenges
Management andleadership
Employees Management
Reinforcement ofcorporate strength
■Fuji Xerox’s human resources development
*1 Average annual salary is calculated for the period from January 1, 2017 to December 31, 2017.
*2 Data on utilization of paid leave is calculated based on data for the period from January 1, 2017 to December 31, 2017.
*3 Turnover rate =Attrition + Retirement + New start for senior employees program
Number of employees in Fuji Xerox at the end of preceding fiscal year (non-consolidated) + number of assigned employees
Calculation methods for turnover rate by gender
Male turnover rate = Male turnoverNumber of male employees
Female turnover rate = Female turnoverNumber of female employees
*4 Returning rate from childcare leave is calculated with the expiration date falls on April 1, 2017 to March 31, 2018.
*5 Retention rate after 3 years from reinstatement
=
Number of employees as of the end of the current fiscal year among those returning to work after childcare leave in the second preceding fiscal year
Number of employees reinstated after childcare leave in the second preceding fiscal year
*6 Using the same methods as *5
*1 Work accident rate = Number of employees involved in work accidents × 1,000,000
Gross number of hours worked
*2 Work accident severity = Number of workdays lost × 1,000Gross number of hours worked
*3 Source for industry average: FY2017 Survey on Industrial Accidents, Ministry of Health, Labour and Welfare
60 61FUJIFILM Holdings Corporation Sustainability Report 2018 FUJIFILM Holdings Corporation Sustainability Report 2018

Compliance and Risk Management
Compliance
Risk Management
Certification Certified affiliates
P-Mark*1 FUJIFILM Medical Co., Ltd.FUJIFILM Imaging Systems Co., Ltd.FUJIFILM Techno Service Co., Ltd.
Fuji Xerox System Service Co., Ltd.FUJIFILM Imaging Protec Co., Ltd.FUJIFILM Media Crest Co., Ltd.
ISMS*2 FUJIFILM Global Graphic Systems Co., Ltd.FUJIFILM Software Co., Ltd.FUJIFILM Imaging Systems Co., Ltd.FUJIFILM Imaging Protec Co., Ltd.FUJIFILM Business Expert CorporationFUJIFILM Recording Media Products DivisionFUJIFILM Medical Co., Ltd.Fuji Xerox Co., Ltd.Fuji Xerox domestic sales companies (37 companies)Fuji Xerox Information Systems Co., Ltd.Fuji Xerox System Service Co., Ltd.
Fuji Xerox Learning Institute Inc.Fuji Xerox Printing Systems Co., Ltd.Fuji Xerox InterField Co., Ltd.Fuji Xerox Advanced Technology Co., Ltd.Fuji Xerox Manufacturing Co., Ltd.Fuji Xerox Service Creative Co., Ltd.Fuji Xerox Service Link Co., Ltd.Fuji Xerox overseas manufacturing companies (4 companies)Fuji Xerox Asia Pacific Pte LtdFuji Xerox overseas sales companies (16 companies)
Intended audience Details FY2017 results
Executive officers, managers of divisions, presidents of domestic affiliates Compliance Training based on the case at Fuji Xerox New Zealand (FXNZ) 95 participants
Executive officers (Fujifilm and its affiliates) Overall compliance 54 participants
New executive officers Overall compliance 26 participants
New managerial personnel Overall compliance 2 times, 170 participants
All employees (including agency contracted employees)
Head of each organization explained the lessons of FXNZ business and future measures
108 organizations, 20,863 participants
New employees Basic knowledge of compliance, employee code of conduct, corporate rule, consulting office, etc. Once, 228 participants
■Compliance education (Fujifilm in Japan)
Intended audience Details FY2017 results
Executive officers, managers of divisions, presidents of domestic affiliates Compliance training based on the case at Fuji Xerox New Zealand (FXNZ) 124 participants
Managerial staffLabor management training
(Web-based training to learn importance of labor management as fundamental management skill)
Once, 4,276 participants
All executive officers and employeesTraining on general legal knowledge (Web-based training for fraud/harassment as well as basic legal knowledge)
Once, 23,568 participants
All employees (including contract/temporary employees)
Risk Management Training (Web-based training on risk management including information security)
Once, 29,994 participants
Head of each organization explained the lessons of FXNZ business and future measures
102 organizations, 28,640 participants
New executive officersNew executive officer training (Group training on general risk management for executives including directors’ management duties and responsibilities, corporate laws, and risk concerning general affairs, human resources, etc.)
Once, 22 participants
New managerial staffNew managerial staff training (Group training such as lectures about disciplinary action and group discussions using examples to obtain general compliance knowledge that managerial staff should know)
5 times, 324 participants
New employeesNew employee training (Group training for legal compliance that maintain the Basic Corporate Quality by understanding the basic CSR policies and activities)
Once, 409 participants
■Compliance education (Fuji Xerox in Japan)
■Acquisition of P-Mark and ISMS
*1 Privacy Mark (P-Mark): A mark granted by the Japan Information Processing Development Corporation (JIPDEC) to companies in which personal information is handled appropriately.
*2 ISMS: Certification regarding the overall management framework for information including personal information (Information Security Management System).
*3 For the certified companies of Fuji Xerox Group, please visit: http://www.fujifilmholdings.com/en/sustainability/data/compliance/index.html
Environmental Aspects
Priority Targets
■Fujifilm FY2018 Priority Issues
Priority Issues Strategies
1. Address climate change
1) Continually promote CO2 emission reduction at each of the stages of product lifecycle. (Procurement, manufacturing, transportation, use, disposal)
2) Promote a group-wide energy strategy and activities.3) Explore and seize opportunities for using renewable energies, and set targets for adopting such opportunities.4) Develop and proliferate products and services that will contribute to CO2 emission reduction in society.5) Quantify, evaluate and disclose the level of CO2 emission reduction contributions made by our products and
services.
2. Promote recycling of resources
1) Promote efficient use of water resources.2) Develop and proliferate products and services that will contribute to the conservation of water resources in society.3) Quantify, evaluate and disclose the level of water resource conservation contributions made by our products and
services.4) Use resource efficiently by promoting the 3Rs (Reduce-Reuse-Recycle) and improve the amount of resource use
per unit of production.5) Reduce waste and promote the concept of Zero Waste Disposal.
3. Address energy issues toward a non-carbon society 1) Develop technologies that will contribute to conserving, storing and creating energy.
4. Ensure product and chemical safety
1) Evaluate and improve the administration of internal regulations concerning product safety and chemical management.
2) Continue dissemination of approaches and systems to the supply chain concerning management of chemicals in products.
3) Communicate and assess product safety information thoroughly and laterally apply safety measures across all sites.4) Continue to improve the systems for ensuring product compliance.5) Contribute to chemical safety through the use of chemical library and safety evaluation.
5. Strengthen CSR foundations across the entire supply chain
1) Ask suppliers to engage in business activities with consideration for the environment, ethics and human rights, and carry out activities for investigating and improving their implementation status.
6. Environment and safety risk management
1) Maintain systems that abide by laws and regulations and adheres to voluntary management targets.2) Improve and promote industrial safety and health.3) Ensure safety management based on the risk assessment of chemicals.4) Continue to control the level of VOC emissions generated from the production process.
7. Information disclosure and communication of relevant information
1) Enhance information disclosure through various methods. (e.g., Corporate Reports, websites)2) Enhancement of the disclosure of environmental performance information.
8. Employee education 1) Educate employees in the areas of product safety, occupational safety and environmental law regulation.
As of July, 2017
Priority Issues Strategies
1. Curbing global warming*Greenhouse gas reduction target by 2030By FY2030, 30% reduct ion in CO2 emissions throughout the company’s overall lifecycle stage from the level in FY2013
1) Contribute to help reduce CO2 emissions from customers’ office and factory by providing energy saving products, service and & solutions
2) Reduce CO2 emissions by installing new energy-efficient equipment and improving productivity in production process at the development and production sites
3) Reduce CO2 emissions in office by reforming employees’ work style4) Reduce CO2 emissions by improving efficiency in the product logistics
2. Preservation of natural resources
1) Establish next generation eco-friendly technologies2) Reduce resource input with lighter equipment3) Reduce the use of new resources by recycling used parts4) Reduce waste output and promote recovery of valuable substances at production and product development sites5) Reduce water usage in production and product development sites
3. Reduction in environmental risk from chemical substances
1) Reinforce measures against laws and regulations to reduce chemical substance risks from products (observing RoHS, REACH, etc.)
2) Expand and strengthen risk assessment method against laws and regulations3) Implement trainings on environmental conservation, product safety, occupational health and safety, and chemical
substance management4) Promote activities on environmental/occupational health and safety
4. Preservation of ecosystems and biodiversity
1) Promote sustainable paper procurement taking into consideration the forest ecosystems2) Participate in Japan Business Initiative for Biodiversity (JBIB)
5. Improvement of the infrastructure for environment management
1) Stabilize the operation of the systems to grasp environmental performance data2) Reinforce measures to respond proactively to environmental regulations3) Enhance information disclosure through various methods (e.g., websites)
■Fuji Xerox FY2018 Priority Issues
Data and Information
* Organizations covered in the environmental performance data are, as a general rule, those that are shown in the consolidated financial statements, and are significant in terms of environmental burden.
However, certain sales and manufacturing (assembly) subsidiaries are excluded. Those not shown specifically are included in the tabulation figures above. Moreover, figures for the Group total may not reflect the sum of each subtotal.
Low High
Imp
act
Probability of occurrence
Harassment
Employee safety
Legal compliance
Product safety
Information securityEnvironmental pollution
Internal misconduct
Natural disasters
Larg
eS
mal
l
■FY2018 priority risk map for the Fujifilm Group
Risk Item Reason for Selection Countermeasures
Natural disasters
Continued designation as a major risk in view of the many natural disasters in Japan.
• Reinforcement of damage-mitigating measures for wide-area natural disasters
• Reinforcement of BCP
• Improvement of the whistle-blowing system
• Implement thoroughly various compliance, information security and risk training programs
Internal misconduct
Prioritized as a result of the inappropriate accounting issue.
Information security
Increase in and sophistication of cyberattacks worldwide. Development of global networks increases the possibility of extensive damage in case of a cyberattack.
Legal compliance
Move toward stricter penalties for violations of laws and regulations, such as anti-trust laws and GDPR
Employee safety
Terrorism occurring frequently in various parts of the world, though small in scale.
Product safety
Growing social interest due to frequency of quality control problems at other companies
62 63FUJIFILM Holdings Corporation Sustainability Report 2018 FUJIFILM Holdings Corporation Sustainability Report 2018

Environmental Aspects
■Material flow
* Organizations covered in the environmental performance data are, as a general rule, those that are shown in the consolidated financial statements, and are significant in terms of environmental burden.
However, certain sales and manufacturing (assembly) subsidiaries are excluded. Those not shown specifically are included in the tabulation figures above. Moreover, figures for the Group total may not reflect the sum of each subtotal.
Data and Information
Materialrecycling
Amount ofcyclic water
used*10
58.8 million tons
Wastematerial79.3 kilotons
Atmosphericemissions
CO2*2.....1,133 kilotonsVOC .........0.80 kilotonsSOx............... 18.1 tonsNOx................ 399 tonsSoot .............. 4.24 tons
Dischargedwater
Water*6..........40.2 million tonsBOD*7 .................... 24.5 tonsCOD*7 ..................... 104 tonsTotal nitrogen*7......... 182 tonsTotal phosphorus*7.. 3.86 tonsAtmospheric
emissionsCO2*1 .........1,813 kilotons
Atmosphericemissions
CO2*3 .... 348 kilotons
Atmosphericemissions
CO2*4 .... 557 kilotons
Atmosphericemissions
CO2*5 .... 134 kilotons
Materialrecycling
Aluminum, PET,Silver, TAC
INPUT
RECYCLE
OUTPUT
Resource extracting,transporting, re�ning,
synthesizing, processing,and materials transporting
Procurement
*PET: Polyethylene terephthalate TAC: Triacetylcellulose
Aluminum,aluminum alloy......123 kilotonsSilver .................0.296 kilotonsPaper ..................41.4 kilotons(used for products)PET, TAC, etc.*....188.5 kilotons
Electricity... 1,167 million kWhPurchased energy ...... 202 TJOil*8..........................33.8 MLNatural gas*9
.................... 221 million Nm3
Water ...........44.1 million tons
Light diesel oil, etc*11
.................................135 MLElectricity*12
................. 1,043 million kWh
Combustion amount (estimation)*13....... 35 kilotons(paper/PET/TAC, etc.)
Collecting used products(Multifunction devices /PS plates/CTP plates, etc.)
Electricity used,Oil and gas used,
Water used
R&D/Manufacturing
Light diesel oiland heavy oil used,
Electricity used
Transportation
Electricity used,Water used
Use
Waste combustionrecycling energy
Disposal/Recycling
Direct control over the FujifilmGroup’s environmental burdens
*1 Environmental burdens due to raw materials procurement (CO2 emitted during the process of extracting, transporting, refining, synthesizing, processing, and transporting raw materials) is calculated for the main raw materials procured.
*2 Environmental burdens due to product manufacture is calculated based on the total amount of energy (electricity, petroleum, and gas) consumed in the production process.
*3 For the calculation of environmental burdens due to product transportation, estimates are made based on domestic and overseas transportation methods and distances traveled. The typical amount of CO2 emissions per unit of weight and distance for each method and correction factors such as the yield rate are multiplied by the weight of the raw materials procured.
*4 For copy machines, printers, and fax machines, environmental burdens due to use of products is calculated as energy consumption for a 5-year period for the machines installed this year. For other products, the estimated number of machines in operation is multiplied by typical energy consumption.
*5 Environmental burdens due to product disposal is calculated based on the estimation of stress on the environment caused by the disposal of the raw materials procured.
*6 Wastewater released as a result of business activities*7 Volume released to public water*8 Total of heavy oil A, heavy oil C, kerosene, light diesel oil,
and gasoline (Amounts of the petroleum-based products are summed after appropriated energy conversions, and the total is expressed in terms of the amount of heavy oil A.)
*9 Total of natural gas, liquefied natural gas (LNG), urban gas, butane, and liquefied petroleum gas (LPG) (Amounts of the gases are summed after appropriate energy conversions, and the total is expressed in terms of the amount of urban gas.)
*10 This includes the amount of water used in a cyclic manner.
*11 Calculation assuming transport by truck*12 Based on the average CO2 emission coefficient of the
Federation of Electric Power Companies of Japan*13 Hypothetical combustion rate for each substance
used (For the above, data from the input-output table and other sources are used to obtain CO2 emissions per unit of output.)
Environment Conscious in Logistics
Use of Renewable Energy
■Renewable energy (electric power) consumption
■�Annual changes in total CO2 emissions in domestic logistics*
FY2013 FY2014 FY2015 FY2016 FY2017
Total CO2 emissions 47,075 45,633 50,229 49,761 47,100
*Total CO2 emissions are calculated as the amount of CO2 emitted by FUJIFILM Logistics Co., Ltd. in its logistics activities for the Fujifilm Group companies. Since FY2006, we shifted calculation method to the method based on revised Energy Conservation Law (travel distance of empty cars not included in calculations, etc.).
(tons of CO2/year)
Energy-Saving Measures
■Annual changes in energy consumption*1
0
5,000
10,000
15,000
20,000
25,000(TJ)
2017 (FY)2016201520142013
Overseas, renewable energy*4
Overseas, gas*3
Overseas, heavy oil, etc.*2
Overseas, electric powerJapan, renewable energy*4
Japan, gas*3
Japan, heavy oil, etc.*2
Japan, electric power
6,023
1,299
8,348
4,858
1,791
23,188
1
24
844
6,280
1,466
8,587
4,767
1,787
23,790
6,402
1,940
8,473
5,080
1,756
23,976
6,488
24,454
2,066
8,409
5,584
1,784
6,613
24,834
2,239
8,353
5,606
1,897
7
33
85
6
39
76
1
33
291
1
30
874
*1 Per unit calorific value is based on the Energy Conservation Act.*2 Total of heavy oil A, heavy oil C, kerosene, light oil and gasoline*3 Total of natural gas, liquefied natural gas (LNG), city gas, butane and liquefied petroleum gas
(LPG)*4 FUJIFILM Manufacturing Europe B.V. (EF) classified as renewable energy because the supply
of wind-generated power has been 100% since FY2015.
(thousand kiloliters)■Breakdown of consumption of heavy oil, etc. (FY2017)*
Heavy oil Kerosene Light oil Gasoline
Japan 30.9 1.1 0.1 0.0
Overseas 0.0 0.0 0.6 0.1
Group total 30.9 1.1 0.7 0.1
*Consumption in manufacturing only
Measures for Climate Change
*Calculation method: Calculation of CO2 emission by energy usage specified in the Act on the Rational Use of Energy. Emission coefficient by electric power utility used for purchased power in Japan, and emission coefficient released by IEA for each country used for other countries.
(kt-CO2/year)
CO2 emission
Japan 820
Overseas
Americas (USA, Canada & Brazil) 152
Europe (Netherlands, Germany, Belgium, UK & France) 57
China 81
Asia excl. China & Oceania (Australia, South Korea, Singapore, etc.) 37
Group total 1,146
■�2017 CO2 emission by region* (R&D/Manufacturing/Office)
FY2005 FY2013 FY2014 FY2015 FY2016 FY2017
R&
D/M
anuf
actu
ring/
Offi
ce Japan /Manufacturing 1,102 912 896 869 829 787
Japan /Non-manufacturing 28 30 27 30 33 33
Overseas /Manufacturing 345 350 344 306 274 283
Overseas /Non-manufacturing 30 42 40 37 51 43
Group total 1,505 1,335 1,307 1,242 1,188 1,146
Vehicle 35 30 33 31 23 29
Total 1,540 1,365 1,340 1,273 1,211 1,175
■CO2 emissions*
*Calculation method: Calculation of CO2 emission by energy usage specified in the Act on the Rational Use of Energy. Emission coefficient by electric power utility used for purchased power.
(kt-CO2/year)
0
20,000
40,000
60,000
80,000
100,000
120,000(MWh)
2017 (FY)2016201520142013
101,435101,812
46,675
22,97825,547
FY2013 FY2014 FY2015 FY2016 FY2017
Amount of CO2 reductions (tons of CO2/year) 6,354 11,404 12,692 15,790 13,156
CO2 reduction rate (%) 11.9 20.0 20.2 25.4 21.8
CO2 reduction rate (%) = Amount of CO2 reductionsTotal CO2 emissions + CO2 reductions
*In the FY2017, we enforced our activities for CO2 reductions in collaboration with a specified consigner. Major reduction initiatives, which proved effective, include starting modal shifts (road transport to sea transport) in FY2017, as well as improving carrying efficiency by double stacking during transport and enhancing gasoline mileage by eco-driving. The amount was a total figure of each facility’s CO2 reduction measure.
■�Annual changes in amount of CO2 reductions and reduction rates through transportation efficiency improvements* (Domestic distribution)
■�Annual changes in container and packaging material* used (Fujifilm non-consolidated)
FY2013 FY2014 FY2015 FY2016 FY2017
Total consumption 16.3 15.5 15.2 15.6 14.9
*Total of corrugated paper boxes, paper materials, paper containers, metal materials, plastic molds, plastic film/sheet and glass used.
(thousand tons/year)
FY2013 FY2014 FY2015 FY2016 FY2017
Packaging material reduction rate 15.5 9.3 10.5 12.7 17.5
Packaging material reduction rate (%) = Weight reducedTotal material weight + weight reduced
*Total weight of export packaging materials handled by FUJIFILM Logistics in FY2017 was 1,230,052 tons. Weight was reduced by 261,049 tons, with yearly reduction rate of 17.5%.
■�Annual changes in reduction in export packaging material weight* (Cumulative total) (%)
FY2013 FY2014 FY2015 FY2016 FY2017
Transportation volume 186 181 190 190 168
*Range of transportation volume is calculated within the range of ownership in compliance with reporting under the Act on the Rational Use of Energy.
■Annual changes in domestic transport volume* (million tons/kilometer)
64 65FUJIFILM Holdings Corporation Sustainability Report 2018 FUJIFILM Holdings Corporation Sustainability Report 2018

Environmental Aspects
Reducing Chemical Substances Emissions
■Annual changes in atmospheric emissions of VOCs
FY2013 FY2014 FY2015 FY2016 FY2017
Japan 6.6 6.8 6.5 5.9 6.4
Overseas 1.4 1.6 1.8 1.6 1.6
Group total 8.0 8.4 8.3 7.5 8.8
(hundred tons/year)
■Storage and management of devices/equipment containing PCBs* (FY 2017)
Types of equipment containing PCBs UnitStoring and managing amount
Japan Group total
High voltage transformers Quantity 11 29
High voltage condensers Quantity 6 96
PCB oil waste, etc. kg 1,000 1,000
Sludge, etc. m3 0.0 0.0
Fluorescent lamp stabilizers Quantity 13,562 15,783
Low voltage condenser excluding fluorescent lamps Quantity 116,947 116,947
Low voltage transformer Quantity 0 0
Rags kg 981 981
Other devices Quantity 174 174
■Response to the PRTR Law (Fujifilm and its domestic affiliates)In addition to those substances that must be reported under the PRTR Law (Pollutant Release and Transfer Register Law), Fujifilm controls another 10 items on a voluntary basis, primarily substances specified by the Japan Chemical Industry Association as requiring autonomous monitoring, and has been endeavoring to reduce those emission on consolidated basis. Data (usage volume, atmospheric emissions volume, emission into public water, volume going into sewage water, volume moved outside of facilities, and volume recycled) on substances used in amounts of one ton or more per year by Fujifilm and its domestic affiliates may be found on the following Fujifilm website.
� http://www.fujifilm.co.jp/corporate/environment/preservation/site/atmosphere/prtr.html�(in Japanese only)
�http://www.fujifilm.co.jp/corporate/environment/preservation/site/pcb.html(in Japanese only)
Pollution Prevention Measures
■Annual changes in volume of atmospheric emissions
■Annual changes in water contaminant burden & emissions*1
FY2013 FY2014 FY2015 FY2016 FY2017
SOx emissions
Japan 21 22 9 19 15
Overseas 4 6 10 8 8
Group total 25 28 19 27 23
NOx emissions
Japan 416 394 424 369 288
Overseas 74 61 78 96 119
Group total 490 455 502 465 407
Soot particle emissions
Japan 4.8 4.2 3.1 2.3 2.4
Overseas 6.9 1.0 4.2 4.1 10.3
Group total 11.7 5.2 7.3 6.4 12.7
Atmospheric emissions of specified CFCs*
CFC-11 0.00 0.21 0.21 0.00 0.16
CFC-12 0.00 0.01 0.00 0.00 0.01
FY2013 FY2014 FY2015 FY2016 FY2017
Total amount of COD*2
Japan 85.2 82.3 82.1 69.0 54.5
Overseas 31.3 57.0 67.3 55.5 49.6
Group total 116.5 139.3 149.4 124.5 104.1
Total amount of BOD*3
Japan 43.5 38.5 37.1 30.2 24.3
Overseas 1.6 10.1 16.6 0.5 0.1
Group total 45.1 48.6 53.7 30.7 24.4
Total amount of nitrogen emissions Japan 246.5 223.3 232.3 170.9 181.7
Total amount of phosphorous emissions
Japan 3.4 5.3 4.2 1.4 2.7
*Group total, below the limit of detection = 0
*1 Effluent release into public water bodies*2 COD (Chemical Oxygen Demand): An indicator of water pollution. COD indicates
the amount of oxygen consumed when water-borne pollutants (primarily organic contaminants) are oxidized upon the introduction of an oxidant.
*3 BOD (Biochemical Oxygen Demand): BOD is a way to measure the degree of water pollution, and indicates how much oxygen in the water is being used by organisms to decompose contaminants by looking at the reduction in oxygen in the water.
(tons/year)
(tons/year)
■Surveying and remediating soil and underground water pollution(FUJIFILM Corporation and its domestic affiliates/Fuji Xerox and its domestic affiliates)
The Fujifilm Group autonomously conducts environmental surveys on soil and underground water pollution. Regarding substances that are used at manufacturing facilities and that are subject to environmental limits set by regulations, the Group rigorously manages the usage and storage of such substances and monitors the concentrations of such substances in underground water. We are prepared to deal with any unforeseen pollution incidents in a timely fashion.
�http://www.fujifilm.co.jp/corporate/environment/preservation/site/leakage/(in Japanese only)
�http://www.fujixerox.co.jp/company/csr/stakeholder/environment/target.html(in Japanese only)
Legal Compliance Measures
Japan Overseas Group total
Number of legal violations (number of cases solved) 0 (0) 0 (0) 0 (0)
Number of complaints (number of cases solved) 0 (0) 0 (0) 0 (0)
Number of incidents (number of cases solved) 0 (0) 0 (0) 0 (0)
*Excludes PCB in low concentration
■Reductions in VOCs atmospheric emissions* (Fujifilm non-consolidated)
Category Name of substance Reduction (tons)
Reduction rate in comparison to previous fiscal year (%)
Substances requiring reporting under the PRTR Law
Dichloromethane 3 6
Substances voluntarily controlled by the company
Methyl alcohol 34 20
Ethyl acetate −22 −24
Methyl ethyl ketone −5 −14
Acetone 15 77
*Reduction in volumes in FY2017 compared with actual levels in previous year
■Legal compliance and reports on complaints in FY2017
In 2017, there were no violations of environment-related laws and no customer complaints, and no incidents.
* Organizations covered in the environmental performance data are, as a general rule, those that are shown in the consolidated financial statements, and are significant in terms of environmental burden.
However, certain sales and manufacturing (assembly) subsidiaries are excluded. Those not shown specifically are included in the tabulation figures above. Moreover, figures for the Group total may not reflect the sum of each subtotal.
Data and Information
Conserving Resources Measures
■Annual changes in valuable resources*
FY2013 FY2014 FY2015 FY2016 FY2017
Japan 34.0 34.0 34.1 30.3 26.9
Overseas 27.2 30.1 24.5 42.1 30.5
Group total 61.2 64.1 58.6 72.4 57.4
*Valuable resources sold to the third party.
(thousand tons/year) ■Main recycling methods for waste products
Waste product Recycling method
Plastics (sorted) Pallets, pipes, clothing, heat insulation materials
Plastics (mixed)/Filters Blast furnace fuel
Magnetic tape Blast furnace fuel, tatami mat material, heat insulation materials
Aluminum hydroxide Aluminum sulfate
Inorganic sludge, polishing agent Cement, roadway material, construction materials
Organic solvent Paint thinnerAcids and alkalines Neutralizer
Mixed flammable waste products Solid fuels, electricity and hot water production
Fluorescent lamp Glass woolBatteries Zinc, smelt ironLeft over food, raw garbage, organic sludge Fertilizer, animal feed
Documents, empty boxes Recycled paperIron, aluminum, copper, etc. Smelt metal
Activities on Biodiversity Conservation
Response to Water Risks
Factories
Products
Socialcontribution
Communication
Bio
div
ersi
ty c
on
serv
atio
n
○: Measure related to biodiversity conservation (on going) ◎: Measure related to biodiversity conservation (middle target: plan) ●: Measure indirectly related to biodiversity conservation
●Min
imiz
e im
pact
in m
anuf
actu
re [D
efen
se]
●Con
tribu
tion
to m
aint
ain/
reco
ver o
n bi
odiv
ersi
ty [O
ffenc
e]
Enlightenment for FF/region
Contribution by fund/goods/labor
Products for biodiversity conservation
Minimum inmarket
Conservation of resources
Conservation in region
Minimum impact
◎Domestic education program within the Fujifilm Group ○Communication meeting with region
○Contribution through fund (Fujifilm Green Fund) ○Cooperation with region or NPOs and NGOs○Support for environment education projects for the next generation
Direct contribution (monitor etc.)
Biodiversity in procurement
● Indirect contribution via CO2 reduction (Solar cell etc.)
●Energy saving products ◎Resource saving / product recycling
○Cultivation ○Springs ○Rice field (biotope), (Greening)
○CSR procurement (BD included) ○ABS (Access and Benefit Sharing) ○Paper Procurement
Grasp/measure for impact●Chemicals cont. ◎Waste water cont. ●Air pollution ●CO2 emissions ○Wastes ◎Land use
■Activities on biodiversity conservation —Outline—
–500 m3
500–1,000 m3
1,000–1,700 m3
1,700–4,000 m3
4,000–10,000 m3
Scarcity
Stress
Sufficient quantities
10,000 m3–
Annual water availability per capita for 2025
( shows size of water usage)
Japan
Water Stress Map: Mapping Fujifilm Group’s water usage into 2025 Water Stress Map (UNEP)
Fujifilm
Fuji Xerox
China/Asia
EuropeNorth America
South Carolina
The NetherlandsUK
Suzhou Province Shanghai
Hebei Province 87%
3%
5% 5%
■2025 water stress map and 2017 Fujifilm Group’s water usage
66 67FUJIFILM Holdings Corporation Sustainability Report 2018 FUJIFILM Holdings Corporation Sustainability Report 2018

Data and Information
Domestic and International Appraisals
■Ranking and status of SRI audit
FUJIFILM Holdings has received the following evaluations by external organizations as a corporate group that proactively promotes CSR actions toward sustainable development. It is included in the Socially Responsible Investment (SRI) index listed right. Also listed below are evaluations of FUJIFILM Holdings in domestic and international ranking surveys. (As of September 2018)
Sustainability Accounting (Labor Environment and Social Benefit Accounting, Environmental Accounting)
Labor Environment and Social Benefit Accounting
Environmental Accounting
■Breakdown of labor environment and social benefit accounting ■Volunteer activities during working hours
*Volunteer activities Calculated based on the hours spent on volunteer activities, such as area clean-up, working hours, the salary equivalent to that of those hours, and cost of the activities.
(million yen)
Stakeholder GoalCost totals
FY2016 FY2017
Employees
Work health and safety 1,694 1,698
Personnel training 3,037 2,848
Protect diversity 705 870
Develop a workplace in which employees can work comfortably 1,119 1,135
Customers Ensure appropriate customer response and safety 266 232
Future generations Education for future generations 80 74
Communities (local society and government)
Harmony with the local community 221 105
Promote culture and the arts in society (in Japan) 985 895
International community
Consideration for the international community and international cultures 134 2
NGOs and NPOs Cooperation with NGOs and NPOs 62 76
Suppliers Consideration for products 59 52
Total 8,363 7,986
FY2015 FY2016 FY2017
Hours spent on volunteer activities 1,505 1,117 1,436
Volunteering cost 4 million yen 6 million yen 8.65 million yen
(million yen)■Environmental accounting
■Customer benefits
Environmental conservation costs Environmental conservation benefits
Capital investment Expenses Economic impact inside the Group Economic impact outside the Group
FY2016 FY2017 FY2016 FY2017 FY2016 FY2017 FY2016 FY2017
1. Costs incurred within the business site 1,899 1,086 5,429 5,762
(1) Environmental damage prevention 291 376 1,430 1,411
Reduced pollution levy 0 5Reduction in SOx emissions*1 0 0
Reduction in volume of SOx emissions −11 tons 4 tons
Reduction in volume of NOx emissions 55 tons 81 tons
Reduction in VOC emissions*2 25 −32
Reduction in volume of VOC 70 tons −92 tons
(2) Global environmental protection 1,589 709 2,294 2,192 Energy conservation 4,009 485Reduction in CO2 emissions*3 35 16
Reduction in volume of CO2 emissions 57 kilotons
11 kilotons
(3) Resource recycling 19 2 1,704 2,159
Reduced raw materials and resources used 5,662 6,261Reduced waste materials through reuse and recycling*4 15,219 14,450Reduced water resource consumption*5 890 331
Recovery and recycling
Silver 619 1,622Reduced volume*6 152.2
kilotons144.5
kilotonsPolymeric materials 296 318
Aluminum materials 113 150Reuse of aluminum materialsReduced volume of CO2 emissions
15 37
Others 1,568 182 20 kilotons
20 kilotons
2. Upstream/downstream costs Recovery from the market 0 9 6,555 7,002 Parts recovered from used equipment 7,273 8,036
3. Cost of management activities 23 47 11,375 10,736
4. Research and development costs 657 1,369 10,534 9,533 Customer benefits are shown in the table on below. 107,591 119,754
5. Costs for social programs 0 0 217 115
6. Costs for handling environmental damage Pollution levies 2 3 32 28
Total 2,581 2,513 34,143 33,176 20,430 17,391 122,885 134,225
*1 SOx emissions reductions: ¥6.4/ton Bidding price of SOx emissions credits offered by the United States Environmental Protection Agency in March 2018 (US$0.06/ton).
*2 VOC emissions reductions: ¥350,000/ton From the “Economics Evaluation Report on Countermeasures for Harmful Atmospheric Pollutants” issued by Japan Environmental Management Association for Industry, February 2004.
*3 CO2 emissions reductions: ¥1,510.4/tons Trading price of EU emissions credit 2018 futures (€11.54/ton) at the end of March 2018.
*4 Landfill costs for the waste product (¥100/kg).*5 Water resource consumption reduction: ¥200/ton for clean water supply, ¥200/ton for sewage water times the reductions amount.*6 Volume of recycle and valuable resources in generated industrial waste
<Period of coverage>FY2017 (April 1, 2017 to March 31, 2018)
<Scope of labor environment and social benefit accounting>69 domestic companies in the Fujifilm Group (FUJIFILM Holdings, Fujifilm and 20 Fujifilm affiliates, Fuji Xerox and 46 Fuji Xerox affiliates)
<Basic items>●Objectives of labor environment and social benefit accountingThese accounts are prepared to allow the Fujifilm Group to keep up with its activities for improving the working environment of its employees and the amounts spent for social contributions by preparing data on these activities from an economic perspective.
●Accounting methodThe expenditures (including investments) for the year have been added up to arrive at the figures shown. These figures do not include depreciation.Figures for personnel training and social contributions may overlap with figures in the Environmental Account as well.
* Values presented are rounded and the sums of the items do not always make up the totals.
<Basic items>l Objectives of environmental accounting1. To provide accurate quantitative information on volumes and economic effects to
interested parties inside and outside the Group2. To provide numerical environment-related information useful for decision making by
management and supervisors at the working level
l Accounting methodBased on the “Environmental Accounting Guidelines (2005 edition)” published by the Ministry of the Environment in Japan.1. Depreciation is calculated in principle according to the straight-line method over a three-
year period.2. When costs include expenditures for both environmental and non-environmental
purposes, the portion relating to non-environmental purposes has been excluded.3. Economic impact within the Group: The difference in value terms from the previous year
in fines for polluting and usage of energy, raw materials, water, and other resources is accounted for, as well as the real impact of recovery, recycling, and other measures in value terms for the year in question.
4. Economic impact outside the Group: The difference in value terms from the previous fiscal year has been shown for SOx, VOCs, and CO2. For recycling, the anticipated benefit in value terms has been shown for the year in question.
ProductAmount
FY 2015 FY 2016 FY 2017
1. High-density magnetic memory materials 5,086 7,196 7,165
2. Pre-sensitized aluminum plate not using plate-making film 75,384 66,267 83,506
3. Film for LCDs: WV films 5,081 5,527 4,120
4. Digital color multifunction device and printers 26,482 28,601 24,962
Total 112,033 107,591 119,754
(million yen)
Survey Evaluation for FUJIFILM Holdings
12th CSR Corporate Ranking(2018, Toyo Keizai, Inc.)
6th out of 1,413 companies (558.3 points)
21st Nikkei Environmental Management Survey (sponsored by Nikkei Inc.)
18th out of 395 manufacturers; 1st in the petrochemical field for the
11th consecutive year
10th JUSE Quality Management Level Research (Union of Japanese Scientists and Engineers)
8th out of 206 companies;1st in the machinery and precision
equipment field
CDP (Carbon Disclosure Project) Climate Change A-Water A List
●�FTSE4Good Global Index
●�FTSE Blossom Japan Index
●�MSCI Japan Empowering Women (WIN) Select Index
●�Competitive IT Strategy Company 2018
●�Health and Productivity 2018
Recipient Name and description of the award Awarding entity
FUJIFILM Holdings Corporation 2018 Certified Health and Productivity Management Organization Recognition Program (Large Enterprise Category)—White 500
Ministry of Economy, Trade and Industry/Nippon Kenko Kaigi
FUJIFILM Holdings Corporation The Excellence Prize, Environmental Report Section of the 21th Environmental Communication Awards Ministry of the Environment/Global Environmental Forum
FUJIFILM Holdings Corporation 2017 Internet IR Awards Grand Prize Daiwa Investor Relations Co., Ltd.
FUJIFILM Corporation/ Fuji Xerox Co., Ltd. Good Design Award 2017 Japan Institute of Design Promotion
FUJIFILM Corporation/ Fuji Xerox Co., Ltd. iF design award 2018 iF International Forum Design GmbH
FUJIFILM Corporation red dot design award 2018 Design Zentrum Nordrhein Westfalen
FUJIFILM Corporation “Showcasing the world’s 100 most innovative organizations” in the Top 100 Global Innovators 2017 Clarivate Analytics
FUJIFILM Corporation Camera Grand Prix 2018 Editors Award (FUJIFILM GFX 50S) Camera Journal Press Club
FUJIFILM Corporation EISA Award European Consumer Compact System Camera 2017-2018 (FUJIFILM X-T20) Expert Imaging and Sound Association (EISA)
FUJIFILM Corporation 2017 Emmy Award (FUJINON 4K Cine Zoom Lenses) Academy of Television Arts & Sciences
FUJIFILM Corporation Huali Best Supplier Award Shanghai Huali Microelectronics Corporation (HLMC)
FUJIFILM Electronic Materials Co., Ltd. Excellent Performance Award Taiwan Semiconductor Manufacturing Company Limited
FUJIFILM Electronic Materials Co., Ltd. Preferred Quality Supplier Award Intel Corporation
FUJIFILM Kyushu Co., Ltd. 26th Kumamoto Environmental Award “Kumamoto Water Country” Kumamoto Prefecture
FUJIFILM Kyushu Co., Ltd. “Japan Greenery Research and Development Center Chairman Award” at the 36th National Green Factory Promotion Competition Japan Greenery Research and Development Center
Fuji Xerox Co., Ltd.Minister Prize of Economic, Trade and Industry of the Energy Conservation Grand Prize 2017 “The Next Generation Managed Print Services that utilizes the energy-saving reconditioned device”
Energy Conservation Center
Fuji Xerox Co., Ltd. Award Granted by the Commissioner for Cultural Affairs, Japan Mécénat Awards 2017/Cultural Inheritance Activities Association for Corporate Support of the Arts
Fuji Xerox Co., Ltd.The Environment Minister Prize of the 16th Green and Sustainable Chemistry Award “Development of innovative toner technology realizing low environmental impact and high image quality”
Japan Association for Chemical Innovation
Fuji Xerox Co., Ltd. American Supplier Institute Inc. Award of RQES 2017/ Development of Blade Cleaning System Based on Functional Evaluation Using Simulation Robust Quality Engineering Society
Fuji Xerox Co., Ltd. 18th Green Purchasing Award/Contribution to expand the green purchasing market through responsible paper procurement Green Purchasing Network
Fuji Xerox Tokyo Co., Ltd. 2017 Excellence Prize of the Minister of Health, Labour and Welfare’s awards for enterprises that promote telework (Shiny Telework Prize) Ministry of Health, Labour and Welfare
Toyama Chemical Co., Ltd. 2018 Prizes for Science and Technology, Development Category (Anti-influenza virus drug “AVIGAN®”)
Ministry of Education, Culture, Sports, Science and Technology
Toyama Chemical Co., Ltd. 2018 The Prize for Creativity (Foreign subjects removal device) Ministry of Education, Culture, Sports, Science and Technology
FUJIFILM Electronic Materials (Suzhou) Co., Ltd. Excellent supplier Intel Corporation
FUJIFILM Finechemicals (Wuxi) Co., Ltd. Green Enterprise Certificate Wuxi City, China
FUJIFILM Manufacturing U.S.A., Inc. Gold Award in 2017 (Compliance with the Industrial Pretreatment Program) Greenwood Metropolitan District (GMD)
FUJIFILM North America Corporation 2017 Pretreatment Excellence Gold Award. Intel Corporation
FUJIFILM Speciality Ink Systems Ltd. The Kent Excellence in Business Awards 2017 “Manufacturer of the Year” KM Media Group and Kent County Council
FUJIFILM Ultra Pure Solutions, Inc. Intel PQS Award Intel Corporation
FUJIFILM Ultra Pure Solutions, Inc. 2017 Preferred Quality Supplier (PQS) Award Intel Corporation
Fuji Xerox (China) Limited Best Practice Awards of Green Supply Chain Shanghai 2017 China-ASEAN Environmental Cooperation Centre, etc.
Fuji Xerox Asia Pacific Pte Ltd Sustainable Business Award (Waste Management and Material Productivity) Global Initiatives
Fuji Xerox Vietnam Company Limited Vietnam Green Label Vietnam Environment Administration
■Appraisals and awards in FY2017 See pages: 16, 25, 35, 41, 46 and 55
68 69FUJIFILM Holdings Corporation Sustainability Report 2018 FUJIFILM Holdings Corporation Sustainability Report 2018