stagflation in new zealand 2008
TRANSCRIPT
8/7/2019 Stagflation in New Zealand 2008
http://slidepdf.com/reader/full/stagflation-in-new-zealand-2008 1/19
Stagflation in New Zealand Economy
Code: 4.703
World Economy
Lecturer: Mr. Gamini Jayasuriya
Due Date: 27th August 2008
Prepared by: Keyur Shukla
Student Id: 20080542
Word Count:
Table of Contents:

8/7/2019 Stagflation in New Zealand 2008
http://slidepdf.com/reader/full/stagflation-in-new-zealand-2008 2/19
1.0Introduction…………………………………………………………………………………......
2.0 Current Situation………………………………………………………………………………..
3.0 Justification – Why Stagflation?..................................................................................................
4.0Options to Recover from Negative Growth……………………………………………………
5.0 Recommendation……………………………………………………………………………….
6.0 Conclusion……………………………………………………………………………………...
8/7/2019 Stagflation in New Zealand 2008
http://slidepdf.com/reader/full/stagflation-in-new-zealand-2008 3/19
1.0 Introduction:
The first quarter of year 2008 was nearly over. On 27 th May 2008, a report was produced as a
headline in New Zealand Herald’s Business Page. It was the report of NZIER (New Zealand
Institute of Economic Research) stating that, the forecast for the Real Economic Growth for
the New Zealand’s Economy will be 1.9% to March 2009. It means that it will be 1% down
to the current rate of March 2008. They also envisage that it will be a slow increase in the
Real GDP for the next 4 years. High Interest rates, High Petrol & Food prices will be the biggest
factor affecting slowing down of the Economy. According to the figures of NZIER, the Inflation rate
has increased and the GDP has decreased which shows the rise in Labor price, business intent to raise
prices and Capacity Utilization. http://www.nzherald.co.nz/section/3/story.cfm?
c_id=3&objectid=10512692

8/7/2019 Stagflation in New Zealand 2008
http://slidepdf.com/reader/full/stagflation-in-new-zealand-2008 4/19
With the publication of this report in the Newspaper the Economists and the business leaders
of the New Zealand start thinking on the Current situation. They started publishing their
article and study the Circular flow Model of the New Zealand’s Economy. Another report
was published on 5th June 2008 in New Zealand Herald where there was a statement of the
Reserve Bank, “It expects the annual Inflation rate to leap up to 4.7 % in later of this year
which was the highest level in last 18 years.” Than comes Dr. Bollard the Governor’s turn he
said that the Bank would cut OCR later this year in spite of the Inflation. He painted the
depressing picture of the Economy. He later on in his speech confirmed that the New Zealand
Economy is heading towards the nightmare of the 70’s that is STAGFLATION.
http://www.nzherald.co.nz/section/3/story.cfm?c_id=3&objectid=10514501
2.0 Current Situation:
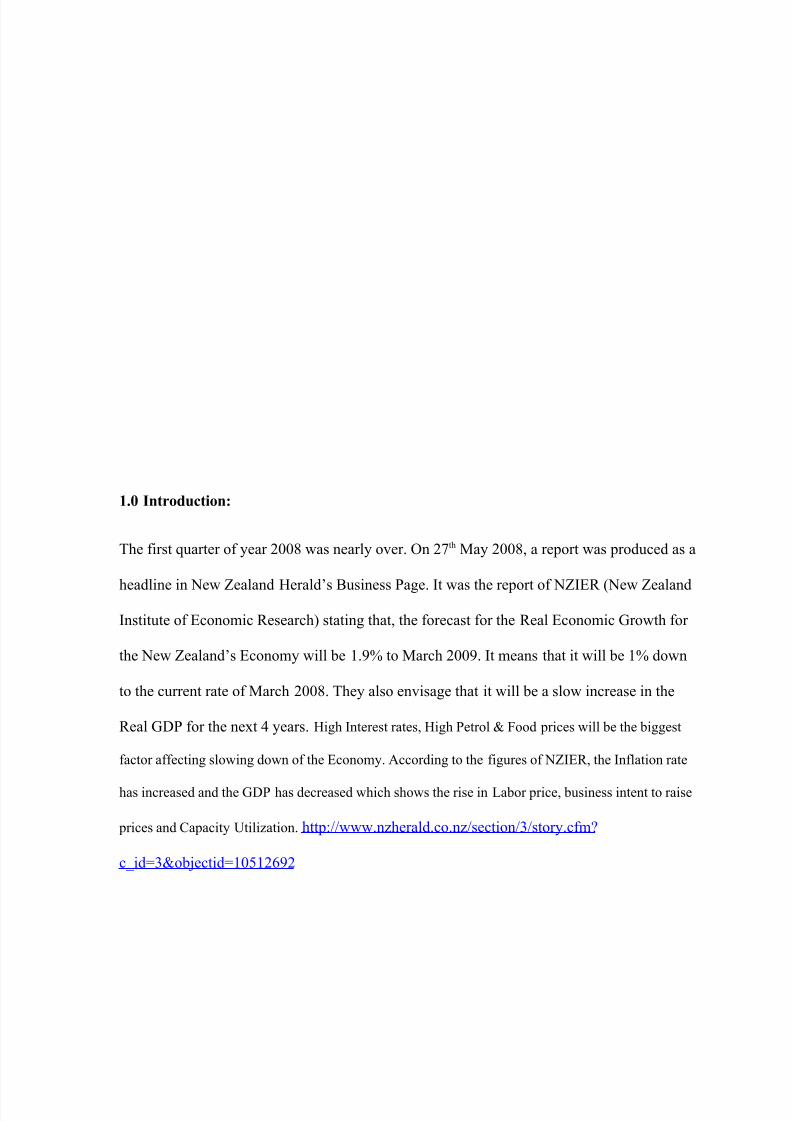
According to the International comparison of the developed Economic Countries of the
World, the OCR of the RBNZ was floating high as on 5th June 2008 as shown in the below
mentioned figure,
8/7/2019 Stagflation in New Zealand 2008
http://slidepdf.com/reader/full/stagflation-in-new-zealand-2008 5/19
He added that the house prices would be expected to cut to 13%. He further comments that
the New Zealand Dollar will fall faster than assumed. He calls for control in pay expectation
and demands. http://www.nzherald.co.nz/section/3/story.cfm?c_id=3&objectid=10514501
According to 8th out of the 12 economist confirmed this negative economic growth.
According to the report published on the 14th July 2008, the consumer price index roused by
1.4% in the first quarter and the annual Inflation rate was 3.8% which was at the fastest pace
in 2 years. These were the findings of the group of 12 economists of Bloomberg. One of the
Economists named Craig Ebert quotes that, at the end of the year Inflation may touch to 5%
the highest since 1990’s. As New Zealand Institute’s assessment details assumed, 47% of the
firms wants to increase their prices in the upcoming three months.
http://www.bloomberg.com/apps/news?pid=20601081&refer=&sid=aUlqDhMNT17s
So, with all these views of Economists and the statement of the Reserve Bank of New
Zealand’s Governor Mr. Bollard, we can confirm that the situation is of STAGFLATION.
8/7/2019 Stagflation in New Zealand 2008
http://slidepdf.com/reader/full/stagflation-in-new-zealand-2008 6/19
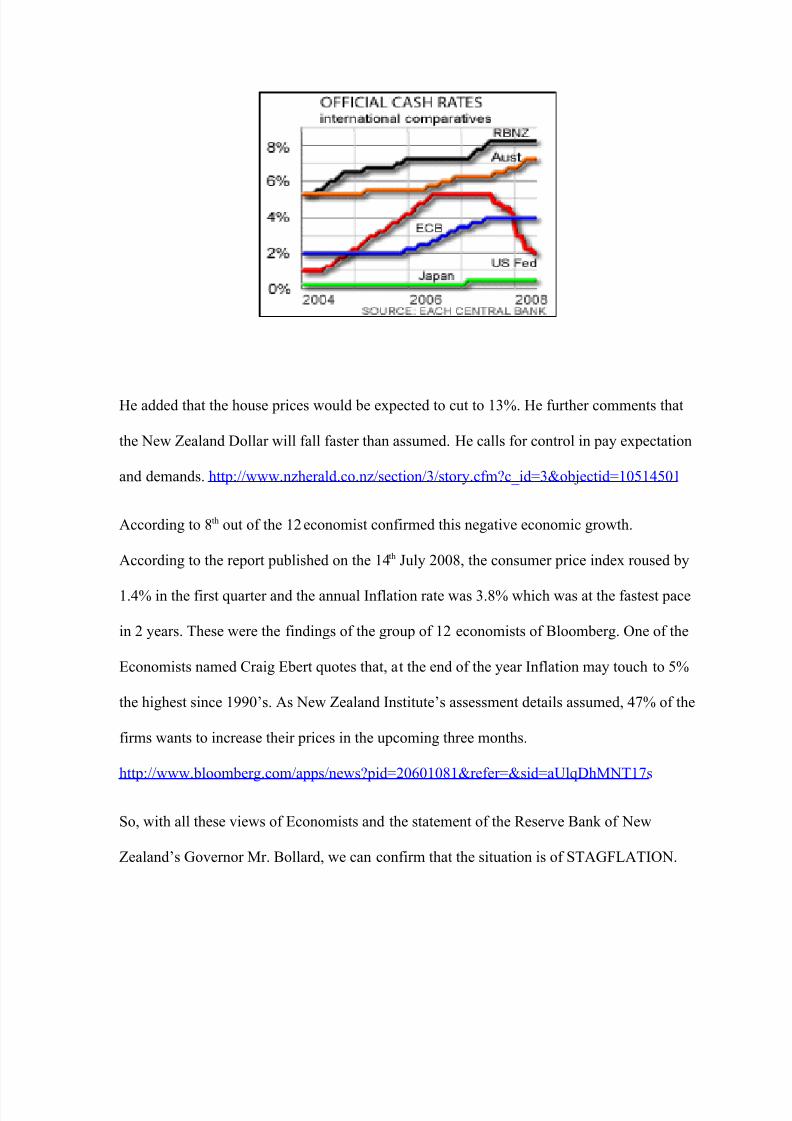
At the end of March 2008, in the report of NZIER, they showed the threat of High Inflation
with headline Inflation to reach 3.9%
Consumer price Inflation is projected to peak at 4.3% in September 2008 and recover back
till March 2010.
http://www.nzier.org.nz/Site/Publications/Consensus_forecasts.aspx
8/7/2019 Stagflation in New Zealand 2008
http://slidepdf.com/reader/full/stagflation-in-new-zealand-2008 7/19
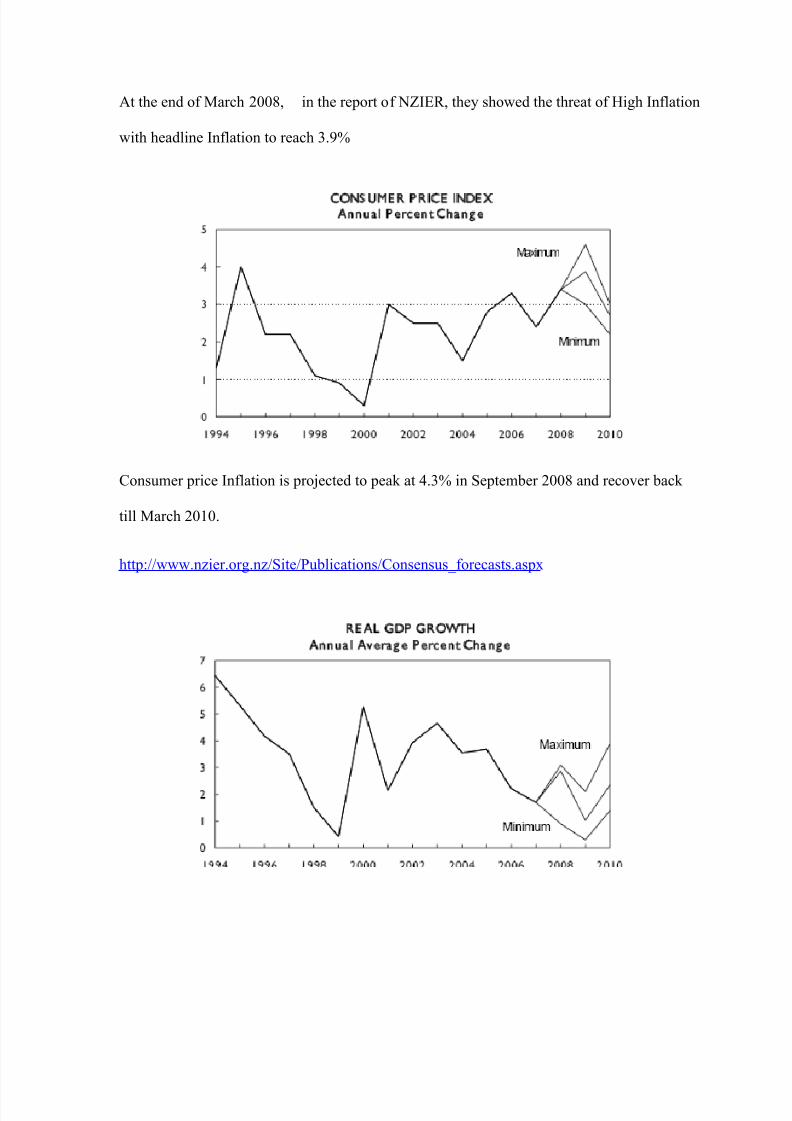
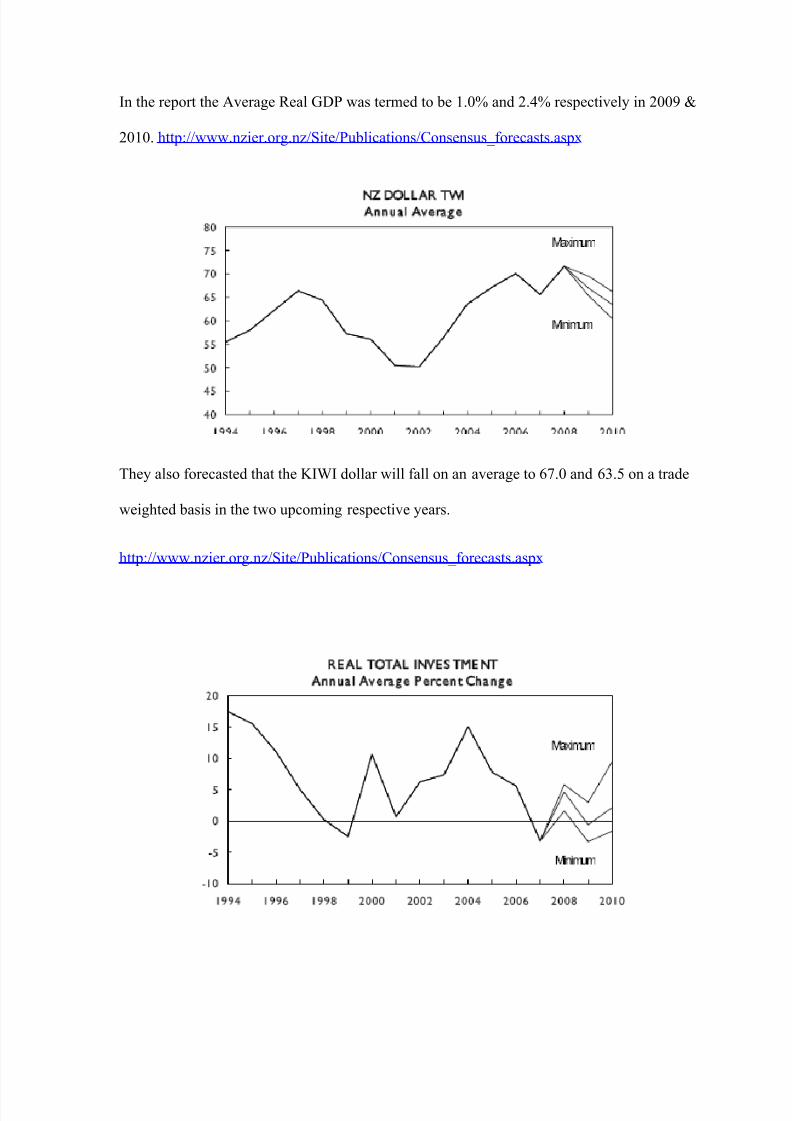
In the report the Average Real GDP was termed to be 1.0% and 2.4% respectively in 2009 &
2010. http://www.nzier.org.nz/Site/Publications/Consensus_forecasts.aspx
They also forecasted that the KIWI dollar will fall on an average to 67.0 and 63.5 on a trade
weighted basis in the two upcoming respective years.
http://www.nzier.org.nz/Site/Publications/Consensus_forecasts.aspx
8/7/2019 Stagflation in New Zealand 2008
http://slidepdf.com/reader/full/stagflation-in-new-zealand-2008 8/19
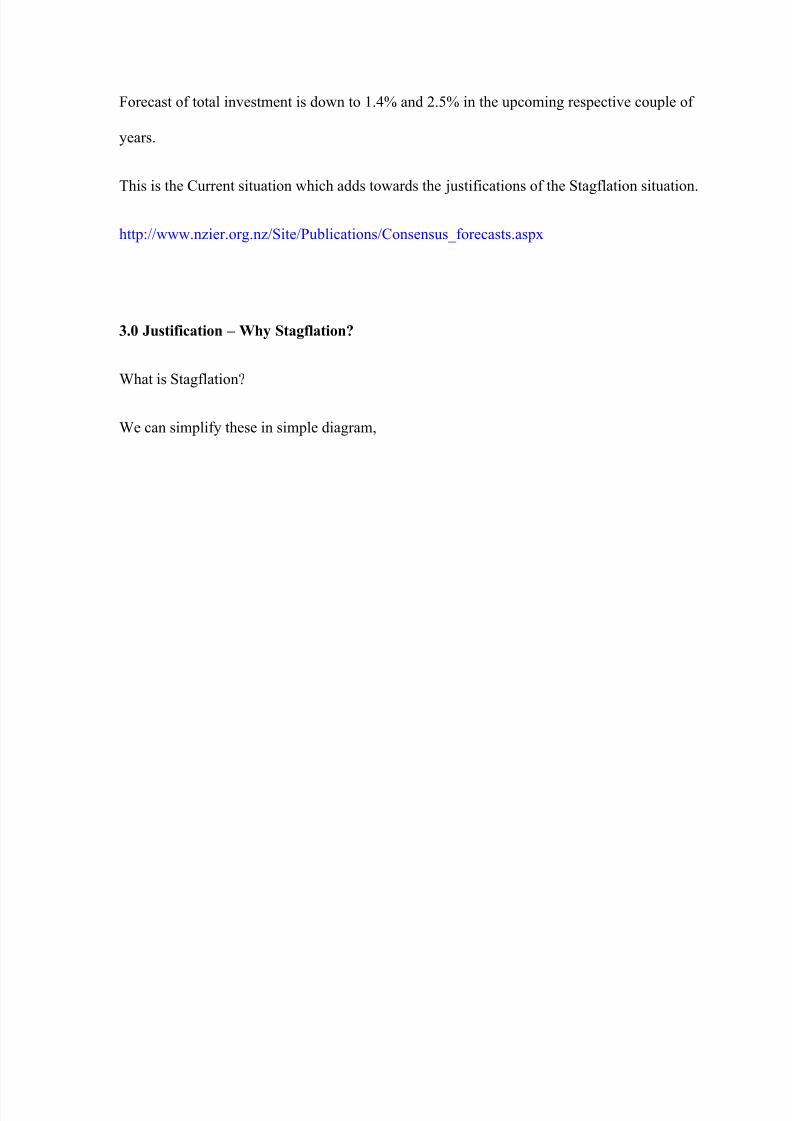
Forecast of total investment is down to 1.4% and 2.5% in the upcoming respective couple of
years.
This is the Current situation which adds towards the justifications of the Stagflation situation.
http://www.nzier.org.nz/Site/Publications/Consensus_forecasts.aspx
3.0 Justification – Why Stagflation?
What is Stagflation?
We can simplify these in simple diagram,
8/7/2019 Stagflation in New Zealand 2008
http://slidepdf.com/reader/full/stagflation-in-new-zealand-2008 9/19
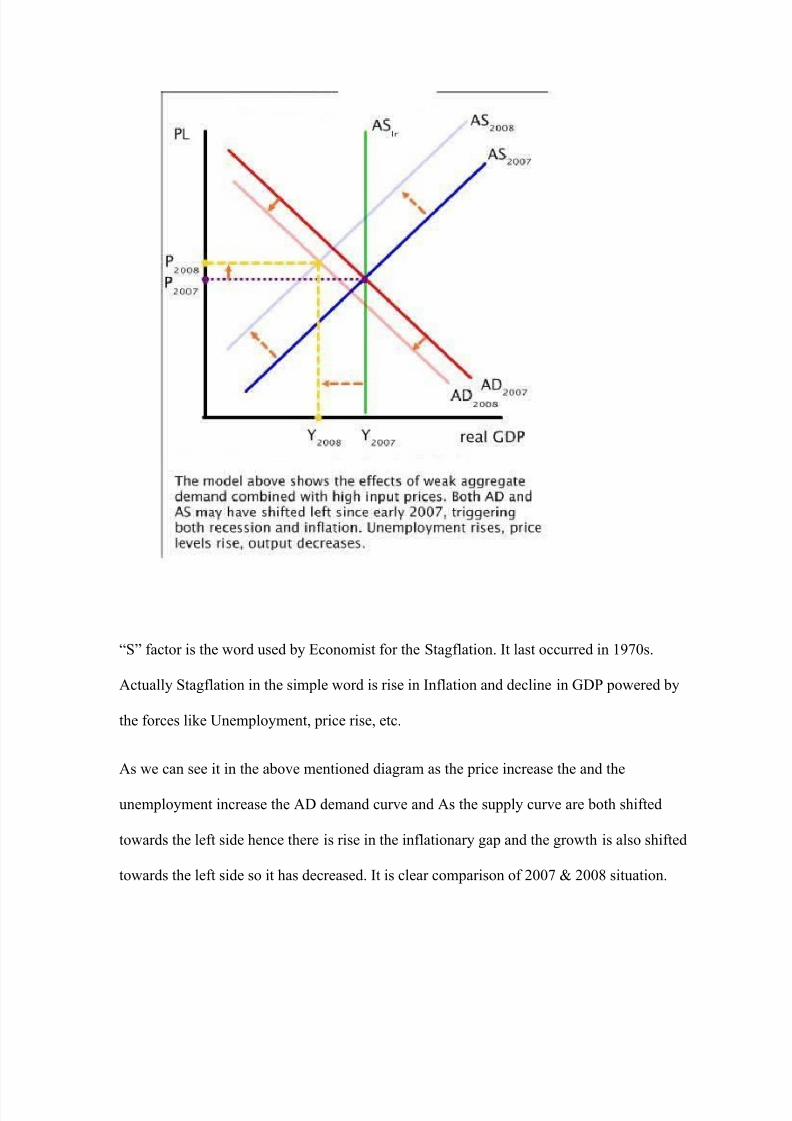
“S” factor is the word used by Economist for the Stagflation. It last occurred in 1970s.
Actually Stagflation in the simple word is rise in Inflation and decline in GDP powered by
the forces like Unemployment, price rise, etc.
As we can see it in the above mentioned diagram as the price increase the and the
unemployment increase the AD demand curve and As the supply curve are both shifted
towards the left side hence there is rise in the inflationary gap and the growth is also shifted
towards the left side so it has decreased. It is clear comparison of 2007 & 2008 situation.

8/7/2019 Stagflation in New Zealand 2008
http://slidepdf.com/reader/full/stagflation-in-new-zealand-2008 10/19
Now another thing is why this situation worsened? For answering this question we need to
know the theory of Rational Expectations. This theory was first projected by John F Muth of
Indiana University in early sixties. In this theory he described that there are several
Economic situation happening around but the outcome of that situation mainly depends on
the “people’s expectations”. Furthermore, a famous Economist John Maynard Keynes used
these term and stated that, “It is a wave of Pessimism and Optimism to determine the level of
Economic Activity”. http://www.econlib.org/library/Enc/RationalExpectations.html
Actually People analyze the current situation and express their view, for example, they saw
farmer sawing crops and if the cultivation and harvesting of paddy is less, people expect the
price to go up and they buy as soon as the flock of rice enters the market to sell. So, because
of high demand and low supply the price automatically rise because most of the people
expect that the price of paddy will rise. Hence we can quote it to the theory of Rational
Expectation. This is what people expect and things tend to happen.
Moreover according to the statistics provided by the government the Unemployment rate
after falling throughout 2007, it has seen increase in the first quarter of 2008 by 0.2% to 3.9%
till June 2008. Male unemployment rate rise from 0.4% to 3.9% and Female on the other
hand rise from 0.1% to 4.0%. http://www.stats.govt.nz/NR/rdonlyres/5ED3C518-6FFA-
4F1B-BB07-C3018B412133/0/householdlabourforcesurveyjun08qtrmr.pdf
8/7/2019 Stagflation in New Zealand 2008
http://slidepdf.com/reader/full/stagflation-in-new-zealand-2008 11/19
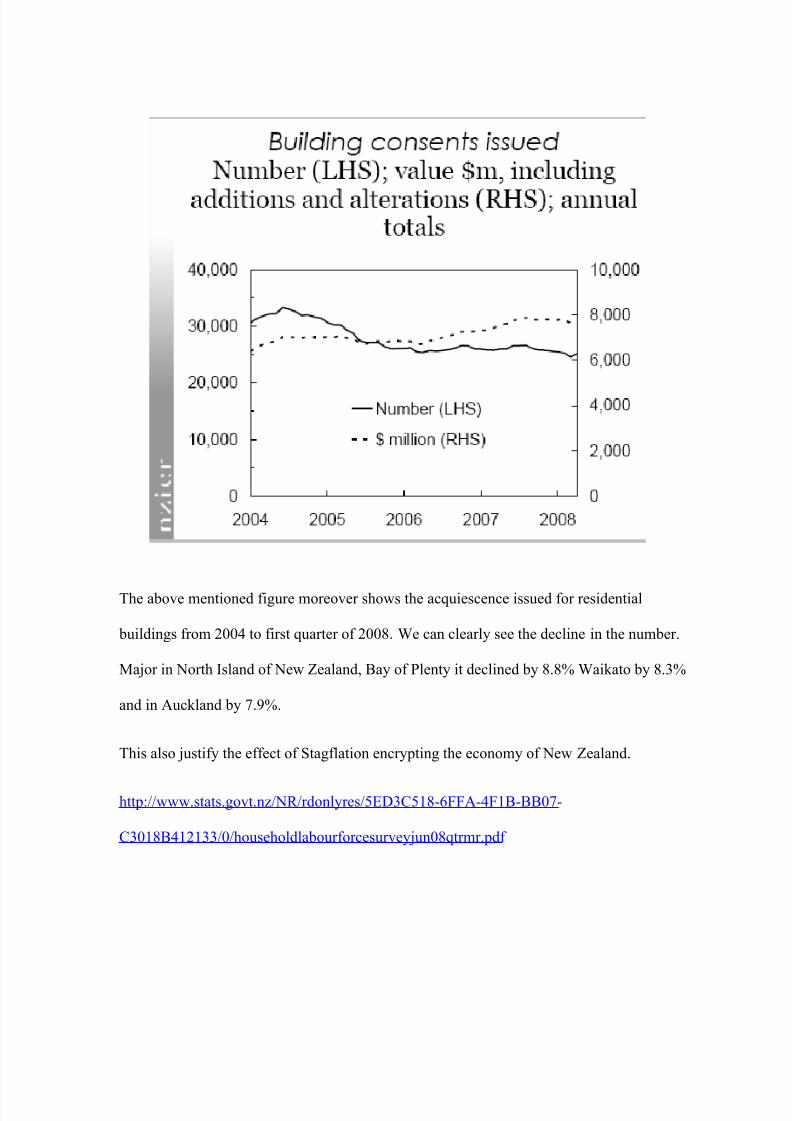
The above mentioned figure moreover shows the acquiescence issued for residential
buildings from 2004 to first quarter of 2008. We can clearly see the decline in the number.
Major in North Island of New Zealand, Bay of Plenty it declined by 8.8% Waikato by 8.3%
and in Auckland by 7.9%.
This also justify the effect of Stagflation encrypting the economy of New Zealand.
http://www.stats.govt.nz/NR/rdonlyres/5ED3C518-6FFA-4F1B-BB07-
C3018B412133/0/householdlabourforcesurveyjun08qtrmr.pdf
8/7/2019 Stagflation in New Zealand 2008
http://slidepdf.com/reader/full/stagflation-in-new-zealand-2008 12/19
4.0 Options to Recover from Negative Economic Growth:
There are some options to recover from this dangerous “S” i.e. stagflation situation. We will
see it one by one;
Fiscal Policies:
Fiscal Policies are the policies heading towards government spending and taxation. Here AD
that is Aggregate Demand includes expenditure, reserves, net exports, government
expenditure affects AD directly while Taxes affects indirectly by altering the non-refundable
income of the household which alters the consumption. (Economics, 6th
edition, Boyes &
Melvin, 2005 Houghton Mifflin Company, USA) There is a time lag in implementation off
the Fiscal Policies; it is minimum time of 18 months. It is effective in fixed exchange rate.
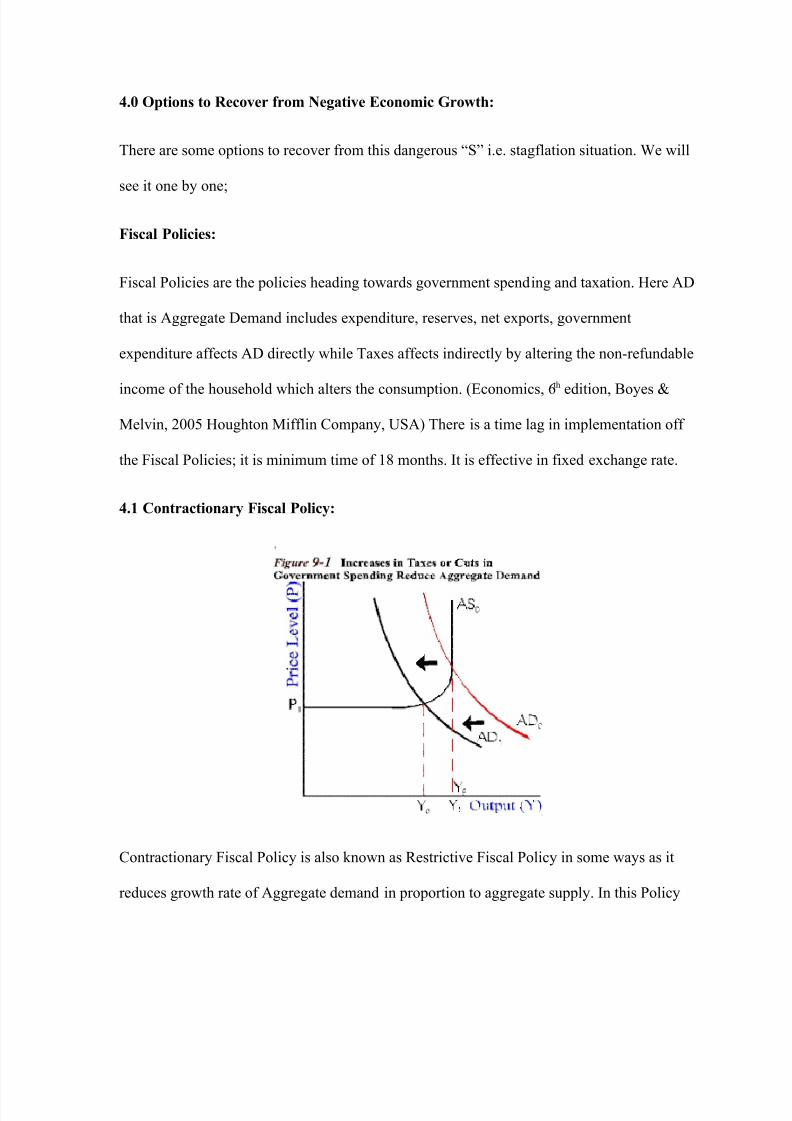
4.1 Contractionary Fiscal Policy:
Contractionary Fiscal Policy is also known as Restrictive Fiscal Policy in some ways as it
reduces growth rate of Aggregate demand in proportion to aggregate supply. In this Policy
8/7/2019 Stagflation in New Zealand 2008
http://slidepdf.com/reader/full/stagflation-in-new-zealand-2008 13/19
we take aggregate supply unchanging, but aggregate demand is contracted as an outcome of
the higher tax and diminution in government spending. As a result the Aggregate demand
curve is shifted from point of full employment to the point of higher amount of
unemployment. So as a result of this policy, the risk of Unemployment increases.
http://www.colorado.edu/Economics/courses/econ2020/section9/section9-main.html
Hence, we can clearly notice from the graph that this policy controls a bit of Inflation but the
Recessionary gap widens up.
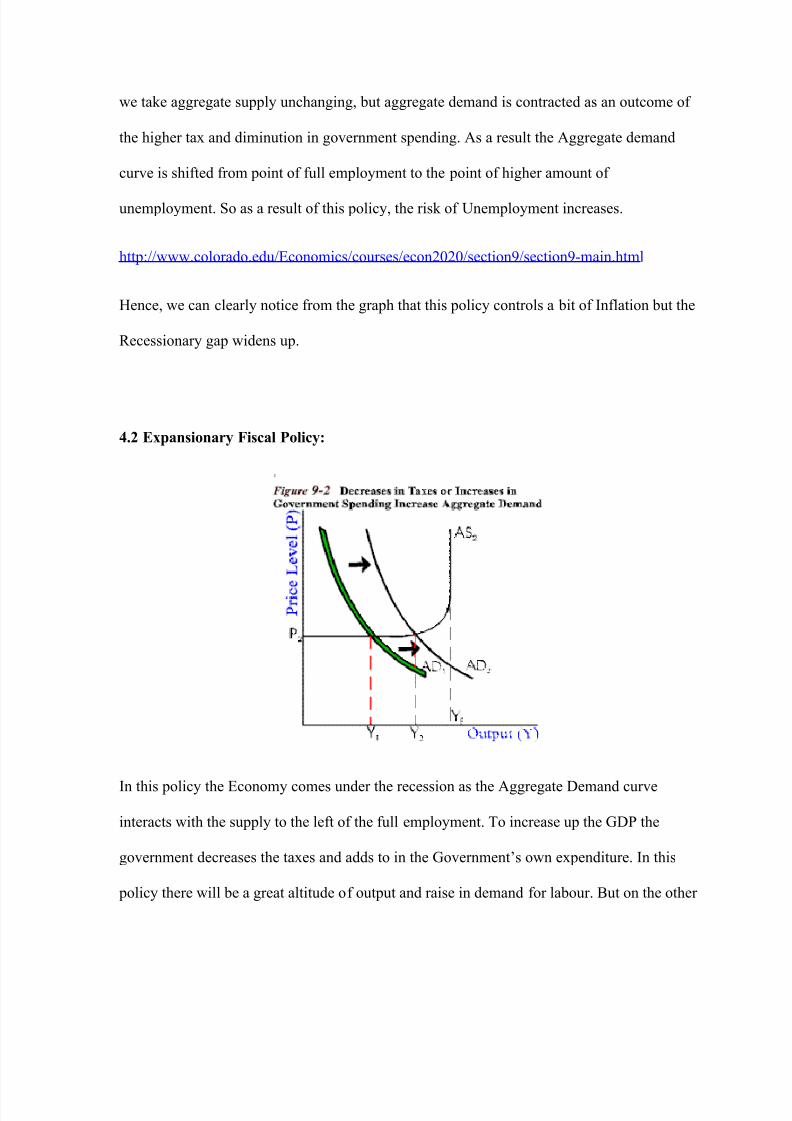
4.2 Expansionary Fiscal Policy:
In this policy the Economy comes under the recession as the Aggregate Demand curve
interacts with the supply to the left of the full employment. To increase up the GDP the
government decreases the taxes and adds to in the Government’s own expenditure. In this
policy there will be a great altitude of output and raise in demand for labour. But on the other
8/7/2019 Stagflation in New Zealand 2008
http://slidepdf.com/reader/full/stagflation-in-new-zealand-2008 14/19
hand the disappointingly the soaring Inflation is likely to be the outcome.
http://www.colorado.edu/Economics/courses/econ2020/section9/section9-main.html
(http://images.google.co.nz/imgres?
imgurl=http://www.colorado.edu/Economics/courses/econ2020/section9/gifs/fig91.gif&imgr
efurl=http://www.colorado.edu/Economics/courses/econ2020/section9/section9-
main.html&h=280&w=280&sz=8&hl=en&start=3&usg=__6vN555KGDK2crVNDmvDnm
wonxho=&tbnid=NkkY4nsOscblYM:&tbnh=114&tbnw=114&prev=/images%3Fq
%3DFiscal%2BPolicy%26as_st%3Dy%26hl%3Den%26sa%3DG)
If we take the example of US regarding this Policy, US tried to cut taxes in 2008, however
the economy is experiencing the falling house prices and a credit crunch. Expansionary
Fiscal policy includes higher Government borrowing and higher spending so it could create
crowding hence it results for private sector to spend less.
http://www.economicshelp.org/blog/economics/impact-of-expansionary-fiscal-policy/
Monetary Policy:
There are two types of Monetary Policies.
1) Contractionary Monetary Policy
2) Expansionary Monetary Policy
Here, Contractionary money Policy is also termed as a Tight Money Policy. And Expansionary
Monetary policy is also sometime called as Easy Money Policy.
8/7/2019 Stagflation in New Zealand 2008
http://slidepdf.com/reader/full/stagflation-in-new-zealand-2008 15/19
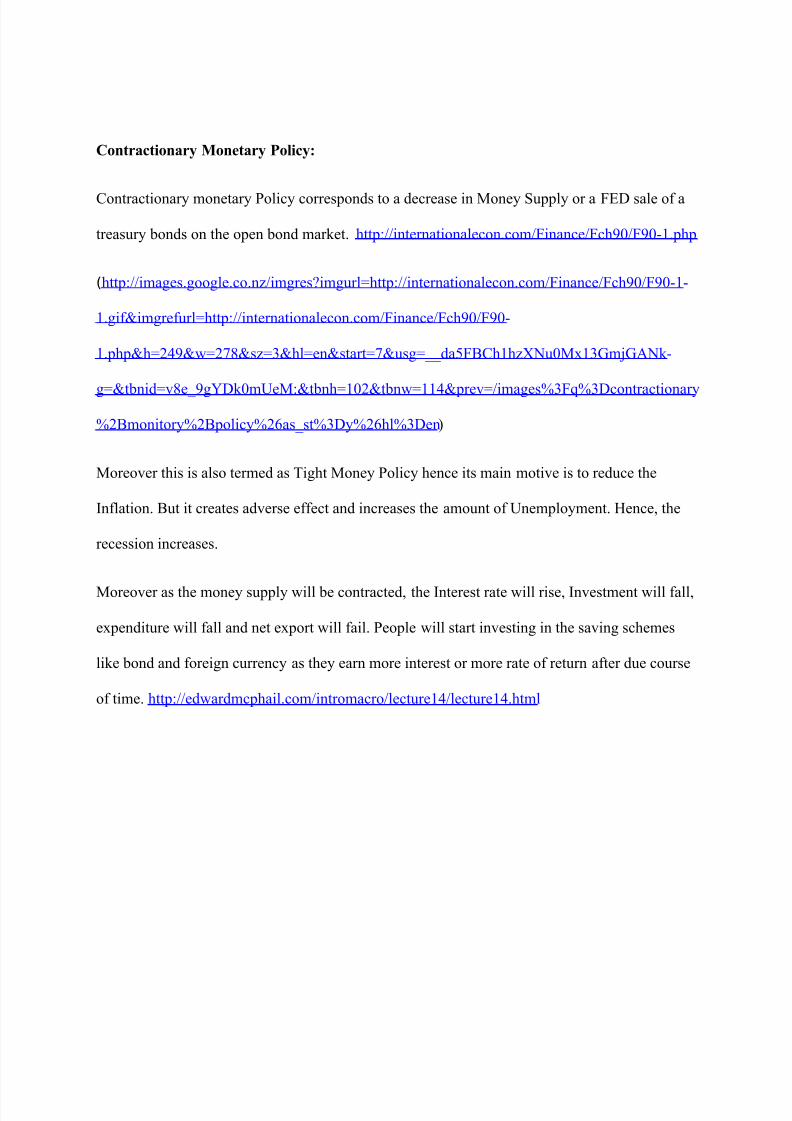
Contractionary Monetary Policy:
Contractionary monetary Policy corresponds to a decrease in Money Supply or a FED sale of a
treasury bonds on the open bond market. http://internationalecon.com/Finance/Fch90/F90-1.php
(http://images.google.co.nz/imgres?imgurl=http://internationalecon.com/Finance/Fch90/F90-1-
1.gif&imgrefurl=http://internationalecon.com/Finance/Fch90/F90-
1.php&h=249&w=278&sz=3&hl=en&start=7&usg=__da5FBCh1hzXNu0Mx13GmjGANk-
g=&tbnid=v8e_9gYDk0mUeM:&tbnh=102&tbnw=114&prev=/images%3Fq%3Dcontractionary
%2Bmonitory%2Bpolicy%26as_st%3Dy%26hl%3Den)
Moreover this is also termed as Tight Money Policy hence its main motive is to reduce the
Inflation. But it creates adverse effect and increases the amount of Unemployment. Hence, the
recession increases.
Moreover as the money supply will be contracted, the Interest rate will rise, Investment will fall,
expenditure will fall and net export will fail. People will start investing in the saving schemes
like bond and foreign currency as they earn more interest or more rate of return after due course
of time. http://edwardmcphail.com/intromacro/lecture14/lecture14.html
8/7/2019 Stagflation in New Zealand 2008
http://slidepdf.com/reader/full/stagflation-in-new-zealand-2008 16/19
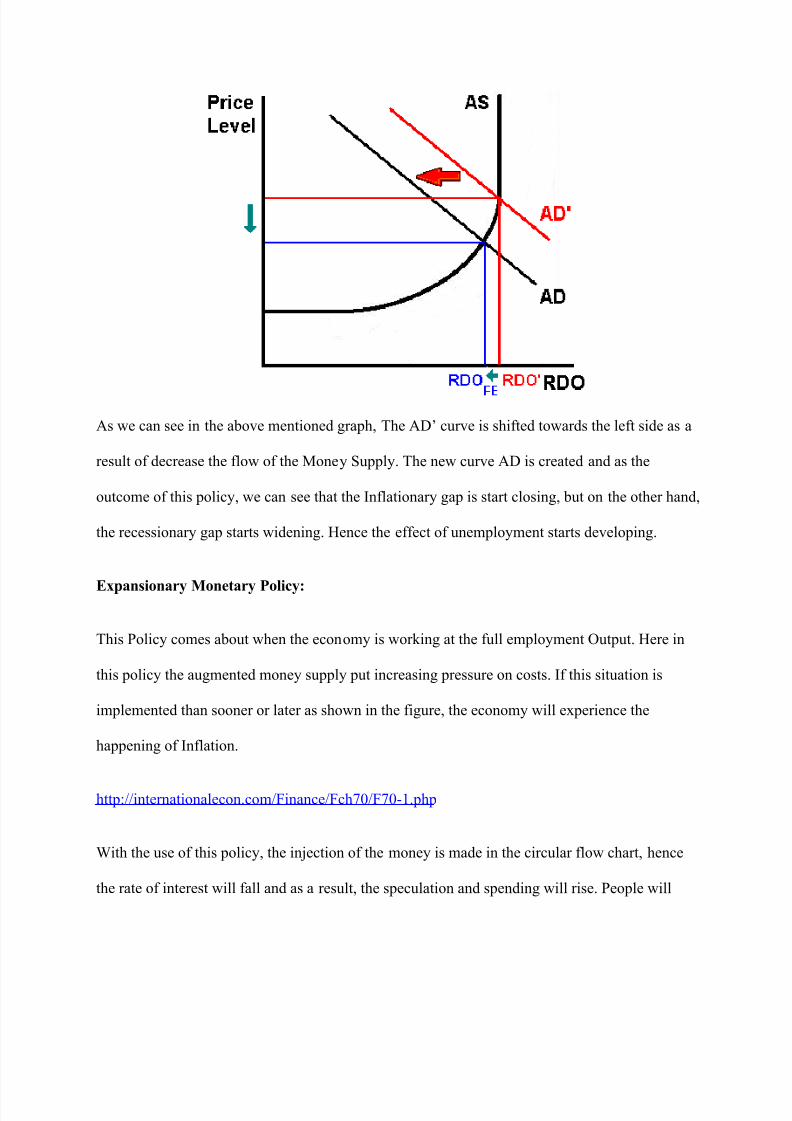
As we can see in the above mentioned graph, The AD’ curve is shifted towards the left side as a
result of decrease the flow of the Money Supply. The new curve AD is created and as the
outcome of this policy, we can see that the Inflationary gap is start closing, but on the other hand,
the recessionary gap starts widening. Hence the effect of unemployment starts developing.
Expansionary Monetary Policy:
This Policy comes about when the economy is working at the full employment Output. Here in
this policy the augmented money supply put increasing pressure on costs. If this situation is
implemented than sooner or later as shown in the figure, the economy will experience the
happening of Inflation.
http://internationalecon.com/Finance/Fch70/F70-1.php
With the use of this policy, the injection of the money is made in the circular flow chart, hence
the rate of interest will fall and as a result, the speculation and spending will rise. People will
8/7/2019 Stagflation in New Zealand 2008
http://slidepdf.com/reader/full/stagflation-in-new-zealand-2008 17/19
save less and consume more. They purchase more commodities and services. The prosperity
rises in the business cycle expansion and People also start investing in the financial possessions
as the wealth rises. http://edwardmcphail.com/intromacro/lecture14/lecture14.html
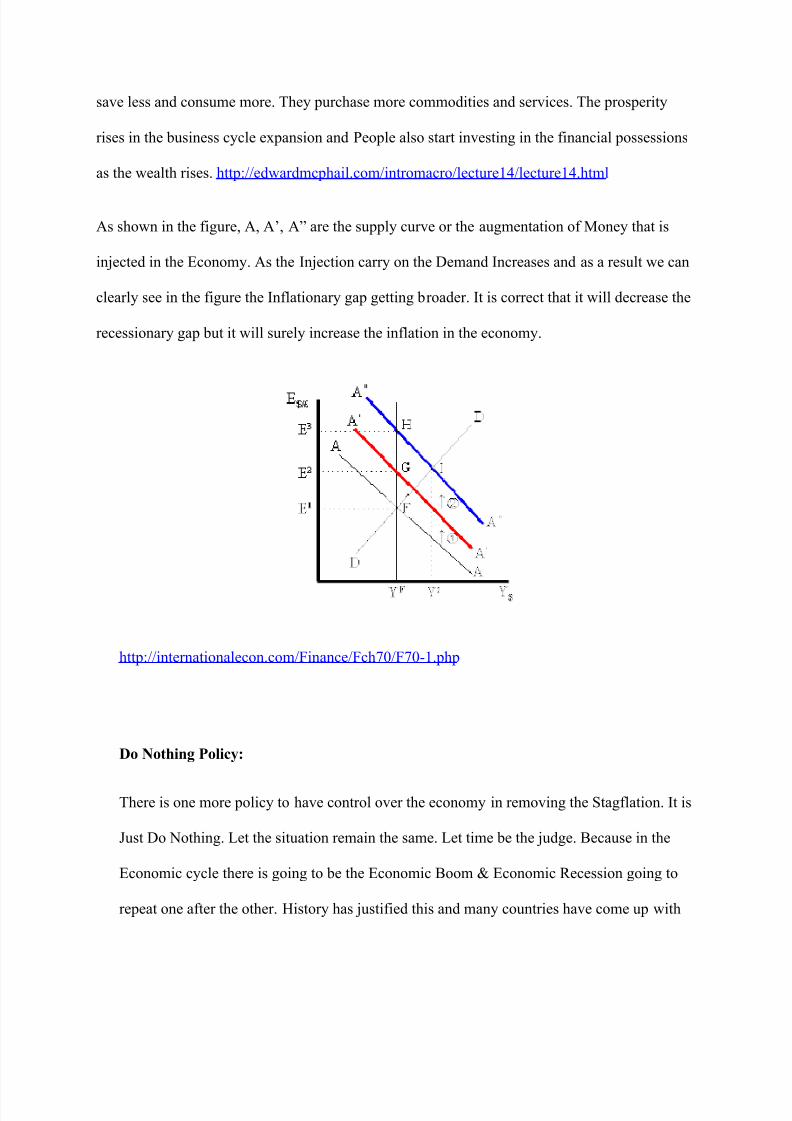
As shown in the figure, A, A’, A” are the supply curve or the augmentation of Money that is
injected in the Economy. As the Injection carry on the Demand Increases and as a result we can
clearly see in the figure the Inflationary gap getting broader. It is correct that it will decrease the
recessionary gap but it will surely increase the inflation in the economy.
http://internationalecon.com/Finance/Fch70/F70-1.php
Do Nothing Policy:
There is one more policy to have control over the economy in removing the Stagflation. It is
Just Do Nothing. Let the situation remain the same. Let time be the judge. Because in the
Economic cycle there is going to be the Economic Boom & Economic Recession going to
repeat one after the other. History has justified this and many countries have come up with
8/7/2019 Stagflation in New Zealand 2008
http://slidepdf.com/reader/full/stagflation-in-new-zealand-2008 18/19
good outcomes by doing nothing. Do Nothing Policy has worked for many unstable
economies to grow.
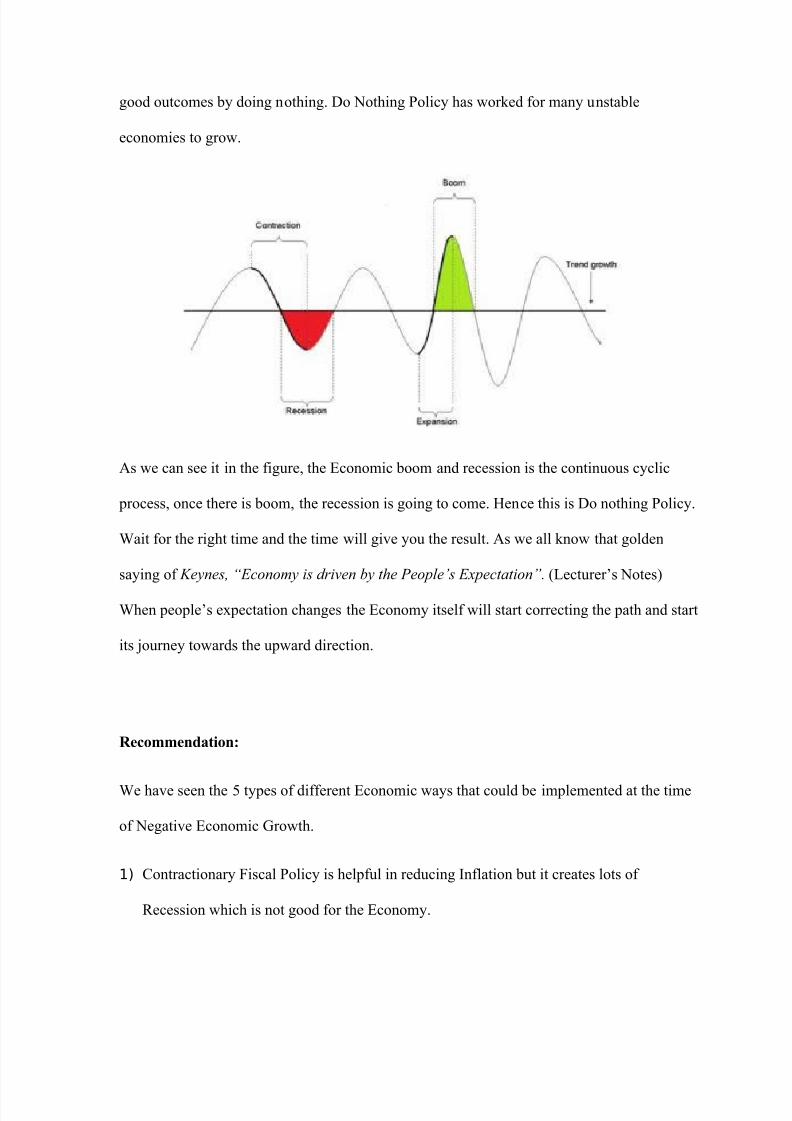
As we can see it in the figure, the Economic boom and recession is the continuous cyclic
process, once there is boom, the recession is going to come. Hence this is Do nothing Policy.
Wait for the right time and the time will give you the result. As we all know that golden
saying of Keynes, “Economy is driven by the People’s Expectation”. (Lecturer’s Notes)
When people’s expectation changes the Economy itself will start correcting the path and start
its journey towards the upward direction.
Recommendation:
We have seen the 5 types of different Economic ways that could be implemented at the time
of Negative Economic Growth.
1) Contractionary Fiscal Policy is helpful in reducing Inflation but it creates lots of
Recession which is not good for the Economy.
8/7/2019 Stagflation in New Zealand 2008
http://slidepdf.com/reader/full/stagflation-in-new-zealand-2008 19/19
2) Expansionary Fiscal Policy is helpful in reducing Recession (Unemployment) but it
causes Inflation which is again not good for Economy.
3) Contractionary Monetary Policy reduces Inflation but again proves harmful to the
Economy as it is a cause of Recession.
4) Expansionary Monetary Policy is also helpful in cutting down Recession but if again
causes harm to the Economy by raising Inflation.
5) Do Nothing Policy to me is the best Policy so far I recommend as all the policies have
time lag as this policy also has that but Boom/Recession is a cyclic Process as we seen in
the above diagram, Once if there is Inflationary or Recessionary gap there is going to be
the Economic Boom. If one uses Contractionary or Expansionary policy at the time of
Stagflation, it pays with higher Recession or Inflation. But let time be the judge, which is
the best way to go.
Hence, I Recommend Do Nothing Policy is the Best Policy.