stadium queue simulation
TRANSCRIPT

SIMULATION MODELLING
FINAL PROJECT
STADIUM QUEUE SIMULATION
Professor: David Kelton
Created By: Aditya Singh
M-Number: M10574606

Chapter 1
Introduction and Problem Statement
1.1 Introduction
The Nippert Stadium is UC’s Football and Soccer Stadium. It has a capacity of 35,000.
There are 6 entrances through which fans enter the stadium during games. Most fans are
passionate and regulars at the stadium and on an average, we get attendances of over 20
thousand per game. This project simulates fans entering the stadium from the Main Street
Entrance, Gate 6 (Near the Recreation Center) on the 18th of November during the UC
Bearcats vs Memphis Football game. The idea of this project is to analyze the current
model and based on the current metrics, develop a better working simulation model using
Arena Software so that the average waiting time of the fans in the queues reduces.
1.2 Motivation and Objective
I visit the Nippert stadium very often during games and I have always been interested in
understanding how queues function at the stadium entrances. Through this project, I
want to understand the rate of arrival of fans and the time spent by them in queues
before entering the stadium. On Several occasions, I have been stuck in long queues and
missed the beginning of the game. The objective of this project is to reduce the total time
spent by each fan in the queues before entering the stadium and to optimize the number
of resources in the parallel queues.

Chapter 2
Data Collection and Model Fitting
2.1 Data Collection and Fitting to Distributions
1) For this model, the input data was the arrival schedule of the fans every five
minutes from 7:30PM to 8:30PM. The game began at 8:00PM. This data was fed
into an arrival schedule in Arena.
2) The Number of fans carrying bags were observed in the one hour period.
3) It was observed that 11.5% of the fans throughout the one hour period had bags
which were searched.
4) The individual scanning time of each fan was difficult to record and therefore I
counted the number of fans which passed the scanning process after completing
the bag check for a period of 30 seconds. I repeated this process 10 times to get
data points to obtain a distribution in the input analyzer.
The table above gives a better picture of how I obtained data points for the
scanning time. This data was fed into an input analyzer and the following
distribution was fit:

Distribution: Beta, Expression: 0.62+0.38 * BETA(1.61,1.33)
5) The time taken for searching bags was recorded for 66 fans since it was difficult to
observe the bag search time for every fan. This Data was fed into an input analyzer
and the following distribution was fit:
Distribution: Gamma
Expression: GAMM(2.51,4.4)
2.2 Assumptions in the Model
Certain assumptions were made as collecting data for every scenario was complex.
1) It was observed that 11.5% of the fans in the one hour period had bags. Only
people with significantly large bags have been considered. I have not taken ladies
with clutches and small bags into account.
2) The arrival rate of fans carrying bags entering every five minutes is uniform
throughout the one hour period.
3) Fans carrying bags choose one of lanes 1,2 and 3 with equal probabilities (0.33,0.33
and 0.34).
4) A bigger percentage of fans without bags enter the express lane (48%) and the
remaining are enter lane 1,2 and 3 with equal probabilities (0.18,0.17 and 0.17).

Chapter 3
Arena Model
3.1 Modeling the System
The Procedure that any fan follows while entering the stadium is divided into the
following steps:
Fans Arrive.
Fans Choose which lane to enter.
Fans wait in queue to get bags searched.
Fans wait in queue to get tickets scanned.
Fan leaves the System.
There are certain decision modules which decide the path of the fans in the model.
There are four lanes in total and there have been probabilities assigned to fans
using Assign Modules to choose the lanes. One of the four lane’s is an express lane
where only fans without bags can enter. This lane has only the Scanning Process
where as the other three lanes has the Bag Search Process as well.
The following is an overview of all the model parameters:
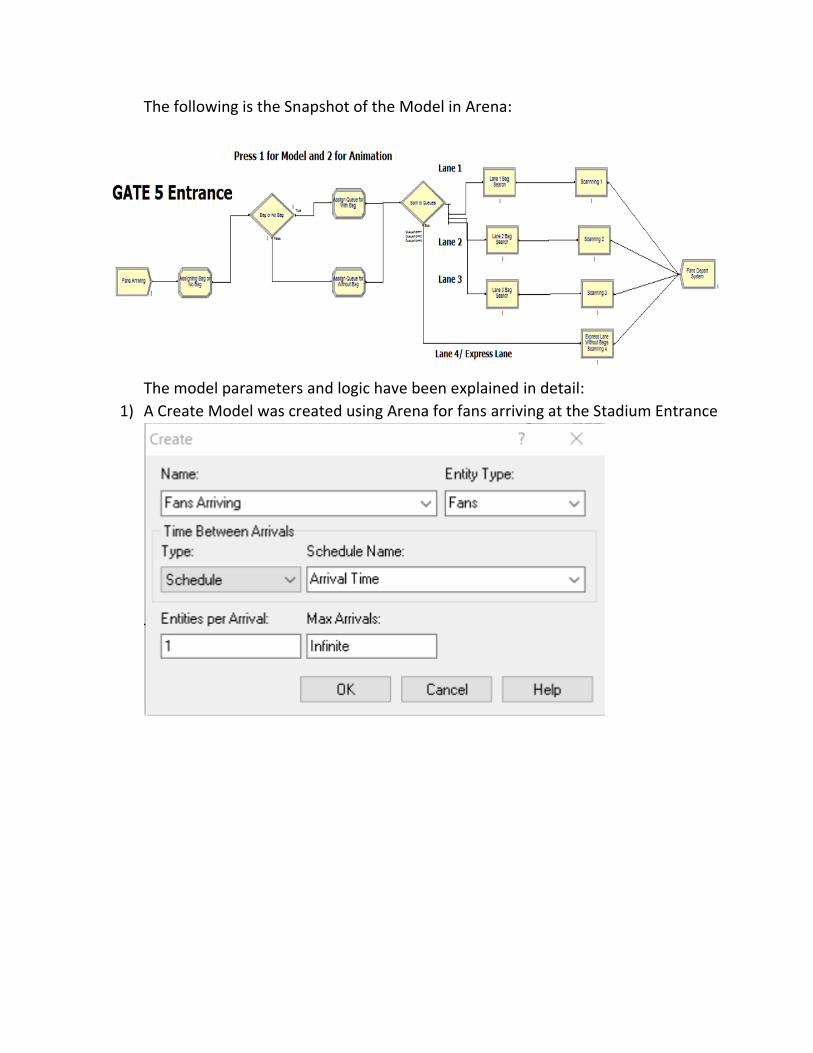
The following is the Snapshot of the Model in Arena:
The model parameters and logic have been explained in detail:
1) A Create Model was created using Arena for fans arriving at the Stadium Entrance
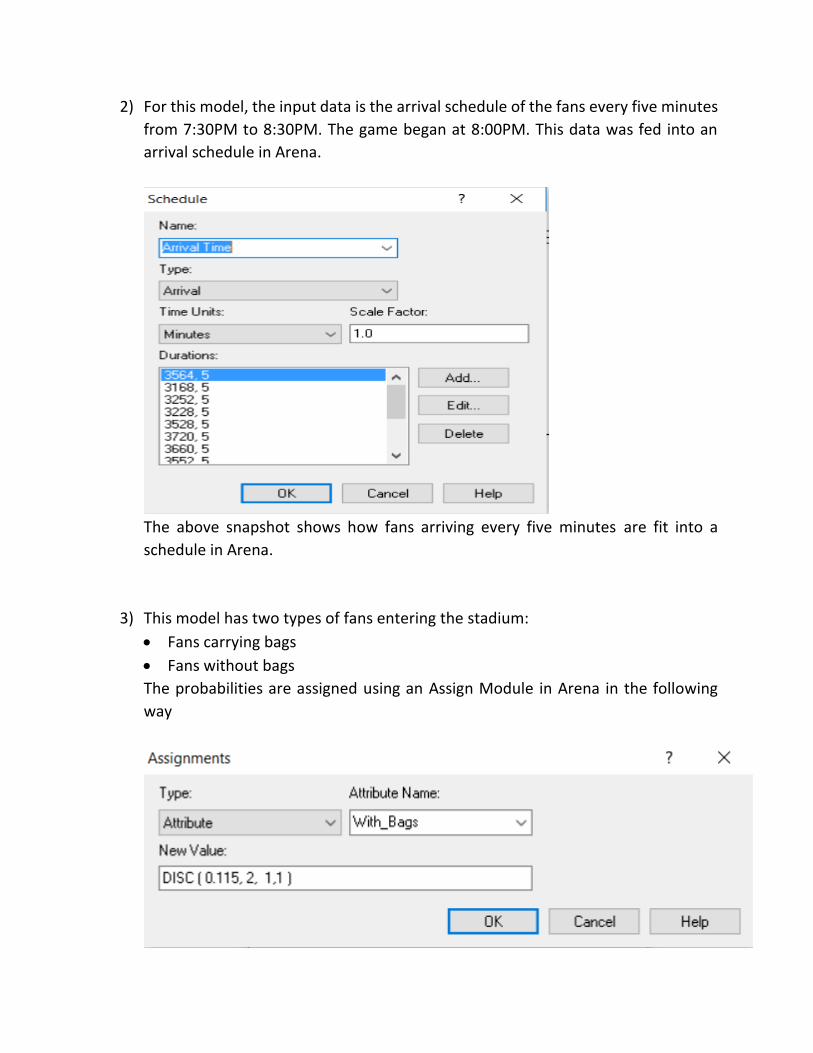
2) For this model, the input data is the arrival schedule of the fans every five minutes
from 7:30PM to 8:30PM. The game began at 8:00PM. This data was fed into an
arrival schedule in Arena.
The above snapshot shows how fans arriving every five minutes are fit into a
schedule in Arena.
3) This model has two types of fans entering the stadium:
Fans carrying bags
Fans without bags
The probabilities are assigned using an Assign Module in Arena in the following
way

4) A Decide Process Module is used in Arena to check if fan has a bag or not
5) The fans can enter the stadium via four parallel lanes. The fourth lane is an express
lane where only fans without bags can enter. Probabilities with which the fans
choose the lanes have been assigned using the Assign Module in Arena in the
following ways:

6) A Decide Process Module is then used to split the fans into four lanes.
The first three lanes contain two processes as follows:
7) The following Process Modules are Created in the first Three Lanes:
Bag Search- If a fan has a bag his bag is searched before he/she goes on to the
next process. While his bag is being searched, the fan standing behind him
irrespective of whether he/she has a bag or not has to wait until his bag is
searched. There is one resource in each lane (bag search person) who searches
bags.
The expressions for bag search time has been created in the following way:

Process Module for Bag Search
The figure above shows the created expression Frisking Time(With_Bags).
When With_Bags is False then Frisking Time will be equal to zero.
Ticket Scanning – Every fan must get his/her ticket scanned before entering
the stadium. There is one resource in each lane who scans tickets.
An Expression has been created for Scanning time
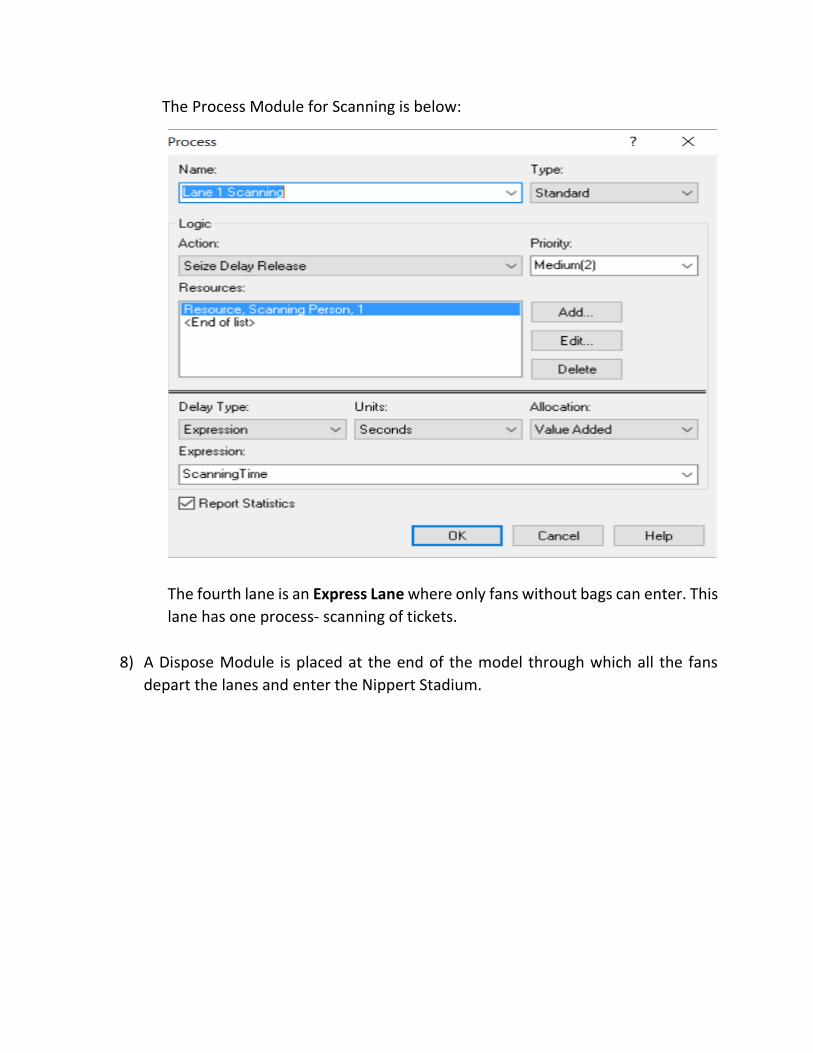
The Process Module for Scanning is below:
The fourth lane is an Express Lane where only fans without bags can enter. This
lane has one process- scanning of tickets.
8) A Dispose Module is placed at the end of the model through which all the fans
depart the lanes and enter the Nippert Stadium.
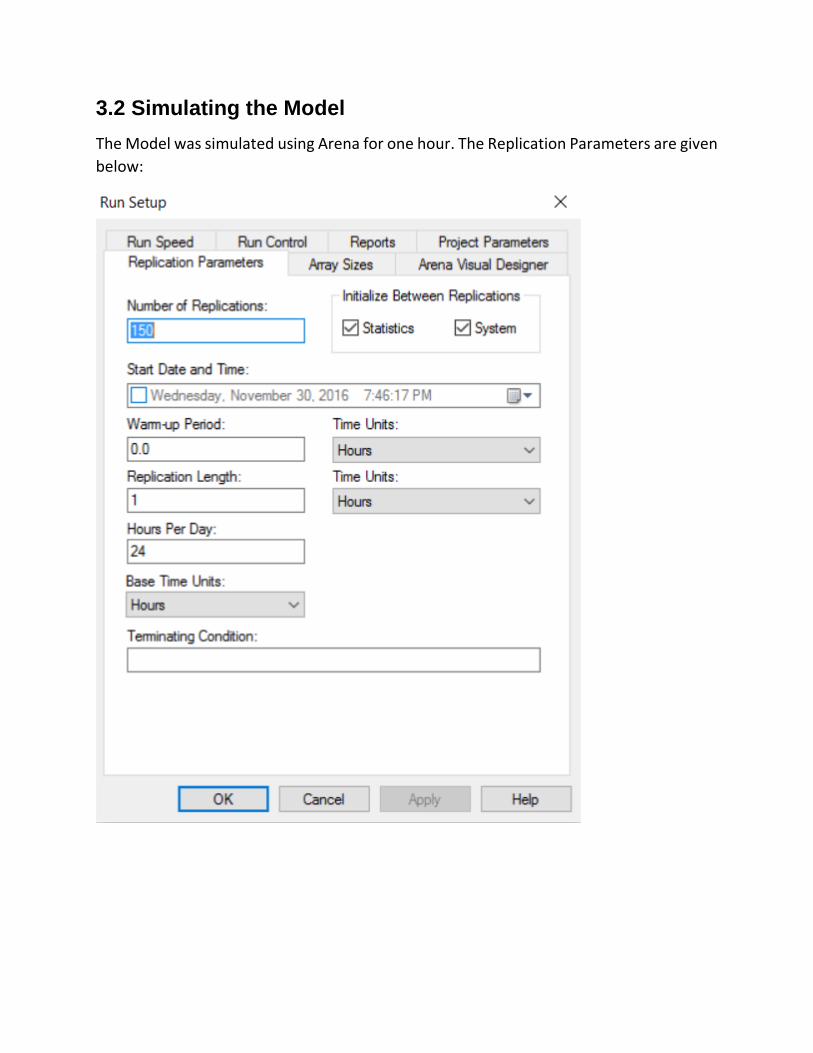
3.2 Simulating the Model
The Model was simulated using Arena for one hour. The Replication Parameters are given
below:
CHAPTER 4
Results
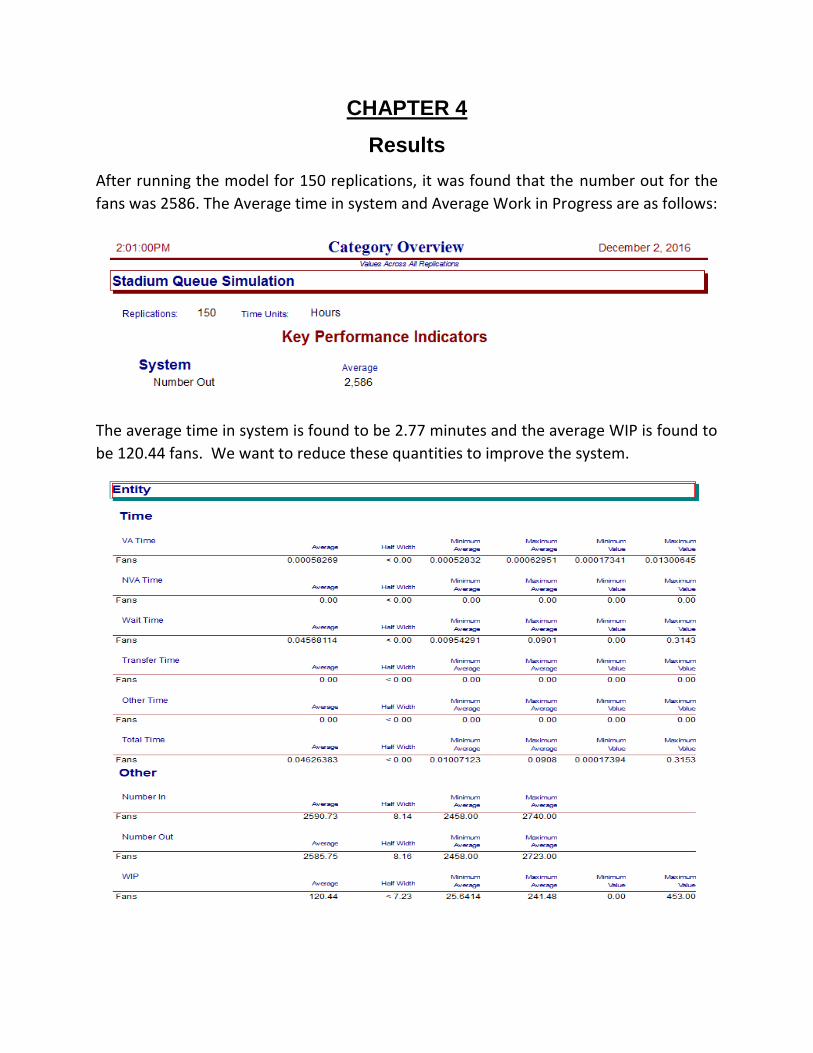
After running the model for 150 replications, it was found that the number out for the
fans was 2586. The Average time in system and Average Work in Progress are as follows:
The average time in system is found to be 2.77 minutes and the average WIP is found to
be 120.44 fans. We want to reduce these quantities to improve the system.
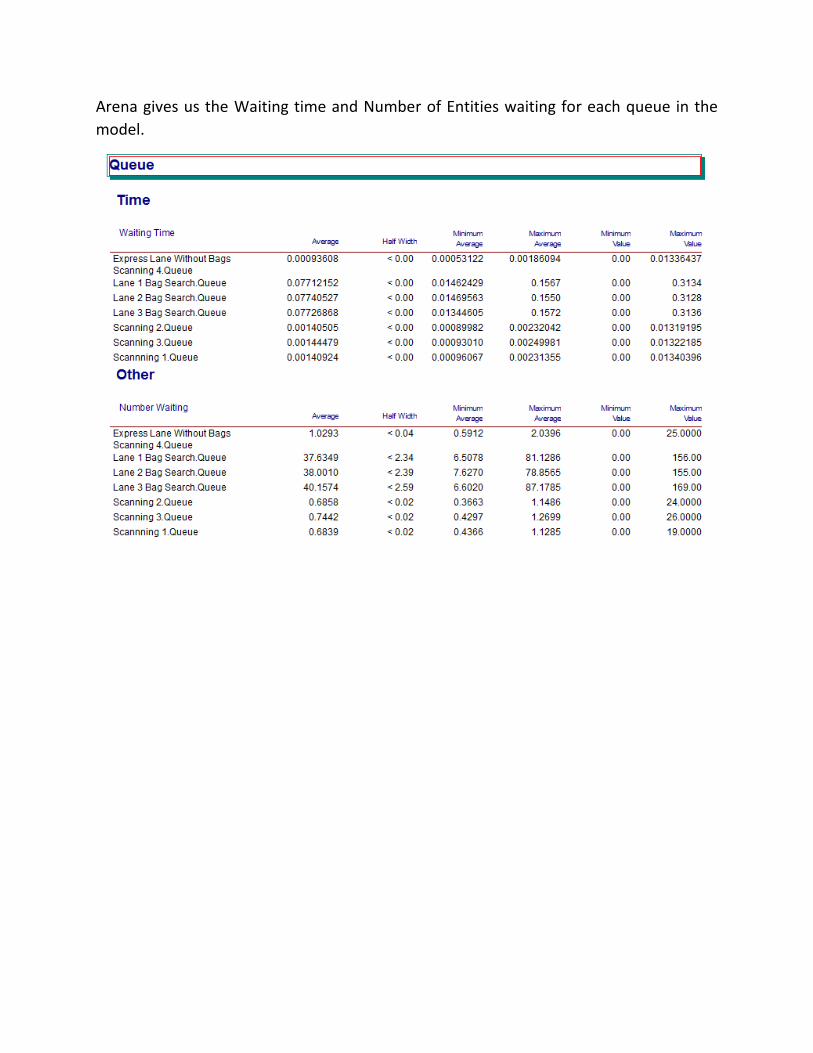
Arena gives us the Waiting time and Number of Entities waiting for each queue in the
model.
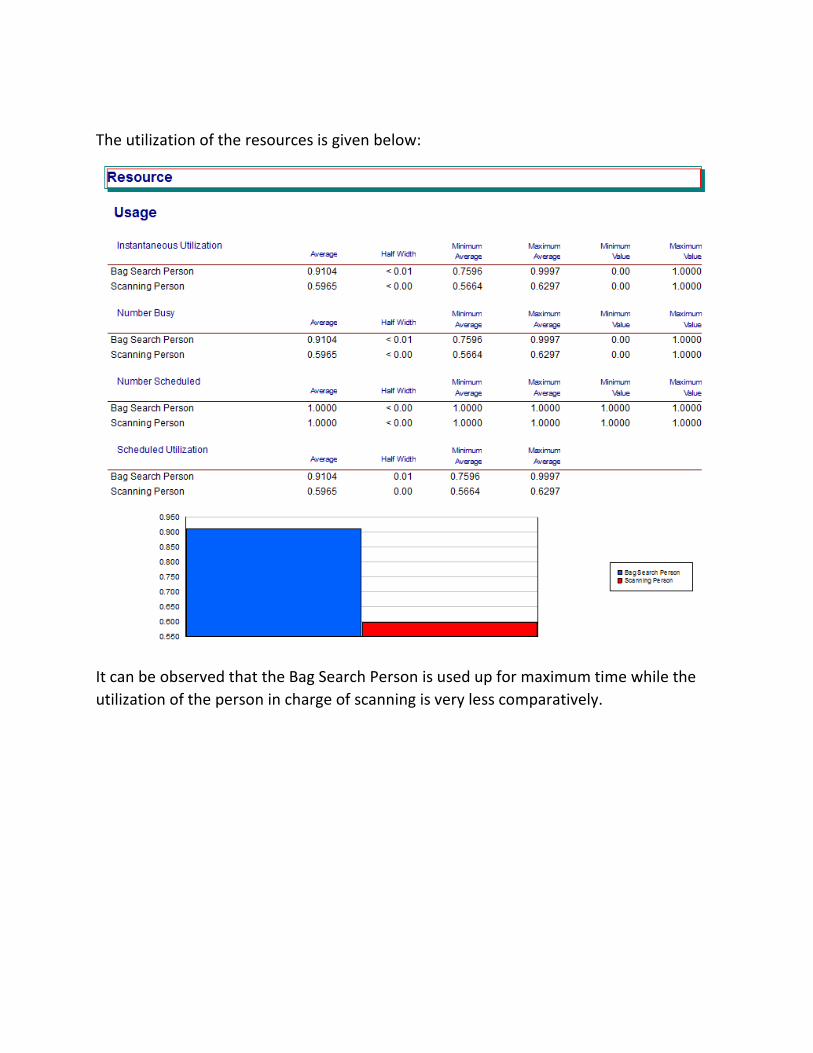
The utilization of the resources is given below:
It can be observed that the Bag Search Person is used up for maximum time while the
utilization of the person in charge of scanning is very less comparatively.

Chapter 5
Improving the System
5.1 Suggestion for Improvement
The new system has been improved by reducing the average total time spent per fan in
the system. Also, the WIP average has been reduced.
This has been achieved by removing one of the resources and converting lane 3 into an
express lane. Only people without bags can enter this express lane. Now, our model has
2 express lanes and 2 regular lanes. Here 50% of fans carrying bags go into lane 1 and lane
2. The fans without bags enter lane 1, lane 2, lane 3 and lane 4 with probabilities
0.15,0.15,0.35 and 0.35 respectively.
The new model is shown below:
5.2 Comparing the Results
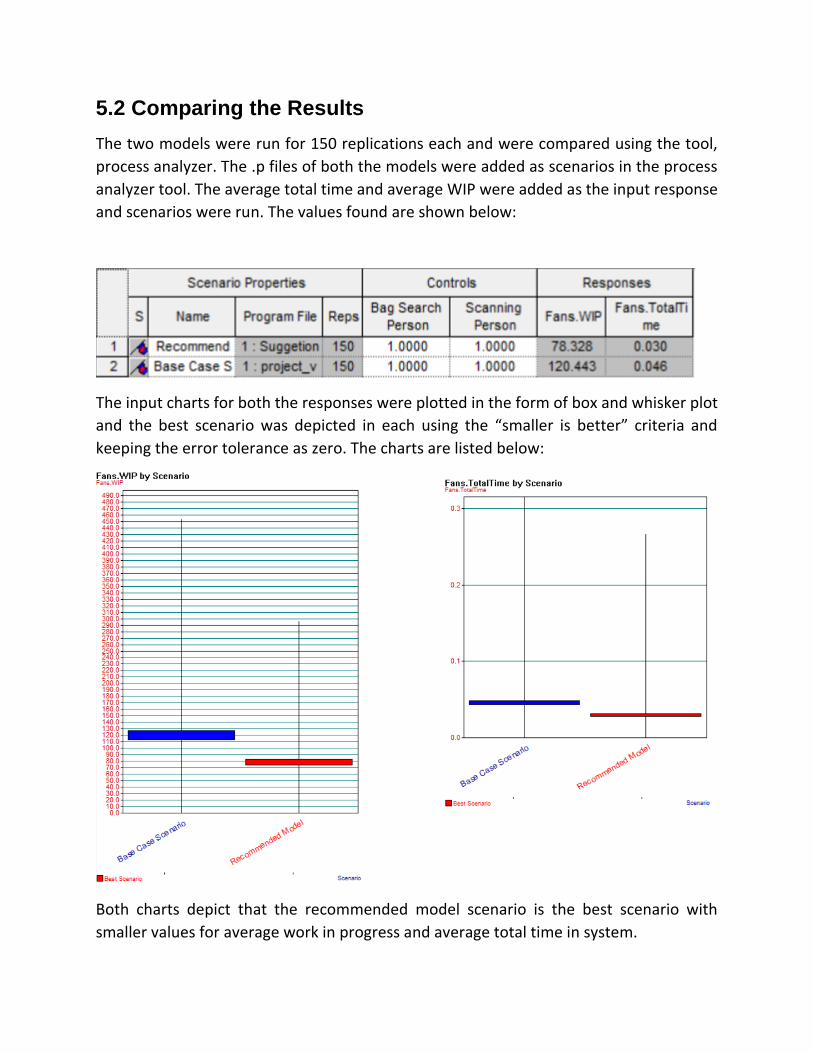
The two models were run for 150 replications each and were compared using the tool,
process analyzer. The .p files of both the models were added as scenarios in the process
analyzer tool. The average total time and average WIP were added as the input response
and scenarios were run. The values found are shown below:
The input charts for both the responses were plotted in the form of box and whisker plot
and the best scenario was depicted in each using the “smaller is better” criteria and
keeping the error tolerance as zero. The charts are listed below:
Both charts depict that the recommended model scenario is the best scenario with
smaller values for average work in progress and average total time in system.

Chapter 6
Conclusion
The queues at the Gate 6 Entrance of Nippert Stadium was modeled in Arena Simulation
software and the results about the relevant parameters were generated. After
performing an analysis, it was observed that the overall time spent by each fan in the
system was close to 3 minutes. A new model was developed to reduce average fan time.
The new model was compared statistically for the average wait fan time in the system
using a software called Process Analyzer and it was found that the new, suggested model
has a statistically significant decrease in the Average Fan time and WIP as compared to
the original model. The new model also, has one less resource as compared to the original
model. Hence, with these suggested changes, more number of fans can enter through
gate 6 and spend less time in the system before heading to their seats.
References
1. Content-
Simulation with Arena 6/e- W. David Kelton- University of Cincinnati, Randall P.
Sadowski, Nancy B. Zupick, Rockwell Automation