stablization of soil by use of geo-jute as … and principal modern institute of engineering and...
TRANSCRIPT
International Research Journal of Engineering and Technology (IRJET) e-ISSN: 2395-0056
Volume: 04 Issue: 08 | Aug -2017 www.irjet.net p-ISSN: 2395-0072
© 2017, IRJET | Impact Factor value: 5.181 | ISO 9001:2008 Certified Journal | Page 1654
STABLIZATION OF SOIL BY USE OF GEO-JUTE AS SOIL STABILIZER
Aamir Farooq1, Prof.(Dr. )Rajesh Goyal2
1Post Graduate Student at Modern Institute of Engineering and Technology Mohri Shahabad Ditrict Kurukshetra 2Profesor and Principal Modern Institute of Engineering and Technology Mohri Shahabad Ditrict Kurukshetra
---------------------------------------------------------------------***---------------------------------------------------------------------Abstract - The existing soil at a particular location may not be suitable for the construction due to poor bearing capacity and higher compressibility. Particularly clays exhibit generally undesirable engineering properties. They tend to have low shear strengths and also loose shear strength further upon wetting or other physical disturbances. The improvement of soil at a site is indispensable due to rising cost of the land, and huge demand for high rise buildings. So recent research could be beneficial in finding the different ways of utilizing waste materials in most efficient ways like rice husk ash, fly ash, used tyres, etc. So replacement of natural soils aggregates and cement with solid industrial by-product is highly desirable. KeyWords: GeoJute, Geotextiles, GeoPipes, Geosynthetic clay liners,Geogrids,Geomembrane, 1.INTRODUCTION In developing country like India due to the remarkable development in road infrastructure, Soil stabilization has become the major issue in construction activity. Stabilization is an unavoidable for the purpose of highway and runway construction, stabilization denotes improvement in both strength and durability which are related to performance. Stabilization is a method of processing available materials for the production of low-cost road design and construction, the emphasis is definitely placed upon the effective utilization of waste by products like Geo Jute,and fly ash, with a view to decreasing the construction cost. The prime objective of soil stabilization is to improve the California Bearing Ratio of in-situ soils by 4 to 6 times. The other prime objective of soil stabilization is to improve on-site materials to create a solid and strong sub-base and base courses. In certain regions of the world, typically developing countries and now more frequently in developed countries, soil stabilization is being used to construct the entire road. GeoJute can play a vital role as they improve the bearing capacity ,Jute plants are grown mostly in the gangetic delta in the eastern part of the Indian subcontinent.People used to consume its leaves as a vegetable and also as a household herbal remedy.Jute plant has an erect stalk with leaves. It thrives in hot and humid climate, especially in
areas where rainfall is in plenty. It grows up to about three meters in height and matures within four to six months. In China, taller Jute plants are being cultivated resulting in higher fibre production The chemical composition of jute is as follows— - a-cellulose - 59 - 61 % - Hemicellulose - 22 - 24% - Lignin - 12 - 14% - Fats & waxes - 1.0 - 1.4% - Nitrogenous matter - 1.6 - 1.9% - Ash content - 0.5 - 0.8% - Pectin - 0.2 - 0.5% The average linear density of single jute filament lies between 1.3-2.6 tex for white jute and 1.8-4.0 tex for tossa jute with normal distribution. Coarseness of jute has some role in determining the strength of jute fibre. Coarse fibres are usually stronger. Jute fibres are usually strong with low extensibility. It has a tenacity range of 4.2 to 6.3 g/ denier, depending on the length of the fibre. Elongation-at-break of jute fibres is between 1.0% and 1.8%. Tossa jute is stronger than white jute. Jute fibre breaks within elastic limit and is resilient which is evident from its recovery to the extent of 75% even when strained quite a bit (1.5%). Its flexural and torsional rigidity are high compared to cotton and wool. Presence of hemicellulose in jute fibres makes it hygroscopic, second only to wool. Tossa jute is slightly more hygroscopic than white jute. Jute fibres swell on absorption of water. Jute is not thermoplastic like other natural fibres. Charring and burning of jute fibres without melting is a feature of jute fibres. Due to high specific heat, jute possesses thermal insulation properties. Ignition temperature of jute is of the order of 193° C. Long exposure of jute fibresto hot ambience reduces the fibre strength.Dry jute is a good resistant to electricity, but it loses its property of electrical resistance appreciably when moist. Dielectric constant of jute is 2.8 KHz when dry, 2.4 KHz at 65% RH and 3.6 KHz at 100% RH. Co-efficient of friction of Jute fibres is usually 0.54 for white jute and 0.45 for Tossa variety.Moisture content in jute helps increase its frictional property

International Research Journal of Engineering and Technology (IRJET) e-ISSN: 2395-0056
Volume: 04 Issue: 08 | Aug -2017 www.irjet.net p-ISSN: 2395-0072
© 2017, IRJET | Impact Factor value: 5.181 | ISO 9001:2008 Certified Journal | Page 1655
1.1 Problem Statement For a long time, we are facing problems like failures of small and big structures. The biggest problem lies in the soil especially when it fails in strength. Besides many stabilizers jute Known as the ‘golden fibre’ is one of the longest and most used natural fibre used in soil improvement can minimize the problem. The main purpose of this research is to understand and investigate the variations in the strength of the cohesive soils using jute fibers (natural fiber) as a soil reinforcing material. The study also includes the determination of the optimum reinforcement in terms of fiber content and length. The jute randomly mixed in clayey soil samples were tested for its engineering property (Strength) by performing various tests on a number of samples by using the different percentage of fibers and comparing the results with the non-reinforced soil.. The test result reveals that the strength significantly improves with the inclusion of jute and also prevents the sample from cracking. 1.2. PROBLEM FORMULATION AND ANALYSIS In this experimental research program, the property of Soil sample made is done. Discussion about the material used is done. The basic tests carried out on Soil samples are also discussed, followed by a brief description about water content of soil. Then the various tests conducted on the samples are discussed 1.3 MATERIAL USED
In this Research experimental program the material used as stabilizer is GeoJute. Various tests performed on this material are also discussed here and experimentally it is proved by the research that the soil changes its property after adding the Geo Jute 1.4 SOIL The Sandy Clayey soil is obtained from M.I.E.T MOHRI CAMPUS, KURUKSHETRA, HARYANA (INDIA). According to Unified Soil Classification system, the soil was classified as clayey sand with low plasticity (CL). The index and engineering properties are determined and are discussed here in this research paper 2-:METHODOLOGY In this Research i have adopted a method and tried to stabilize the soil with the material which has many uses besides using in soil stabilizatio ,like clothing etc. All natural vegetable fibres are biodegradable obviously jute is a natural fibre. And all jute and jute products are biodegradable, photo-degradable, nontoxic, anionic, hydrophilic, acidic, less extensible, high moisture and UV absolving capacity, droppable, visco-elastic, composite
fibre. Carbon, hydrogen and oxygen are major elements. It’s three dimensional composite structures are formed by different chemical, physical and hydrogen bonds between, cellulose, hemi-cellulose and lignin. As a natural fibre jute products are biodegradable, reusable and easily disposable consequently to determine its environment and ecological compatibility and economic sustainable life cycle assessments. In this i added jute in different proportions in cohesive soil i.e. Clay and tried to stabilize it under severe conditions, results of which we will find in further portion of the report. We have performed various tests like atterberg’s limit, modified proctor test, direct shear test etc. Step 1-Soil Sample Collection Step 2-Tests of Soil: Various tests of soil are: 1-Moisture content 2-Specific gravity 3-Compaction 4-Direct Shear Step 3-Determination of shear Strength,Maximum Dry Density ,and optimum Moisture content of a soil sample before and after adding Geo Jute, 2.1. Determination of Water Content of Soil Testing objectives: Determination of the natural water content of the given soil sample. Testing conforms to ASTM D2216-90. Aim of the test: In almost all soil tests natural moisture content of the soil is to be determined. The knowledge of the natural moisture content is essential in all studies of soil mechanics. To sight a few, natural moisture content is used in determining the bearing capacity and settlement. The natural moisture content will give an idea of the state of soil in the field. Definition: The natural water content also called the natural moisture content is the ratio of the weight of water to the weight of the solids in a given mass of soil. This ratio is usually expressed as percentage. Device: 1. Non-corrodible air-tight container. 2. Electric oven, maintain the temperature between 105C to 115 C

International Research Journal of Engineering and Technology (IRJET) e-ISSN: 2395-0056
Volume: 04 Issue: 08 | Aug -2017 www.irjet.net p-ISSN: 2395-0072
© 2017, IRJET | Impact Factor value: 5.181 | ISO 9001:2008 Certified Journal | Page 1656
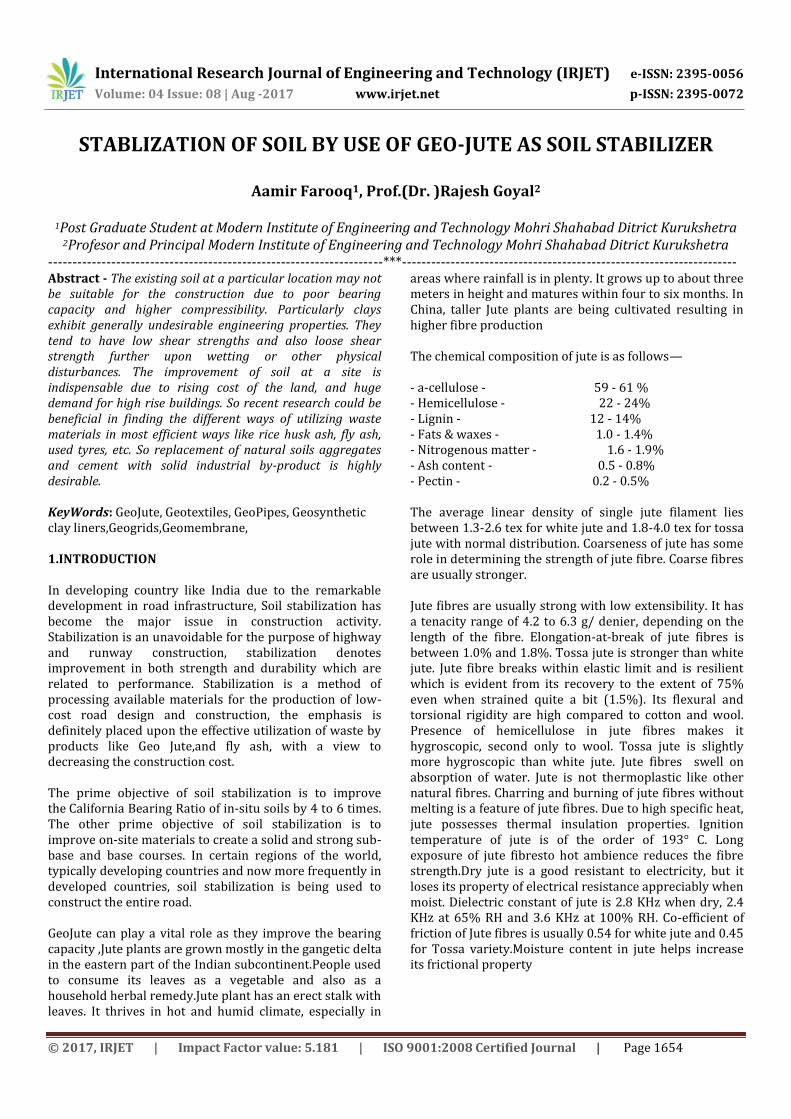
3.Desiccator. 4. Balance of sufficient sensitivity.
Apparatus for Determination of Water content Test procedure: 1. Clean the container with lid dry it and weigh it (W1). Make sure you do this after you have tarred the balance. 2. Take a specimen of the sample in the container and weigh with lid (W2). 3. Keep the container in the oven with lid removed. Dry the specimen to constant weight maintaining the temperature between 1050 C to 1100 C for a period varying with the type of soil but usually 16 to 24 hours. 4. Record the final constant weight (W3) of the container with dried soil sample. Peat and other organic soils are to be dried at lower temperature (say 600 ) possibly for a longer period. Certain soils contain gypsum which on heating loses its water if crystallization. If it is suspected that gypsum is present in the soil sample used for moisture content determination it shall be dried at not more than 800 C and possibly for a longer time. Running the test and recording the data: Data and observation sheet for water content determination Interpreting and Reporting:
1 Weight of can, W1 (g)
2 Weight of can + wet soil W2 (g)
3 Weight of can + dry soil W3 (g)
4 Water/Moisture contentW (%) = [(W2W3)/(W3W1)]100
Result: The natural moisture content of the soil sample is (This is what you find) General Remarks: 1. A container with out lid can be used, when moist sample is weighed immediately after placing the container and oven dried sample is weighed immediately after cooling in desiccator. 2. As dry soil absorbs moisture from wet soil, dried samples should be removed before placing wet samples in the oven. 2.2: Determination of specific gravity of soil Equipment & Apparatus
• Pycnometer • Sieve(4.75 mm) • Vacuum pump • Oven • Weighing balance • Glass rod
Preparation of sample: After receiving the soil sample it is dried in oven at a temperature of 105 to 1150C for a period of 16 to 24 hours. Procedure:
• Dry the pycnometer and weigh it with its cap(W1) • Take about 200 g to 300 g of oven dried soil
passing through 4.75mm sieve into the pycnometer and weigh again(W2)
• Add water to cover the soil and screw on the cap. • Shake the pycnometer well and connect it to the
vacuum pump to remove entrapped air for about 10 to 20 minutes.
• After the air has been removed, fill the pycnometer with water and weigh it (W3).
• Clean the pycnometer by washing thoroughly. • Fill the cleaned pycnometer completely with
water upto its top with cap screw on. • Weigh the pycnometer after drying it from the
outside thoroughly (W4). Calculation: The Specific gravity of soil solids (Gs) is calculated using the following equation.
Where W1=Empty weight of pycnometer W2=Weight of pycnometer + oven dry soil
International Research Journal of Engineering and Technology (IRJET) e-ISSN: 2395-0056
Volume: 04 Issue: 08 | Aug -2017 www.irjet.net p-ISSN: 2395-0072
© 2017, IRJET | Impact Factor value: 5.181 | ISO 9001:2008 Certified Journal | Page 1657
W3=Weight of pycnometer + oven dry soil + water W4=Weight of pycnometer + water full Report: The result of the specific gravity test is reported to the nearest two digits after decimal. Safety & Precautions
• Soil grains whose specific gravity is to be determined should be completely dry. • If on drying soil lumps are formed, they should be broken to its original size. • Inaccuracies in weighing and failure to completely eliminate the entrapped air are the main sources of error. Both should be avoided.
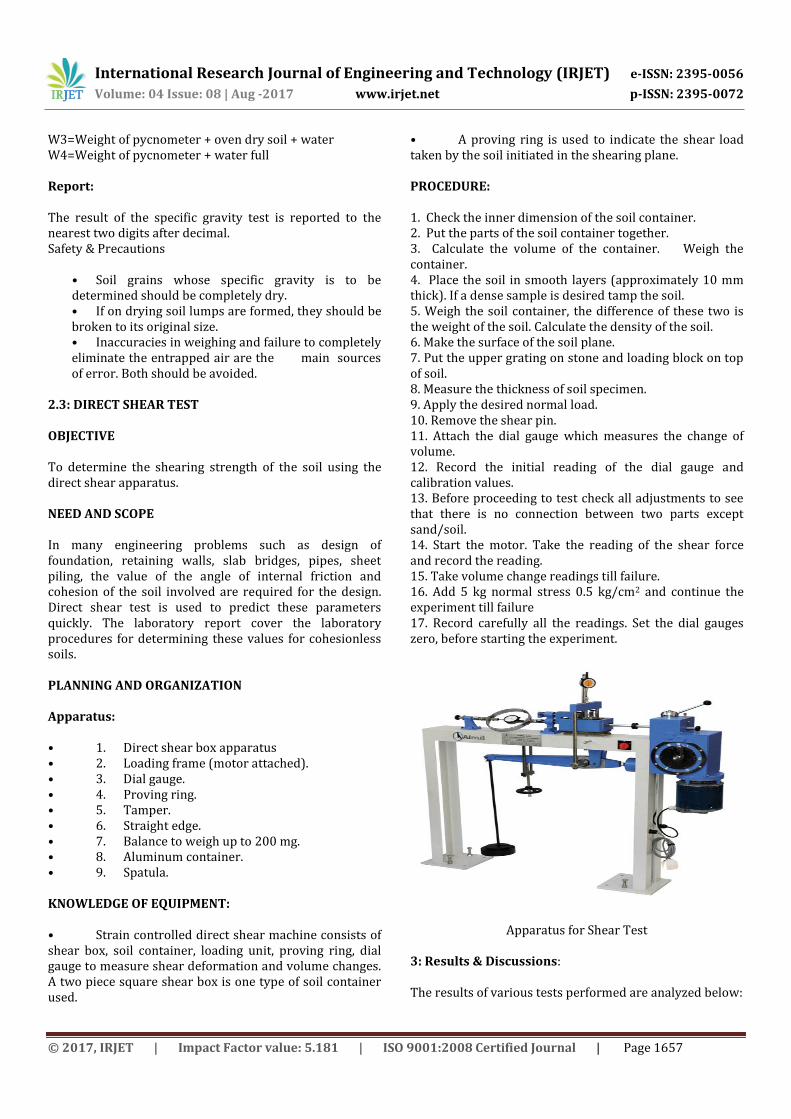
2.3: DIRECT SHEAR TEST OBJECTIVE To determine the shearing strength of the soil using the direct shear apparatus. NEED AND SCOPE In many engineering problems such as design of foundation, retaining walls, slab bridges, pipes, sheet piling, the value of the angle of internal friction and cohesion of the soil involved are required for the design. Direct shear test is used to predict these parameters quickly. The laboratory report cover the laboratory procedures for determining these values for cohesionless soils. PLANNING AND ORGANIZATION Apparatus: • 1. Direct shear box apparatus • 2. Loading frame (motor attached). • 3. Dial gauge. • 4. Proving ring. • 5. Tamper. • 6. Straight edge. • 7. Balance to weigh up to 200 mg. • 8. Aluminum container. • 9. Spatula. KNOWLEDGE OF EQUIPMENT: • Strain controlled direct shear machine consists of shear box, soil container, loading unit, proving ring, dial gauge to measure shear deformation and volume changes. A two piece square shear box is one type of soil container used.
• A proving ring is used to indicate the shear load taken by the soil initiated in the shearing plane. PROCEDURE: 1. Check the inner dimension of the soil container. 2. Put the parts of the soil container together. 3. Calculate the volume of the container. Weigh the container. 4. Place the soil in smooth layers (approximately 10 mm thick). If a dense sample is desired tamp the soil. 5. Weigh the soil container, the difference of these two is the weight of the soil. Calculate the density of the soil. 6. Make the surface of the soil plane. 7. Put the upper grating on stone and loading block on top of soil. 8. Measure the thickness of soil specimen. 9. Apply the desired normal load. 10. Remove the shear pin. 11. Attach the dial gauge which measures the change of volume. 12. Record the initial reading of the dial gauge and calibration values. 13. Before proceeding to test check all adjustments to see that there is no connection between two parts except sand/soil. 14. Start the motor. Take the reading of the shear force and record the reading. 15. Take volume change readings till failure. 16. Add 5 kg normal stress 0.5 kg/cm2 and continue the experiment till failure 17. Record carefully all the readings. Set the dial gauges zero, before starting the experiment.
Apparatus for Shear Test 3: Results & Discussions: The results of various tests performed are analyzed below:

International Research Journal of Engineering and Technology (IRJET) e-ISSN: 2395-0056
Volume: 04 Issue: 08 | Aug -2017 www.irjet.net p-ISSN: 2395-0072
© 2017, IRJET | Impact Factor value: 5.181 | ISO 9001:2008 Certified Journal | Page 1658
Determination of Water Content in Soil
S.No.
Can No. Sample 1
Sample 2
Sample3
1 Weight of can, W1
(g) 316 418 324
2 Weight of can + wet soil W2 (g)
366 475 364
3 Weight of can + dry soil W3 (g)
360 468 360
4 Water/Moisture content W (%) = [(W2-W3)/(W3-W1)]´100
13% 14% 12.5%
Result: The natural moisture content of the soil sample is 13.16%. 3.1 COMPACTION TEST Case 1:Parent Soil Reading of Proctor Test
Sa
mp
le
Samp
le
% o
f Wa
ter
We
igh
t Of M
ou
ld
(kg)
We
igh
t o
f so
il a
nd
m
ou
ld
(kg)
We
igh
t of so
il (k
g)
Vo
lum
e o
f mo
uld
(cc)
Bu
lk
(kg
D
en
sity/
cu.m
)
Dry
De
nsity
kg
/cu
.m
1. 5% 4.380 8.74 4.36 20
55
21
21
.65
20
20
.61
2. 8% 4.380 8.91 4.53 20
55
22
07
.29
20
43
.70
3. 12%
4.380 8.98 4.60 20
55
21
84
.91
19
51
.88
4. 14%
4.380 8.65 4.27 20
55
20
77
.85
18
22
.41
5. 18%
4.380 8.54 4.16 20
55
14
82
.54
12
51
.64
Water Content for soil sample from Proctor Test
Sample Weight of empty can (g)
Weight of can and wet soil (g)
Weight of can and dry soil (g)
% Water Content
1. 166 208 202 16%
2. 106 182 170 18% 3. 122 208 196 24% 4. 126 236 212 27% 5. 86 210 180 31%
Relation between OMC and MDD
MDD (kg/m³
2020.6 2043.7 2016.6 1822.4 1394
W.C % 16 18 24 27 31 Water Content for soil sample from Proctor Test
Sample Weight of empty can (g)
Weight of can and wet soil (g)
Weight of can and dry soil (g)
% Water Content
1. 166 208 202 16% 2. 106 182 170 18% 3. 122 208 196 24% 4. 126 236 212 27% 5. 86 210 180 31%
Relation between OMC and MDD
MDD (kg/m³
2020.6 2043.7 2016.6 1822.4 1394.2
W.C.(%)
16 18 24 27 31

International Research Journal of Engineering and Technology (IRJET) e-ISSN: 2395-0056
Volume: 04 Issue: 08 | Aug -2017 www.irjet.net p-ISSN: 2395-0072
© 2017, IRJET | Impact Factor value: 5.181 | ISO 9001:2008 Certified Journal | Page 1659
Case2: Soil with 0.5% JUTE (By Weight) Reading of Proctor Test
Samp
le
% o
f Water
Weigh
t O
f M
ou
ld
Weigh
t o
f so
il an
d
mo
uld
W
eight
of
soil
Vo
lum
e o
f m
ou
ld(cc)
Bu
lk
Den
sity (k
g/m³
Dry
D
ensity
(k
g/m³
1. 5% 4.380 8.700 4.32
20
55
20
43
.70
19
46
.38
2. 8% 4.380 8.844 4.46
20
55
21
72
.26
20
11
.35
3.
12%
4.380 8.910 4.53
20
55
21
74
.20
19
42
.03
4. 14%
4.380 8.724 4.34 2
05
5
21
13
.86
18
54
.26
Water Content of soil sample from Proctor Test
Sample Weight of empty can (g)
Weight of can and wet soil (g)
Weight of can and dry soil (g)
% Water Content
1. 134 208 204 5.71% 2. 138 184 180 11.9% 3. 142 208 198 17.85% 4. 130 218 202 22.22% 5. 138 210 1900 38.46%
Relation between OMC and MDD
MDD kg/m³
1946.38
2011.35
1985.9
1854.26
1769.48
W.C % 5.71 11.9 17.85 22.22 34.46
Case 3: Soil with 1% jute (By Weight) Reading of Proctor Test
Samp
le
% o
f Water
Weigh
t O
f M
ou
ld
(kg)
Weigh
t o
f so
il an
d
mo
uld
(k
g)
Weigh
t o
f so
il (k
g)
Vo
lum
e o
f m
ou
ld
(cc)
Bu
lk D
ensity
(k
g/cu.m
)
Dry
D
ensity
(k
g/cu.m
)
1. 5%
4.380 8.640 4.260 20
55
20
72
.90
19
74
.19
2. 8%
4.380 8.810 4.430 20
55
21
55
.71
19
96
.02
3. 12%
4.380 8.936 4.556 20
55
21
58
.63
18
91
.45
4. 14%
4.380 8.756 4.376 20
55
21
29
.44
18
67
.92
5. 18%
4.380 8.654 4.274 20
55
19
34
.54
16
20
.88
Water Content of soil sample from Proctor Test
Sample Weight of empty can (g)
Weight of can and wet soil (g)
Weight of can and dry soil (g)
% Water Content
1. 146 196 194 4.16% 2. 128 172 168 10% 3. 136 192 180 27.27% 4. 146 272 254 31% 5. 142 210 192 36%

International Research Journal of Engineering and Technology (IRJET) e-ISSN: 2395-0056
Volume: 04 Issue: 08 | Aug -2017 www.irjet.net p-ISSN: 2395-0072
© 2017, IRJET | Impact Factor value: 5.181 | ISO 9001:2008 Certified Journal | Page 1660
Relation between OMC and MDD
MDD (KG/CUMEC)
19
74
.19
19
96
.02
19
97
.32
18
67
.92
17
77
.6
W.C.(%) 4.16 10 27.27 31 36
Case:4-Soil with 1.5% jute (By Weight) Reading Of Proctor Test
Samp
le
% o
f Water
Weigh
t Of M
ou
ld
(kg)
Weigh
t o
f so
il an
d m
ou
ld (k
g)
Weigh
t of so
il (k
g)
Vo
lum
e of m
ou
ld
(cc)
Bu
lk
Den
sity
(kg/cu
.m)
Dry
D
ensity
(k
g/cu.m
)
1. 5% 4.380 8.606 4.226 20
55
20
56
.44
19
58
.51
2. 8% 4.380 8.700 4.320 20
55
21
02
.18
19
46
.46
3. 12%
4.380 8.846 4.466 20
55
21
73
.23
18
91
.45
4. 14%
4.380 8.500 4.120 20
55
20
04
.86
17
58
.64
5. 18%
4.380 8.360 3.980 20
55
19
36
.73
16
20
.88
Water Content of soil sample from Proctor Test
Sample Weight of empty can (g)
Weight of can and wet soil (g)
Weight of can and dry soil (g)
% Water Content
1. 378 518 515 2.18% 2. 150 222 214 12.5% 3. 360 534 510 16% 4. 300 422 390 26%
RELATION BETWEEN MDD AND OMC
MDD kg/m³
1958.5 1946.4 1957.6 1758.6 1655.32
W.C.% 2.18 12.5 16 26 31.77
Case:3-Soil with 2% jute (By Weight) Reading of Proctor Test
Samp
le
% o
f Water
Weigh
t Of M
ou
ld
(kg)
Weigh
t o
f so
il an
d m
ou
ld (k
g)
Mass o
f soil
Vo
lum
e of m
ou
ld
(cc)
Bu
lk
Den
sity
(kg/cu
.m)
Dry
D
ensity
(k
g/cu.m
)
1. 5% 4.38 8.070 3.690 20
55
17
95
.62
17
10
.11
2. 8% 4.38 8.380 4.000 20
55
19
46
.47
18
02
.28
3. 12%
4.38 8.570 4.190 20
55
19
93
.51
18
06
.52
4. 14%
4.380 8.470 4.090 20
55
19
02
.67
17
45
.84

International Research Journal of Engineering and Technology (IRJET) e-ISSN: 2395-0056
Volume: 04 Issue: 08 | Aug -2017 www.irjet.net p-ISSN: 2395-0072
© 2017, IRJET | Impact Factor value: 5.181 | ISO 9001:2008 Certified Journal | Page 1661
Water Content of soil sample from Proctor Test
Sample Weight of empty can (g)
Weight of can and wet soil (g)
Weight of can and dry soil (g)
% Water Content
1. 140 290 280 7.14% 2. 130 162.34 158.20 14.68% 3. 118 190.22 177.80 20.76% 4. 170 278.10 256 25.67% 5. 104 194.80 168.60 41.87%
Relation between OMC and MDD
MDD (kg/m³)
1710.1
1802.2 1836.8
1745.8 1645.3
W.C,(%) 7.14 14.68 20.76 25.67 41.87
Case 6: Soil with 2.5% jute (By Weight) Reading of Proctor Test
Samp
le
% o
f Water
Weigh
t Of M
ou
ld
(kg)
Weigh
t o
f so
il an
d m
ou
ld (k
g)
Mass o
f soil
Vo
lum
e of m
ou
ld
(cc)
Bu
lk
Den
sity
(kg/cu
.m)
Dry
D
ensity
(k
g/cu.m
)
1. 5% 4.38 7.968 3.588 20
55
17
45
.98
16
62
.83
2. 8% 4.38 8.240 3.860 20
55
18
78
.34
17
39
.20
3. 12%
4.38 8.470 4.090 20
55
19
69
.18
17
58
.99
4. 14%
4.38 8.340 3.960 20
55
19
27
.00
16
90
.90
5. 18%
4.38 8.300 3.920 20
55
19
01
.06
16
10
.20
Water Content of soil sample from Proctor Test
Sample Weight of empty can (g)
Weight of can and wet soil (g)
Weight of can and dry soil (g)
% Water Content
1. 140 194 190 8% 2. 182 250 240.60 16.04% 3. 156 204 194.40 25% 4. 142 196.80 184.20 29.85% 5. 166 210 189.60 38%
Relation between OMC and MDD
MDD (kg/m³
1662.83
1739.2
1793.03
1690.9 1630.37
W.C.% 8 16.04 25 29.85 38
3.2 DIRECT SHEAR TEST Here we will analyze the change in properties of soil with the addition of hairs in the soil sample in different proportions.

International Research Journal of Engineering and Technology (IRJET) e-ISSN: 2395-0056
Volume: 04 Issue: 08 | Aug -2017 www.irjet.net p-ISSN: 2395-0072
© 2017, IRJET | Impact Factor value: 5.181 | ISO 9001:2008 Certified Journal | Page 1662
Case 1:Parent Soil For 0.5 kg/cm²
Dial Gauge Proving Ring 0 0 20 0.2 40 0.6 60 3.2 80 3.8 100 4 120 4.2 140 4.6 160 4.8 180 5 200 5.2 220 5.4
240 5.6
260 5.6 280 5.6 300 6.2 320 6 340 5.8
Max. Value at proving ring = 6.2 Now, from table 6.2 x 2.5/6 x6 =0.431 N/cm² For 1.0 kg/sq.cm
Dial Gauge Proving Ring 0 0 20 4.8 40 5.8 60 6.2 80 6.8 100 7.4 120 7.6 140 8.2 160 8.6 180 9,2 200 9,8 220 10.6 240 11 260 11.6 280 12 300 12.4 320 12.6 340 13 360 13.4 380 13.6 420 13.6 440 13.6 460 13.2
Max. Value at proving ring = 13.6 Now, from table 13.6x 2.5/6 x6 =0.944 N/sq.cm For 1.5 kg/sq.cm
Dial Gauge Proving Ring 20 3.8 40 5 60 6 80 7.6 100 8.6 120 9.4 140 10.2 160 11.2 180 11.8 200 12.2 220 12.8 240 13.2 260 13.8 280 14.2 300 14.4 320 14.6 340 14,8 360 15 380 15.4 400 15.6 420 16 440 16.2 460 16.4 480 16.6 500 16.8 520 17 540 17.2 560 17.4 580 18 600 18 620 18.2 640 17.2 660 16.4
Max. Value at proving ring = 18.2 Now, from table 18.2x 2.5/6 x6 =1.26 N/sq.cm

International Research Journal of Engineering and Technology (IRJET) e-ISSN: 2395-0056
Volume: 04 Issue: 08 | Aug -2017 www.irjet.net p-ISSN: 2395-0072
© 2017, IRJET | Impact Factor value: 5.181 | ISO 9001:2008 Certified Journal | Page 1663
Relation between normal stress and shear stress: Case 2: Soil With 0.5% Jute (By weight) For 0.5 kg/sq.cm
Dial Gauge Proving Ring 20 6.3 40 6.7 60 7.1 80 7.3 100 6.8 120 6.4
Max. Value at proving ring = 7.3 Now, from table 7.3x 2.5/6 x6 =0.506 N/sq.cm For 1.0 kg/cm²
Dial Gauge Proving Ring 20 4.5 40 5.5 60 6.3 80 6.9 100 7.5 120 7.9 140 8.5 160 8.9 180 9.3 200 9.7 220 10.1 240 10.5 260 11.1 280 11.3 300 11.5 320 11.7 340 11.9 360 12.3 380 12.7 400 12.9 420 12.9 440 12.5
460 12.3
Max. Value at proving ring = 12.9 Now, from table 12.9x 2.5/6 x6 =0.97 N/sq.cm For 1.5 kg/cm ²
Dial Gauge Proving Ring 20 0.9 40 0.9 50 7.9 80 10.5 100 11.5 120 12.3 140 13.7 160 14.7 180 15.5 200 16.1 220 17.3 240 17.9 260 18.1 280 18.7 300 19.5 320 19.9 340 20.3 360 20.9 380 21.1 400 21.5 420 21.1
Max. Value at proving ring = 21.5 Now, from table 21.5x 2.5/6 x6 =1.49 N/sq.cm
Relation between normal stress and shear stress 4.RESULTS AND DISCUSSION The effect of mixing Jute fiber in soil on its compaction values is as follows:

International Research Journal of Engineering and Technology (IRJET) e-ISSN: 2395-0056
Volume: 04 Issue: 08 | Aug -2017 www.irjet.net p-ISSN: 2395-0072
© 2017, IRJET | Impact Factor value: 5.181 | ISO 9001:2008 Certified Journal | Page 1664
Maximum dry density vs. fiber content This shows that with increasing fiber content dry density of soil decreases with a constant rate Results from direct shear test on different values of Jute fiber shows following result: Max shear stress vs. normal stress This graph shows that shear strength of soil increases with increase in Jute fiber content. 5.CONCLUSION
• By increasing the jute fiber content percentages MDD decreases and OMC increases.
• For avoiding the balling of the hair fiber more studies are required to find randomly mixing methods of the fiber without balling effect so that better results are obtained in the future.
• Geojute or jute geotextile has many potential applications in civil construction works. The engineering properties of jute fabrics are suitable for separation, reinforcement, drainage and filtration functions and can be suitably used in overcoming geotechnical problems of weak soil. Applied research including performance evaluation of geojute applications are needed to highlight the beneficial uses of geojute in the field.
The Jute Geotextile has the potential of being used to serve as a filter fabric as well as a fabric reinforcement to stabilize and protect weak subgrades in road construction. When the jute fabric is placed directly on the subgrade and topped with a granular backfill to form a sub base for the pavement, it is found to function in a threefold way :
• It separates the subgrade from sub-base thus preventing the punching of the base material into the subgrade and at the same time the fines from the subgrade are also prevented from gaining entry into the road structures,
• It acts as drainage layer to remove excess water from softening the subgrade, and
• It helps to improve the bearing capacity and settlement behaviour of the subgrade by virtue of its action as a fabric reinforcement.
The Jute Geotextile is expected to contribute towards better road performance by reducing road defects with the consequent reduction in maintenance costs. The economy resulting in reduced road thickness design and construction time is an added bonus. While the jute geotextile appears to function quite close to synthetic ones in performance, its durability aspect seems to pose a limitation on its use. However, jute geotextile is found to
be fairly resistant to deterioration when embedded in wet soil under a narrow, margin of annual variation in subgrade water content (18% to 30%) and subgrade temperature (25°C to 30°C) conditions prevailing in the geographical region of Southeast Asia,. There is little doubt that the jute fabric and jute mats are initially very strong and ideal for use as a geotextile material. After it is placed on the weak subgrade, the subgrade stiffens and becomes stronger on consolidation within about a year or so under the action of granular sub-base surcharge, self weight of pavement, construction rolling and traffic loads. The jute geotextile immensely helps in this rapid subgrade strengthening process in combination with the drainage layer above it. With time, the subgrade becomes less and less dependent on the fabric for its stability and therefore, the long term durability aspect of jute fabric should not deter its use as a geotextile for various applications in road construction. Jute geotextile materials are biodegradable and their uses in various geotechnical engineering applications are ecologically safe. Jute fabric is useful for developing countries of the Asia-Pacific Region as a money saver as well as a construction expedient. The advantages resulting by its use will more than outweigh the cost of the material and laying. Being in the vicinity of the jute producing countries (Bangladesh, India, China, Indonesia and Thailand), the developing countries of this region can harness the benefits of jute fabric especially for the purposes of soil stabilization, slope protection and erosion control. For these countries, the jute fabric could serve as an economical alternative to the imported versions for certain applications resulting in substantial savings in terms of foreign exchange 6.. RESEARCH WORK FOR FUTURE It should be pointed out that since the influences of engineering properties of soil and fiber and the scale effects on the stress– strain–strength characteristics of fiber reinforced soils have not been investigated fully, the actual behavior of fiber reinforced soils is not yet well known. Hence, further studies including especially large-scale tests are needed to better understand the behavior of fiber-reinforced soils. As well, further studies are necessary to elucidate the fracture mechanism, the effect of prior treatment of the fibers and the durability of the composite at long term and under more severe conditions. In particular, the effects of drainage and pore pressures on the effective strength of the fiber–soil mixture, and creep along the fiber–soil interface, are of particular interest. In addition, further study is needed to optimize the size and the shape of fibers and/or strips, e.g. crimp magnitude and crimp frequency. Measurement of durability and aging

International Research Journal of Engineering and Technology (IRJET) e-ISSN: 2395-0056
Volume: 04 Issue: 08 | Aug -2017 www.irjet.net p-ISSN: 2395-0072
© 2017, IRJET | Impact Factor value: 5.181 | ISO 9001:2008 Certified Journal | Page 1665
of fibers in soil is recommended. Large scale test is also needed to determine the boundary effects influence on test results. Very few studies have been carried out on freezing–thawing behavior of soils reinforced with discrete fiber inclusions. It is suggested that large volumes of recycled waste fibers can be used as a value-added product to enhance the shear strength and load deformation response of soils. In this way, using recycled waste tire cords in soil reinforcement seems to be attractive. More investigations on the performance of composite soils reinforced with polyvinyl alcohol (PVA) fibers are required. It is Fig. 6. Schematic of the effect of fiber deformation due to moisture changes. 112 S.M. Hejazi et al. Construction and Building Materials 30 (2012) 100–116 important to know that the studies on behavior of soils reinforced with randomly distributed elements under cyclic loading are very limited in the literature. More research is needed to further understand the potential benefits and limitations and to allow fibers’ application to more complex geotechnical structures. It is emphasized that research on the use of fiber-reinforcement with cohesive soils has been more limited. Although fiber-reinforcement was reported to increase the shear strength of cohesive soils, such improvement needs additional evaluation because the load transfer mechanisms on the interface between fibers and clayey soils are not clearly understood. 7. REFERENCES
1. UNCTAD/GATT (1986). Use of Jute Fabrics in Erosion Control. Jute Market Promotion Project No. RAS / 77/04. International Trade Centre, Geneva.
2. UNCTAD/GATT (1985). Jute Geotextiles for Erosion Control-draft Specifications and Installation Guide.
3. Jute Market Promotion Programme, Division of Product and Market Development. International Trade Centre. Geneva.
4. UNCTAD/GATT (1985). Jute Geotextiles Control Systems. Jute Market Promotion Project. International Trade Centre, Geneva.
5. BJRI (1974). Jute and Jute Products. Bangladesh Jute Research Institute. Brochure of the Agricultural and Industrial Exhibition. No. BGP 73/74, 4351B-2000, Dhaka, Bangladesh.
6. Ingold, I.S. ed (1984), Geotextiles and Geomembranes. An International Journal, Elsevier Applied Science Publishers, London, Vol. 1,1-40.
7. Geotextile Engineering Manual. US-Federal Highway Administration, National Highway Institute, Washington D.C., USA.
8. Nagarkar, P.K., Kulkarni, V.T. and Desai, G.V. (1980). Use of Fabrics in Civil Engineering Construction. Proc. Indian Road Congress, New Delhi, pp 5-17.
9. Aggarwal, P. and Sharma, B. (2010),“Application of Jute Fibre in the Improvement of Subgrade Characteristics”
10. Charan H.D. (1995). “Probabilistic analysis of randomly distributed fibre soil.” Ph.D. Thesis, Dept. of Civil Engg. I.I.T Roorkee, Roorkee, India.
11. IS: 2720, Part XVI, 1965. Laboratory determination of CBR, Bureau of Indian Standards; New Delhi.
12. IS: 2720, Part VII, 1965. “Determination of Moisure content –Dry density Relation using Light Compaction”, Bureau of Indian Standards; New Delhi.
13. Ranjan, G., Vasan, R.M. and Charan, H.D. (1996), "Probabilistic analysis of randomly distributed fibre-reinforced soil." ]oumal of Geotechnical Engineering, ASCE, 122(6): 419-426.
BIOGRAPHIES
The Author is PG student at MIET kurukshetra university and can be contacted on +919419009051
Proffesor and Principal Modern Institute of Engineering and Technology