stabilization of silicon and germanium based high capacity
TRANSCRIPT

University of South CarolinaScholar Commons
Theses and Dissertations
2018
Stabilization Of Silicon And Germanium BasedHigh Capacity Anodes For Lithium Ion BatteriesKuber MishraUniversity of South Carolina
Follow this and additional works at: https://scholarcommons.sc.edu/etd
Part of the Chemical Engineering Commons
This Open Access Dissertation is brought to you by Scholar Commons. It has been accepted for inclusion in Theses and Dissertations by an authorizedadministrator of Scholar Commons. For more information, please contact [email protected].
Recommended CitationMishra, K.(2018). Stabilization Of Silicon And Germanium Based High Capacity Anodes For Lithium Ion Batteries. (Doctoraldissertation). Retrieved from https://scholarcommons.sc.edu/etd/4566

STABILIZATION OF SILICON AND GERMANIUM BASED HIGH CAPACITY
ANODES FOR LITHIUM ION BATTERIES
by
Kuber Mishra
Bachelor of Science
University of Louisiana, 2012
Submitted in Partial Fulfillment of the Requirements
For the Degree of Doctor of Philosophy in
Chemical Engineering
College of Engineering and Computing
University of South Carolina
2018
Accepted by:
Xiao-Dong Zhou, Major Professor
Ralph E. White, Committee Member
Michael A. Matthews, Committee Member
John W. Weidner, Committee Member
Ji-Guang Zhang, Committee Member
Cheryl L. Addy, Vice Provost and Dean of the Graduate School

ii
© Copyright by Kuber Mishra, 2018
All Rights Reserved.

iii
ACKNOWLEDGEMENTS
First of all, I would like to express my sincere gratitude to my advisor Dr. Xiao-
Dong Zhou, for providing me an opportunity to be part of his group and helping me realize
the path of an independent researcher. His continued guidance and support has encouraged
me to stay focused and pursue my goals.
I would also like to thank my committee members Dr. Ralph E. White, Dr. Michael
A. Matthews, and Dr. Ji-Guang Zhang for their valuable time and constructive criticism.
My group members Dr. Emir Dogdibegovic and Dr. Pranav Sharma also deserve many
thanks from me.
In addition, many thanks go to my colleagues at the Pacific Northwest National
Laboratory (PNNL), where I was lucky enough to work as intern for nearly a year, with
some of the well-known leaders in the energy storage research.
Finally, I would like to thank my friends who were always supporting me,
particularly during the tough times. Graduate school had been a tough journey for me, and
glad that it is finally over.
To my parents, who always wondered when would I be done with the school, while
many of my classmates already started families and had decent jobs even before I started
grad school, thank you for your patience.

iv
ABSTRACT
Lithium-ion batteries (LIBs) have been the driver of the widespread application of
portable electronics. As the electronic devices have been more powerful and versatile, the
pressing demand for higher energy density batteries have led the extensive explorations of
novel materials for high capacity electrodes. Despite several breakthroughs in literature,
the current state of art LIBs still uses the battery chemistry developed in early 1990s.The
keys challenges for switching to other high capacity electrodes have been high cost, non-
linear scalability and poorer electrochemical performance. This dissertation focusses on
development of high capacity electrodes in order to increase the energy density of the
current state of art lithium ion batteries by using scalable synthesis techniques while
investigating the structure-property-performance relations for different materials.
Initial work focused on the examination of the role of morphology on the
electrochemical performance of germanium anode for lithium ion batteries. This was
followed by the study of mass loading on the electrochemical performance of high capacity
germanium(Ge) anodes (Chapter 2). More than 100 cycles with high areal capacities (>3
mAh/cm2) are observed with Ge for the first time. Analysis of electrode phase and
morphology changes before and after cycling revealed the ability of Ge grains to maintain
contact with each other, a key requirement for stable electrochemical performance. To
exploit the intrinsic properties of Ge electrode as well as to reduce the amount of expensive
Ge in the electrode, solid solutions of the Si and Ge with various compositions were

v
synthesized by solid state synthesis and their performances were examined for LIBs
(Chapter 3). Lattice strain was calculated to be highest for Si0.5Ge0.5 suggesting largest
resistance to plastic deformation. As expected, Si0.5Ge0.5 offered highest specific capacity
(~1560 mAh/g) and highest the capacity retention (87.5%) for 80 cycles. The promising
results achieved in SixGe1-x electrode still required substantial amount (~72 wt%) of Ge.
Therefore, with the objective of further reducing the fraction of Ge in the electrodes, thin
layers of C and Ge were coated on Si to stabilize the electrochemical performance
(Chapter 4). The silicon-germanium-carbon (Si@Ge@C) core shell electrodes
synthesized at low temperature (580°C) offered superior electrochemical performance
(~80% capacity retention after 200 cycles) owing to improved electron conduction and
mechanical stability. Finally, a low temperature aluminothermic reduction technique for
the synthesis of porous Si was developed and the effect of carbon coatings on the cyclic
stability was investigated (Chapter 5).

vi
TABLE OF CONTENTS
Acknowledgements ............................................................................................................ iii
Abstract .............................................................................................................................. iv
List of Tables ................................................................................................................... viii
List of Figures .................................................................................................................... ix
List of Symbols ................................................................................................................ xiv
List of Abbreviations .........................................................................................................xv
: Introduction ..................................................................................................... 1
1.1 Lithium-ion batteries (LIBS) ..................................................................................... 1
1.2 Calculation of molar volume change ........................................................................ 6
1.3 High-capacity electrodes for LIBs ............................................................................ 7
1.4 Fracture mechanics and critical size .......................................................................... 8
1.5 Factors that affect the electrochemical performance in high capacity anodes ........ 10
1.6 Approaches to achieve cyclic stability for high capacity anodes ............................ 12
1.7 Objective of thesis ................................................................................................... 19
References ................................................................................................................. 21
: The Role of Mass Loading on The Electrochemical Properties of a High-
Capacity Anode for Lithium-Ion Batteries ....................................................................... 26
2.1 Introduction ............................................................................................................. 26
2.2 Experimental ........................................................................................................... 28
2.3 Results and Discussion ............................................................................................ 29

vii
2.4 Conclusion ............................................................................................................... 37
References ................................................................................................................. 39
: Submicro-Sized Silicon-Germanium Solid Solutions with High Capacity and
Long Cyclability for Lithium Ion Batteries ...................................................................... 42
3.1. Introduction ............................................................................................................ 42
3.2. Experimental .......................................................................................................... 44
3.3. Results and Discussion ........................................................................................... 45
3.4. Conclusions ............................................................................................................ 66
References ................................................................................................................. 68
: Submicron Silicon Anode Stabilized by Single Step Carbon and Germanium
Coatings for High Capacity Lithium-Ion Batteries ........................................................... 71
4.1 Introduction ............................................................................................................. 71
4.2 Experimental ........................................................................................................... 74
4.3 Results and Discussion ............................................................................................ 75
4.4 Conclusions ............................................................................................................. 91
References ................................................................................................................. 93
chapter 5 : High Performance Porous Silicon@C Anode Synthesized by Low
Temperature Aluminothermic Reaction ........................................................................... 96
5.1 Introduction ............................................................................................................. 96
5.2 Experimental ........................................................................................................... 99
5.3 Results and Discussion .......................................................................................... 101
5.4 Conclusion ............................................................................................................. 116
References ............................................................................................................... 117

viii
LIST OF TABLES
Table 1.1 Reactions at the cathode and anode in a lithium-ion cell ................................... 3
Table 1.2 Calculation of theoretical specific capacities of selected electrodes .................. 4
Table 3.1 EDS analysis the chemical composition of Si-Ge solid solutions .................... 50
ix
LIST OF FIGURES
Figure 1.1. A schematics of a typical lithium ion battery .................................................. 2
Figure 2.1. SEM images of (a) commercialGeO2 (b) porous Ge, (c) TEM image of porous
Ge particle and (d) Powder XRD reflections of the commercial GeO2 and Ge reduced from
it at 450 ºC, (e) Nitrogen adsorption/desorption isotherm of porous Ge .......................... 29
Figure 2.2 (a) Cyclic performance of porous Ge electrode at the current density of 1000
mA∙g-1, and corresponding (b) voltage profile and (c) differential capacity plots and (d)
cyclic performance at the high current density of 8 A∙g-1, after 20 formation cycles at 800
mA∙g-1. .............................................................................................................................. 30
Figure 2.3 Rate performance of Ge electrode at different current densities .................... 33
Figure 2.4. Cyclic performance of porous Ge electrodes with high mass loadings (a), and
the areal capacity as a function of various mass loadings (b) Both (a) and (b) are obtained
at the current density of 1 mA∙cm-2. The mass loadings involve the mass of binder as well
as the conductive agents.................................................................................................... 33
Figure 2.5 Electrochemical performance of porous Ge electrode, (a) cyclic performance
of Ge and LCO full cell at 0.4 mA∙cm-2 . The capacity loadings on Ge and LCO were 1.55
and 1.856 mAh∙cm-2 respectively. (b) corresponding voltage profile and (c) differential
capacity plot for (a). (d) cyclic performance of Ge vs LCO full cell at 1 mA∙cm-2 .......... 34
Figure 2.6 TEM images and selected area electron diffraction (SAED) pattern of porous
Ge (a and b) before cycling and (c and d) after 10 cycles at 100 mA g-1. ........................ 36
Figure 3.1 XRD patterns of Si, Ge and Si-Ge solid solution series ................................. 48
Figure 3.2 TEM images and elemental mapping for Si, Ge and both components for
Si0.25Ge0.75 (a, b,c and d), Si0.5Ge0.5 (e,f,g,h) and Si0.75Ge0.25 (i,j,k,l). ............................... 49
Figure 3.3 Lattice Constant and Strain in Si-Ge Solid Solution Series. .......................... 51
Figure 3.4 SEM images of (a) Si, (b) Si0.25Ge0.75, (c) Si0.50Ge0.50, (d) Si0.75Ge0.25and (e) Ge
before cycling.................................................................................................................... 52

x
Figure 3.5 Cyclic capacity performance of (a) Si, (b) Si0.75Ge0.25, (c) Si0.50Ge0.50, (d)
Si0.25Ge0.75 and (e) Ge. (f) Voltage profiles of Ge0.50Si0.50 electrode. The first 5 cycles were
measured at the current density of 100 mA g-1 while the rest were obtained at 500 mA g-1.
Capacity is based on total weight of electrode.................................................................. 53
Figure 3.6 Voltage profile for 1st, 2nd, 20th, 40th and 50th cycle for (a) Si, (b) Si0.75Ge0.25,
(c) Si0.25Ge0.75 and (d) Ge electrodes ................................................................................ 55
Figure 3.7 (a) Rate capability of the Si0.50Ge0.50 solid solution at different current densities
(0.1 , 0.5, 1, 2, 4 and 10 A/g). (b) Cyclic capacity performance of Si0.5Ge0.5 electrode at the
current density of 1600 mA g-1, after 5 formation cycles at 200 mA g-1. ......................... 57
Figure 3.8 The differential capacity plots for solid solution electrodes for 1st, 2nd, 20th, 40th
and 50th cycle. (a) Si, (b) Si0.75Ge0.25, (c) Si0.50Ge0.50, (d) Si0.25Ge0.75 and (e) Ge electrodes
at the current density of 100 mA/g for the first five cycles and the rest at 500 mA/g ...... 58
Figure 3.9 Post cycling TEM and elemental mapping images of (a,b,c) Si0.25Ge0.75, (d,e,f)
Si0.5Ge0.5 and (g,h,i) Si0.75Ge0.25 ........................................................................................ 60
Figure 3.10 (a) First two-cycle discharge-charge curves and the corresponding in situ XRD
patterns corrected between 0.01 and 3.0 V at 0.15 A g-1 of the Si0.5Ge0.5 solid solution
anode. Last diffraction scan as background. (b) Discrete XRD, prior to background
subtraction, selected from (a). (c) Selected XRD patterns during the 1st discharge process
of the Si0.5Ge0.5 solid solution anode, prior to background subtraction. ........................... 63
Figure 3.11 (a) First cycle discharge-charge curves and the corresponding in situ XRD
patterns corrected between 0.01 and 3.0 V at 0.2 A g-1 of the Si anode. Last diffraction
scan as background. (b) Selected XRD patterns during the 1st discharge process of the Si
anode, prior to background subtraction ............................................................................ 64
Figure 3.12 First cycle discharge-charge curves and the corresponding in situ XRD
patterns corrected between 0.01 and 2.0 V at 0.05 A g-1 of the Ge anode. Last diffraction
scan as background. (b) Selected XRD patterns during the 1st discharge process of the Ge
anode, prior to background subtraction. ........................................................................... 65
Figure 4.1 SEM images of (a) Si, (b) Si@Ge@C-12, (c) Si@Ge@C-24 and (d)
Si@Ge@C-48 ................................................................................................................... 76
Figure 4.2 SEM images of Si NP (a) before and (b) after C and Ge coating ................... 77
Figure 4.3 TEM elemental mapping of the Si@Ge@C electrode prepared with 20-30 nm
Si core ............................................................................................................................... 77

xi
Figure 4.4 XRD patterns of Si along with the C and Ge coated Si (a) and the corresponding
raman spectrums (b) .......................................................................................................... 78
Figure 4.5 EDX analysis of Si@Ge@C-12. Selected regions/particles are displayed on left
while the corresponding EDX results are displayed on the right. ..................................... 80
Figure 4.6 EDX analysis of Si@Ge@C-24. Selected regions/particles are displayed on left
while the corresponding EDX results are displayed on the right ...................................... 81
Figure 4.7 EDX analysis of Si@Ge@C-48. Selected regions/ particles are displayed on
left while the corresponding EDX results are displayed on the right. .............................. 82
Figure 4.8 (a) Cyclic performance (discharge capacities) of Si, Si@Ge@C-12,
Si@Ge@C-24 and Si@Ge@C-48 electrode at 2 A/g. The current rate of the first three
formation cycles was 200 mA/g. (b) rate performance of the four electrodes at different
current densities. ............................................................................................................... 83
Figure 4.9 Coulombic efficiency (CE) of the core shell electrodes. FCE stands for first
cycle efficiency. CEs from second cycles are presented above ........................................ 84
Figure 4.10 Differential capacity plots for (a) Si@Ge@C-12, (b) Si@Ge@C-24 and (c)
Si@Ge@C -48 electrodes (d) Si at 50 mA/g .................................................................... 86
Figure 4.11 Raman spectra of the electrodes cycled at 50 mA/g ..................................... 86
Figure 4.12 SEM images of the (a) Si before cycling, (b) Si after cycling, (c) Si@Ge@C-
12 before cycling (d) Si@Ge@C-12 after cycling, (e) Si@Ge@C-24 before cycling, (f)
Si@Ge@C-24 ................................................................................................................... 88
Figure 4.13 Electrochemical impedance spectra of Si, Si@Ge@C-12, Si@Ge@C-24 and
Si@Ge@C-48 after (a) 5 cycles. (b) 20 cycles, (c) the equivalent circuit model used to fit
the experimental data and (d) the charge transfer resistance for each electrode after 5 and
20 cycles. The scatter plots represent the experimental data while the solid lines represent
fitted results. ...................................................................................................................... 91
Figure 5.1 (a)Schematics of the process of synthesis of p-Si and p-Si@C. (b) XRD
spectrum of final p-Si and p-Si@C obtained after reduction in eutectic mixture of AlCl3
and ZnCl2. (c) SEM images of the (c) p-SiO2 at low and high magnification (inset), (d) p-
Si at low and high magnification (inset), (e) SEM images of p-SiO2@C and (f) SEM images
p-Si@C obtained from p-SiO2@C ................................................................................. 102

xii
Figure 5.2 TEM images of (a) pristine p-SiO2, (b) p-Si showing nano crystalline and larger
dense grains, (c) higher magnification of (b) displaying nano-crystallites, and (d) STEM
image of p-Si ................................................................................................................... 102
Figure 5.3 Raman spectra of (a) p-SiO2@C and (b) p-Si@C. ....................................... 103
Figure 5.4 SEM image (a) and the corresponding EDX elemental mapping for (b) C (red),
(c) Si (green), and (d) O (blue) in p-SiO2@C. ................................................................ 104
Figure 5.5 Thermogravimetric analysis (TGA) of p-Si@C. The amount of carbon in the
sample was measured to be 17.32%. .............................................................................. 104
Figure 5.6. Nitrogen adsorption/desorption isotherms and BJH pore size distribution for
p-SiO2 (a and b), p-Si (c and d) and p-Si@C (e and f) ................................................... 105
Figure 5.7 SEM images of the electrode cross-section of p-SiO2@C at (a) low
magnification and (b) high magnification, and p-Si@C at (c) low magnification and (d)
high magnification .......................................................................................................... 108
Figure 5.8 SEM images and the corresponding elemental mapping of the cross-section of
the p-SiO2@C (a, b, c and d) and p-Si@C (e, f, g and h) for elements C (red), Si (green)
and O (blue). ................................................................................................................... 109
Figure 5.9 XRD spectrum of the (a) reactants mixture before the reduction reaction, (b)
the products after the reaction and (c) reactants analyzed separately for reference. The
samples were sealed with Kapton tape to prevent the exposure to air /moisture. .......... 110
Figure 5.10 XRD spectrum of the HCl washed products formed after reduction for 16
hours of p-SiO2 at 180 °C (a) and at 210 °C in (b) AlCl3 and (c) eutectic mixture of AlCl3
and ZnCl2 ........................................................................................................................ 110
Figure 5.11 (A)Cycling performance of p-Si (red plot) and p-Si@C (blue plot) and (b)
corresponding coulombic efficiencies, voltage profile of (c) p-Si and (d) p-Si@C, (e)
normalized specific capacity of p-Si and p-Si@C, and (f) rate performance of p-Si and p-
Si@C at different current densities ................................................................................. 112
Figure 5.12 Differential capacity plots of (a) p-Si and (b)p-Si @C for the first cycle, and
(c)p-Si and (d)p-Si@C for 3rd, 4th and 5th cycles ............................................................ 113
Figure 5.13 (a) Equivalent circuit model used to fit the experimental data and (b)
electrochemical impedance spectra (EIS) of p-Si and p-Si@C after 200 cycles
(experimental and fitted results) ..................................................................................... 115

xiii
Figure 5.14 SEM images of the p-Si@C electrode (a) before cycling and (b) after 200
cycles at 1.2 A/g in the voltage range of 0.02 – 1.6 V .................................................... 116

xiv
LIST OF SYMBOLS
V Voltage of the electrode against the stated reference electrode.
Ecell The energy of the cell in watt-hours, during charge or discharge.
Voc Open circuit potential of a lithium ion cell.
Li Chemical potential of Li.
F Faraday’s constant.
I Current applied during lithiation or delithiation
Q Specific capacity of an electrode
x Number of moles of Li+ or electrons transferred during lithiation or delithiation
n Number of moles of host atoms
V Percent change in molar volume per atom of the host after lithiation
Fracture energy of the material
Representative stress of an electrode
E Young’s modulus of a material
Strain rate during expansion of a material
C 1C corresponds to the current required to charge or discharge a cell in 1 hours
R Gas constant

xv
LIST OF ABBREVIATIONS
BET .................................................................................................. Brunaer-Emmett-Teller
CE ...................................................................................................... Coulombic Efficiency
DEC.......................................................................................................... Diethyl Carbonate
EC .......................................................................................................... Ethylene Carbonate
EDX ........................................................................ Energy Dispersive X-ray Spectroscopy
EIS...................................................................... Electrochemical Impedance Spectroscopy
FEC .............................................................................................. Fluoroethylene Carbonate
FIB ...........................................................................................................Focused Ion Beam
LIB .........................................................................................................Lithium Ion Battery
SEI............................................................................................. Solid Electrolyte Interphase
SEM ..................................................................................... Scanning Electron Microscopy
TEM .............................................................................. Transmission Electron Microscopy
TGA ...................................................................................... Thermal Gravimetric Analysis
VC ......................................................................................................... Vinylene Carbonate
XRD .......................................................................................................... X-ray Diffraction

1
:
INTRODUCTION
Increased power consumption in the portable electronics as well as the pursuit for
longer driving range in the electric vehicles (EVs), has resulted in the ever-growing
demand for higher energy densities in the lithium-ion batteries (LIBS). 1 Apart from being
lighter and smaller, lithium-ion batteries have the highest energy density (150 Wh/kg) and
power density (1800 W/kg) among all the mass manufactured rechargeable batteries. 2, 3
Yet, the energy density of the state of art LIBs (~150 Wh/kg) cannot match the life or
performance of the internal combustion engine vehicles. Increase in the energy density by
five times is required to meet the performance required for all-electric vehicles (EVs) with
a 300-400 mile range.3
Driving range and the cost of the electric vehicles, are the major challenges for the
growth of global electric vehicle market.1 The cost of battery accounts for about 65% of
the total cost of EVs currently available in the market. To be cost-competitive with internal
combustion engine vehicles, the next generation of EVs would require at least twice the
energy density at the price tag of 30% of the total cost of the current state of art LIBs.4
1.1 Lithium-ion batteries (LIBS)
Figure 1.1 presents a typical schematic of a lithium ion battery which consist of
an anode (negative electrode), a cathode (positive electrode), an electrolyte for ion
transport between the two electrodes and a porous separator (not shown) preventing a direct

2
contact between the two electrodes of different chemical potential. Aluminum and copper
foils are typically used as the current collectors for cathode and anode respectively.
Figure 1.1. A schematics of a typical lithium ion battery5
During a discharge (delithiation of anode) process, Li ions diffuse out from the
anode and intercalates into the cathode, after getting transported through the electrolyte. At
the same time, electrons leave the anode towards the cathode through an external circuit
during which the electrical energy is provided to the connected device. During charge
(lithiation of anode) similar process occurs in the opposite direction i.e. flow of Li+ and e-
from cathode to anode. The intercalation and de-intercalation process may be summarized
as given in the Table 1.1.

3
Table 1.1 Reactions at the cathode and anode in a lithium-ion cell
Cathode Anode
LiCoO2 Li1-xCoO2 + xLi+ + xe-
charge
discharge
discharge
C + xLi+ + xe-charge
LixC
The total energy of a LIB can be calculated as
where, I(t) is the charge/discharge current as a function of time (A) , V(t) is the voltage as
a function of time, and to and tf are the initial and final time of the charge or discharge
process. For a constant voltage, the equation 1.1 becomes E = V*Q, where Q is the specific
capacity (Ah).
The voltage of the cell (or battery) can be calculated as
nF
μμV
Li(A)Li(C)
oc
(1.2)
Where, µLi(C) and µLi(A) are the chemical potentials of Li+ in the cathode and anode
respectively, F is the faradays constant (96485.3 C/mol) and n is the number of moles of
electrons transfer.
The theoretical specific capacity of the electrodes may be calculated as6
QTheoretical = x*F/(n*Mw) (1.3)
Where, x is the moles of electrons or Li+ transferred during lithiation/delithiation process,
F is the faradays constant (96485.33 C/mole), n is number of moles of active material (host)
Ecell= ∫ I(t)*V(t)*dt
t=tf
t=t0
(1.1)

4
and Mw is the molecular weight of the host. Samples calculations for theoretical specific
capacity are presented below.
Table 1.2 Calculation of theoretical specific capacities of selected electrodes
Host Lithiated species Theoretical specific capacity
Graphite LiC6 (1 mole 𝑒− ∗ 96485.33 C/mol)
(6 mol of C ∗ 12 gram/mol)
= 1340 C/g = 372 mAh/g
Silicon Li15Si4 (15 mole 𝑒− ∗ 96485.33 C/mol)
(4 mol of Si ∗ 28.09 gram/mol)
= 12881 C/g = 3578 mAh/g
Lithium cobalt oxide Li1-xCoO2 (1 mole 𝑒− ∗ 96485.33 C/mol)
(1mol of LiCoO2 ∗ 97.87 gram/mol)
= 985.85 C/g =274 mAh/g
For the cathode materials such as lithium cobalt oxide (LCO), it has been reported that
delithiation to state x=0.47, converts the hexagonal phase into monoclinic phase.
Therefore, delithiation is usually restricted between 0>x<0.5 for LixCoO2, to prevent phase
collapse.7 Therefore, the practical theoretical capacity may be calculated as
𝑄𝑝𝑟𝑎𝑐𝑡𝑖𝑐𝑎𝑙 𝐿𝐶𝑂=
(0.5 mole 𝑒− ∗ 96485.33C
mol)
(1mol of LiCoO2 ∗ 97.87 grammol
)= 493
𝐶
𝑔=
137𝑚𝐴ℎ
𝑔
(1.4)
Where, 1C = 0.2777 mAh.
From equation 1.1, it is apparent that the specific energy density of a battery system
can be increased by increasing the working voltage and/or the specific capacity. Major
focus on LIBs research, therefore, has been devoted in developing the materials with higher

5
specific capacity and/or higher working voltage. In addition to increasing the energy
density, the materials with high specific capacity could also improve the driving range by
reducing the total weight of the battery pack. The battery pack in a typical EV may account
up to 1/3rd of the vehicle weight. It has been reported that for every 10% reduction of the
vehicle weight, there is about a 6-7% reduction in energy consumption.8
It may be interesting to note that despite the higher theoretical specific capacity, the
practical volumetric specific capacity of the graphite (330-430 mAh/cm3) is still lower
than that of LiCoO2 (550 mAh/cm3). 9 The smaller tap density of graphite (e.g. ~1 g/cm3,
true density = 2.26 g/cm3)10 compared to that of LiCoO2 (2.8-3.0 g/cm3, true density = 5.1
g/cm3 )11 lowers volumetric capacity in the graphite anode. Therefore, extensive efforts
have been applied in the search of new anode materials with higher volumetric specific
capacity.
The theoretical volumetric capacity can be simply calculated by multiplying the
theoretical specific capacity (mAh/g) by the true density (g/cm3). However, the practical
volumetric capacity calculation should use the practical specific capacity and the tap
density, which is usually lower than the true theoretical values. Therefore, the volumetric
energy density can be enhanced by increasing the specific capacity and the tap density.
The coulombic efficiency (CE) of a full cell may be defined as the ratio of discharge
capacity to the charge capacity. For half cells, such as Li metal vs Si, it may be calculated
as the ratio of charge (dealloying) capacity to the discharge (alloying) capacity. The CE
becomes more important in full cells as the number of Li ions in the capacity matching
cathode are limited. Lower CE reduces the total capacity that a cell can theoretically
deliver. For half cells, however, the Li foil typically used as a reference/counter electrode
6
has much larger specific capacity than that of working electrode (such as Si). Therefore,
huge irreversible loss during initial cycles may not limit the number of Li ions required to
achieve full lithiation. Yet, the lower CE during later cycles may indicate the instability of
the solid electrolyte interface (SEI) which affects the cycle life and capacity in the actual
full cell setup.
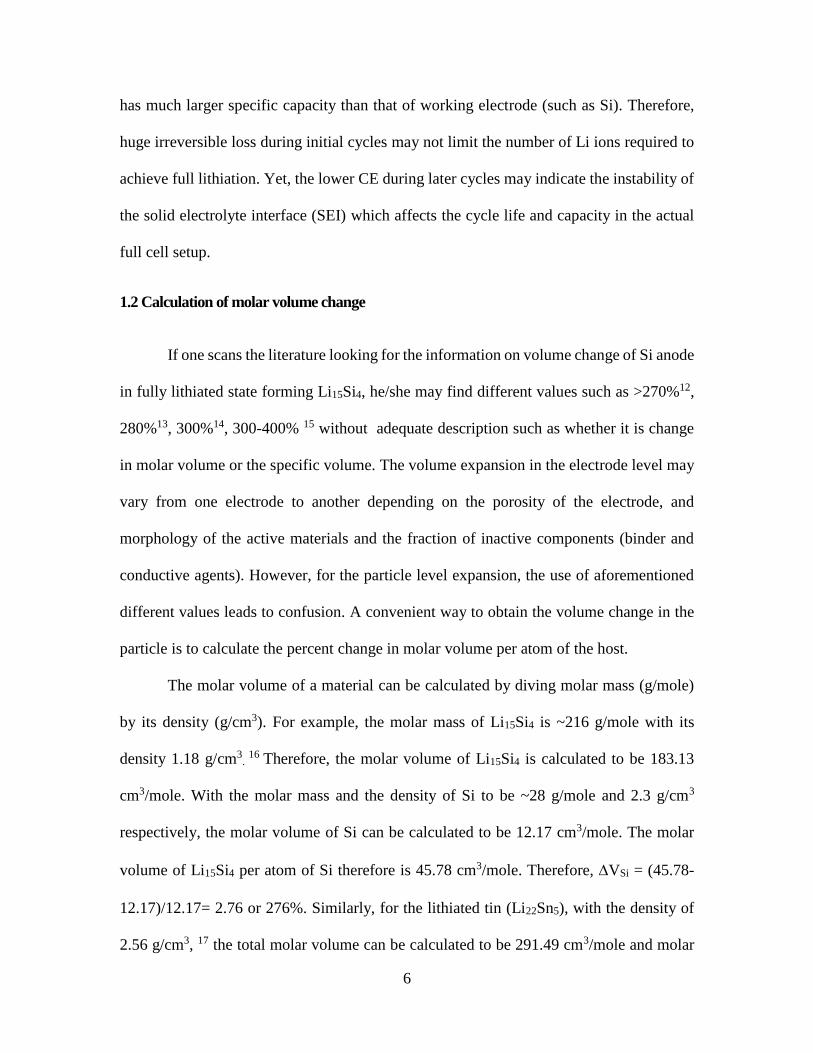
1.2 Calculation of molar volume change
If one scans the literature looking for the information on volume change of Si anode
in fully lithiated state forming Li15Si4, he/she may find different values such as >270%12,
280%13, 300%14, 300-400% 15 without adequate description such as whether it is change
in molar volume or the specific volume. The volume expansion in the electrode level may
vary from one electrode to another depending on the porosity of the electrode, and
morphology of the active materials and the fraction of inactive components (binder and
conductive agents). However, for the particle level expansion, the use of aforementioned
different values leads to confusion. A convenient way to obtain the volume change in the
particle is to calculate the percent change in molar volume per atom of the host.
The molar volume of a material can be calculated by diving molar mass (g/mole)
by its density (g/cm3). For example, the molar mass of Li15Si4 is ~216 g/mole with its
density 1.18 g/cm3.
16 Therefore, the molar volume of Li15Si4 is calculated to be 183.13
cm3/mole. With the molar mass and the density of Si to be ~28 g/mole and 2.3 g/cm3
respectively, the molar volume of Si can be calculated to be 12.17 cm3/mole. The molar
volume of Li15Si4 per atom of Si therefore is 45.78 cm3/mole. Therefore, VSi = (45.78-
12.17)/12.17= 2.76 or 276%. Similarly, for the lithiated tin (Li22Sn5), with the density of
2.56 g/cm3, 17 the total molar volume can be calculated to be 291.49 cm3/mole and molar

7
volume per atom of Sn be 58.3 cm3/mole. The molar volume of tin is 16.3 cm3/mole.
Therefore, VSn = (58.3-16.3)/16.3 = 2.57 = 257%. Finally, for the traditional graphite
electrode, the density of fully lithiated phase (LiC6) is 2.24 g/cm3.
18 With the molecular
weight of ~79 g/mole, the molar volume of LiC6 can be calculated at (79 g/mol)/(2.24
g/cm3) = 35.27 cm3/mole. Furthermore, the molar volume per atom of C is 5.88 cm3/mole.
Therefore, VC = (5.88-5.27)/5.27 =0.1157 = 11.6%. These values are consistent with the
ones previously reported.19
1.3 High-capacity electrodes for LIBs
Efforts to develop high capacity, and long cycle life electrode at a cost lower than
the state of art LIBS have led to investigation of several materials as the possible candidate
for next generation of electrodes. Alloying elements such at Tin (Sn), Germanium (Ge),
and Silicon (Si) have been extensively studied. Si, with about 10 times the theoretical
specific capacity (3579 mAh/g, Li15Si4) than that of the graphite electrode (372 mAh/g),
has received special attention owing to its high capacity, low cost, abundance and the
presence of already established advanced Si processing technology. 20, 21 Another group IV
element, Ge also exhibits high specific capacity of 1600 mAh/g. 22 In addition, Ge offers
much higher electrical conductivity (Ge: 2.1 S m-1, Si : 1.6x10⁻³ S m-1) and Li ion
diffusivity than that of Si (Ge: 6.25x10⁻¹² cm2s-1, Si: 1.9x10⁻¹⁴ cm2s-1).21 These properties
make Ge an excellent candidate for high power electrode while offering high specific
capacity at the same time. However, Ge being expensive and low in abundance, has not
found its way into the commercial market. Sn electrode, despite having the theoretical
capacity of 990 mAh/g, often undergoes pulverization even with nano scale dimensions.
As a result, oxides of Sn have received more attention owing to its improved cyclability.20

8
1.4 Fracture mechanics and critical size
Upon full lithiation, the lattice parameter of Si electrode (5.456 Å)23 increases to
10.60 Å24 forming Li15Si4 which results in the electrode expansion by 300%.25 Fully
lithiated Ge also undergoes 260% volume expansion after forming Li15Ge4.26 Such a large
change in dimension due to lithiation, introduces diffusion induced stress in the materials.
Bulk sized Si and Ge have been reported to suffer pulverization upon full lithiation
resulting in rapid capacity fade.27, 28 Recent in-situ TEM studies have revealed that Si and
Ge nanoparticles can avert fracture even upon full lithiation, as long as the particles are
below the critical sizes of 150 and 620 nm respectively. 26,29 Theoretical models based on
fracture mechanics have sought to explain the electrode deformation above the critical size
by considering diffusion, elastic-plastic deformation and fracture. 30
Fracture mechanics dictates that the extension of the pre-existing cracks in the
materials requires the energy release rate during crack propagation to be greater than the
fracture resistance of the material. Consequently, fractures can be prevented if the energy
release rate is below the fracture energy of the material. Based on this concept, Zhao et al.
have derived an expression to estimate the critical size of the electrode below which
fractures can be averted. The critical size of the electrode is thus given by31
2c
Eh
Z
(1.5)
Where hc is the critical size, is the fracture energy of the material, E is the Young’s
modulus, Z is a dimensionless number of order unity, and is a representative stress in the
material. Using the parameters = 10 J/m2, E=80 GPa, = 1.75 GPa and Z =2, the critical
size for Si was estimated to be 130 nm. 30 This result is in good agreement with the observed

9
experimental value of 150 nm, reported by others. 29 The stability of the nanoparticles
below such a critical size has been attributed to their smaller stress-relief volume which
allows smaller rate of energy release. 29
Additionally, the stability of nanoparticles has also been attributed to the potential
to undergo superplastic deformation during cycling by undergoing tremendous elongations
(hundreds of percent) prior to failure. Equation (1.6)19, 32 relates the applied stress (),
temperature (T), the grain size (d) and the resulting strain rate () as
=And-pD0exp(-Q/RT) (1.6)
where A is a constant, n is the stress exponent (typically n~2), p is the grain size exponent
(typically p~2-3), Q is the activation energy, and R is the gas constant. Therefore, the strain
rate for nanocrystalline materials will be several orders of magnitude higher than that of
the micron-sized materials at the same temperature which allows the nano materials to
achieve appreciable superplastic strain prior to failure in order to act as better electrode.19,
32
In another attempt to study the relation between the particle size and the magnitude
and distribution of diffusion induced stress, Cheng and Verbrugge, developed an analytical
model by considering the effect of surface stress and surface energy on the distribution of
such stress.33 It was reported that the radial tensile stress at the center during insertion and
tangential tensile stress at the surface during de-insertion can be significantly reduced by
decreasing the particle radius.
The aforementioned in-situ and ex-situ microscopy results, along with several
mathematical results therefore strongly corroborate the particle level stability of
nanomaterials during electrochemical cycling.

10
1.5 Factors that affect the electrochemical performance in high capacity anodes
The huge change in molar volume upon full lithiation of high capacity electrodes
such as Si and Ge, leads to the fracture of electrodes which may ultimately lead to the
failure of the cell. A key requirement for achieving stable cyclic performance of any
electrode is that it should be able to maintain a three-dimensional conducting network
during electrochemical cycling. The most studied parameters that affect the stability of
such network are (a) intrinsic/extrinsic property the electrode, (b) binder and (c)
solvent/electrolyte.
The intrinsic property of the electrode may affect the fracture toughness, electrical
conductivity as well as the lithiation behavior. For example, the lower band gap ( Ge: 0.66
eV, Si : 1.12 eV at 300 K) and larger lattice parameter in Ge (Ge: 5.66 Å, Si: 5.43 Å), as
compared to Si, allows faster electrical conduction (104 times than that of Si) and Li ion
diffusion respectively in Ge (400 times of Si) allow cycling at high current densities.28, 34
The preferential lithiation in Si along {110} facets leads to the anisotropic expansion
leading to the formation of multiple cracks upon full lithiation. Ge on the other hand,
appears to undergo isotropic lithiation without preferential lithiation.26 In addition, the
fracture toughness of Ge in the lithiated phase has been measured to be higher than that of
lithiated Si.35 These properties make Ge a more preferable candidate for high capacity
electrodes.
The influence of a binder on the cyclic stability of an electrode depends on strong
adhesion between the binder and the electrode particles as well as the current collectors to
maintain the electrode stability.36 The conventional binder poly(vinylidene fluoride)
(PVDF), offers weak van der waals forces between the electrode and the binder, and fails

11
to maintain the electrode integrity during large volume change. As a result, using PVDF as
a binder for high capacity anodes, often leads to rapid capacity fade.36, 37 An ever growing
interest in high capacity anodes have led to the exploration of different polymeric binders
to improve the cyclic stability. Binders such as sodium carboxy-methyl cellulose (CMCNa)
and poly(acrylic acid) (PAA) have found widespread applications in the development of
high capacity electrodes as they can form stronger hydrogen bond between the surface
oxygen and the carboxyl group in the binders. Recently, the adhesive properties of PAA
has been further enhanced by silane coupling agents such as 3-amino-propyltriethoxysilane
(APTES) which can cross-link PAA chains as well as form stronger covalent bonds
between the PAA and Si.38
The choice of electrolyte also greatly affects the electrochemical performance of
high capacity electrodes. The reduction of electrolyte during the charging process on a full
cell forms a passivating layer on the electrode surface which prevents the further contact
between the electrode and the electrolyte. This, in theory, can prevent further capacity loss
by preventing more Li ions getting trapped in the organic/organic products which can form
during the electrolyte reduction. The electrically insulting layer that separates the electrode
and the electrolyte, formed due to the reduction of electrolyte is often known as solid
electrolyte interface (SEI). The huge volume change that occurs during lithiation in high
capacity electrodes can lead to the repeated fracture of SEI and exposure of electrode to
the electrolyte.39 This further leads to irreversible capacity loss and lowers the coulombic
efficiency. Therefore, thin, dense and mechanically stable SEI is desired for achieving
stable cyclic performance. The effect of solvent/co-solvents on the cyclic stability for high
capacity electrodes such as Si has been studied by several groups. 40, 41 Electrolyte additives

12
such fluoroethylene carbonate (FEC) and vinylene carbonate(VC) have enjoyed great
success in stabilizing SEI in such electrodes by forming thinner and compact surface films
(SEI), as compared to the non FEC based conventional electrolyte. 40
1.6 Approaches to achieve cyclic stability for high capacity anodes
1.6.1 Materials engineering
Several attempts have been made to address the pulverization of the high capacity
electrodes and prevent the consequential capacity fade. Materials engineering to obtain
nanocomposites electrodes42 , thin films 21, 43 , nano structures (nanotube, nanowires)44-46,
porous materials22, 47 are commonly observed in the open literature. The nanomaterials,
besides providing mechanical stability, allow faster diffusion of Li ion and improve the
electrolyte accessibility in the electrode. Similarly, the porous materials allow the volume
accommodation in their pores, thereby alleviating the net strain in the material. 47
The advantages associated with nanomaterial electrode for LIBs, however, are also
accompanied by several disadvantages. Nanoparticles, are more expensive48, difficult the
synthesize and control the size, suffer increased side reaction due to large surface area, and
reduce the volumetric energy density.49 To the best of our knowledge, nanomaterials based
electrodes have not been able to achieve long term stable cycling performance with high
areal capacity (>3 mAh/cm2). Therefore, stabilization of micro/submicro-sized electrodes
therefore can lead to the scalable path for commercial application of high capacity Si
electrodes.
Majority of literature reports on Si based anode have been based on nano-sized
electrodes. Even though small in numbers ,successful application of submicron sized (
>100 nm and <1 m) Si based electrodes have also been observed in several composites

13
50-52and alloys53, 54 as well as in the porous Si reduced from porous silica as a template. Si
alloyed with inactive elements or with the elements with higher lithiation potential have
demonstrated better electrochemical performance that Si alone. It is believed that the stress
induced by the lithiation of the second element alloyed with Si helps to confine the Si
expansion thereby improving the electrochemical reversibility.53 Amorphous Si has also
been reported to avoid fracture upon full lithiation provided that the particle size is less
than 870 nm owing to its isotropic lithiation.55 Jia et al., reported the synthesis of three
dimensional mesoporous Si (400-600 nm) through magnesiothermic reduction of SBA-15
silica template which exhibited high specific capacity of ~1500 mAh/g for about 100
cycles.56 The improved cyclic stability of the mesoporous Si over Si nanoparticles electrode
was attributed to the accommodation of volume changes in the mesopores.
Stabilization of micro Si anode in the particle level has been mostly achieved
through porous architecture. Pomegranate inspired Si anode reported by Liu el al, has been
one of the highly successful efforts in stabilization micro sized (1-10µm) porous Si
electrode for over 100 cycles with the areal capacity >3 mAh/cm2.57 Similarly, using the
HF etched porous Si with larger particle size (>20 m), Li et al., demonstrated over stable
300 cycles with 92% capacity retention with the high areal capacity of ~1.5 mAh/cm2.47
In their work, it was reported that the total volume change was limited to ~30% as opposed
to the ~300% volume change usually observed in a fully lithiated bulk Si. Despite the
promising results, the examination of full cell cyclic performance with a Li limited cathode
is usually not reported. Recently in 2016, Li et al, reported a promising full cell cyclic
performance with mechanically strong and robust graphene encapsulated Si microparticles
14
(1-3 m), which displayed 90% capacity retention after 100 cycles with a high areal
capacity of 3.1 mAh/cm2.58
1.6.2 Tailoring the binder
Most of the research focus for increasing the energy density of LIBs have been the
development of new active materials with higher specific capacity while the role of binders
also have been proven to be equally important for cyclic stability. 59 Polymeric binders
have recently received greater attention for enhancing the cyclic stability of high capacity
electrodes such as Si. The traditional binder, PVDF, is the widely used for state of art
LIBs.60 However, the weak van dar waals forces between PVDF and Si, fails to provide
stable electrochemical performance. One of the earlier works by Buqa et al. demonstrated
the 1 wt% CMCNa produced similar cyclic stability of nano-Si/graphite electrode as using
the 10 wt% PVDF. 61 The enhanced cyclic stability was attributed to the extended
conformation of CMC in the solution leading to the formation of efficient network between
the carbon black, Si and CMC.62
Further improvement of the cyclic stability of Si anode over CMC binder was
demonstrated by using Na-alginate.59 CMCNa and Na-alginate have similar mechanical
properties, however, the carboxylic groups, responsible for strong hydrogen bonds between
the surface silanol groups and the carboxylic group, are distributed uniformly in higher
concentration along the Na-alginate chain. In addition, the higher viscosity of Na-alginate
binder compared to CMCNa, in water as a solvent, prevents particle sedimentation and
aggregation, thereby forming a more uniform slurry and the resulting electrode. 59 The

15
uniform distribution of active materials in the electrode is also a critical factor to achieving
cyclic stability.59
Liu et al., further demonstrated superior electrochemical performance of Si
electrode with gum agar binder compared to Na-aginate binder.63 It was reported that the
amount of gum agar binder was present in higher amount in Si after water washing than
that of Na-alginate binder, suggesting stronger interaction between the gum agar binder
and Si. Magasinki et al. also reported an improved electrochemical performance of Si
anode over PVDF and CMCNA with poly (acrylic acid) (PAA) as a binder. Higher stiffness
of the polymer in the electrolyte offer greater resistance to elastic and plastic deformations.
It was observed that PAA has much higher stiffness (Young’s modulus) than that of PVDF
in dry state. In contact with a Diethyl Carbonate solvent, the stiffness of PAA did not
change appreciably whereas it was significantly decreased for PVDF suggesting it’s lower
resistance to deformation in the presence of electrolyte. Additionally, the superior
performance of PAA over CMCNA was attributed to the higher concentration of
carboxylic functional groups in PAA.36 In a recent work, Bie et al., demonstrated that
addition of mere 0.3 wt% of 3-amino-propyltriethoxysilane (APTES) could cross-link the
PAA chains and form covalent bond between Si and PAA, producing much better cyclic
stability compared to the use of PAA alone as the binder.38
Despite the improvements over PVDF, the hydrogen bonds between the oxides
layers of Si and binders such as CMC, PAA and Na-does not yet provide long term stability
for electrodes with high areal capacities.38 Wang et al., reported a randomly branched
hydrogen bonding self-healing polymer (SHP) with high stretchability and spontaneous
self-healing capability for stabilizing Si microparticles anode with high areal capacity (1.5-

16
2.1 mAh/cm2) for about 45 cycles.64 Longer cycle life (~120 cycles) with higher areal
capacity (>3 mAh/cm2) was achieved by 3D distribution of the SHP into the Si electrode.65
Despite promising advancements in development of new binders for Si anode, these results
are mostly limited to Si nanoparticles . Electrodes with Si micro-particles as active
materials still display short cycle life (100 cycles or less). Stabilization of Si micro-particles
with high areal capacity for several hundred cycles will be required to develop practical
electrodes for industrial applications owing to their low cost and ease of availability.64 One
of the most promising results reported earlier in 2017, Choi et al., demonstrated that the
incorporation of 5 wt% of polyrotaxane in PAA, produced excellent cyclic stability for
~400 cycles with high active mass loading of ~1 mg/cm2 with the initial areal capacity of
2.68 mAh/cm2.66 They proposed that some of the ring components of polyrotaxane were
crosslinked with PAA through easter bond formation to form highly stretchable and elastic
polymer network which could coalesce the Si particles together, including the pulverized
ones.
In light of the aforementioned results, it becomes apparent that the choice of binder
is a critical parameter to consider when developing a high capacity electrode. When
selecting a binder, properties such as types of function groups and the resulting bonding
with Si and the current collector, binder stiffness and stretchability, concentration and
distribution of function groups, and the interaction of electrolyte and binder should be
carefully examined/reviewed to achieve excellent electrochemical performance.36, 60, 64, 66
1.6.3 Electrolyte optimization
An electrolyte allows transport of Li ions between the anode and the cathode during
the charge/discharge process, thus presents itself as an essential component of LIBs. An

17
ideal electrolyte would possess qualities such as high ionic conductivity, low melting and
high boiling points, good electrochemical stability, low cost and environmentally safe.67
The conventional electrolyte consists of single or combination of different salts such as
LiPF6, LiClO4, LiAsF6 dissolved in linear or cyclic organic carbonate solvents such as
ethylene carbonate (EC), diethyl carbonate (DEC), ethyl methyl carbonate (EMC),
dimethyl carbonate (DMC) and propylene carbonate (PC).68
The reduction potentials of many solvents used in the electrolyte formulations lie
above the lithiation potential of conventional electrodes such as graphite and even the Si
anodes. Formation of stable passivating layer, also known as, solid electrolyte interphase
(SEI) through the reduction of electrolyte is therefore a key requirement for achieving long
term cyclic stability.40, 69 The SEI is believed to be electrically insulating and ionically
conductive thereby slowing the further reduction of electrolyte.70
While reduction of EC based electrolyte forms robust SEI for graphite, it is
inadequate for producing stable SEI for Si electrodes. 71 For high capacity electrodes such
as Si, Ge and Sn that undergo large volume change during lithiation, development of stable
SEI is challenging. Even when the electrode is mechanically stable, the instability of SEI
can result in capacity fade. For example, nano Si electrode may be less prone to undergo
fracture, however the SEI deforms and reforms during repeated lithiation/delithiation
process and display poor coulombic efficiency and cyclic stability.57, 72 Therefore, various
electrolyte additives are currently being reported in the literature to stabilize the SEI and
reduce capacity loss. Some of the commonly studied electrolyte additives involve vinylene
carbonate (VC), fluoroethylene carbonate (FEC), lithium bis(oxalate)borate (LIBOB) and
succinic anhydride (SA).73 FEC and VC probably the most used/studied electrolyte

18
additives for high capacity electrodes. The stability of the SEI has been often linked to the
type of products formed at the electrode surface after the reduction of electrolyte. Shkrob
et al., reported that the polymeric matrix formed with FEC based electrolyte is substantially
more cross-linked than the polymeric matrix formed with tradition EC or similar
carbonates based electrolytes.71 They attributed the superior cyclic performance of Si
anode in FEC based electrolyte to the elastomeric properties of the highly cross-linked
polymer networks. Similarly, presence of large amount of lithium fluoride (LiF) has been
attributed to the decomposition of LiPF6 and therefore undesirable for achieving stable SEI.
In a comparative study of multiple electrolyte additives for Si thin film anode, Dalavi et
al., reported that the surface of the electrode cycled in FEC added electrolyte composed of
lithium alkyl carbonates, polycarbonates, and oxalates while the electrolyte cycled in
baseline electrolyte ( 1 M LiPF6 in EC/DMC/DEC 1/1/1 vol%) had thick SEI with high
concentration of LiF, suggesting significant decomposition of LiPF6.74 Dalavi et al. also
reported that VC additive produced the best cyclic stability for the Si thin film anode
compared to FEC and LIBOB additives and the SEI for the electrolyte cycled in VC added
electrolyte consisted of poly(vinylene carbonate) with reduced amount of LIF. In a recent
report by Jaumann et al., VC additive resulted in better cyclic stability and coulombic
efficiency in nano structured Si@C anode than that of FEC additive.75 Jaunmann et al.,
proposed that despite the similar polymeric layers formed in the surface after the reduction
of both the electrolyte, the presence of non-flexible and compact LiF nanocrystals in the
polymeric matrix formed after reduction of FEC based electrolyte make the
electrochemical performance less reversible. While VC appears to outperform FEC in thin
films or nano Si electrodes, the results for micro/submicro Si electrode seem to be opposite.
19
For Si with particle size less than 500 nm, Nguyen et al., reported better specific capacities
and cyclic stability with FEC additive as compared to the VC additive.76 Similarly, Uchida
et al., also observed slightly better cyclic stability on micro Si electrode with FEC as
compared to VC as the electrolyte additive. 77 These contrasting results suggest the effect
of the different electrolyte additive may differ from one electrode design to another.75
In addition to electrolyte additives to stabilize SEI in high capacity electrodes,
attempts to reduce the electrolyte decomposition by coating a layer of artificial SEI have
also been reported in the literature. Coatings such as lithium phosphorus oxynitride,78 TiO2
,79 and Al2O380 have been reported to displayed superior electrochemical performance than
bare Si electrode.
1.7 Objective of thesis
The main objectives of this thesis are to (1) develop new electrode materials for LIBs
and (2) study synthesis-structure-performance relation.
Porous germanium (Ge) was synthesized by a facile, single step process.22 The relation
between mass loadings and areal capacities were examined. Full cell cyclic performance
with commercial cathode was evaluated (Chapter 2). To exploit the stability of Ge
electrode observed in Chapter 2 as well as reduce the amount of expensive Ge in the
electrode, solid solutions of the Si and Ge with various compositions were synthesized and
examined as the electrode for LIBs (Chapter 3). The promising results achieved in SixGe1-
x electrode still required substantial amount of Ge. Therefore, with the objective of coating
a thin layer of C and Ge on Si to stabilize the electrode, carbon-germanium-silicon (CGS)
core shell electrode has been synthesized and is currently under performance evaluation

20
(Chapter 4). Finally, a new low temperature aluminothermic reduction technique for the
reduction of porous Silica to Si will be presented in Chapter 5.

21
References
1. J. W. Choi and D. Aurbach, Nature Reviews Materials, 2016, 1, 16013.
2. M. Lowe, S. Touoka, T. Trigg and G. Gereffi, Lithium-ionBatteries for Electric
Vehicles: THE U.S. VALUE CHAIN .<
http://unstats.un.org/unsd/trade/s_geneva2011/refdocs/RDs/Lithium-
Ion%20Batteries%20(Gereffi%20-%20May%202010).pdf>, 2010.
3. M. M. Thackeray, C. Wolverton and E. D. Isaacs, Energy & Environmental
Science, 2012, 5, 7854-7863.
4. Arpa-e, DOUBLE ENERGY DENSITY ANODES FOR LITHIUM-ION
BATTERIES. <http://arpa-e.energy.gov/?q=slick-sheet-project/double-energy-
density-anodes-lithium-ion-batteries>, 2010.
5. M. S. Islam and C. A. J. Fisher, Chemical Society Reviews, 2014, 43, 185-204.
6. D. Deng, Energy Science & Engineering, 2015, 3, 385-418.
7. J. N. Reimers and J. R. Dahn, Journal of The Electrochemical Society, 1992, 139,
2091-2097.
8. L. Cheah, C. Evans, A. Bandivadekar and J. Heywood, in Reducing Climate
Impacts in the Transportation Sector, eds. S. J. Cannon and D. Sperling, Springer
Netherlands, Dordrecht, 2009, pp. 49-71.
9. N. Nitta, F. Wu, J. T. Lee and G. Yushin, Materials Today, 2015, 18, 252-264.
10. M.-D. Fang, T.-H. Ho, J.-P. Yen, Y.-R. Lin, J.-L. Hong, S.-H. Wu and J.-J. Jow,
Materials, 2015, 8, 3550.
11. H. Tao, Z. Feng, H. Liu, X. Kan and P. Chen, Open Mater. Sci. J, 2011, 5, 204-
214.
12. N. Lin, Y. Han, J. Zhou, K. Zhang, T. Xu, Y. Zhu and Y. Qian, Energy &
Environmental Science, 2015, 8, 3187-3191.
13. M. N. Obrovac and L. J. Krause, Journal of The Electrochemical Society, 2007,
154, A103-A108.
14. B. A. Korgel, The Journal of Physical Chemistry Letters, 2014, 5, 749-750.
15. B.-C. Yu, Y. Hwa, C.-M. Park, J.-H. Kim and H.-J. Sohn, RSC Advances, 2013, 3,
9408-9413.
16. C.-H. Doh, M.-w. Oh and B.-c. Han, Asian Journal of Chemistry, 2013, 25, 5739.
17. M. Winter and J. O. Besenhard, Electrochimica Acta, 1999, 45, 31-50.

22
18. C.-H. Doh, B.-C. Han, B.-S. Jin and H.-B. Gu, Bull. Korean Chem. Soc, 2011, 32,
2045-2050.
19. J.-G. Zhang, W. Wang, J. Xiao, W. Xu, G. L. Graff, G. Yang, D. Choi, D. Wang,
X. Li and J. Liu, in Batteries for Sustainability: Selected Entries from the
Encyclopedia of Sustainability Science and Technology, ed. R. J. Brodd, Springer
New York, New York, NY, 2013, pp. 471-504.
20. N. Nitta and G. Yushin, Particle & Particle Systems Characterization, 2014, 31,
317-336.
21. P. R. Abel, A. M. Chockla, Y.-M. Lin, V. C. Holmberg, J. T. Harris, B. A.
Korgel, A. Heller and C. B. Mullins, ACS Nano, 2013, 7, 2249-2257.
22. F.-S. Ke, K. Mishra, L. Jamison, X.-X. Peng, S.-G. Ma, L. Huang, S.-G. Sun and
X.-D. Zhou, Chemical Communications, 2014, 50, 3713-3715.
23. K. Seino, W. G. Schmidt, J. Furthmüller and F. Bechstedt, Physical Review B,
2002, 66, 235323.
24. Y. Kubota, M. C. S. Escaño, H. Nakanishi and H. Kasai, Journal of Applied
Physics, 2007, 102, 053704.
25. Q. Zhang, Y. Cui and E. Wang, Modelling and Simulation in Materials Science
and Engineering, 2013, 21, 074001.
26. W. Liang, H. Yang, F. Fan, Y. Liu, X. H. Liu, J. Y. Huang, T. Zhu and S. Zhang,
ACS Nano, 2013, 7, 3427-3433.
27. W.-R. Liu, Z.-Z. Guo, W.-S. Young, D.-T. Shieh, H.-C. Wu, M.-H. Yang and N.-
L. Wu, Journal of Power Sources, 2005, 140, 139-144.
28. J. Graetz, C. C. Ahn, R. Yazami and B. Fultz, Journal of The Electrochemical
Society, 2004, 151, A698-A702.
29. X. H. Liu, L. Zhong, S. Huang, S. X. Mao, T. Zhu and J. Y. Huang, ACS Nano,
2012, 6, 1522-1531.
30. K. Zhao, M. Pharr, J. J. Vlassak and Z. Suo, Journal of Applied Physics, 2011,
109, -.
31. K. Zhao, M. Pharr, J. J. Vlassak and Z. Suo, Journal of Applied Physics, 2011,
109, 016110.
32. M. Mayo, Nanostructured materials, 1997, 9, 717-726.
33. Y.-T. Cheng and M. W. Verbrugge, Journal of Applied Physics, 2008, 104,
083521.

23
34. X. Gao, W. Luo, C. Zhong, D. Wexler, S.-L. Chou, H.-K. Liu, Z. Shi, G. Chen, K.
Ozawa and J.-Z. Wang, Sci. Rep., 2014, 4.
35. X. Wang, A. Yang and S. Xia, Journal of The Electrochemical Society, 2016,
163, A90-A95.
36. A. Magasinski, B. Zdyrko, I. Kovalenko, B. Hertzberg, R. Burtovyy, C. F.
Huebner, T. F. Fuller, I. Luzinov and G. Yushin, ACS Applied Materials &
Interfaces, 2010, 2, 3004-3010.
37. S. Komaba, N. Yabuuchi, T. Ozeki, Z.-J. Han, K. Shimomura, H. Yui, Y.
Katayama and T. Miura, The Journal of Physical Chemistry C, 2012, 116, 1380-
1389.
38. Y. Bie, J. Yang, W. Lu, Z. Lei, Y. Nuli and J. Wang, Electrochimica Acta, 2016,
212, 141-146.
39. S. Chae, M. Ko, K. Kim, K. Ahn and J. Cho, Joule, 2017, 1, 47-60.
40. V. Etacheri, O. Haik, Y. Goffer, G. A. Roberts, I. C. Stefan, R. Fasching and D.
Aurbach, Langmuir, 2012, 28, 965-976.
41. K. Schroder, J. Alvarado, T. A. Yersak, J. Li, N. Dudney, L. J. Webb, Y. S. Meng
and K. J. Stevenson, Chemistry of Materials, 2015, 27, 5531-5542.
42. D. Munao, M. Valvo, J. van Erven, E. M. Kelder, J. Hassoun and S. Panero,
Journal of Materials Chemistry, 2012, 22, 1556-1561.
43. R. Hu, H. Liu, M. Zeng, J. Liu and M. Zhu, Chinese Science Bulletin, 2012, 57,
4119-4130.
44. Z. Wen, G. Lu, S. Mao, H. Kim, S. Cui, K. Yu, X. Huang, P. T. Hurley, O. Mao
and J. Chen, Electrochemistry Communications, 2013, 29, 67-70.
45. T. Song, H. Cheng, H. Choi, J.-H. Lee, H. Han, D. H. Lee, D. S. Yoo, M.-S.
Kwon, J.-M. Choi, S. G. Doo, H. Chang, J. Xiao, Y. Huang, W. I. Park, Y.-C.
Chung, H. Kim, J. A. Rogers and U. Paik, ACS Nano, 2012, 6, 303-309.
46. C. K. Chan, H. Peng, G. Liu, K. McIlwrath, X. F. Zhang, R. A. Huggins and Y.
Cui, Nat Nano, 2008, 3, 31-35.
47. X. Li, M. Gu, S. Hu, R. Kennard, P. Yan, X. Chen, C. Wang, M. J. Sailor, J.-G.
Zhang and J. Liu, Nat Commun, 2014, 5.
48. B. Dunn, P. Liu and S. Meng, Nanotechnology, 2013, 24, 420201.
49. P. G. Bruce, B. Scrosati and J.-M. Tarascon, Angewandte Chemie International
Edition, 2008, 47, 2930-2946.

24
50. S. Fang, Z. Tong, P. Nie, G. Liu and X. Zhang, ACS Applied Materials &
Interfaces, 2017, 9, 18766-18773.
51. Y. Bie, J. Yu, J. Yang, W. Lu, Y. Nuli and J. Wang, Electrochimica Acta, 2015,
178, 65-73.
52. N. Fukata, M. Mitome, Y. Bando, W. Wu and Z. L. Wang, Nano Energy, 2016,
26, 37-42.
53. J. M. Whiteley, J. W. Kim, D. M. Piper and S.-H. Lee, Journal of The
Electrochemical Society, 2016, 163, A251-A254.
54. Q. Han, Z. Yi, Y. Cheng, Y. Wu and L. Wang, New Journal of Chemistry, 2017,
41, 7992-7997.
55. M. T. McDowell, S. W. Lee, J. T. Harris, B. A. Korgel, C. Wang, W. D. Nix and
Y. Cui, Nano Letters, 2013, 13, 758-764.
56. H. Jia, P. Gao, J. Yang, J. Wang, Y. Nuli and Z. Yang, Advanced Energy
Materials, 2011, 1, 1036-1039.
57. N. Liu, Z. Lu, J. Zhao, M. T. McDowell, H.-W. Lee, W. Zhao and Y. Cui, 2014,
9, 187.
58. Y. Li, K. Yan, H.-W. Lee, Z. Lu, N. Liu and Y. Cui, 2016, 1, 15029.
59. I. Kovalenko, B. Zdyrko, A. Magasinski, B. Hertzberg, Z. Milicev, R. Burtovyy,
I. Luzinov and G. Yushin, Science, 2011, 334, 75-79.
60. S.-L. Chou, Y. Pan, J.-Z. Wang, H.-K. Liu and S.-X. Dou, Physical Chemistry
Chemical Physics, 2014, 16, 20347-20359.
61. H. Buqa, M. Holzapfel, F. Krumeich, C. Veit and P. Novák, Journal of Power
Sources, 2006, 161, 617-622.
62. B. Lestriez, S. Bahri, I. Sandu, L. Roué and D. Guyomard, Electrochemistry
Communications, 2007, 9, 2801-2806.
63. J. Liu, Q. Zhang, T. Zhang, J.-T. Li, L. Huang and S.-G. Sun, Advanced
Functional Materials, 2015, 25, 3599-3605.
64. C. Wang, H. Wu, Z. Chen, M. T. McDowell, Y. Cui and Z. Bao, Nat Chem, 2013,
5, 1042-1048.
65. Z. Chen, C. Wang, J. Lopez, Z. Lu, Y. Cui and Z. Bao, Advanced Energy
Materials, 2015, 5, 1401826-n/a.
66. S. Choi, T.-w. Kwon, A. Coskun and J. W. Choi, Science, 2017, 357, 279-283.
25
67. G.-A. Nazri and G. Pistoia, Lithium batteries: science and technology, Springer
Science & Business Media, 2008.
68. A. M. Haregewoin, A. S. Wotango and B.-J. Hwang, Energy & Environmental
Science, 2016, 9, 1955-1988.
69. C. K. Chan, R. Ruffo, S. S. Hong and Y. Cui, Journal of Power Sources, 2009,
189, 1132-1140.
70. S. J. An, J. Li, C. Daniel, D. Mohanty, S. Nagpure and D. L. Wood, Carbon,
2016, 105, 52-76.
71. I. A. Shkrob, J. F. Wishart and D. P. Abraham, The Journal of Physical Chemistry
C, 2015, 119, 14954-14964.
72. D. S. Jung, T. H. Hwang, S. B. Park and J. W. Choi, Nano Letters, 2013, 13,
2092-2097.
73. A. Rezqita, M. Sauer, A. Foelske, H. Kronberger and A. Trifonova,
Electrochimica Acta, 2017, 247, 600-609.
74. S. Dalavi, P. Guduru and B. L. Lucht, Journal of The Electrochemical Society,
2012, 159, A642-A646.
75. T. Jaumann, J. Balach, U. Langklotz, V. Sauchuk, M. Fritsch, A. Michaelis, V.
Teltevskij, D. Mikhailova, S. Oswald, M. Klose, G. Stephani, R. Hauser, J. Eckert
and L. Giebeler, Energy Storage Materials, 2017, 6, 26-35.
76. C. C. Nguyen and B. L. Lucht, Journal of The Electrochemical Society, 2014,
161, A1933-A1938.
77. S. Uchida, M. Yamagata and M. Ishikawa, Journal of The Electrochemical
Society, 2015, 162, A406-A412.
78. J. Li, N. J. Dudney, J. Nanda and C. Liang, ACS Applied Materials & Interfaces,
2014, 6, 10083-10088.
79. Y. Jin, S. Li, A. Kushima, X. Zheng, Y. Sun, J. Xie, J. Sun, W. Xue, G. Zhou, J.
Wu, F. Shi, R. Zhang, Z. Zhu, K. So, Y. Cui and J. Li, Energy & Environmental
Science, 2017, 10, 580-592.
80. S. Hy, Y.-H. Chen, H.-M. Cheng, C.-J. Pan, J.-H. Cheng, J. Rick and B.-J.
Hwang, ACS Applied Materials & Interfaces, 2015, 7, 13801-13807.

26
:
THE ROLE OF MASS LOADING ON THE ELECTROCHEMICAL
PROPERTIES OF A HIGH-CAPACITY ANODE FOR LITHIUM-ION
BATTERIES
2.1 Introduction
Research on high capacity electrodes for Li-ion batteries (LIBs) has been driven by
increasing interests in their applications in the battery electric vehicles (BEVs) and large-
scale energy storage systems. However, most BEVs are not yet competent enough to
replace today’s internal-combustion-engine vehicles (ICEVs) simply because of the cost,
specific energy, and the charging time of LIBs. One major challenge for the large-scale
commercialization of BEVs is to offer similar vehicle range and fueling convenience as in
ICEVs, which inevitably requires the development of high energy density batteries. As a
result, alloying elements such as tin (Sn), germanium (Ge), and silicon (Si) have received
increasing attentions due to their high specific capacity. Si, with about 10 times the
theoretical specific capacity (3,579 mAh∙g-1, Li15Si4) than the graphite electrode (372
mAh∙g-1), because of its high capacity and low cost.1, 2 The promising electrochemical
properties of Si, however, are often overshadowed by the fracture of the electrode resulted
from the diffusion induced stress during lithiation and delithiation. Upon the full lithiation,
the lattice parameter of Si electrode (5.456 Å)3 increases to 10.60 Å4 forming Li15Si4, which
results in the electrode expansion by 300%5. The resulting fracture of the electrodes leads
to the loss of electrical contacts between the active materials and current collectors, and
27
then the capacity fade. Another group IV element, Ge also exhibits high specific capacity
of 1,600 mAh∙g-1,6 as well as much higher electrical conductivity (Ge: 2.1 S m-1, Si :
1.6×10⁻³ S m-1) and Li ion diffusivity than that of Si (Ge: 6.25×10⁻¹² cm2s-1, Si: 1.9×10⁻¹⁴
cm2s-1).2 These properties make Ge as a candidate for LIBs with both high power and high
energy.
Although it is known that it is as important to fabricate thicker electrodes for the
development of high capacity anodes, it has not been much reported yet. A study on the
characterization of commercial lithium ion batteries by Johnson and White showed that the
mass fraction of electrodes (anode and cathode) in a cell was typically around 60%.7 The
current collector and separator are the non-active cell components which reduce the energy
density while increasing the overall cost. Therefore, to decrease the cell costs while
increase the energy density, the thicker electrodes are desirable.8 The successful
implementation of electrodes with a high areal mass capacity (> 3 mAh cm-2) faces several
challenges, including the delamination of the electrode from the current collector, increased
electronic and ionic resistance, poor electrolyte penetration, and underutilization of the
electrode at high current densities.9-12 As a result, the electrodes with a low areal mass
capacity (< 3 mAh cm-2) are often reported in literature.13,14 A few very recent studies on
Si electrodes showed the areal capacity >3 mAh cm-2 for about 100 cycles, however the
current density used to achieve such performance was very low (e.g. 0.1 mA cm-2).13, 15
Similarly, for the Ge electrode, majority of the literature reports have presented
relatively low mass loadings (<1 mgcm-2).16-18 Recently, Lee et al. reported a higher areal
capacity greater than 2 mAh/cm2 for the Ge electrode with a mass loading of 1.96 mgcm-
2under the current density of 1 mAcm-2.14

28
Here, we report our study on the effect of mass loadings on the electrochemical
performance of porous Ge electrodes where the areal capacity up to 3.3 mAh cm-2 has been
achieved at the high current density of 1 mA cm-2. Full cells consisting of porous Ge along
with the commercial lithium cobalt oxide (LCO) were also investigated at different current
densities (0.4 and 1 mA cm-2).
2.2 Experimental
Porous Ge was synthesized by the reduction of GeO2 (Alfa Aesar) in a tube furnace
using the hydrogen gas at 450 C.8 The electrodes were prepared by tape casting the slurry
prepared by mixing 20 wt% poly (acylic) acid (Alfa Aesar) as the binder, 10 wt% acetylene
black as the conductive agent and, 70 wt% of the active material. Electrodes of different
mass loadings were prepared by setting the blade clearance by adjusting the micrometer
heads (Starrett 463) in the doctor blade.
CR2016 coins cells were prepared with Li metal as the counter/reference electrode
for the half cells while commercial LiCoO2 (MTI corporation) electrodes were used to
study the full cell cyclic performance. For each thickness, 3-4 cells were prepared to
examine the reproducibility. The electrolyte was obtained from Novolyte technologies,
which consisted of 1 M LiPF6 in ED/DEC/DMC (1:1:1 by vol) with 2 wt% VC. To obtain
longer cycle life, 10 wt% FEC (of the electrolyte) as additive was added. The cells were
cycled in Arbin BT2000 battery tester.
The morphology and phase evolution of the as-synthesized samples were examined
by x-ray diffraction (XRD, Rigaku) and scanning electron microscopy (SEM; ZEISS
FESEM). The grain boundary region was examined by high resolution transmission
electron microscopy (HRTEM, Hitachi H-9500). For post cycling transmission electron

29
microscopy (TEM) analysis of the electrodes, the coin cells were disassembled inside the
Ar-filled glove box and washed with DMC to remove the excess electrolyte. Finally, the
electrodes were dried in vacuum.
2.3 Results and Discussion
Figure 2.1. SEM images of (a) commercialGeO2 (b) porous Ge, (c) TEM image of porous
Ge particle and (d) Powder XRD reflections of the commercial GeO2 and Ge reduced from
it at 450 ºC, (e) Nitrogen adsorption/desorption isotherm of porous Ge
During a reduction process, GeO2 evolves to form Ge, which is accompanied by a
decrease in volume. If the reduction temperature is not high enough to sinter Ge (e.g. T <
600 oC), porous Ge powders will be formed, as shown in Figure 2.1. The electron
microscope images shown in Figure 2.1b and 2.1c display the porous nature in Ge powders
and interconnected grains with a grain size ~50-100 nm. PXRD confirms the formation of
(c)
(d)
(a) (b)
(e)

30
elemental Ge phase upon the reduction of GeO2 at 450ºC under hydrogen (Figure 2.1d).
The grain size was calculated ~50 nm by using the Scherer equation (d = 0.9 /cos),
where, is the x-ray wave length, is the line broadening at the half maximum intensity,
and is the Bragg angle. Thee instrumental broadening was subtracted using the standard
Si XRD parameters. The surface area of the porous Ge, 37.8 m2g-1, was determined by
Brunauer-Emmett-Teller (BET) technique, and found to be examined the pore size
distribution, Barrett-Joyner-Halenda (BJH) technique and the total pore volume was 0.075
cm3g-1. The average pore size was found to be between 6.8-7.96 nm. The
adsorption/desorption plots (Figure 2.1e), suggest that the material exhibits mesoporous
behavior.
The porous nature and nanosized grains in Ge powders offer several advantages,
which are essential for high power battery applications. First, the diffusion length for the
lithium ion are short, allowing a rapid charge and discharge compared to the bulk material.
Furthermore, the porous materials are capable of accommodating the volume change with
their pores, therefore improving the mechanical integrity in the high capacity electrode.
The electrochemical performance of the porous Ge electrode was evaluated using
galvanostatic charge/discharge process between 0.02 and 1.2 V vs Li/Li+. At a lower
current density of 1,000 mA g-1 (Figure 2.2a), 340 stable cycles were obtained with a final
specific capacity ~1,300 mAh g-1. The specific capacities were calculated based on the
weight of active materials. The continuous increase in the specific capacity at the initial
cycles may be attributed to the electrode activation, forming more active sites as lithiation
proceeds deeper into the active materials19, 20. The coulombic efficiency (CE) of the first
(b)
(c)
(a)
(d)
Figure 2.2 (a) Cyclic performance of porous Ge electrode at the current density of 1000
mA∙g-1, and corresponding (b) voltage profile and (c) differential capacity plots and (d)
cyclic performance at the high current density of 8 A∙g-1, after 20 formation cycles at 800
mA∙g-1.

31
cycle was 60%, which increased to 92% at the 2nd cycle, and reached ~99% in the 10th
cycle. The low CE may result from side reactions such as electrolyte reduction as well as
the exposure of the new electrode surface due to mechanical disintegration.21 In the
following cycles, a stable solid electrolyte interphase (SEI) is formed and the coulombic
efficiency reached up to >99.5%, suggesting the stability of the electrode and the SEI layer.
Figure 2.2b illustrates the voltage profile for the electrode cycled at current density
of 1,000 mA∙g-1. The discharge curves display stable voltage plateaus starting the fifth
cycle, with a negligible change in the overpotential, indicating a fast ion transport and
lithiation kinetics. The lithiation/delithiation behavior of the electrode was examined by
differential capacity plots, as shown in Figure 2.2c. Each peak in the plot, represents an
electrochemical reaction or a phase change.22 The presence of peaks at 0.49, 0.35 and 0.17
V vs Li/Li+ suggests there exists three alloying steps. Initially, the crystalline Ge is
converted to an amorphous lithiated phase(a-LixGe), and eventually a crystalline phase (c-
Li15Ge4) is formed after the full lithiation process. No irreversible peaks are observed in
the plot in the given voltage range, suggesting the absence of side reactions in the electrode
which would result in the capacity fade. The delithiation process initially occurs at 0.39
and 0.54 V vs. Li/Li+. Later, for instance, after 50 cycles, it occurs primarily around 0.39
V vs Li/Li+, suggesting a single step delithiation (dealloying) process. During the
delithiation process, the appearance of broader peaks (e.g. at 0.54 V vs. Li/Li+) and gradual
vanishing of sharp peaks (e.g. at 0.39 V vs Li/Li+) are attributed to the fact that the
delithiation process increasingly occurs in an amorphous phase.23, 24,25
Figure 2.2d shows the cyclic performance at the high current density of 5 C (1 C
= 1,600 mA g-1) up to 1,800 cycles. After the initial 20 activation cycles at 0.5 C (800 mA

32
g-1), approximately 73% of the initial reversible capacity (649 to 469 mAh g-1) was retained
at the end of 1,800 cycles. The CE of the 1st cycle was 76% and remained over 99% starting
from the 3rd cycle. The mass loading of this electrode was 0.56 mg∙cm-2. The excellent long
term cycleability at such a high rate is due to the porous nature in Ge electrodes, which can
sustain the lithiation induced stress without undergoing pulverization, thus providing better
electrolyte accessibility and shorter Li ion diffusion lengths at the same time.
Figure 2.3 presents the rate capability at the current densities of 0.2, 1, 2, 4, 8 and
16 A∙g-1 which delivered the reversible specific capacities of 1,368, 1,254, 1,031, 894, 686,
and 437 mAh∙g-1 respectively. The reversibility was studied by cycling the cells again, at
8 A∙g-1 and 1 A∙g-1 after 42 cycles, which delivered 685 mAh∙g-1 and 1,173 mAh∙g-1
respectively. Such a good rate performance is attributed to the porous morphology with
small grain size (50 nm) and high surface area (37.8 m2g-1), which provide greater
accessibility of the electrolyte to the active sites compared to dense bulk electrodes. The
effect of grain size on the lithiation may be studied by using the diffusion approximation
equation, =x2/4D, where = time (seconds), x = diffusion length (m) and D is the diffusion
coefficient (m2s-1). Therefore, a 50 nm Ge particle could be fully lithiated 400 times faster
than that of a 1 micron Ge particle. Further, the rapid diffusion of Li ions causes a shorter
lattice strain relaxation time, allowing the material to be strained quickly and uniformly.
This facile strain relaxation is believed to prevent microstructural damage in the electrode
particles.26
A possible way to address the demand for high energy batteries is to increase the
areal capacity or the thickness of the electrode.12 However, for a thick electrode operating
at a higher current density (e.g. > 1 C), the transport of Li-ions in the electrolyte limits the

33
full utilization of the electrode, thus leads to a decrease in the areal capacity.12, 27 In
addition, a recent study by Gallagher et al. reported the accelerated capacity fade in graphite
electrodes under a high areal capacity (>3.3 mAh∙cm-2) due to lithium plating at the current
densities greater than 1 C.12 Therefore, the commercially available cells for various
applications typically deliver the areal capacity of 2.5-3.5 mAh∙cm-2.1
Figure 2.3 Rate performance of Ge electrode at different current densities
Figure 2.4. Cyclic performance of porous Ge electrodes with high mass loadings (a), and
the areal capacity as a function of various mass loadings (b) Both (a) and (b) are obtained
at the current density of 1 mA∙cm-2. The mass loadings involve the mass of binder as well
as the conductive agents.
(a) (b)

34
Majority of the literature on the Ge electrodes reported relatively low mass loadings
(<1 mg∙cm-2).16-18 Recently, Lee et al. achieved a higher areal capacity (~ 2 mAh∙cm-2) for
the Ge electrode with a mass loading of 1.96 mg∙cm-2 under the current density of 1
mA∙cm-2.14 The areal capacity of our porous Ge as the function of different mass loadings
is shown in Figure 2.4a. With the mass loading of 4.45 mg∙cm-2, the areal capacity of 3.47
mAh∙cm-2 was observed at the end of 100 cycles. This result exceeds any areal capacity
currently reported, which also falls within the expected commercial capacity loadings.
Figure 2.4b illustrates the relationship between the areal capacity and the mass loadings
for the porous Ge electrode (between 0.38 to 4.45 mg∙cm-2). A linear dependence of mass
loadings on the areal capacity is observed, which indicates the current density used (1
mA∙cm-2) did not cause the underutilization of electrode in the given mass loadings
(thicknesses) due to transport limitations of Li ions in the electrolyte.
Figure 2.5 Electrochemical performance of porous Ge electrode, (a) cyclic performance
of Ge and LCO full cell at 0.4 mA∙cm-2 . The capacity loadings on Ge and LCO were 1.55
and 1.856 mAh∙cm-2 respectively. (b) corresponding voltage profile and (c) differential
capacity plot for (a). (d) cyclic performance of Ge vs LCO full cell at 1 mA∙cm-2
(c)
(d)
(a) (b)

35
To evaluate the practical performance of an electrode, a full cell is required to
measure under various operational parameters (e.g. C-rates, electrolyte formulations,
particle sizes, voltage range etc.). It is common in the open literature that the cyclic
performances of half cells are reported with a Li counter electrode. In this case, the Li
electrode typically serves as an infinite lithium source and does not contribute to the
capacity loss in the cell, even after a significantly irreversible loss of Li during the SEI
formation at the initial cycles. A full cell with a similar specific capacity would undergo a
decrease in its areal capacity due to the formation of SEI layers which trap Li-ions. Figures
2.5 (a) and (b) show the cyclic performances of porous Ge electrode in a full cell
configuration at 0.4 mA cm-2, which adopts a commercial lithium cobalt oxide (LCO)
cathode in the voltage range from 2.6 to 3.85 V. The maximum areal capacities for Ge
electrode and the cathode (LCO) were calculated to be 1.55 and 1.86 mAh cm-2
respectively.
The differential capacity plots (Figure 2.5c) exhibit the phase transitions in the
electrodes during charge (alloying with Ge) and discharge (dealloying from Ge) processes.
The charge process proceeds primarily at 3.42, 3.54 and 3.75 V, while the discharge
process occurs initially at 3.39 V and later at a wide voltage range between 3.39 and 3.7 V.
This is in consistent with the broadening of the dealloying peaks in the differential capacity
plots for the Ge vs. Li half cells. The irreversible capacity loss during the first cycle stems
from the formation of SEI, as evident by a large irreversible peak around 3.58 V, which
disappears at the later cycles.
The full cell results obtained at the higher current density of 1 mA cm-2 is presented
in Figure 2.5d. The maximum capacities for the Ge and LCO electrodes were calculated

36
to be 1.35 and 1.856 mAh cm-2. The areal capacity at the end of 180 cycles was 0.68 mAh
cm-2 with CE at 99.6%. The porous morphology, despite providing cyclic stability at the
later cycles, results in large capacity loss at the initial cycles due to an increase in the side
reactions resulting from its high surface area.
High capacity electrodes, for instance Si and Ge, have been known to undergo a
large volume expansion (up to 300%) upon full lithiation.28, 29 The large expansion and
contraction during the cycling results in the pulverization of active materials, leading to the
loss of electrical contacts with other active materials or the current collector.30 Therefore,
maintaining the physical connection between the active materials, current collector,
electrolyte and binder is a key requirement to achieve the cyclic stability.31-33
Figure 2.6 TEM images and selected area electron diffraction (SAED) pattern of porous
Ge (a and b) before cycling and (c and d) after 10 cycles at 100 mA g-1.
(c) (d)
(a) (b)

37
The morphology and the phase transformation in the electrode before and after
cycling were examined by TEM, as shown in Figure 2.6. Previous reports on Ge electrode
have found the fully de-lithiated phase to be amorphous Ge, after it undergoes full
lithiation.28, 34, 35 As indicated by the selected area electron diffraction (SAED) pattern, the
polycrystalline Ge (Figure 2.6b) cycled 10 times at 100 mA g-1 in our electrode transforms
into completely amorphous Ge (Figure 2.6d) after full delithiation. The fully amorphous
de-lithiated Ge also suggests that it was fully lithiated before the delithiation process as
indicated by the absence of crystalline phase in the SAED for delithiated electrode. The
presence of non-lithiated core in the Ge would appear as distinct spots in SAED. The TEM
image in Figure 2.6c indicates that the porous Ge lost it initial morphology (Figure 2.6a)
after cycling. Several grains appear to have been connected together by the removes of
pores. However, even after undergoing full lithiation and delithiation, the Ge grains are
able to maintain contacts with the other active Ge grains, thereby, resulting in the cyclic
stability of the electrode. Therefore, the stability of cyclic performance of the porous Ge
electrode may be attributed to its ability to prevent the loss of active materials and maintain
the electrical contacts between the active materials.
2.4 Conclusion
In summary, the porous Ge electrode exhibits high areal capacity and stable full cell
cyclic performance for lithium-ion battery. At the current density of 8 A g-1, over 1800
cycles were achieved with ~73% (649 to 469 mAh∙g-1) capacity retention. The high areal
capacity up to 3.3 mAh g-1 was obtained. Examination of post cycled electrode suggested
that the stability of the electrode stemmed from the ability of the individual grains to

38
maintain the electrical contacts with each other, even after a large volume change upon full
lithiation.

39
References
1. N. Nitta and G. Yushin, Particle & Particle Systems Characterization, 2014, 31,
317-336.
2. P. R. Abel, A. M. Chockla, Y.-M. Lin, V. C. Holmberg, J. T. Harris, B. A.
Korgel, A. Heller and C. B. Mullins, ACS Nano, 2013, 7, 2249-2257.
3. K. Seino, W. G. Schmidt, J. Furthmüller and F. Bechstedt, Physical Review B,
2002, 66, 235323.
4. Y. Kubota, M. C. S. Escaño, H. Nakanishi and H. Kasai, Journal of Applied
Physics, 2007, 102, 053704.
5. Q. Zhang, Y. Cui and E. Wang, Modelling and Simulation in Materials Science
and Engineering, 2013, 21, 074001.
6. F.-S. Ke, K. Mishra, L. Jamison, X.-X. Peng, S.-G. Ma, L. Huang, S.-G. Sun and
X.-D. Zhou, Chemical Communications, 2014, 50, 3713-3715.
7. B. A. Johnson and R. E. White, Journal of Power Sources, 1998, 70, 48-54.
8. M. Singh, J. Kaiser and H. Hahn, Journal of The Electrochemical Society, 2015,
162, A1196-A1201.
9. X.-K. Zhu and J. A. Joyce, Engineering Fracture Mechanics, 2012, 85, 1-46.
10. N. Mahmood and Y. Hou, Advanced Science, 2014, 1, 1400012-n/a.
11. L. Hu, F. La Mantia, H. Wu, X. Xie, J. McDonough, M. Pasta and Y. Cui,
Advanced Energy Materials, 2011, 1, 1012-1017.
12. K. G. Gallagher, S. E. Trask, C. Bauer, T. Woehrle, S. F. Lux, M. Tschech, P.
Lamp, B. J. Polzin, S. Ha, B. Long, Q. Wu, W. Lu, D. W. Dees and A. N. Jansen,
Journal of The Electrochemical Society, 2016, 163, A138-A149.
13. Z. Chen, C. Wang, J. Lopez, Z. Lu, Y. Cui and Z. Bao, Advanced Energy
Materials, 2015, 5, 1401826-n/a.
14. G.-H. Lee, S. Lee, C. W. Lee, C. Choi and D.-W. Kim, Journal of Materials
Chemistry A, 2016, 4, 1060-1067.
15. M. Marinaro, M. Weinberger and M. Wohlfahrt-Mehrens, Electrochimica Acta,
2016, 206, 99-107.
16. K. H. Seng, M.-H. Park, Z. P. Guo, H. K. Liu and J. Cho, Angewandte Chemie
International Edition, 2012, 51, 5657-5661.

40
17. X. Li, Z. Yang, Y. Fu, L. Qiao, D. Li, H. Yue and D. He, ACS Nano, 2015, 9,
1858-1867.
18. S. Fang, L. Shen, P. Nie, G. Xu, J. Wang and X. Zhang, Journal of Materials
Science, 2014, 49, 2279-2285.
19. A. Pan, Y. Wang, W. Xu, Z. Nie, S. Liang, Z. Nie, C. Wang, G. Cao and J.-G.
Zhang, Journal of Power Sources, 2014, 255, 125-129.
20. X. Jiang, W. Yu, H. Wang, H. Xu, X. Liu and Y. Ding, Journal of Materials
Chemistry A, 2016, 4, 920-925.
21. J. Xu, R. D. Deshpande, J. Pan, Y.-T. Cheng and V. S. Battaglia, Journal of The
Electrochemical Society, 2015, 162, A2026-A2035.
22. J. Graetz, C. C. Ahn, R. Yazami and B. Fultz, Journal of The Electrochemical
Society, 2004, 151, A698-A702.
23. E. J. Powell, S. M. Wood, H. Celio, A. Heller and C. B. Mullins, Journal of
Materials Chemistry A, 2015, 3, 23442-23447.
24. M. N. Obrovac, Google Patents, 2006.
25. K. C. Klavetter, S. M. Wood, Y.-M. Lin, J. L. Snider, N. C. Davy, A. M. Chockla,
D. K. Romanovicz, B. A. Korgel, J.-W. Lee, A. Heller and C. B. Mullins, Journal
of Power Sources, 2013, 238, 123-136.
26. R. Yazami, Nanomaterials for Lithium-Ion Batteries: Fundamentals and
Applications.CRC Press, 2013, 75.
27. M. Doyle and J. Newman Journal of Applied Electrochemistry, 1997, 27, 846-
856.
28. W. Liang, H. Yang, F. Fan, Y. Liu, X. H. Liu, J. Y. Huang, T. Zhu and S. Zhang,
ACS Nano, 2013, 7, 3427-3433.
29. B. Liang, Y. Liu and Y. Xu, Journal of Power Sources, 2014, 267, 469-490.
30. C. K. Chan, H. Peng, G. Liu, K. McIlwrath, X. F. Zhang, R. A. Huggins and Y.
Cui, Nat Nano, 2008, 3, 31-35.
31. H. Wu, G. Yu, L. Pan, N. Liu, M. T. McDowell, Z. Bao and Y. Cui, Nature
Communications, 2013, 4, 1943.
32. N. G. Rudawski, B. L. Darby, B. R. Yates, K. S. Jones, R. G. Elliman and A. A.
Volinsky, Applied Physics Letters, 2012, 100, 083111.
33. S. H. Ng, J. Wang, D. Wexler, S. Y. Chew and H. K. Liu, The Journal of Physical
Chemistry C, 2007, 111, 11131-11138.

41
34. Y. Liu, S. Zhang and T. Zhu, ChemElectroChem, 2014, 1, 706-713.
35. L. Y. Lim, N. Liu, Y. Cui and M. F. Toney, Chemistry of Materials, 2014, 26,
3739-3746.

42
:
SUBMICRO-SIZED SILICON-GERMANIUM SOLID SOLUTIONS
WITH HIGH CAPACITY AND LONG CYCLABILITY FOR LITHIUM
ION BATTERIES
3.1. Introduction
Anode material development for high performance lithium-ion batteries has been
driven by the recognition of mitigating the adverse effects of pulverization in high capacity
materials, such as silicon and tin. Significant progress has been made since 20081 towards
improving energy storage capacity over time in silicon. Silicon is an attractive anode
candidate because of its high theoretical capacity of 4200 mAh g-1, corresponding to Li22Si5
composition with a lattice constant of 18.66 Å and 3580 mAh g-1 for Li15Si4 with a lattice
constant of 10.777 Å.2,3 As a result, a large volume change (~ 400%) from Si (lattice
constant 5.431 Å and four silicon atoms in a unit cell)4 to Li22Si5 during lithiation (alloying
with Li) process results in a loss of capacity, attributed to the pulverization of the anode
particles, loss of contacts with the binder, disintegration of anode and subsequent
delamination from the current collector.5 Recent in-situ electron microscopic study detailed
an orientation-dependence of lithiation process in silicon which caused the anisotropic
swelling.6 Theoretical calculations based on continuum mechanics show the diffusion-
induced stress during electrochemical reaction depends upon the particle size of anodes
and the critical size for Si is ~ 130 nm.7 When the anode particles are smaller than the
critical size, the surface energy is hypothesized to be capable of balancing diffusion-
43
induced stresses, thus enable a stable cycle performance. Indeed, some promising
experimental strategies have shown feasibility to reducing the detrimental effects of
structural changes in anodes, including (1) to reduce the characteristic size of Si by
synthesizing nano-sized materials, which can provide shorted lithium diffusion distances
and accommodate large strain without pulverization to maintain good electronic contact
with the substrate,1 (2) to lessen the total volume expansion effects by tailoring the
nano/microstructures, crystallinity (amorphous, coatings), and the integrated network
between anodes and binder,8-11 and (3) to tune the chemical composition, including
alloying9 or composite with SiO for instance10,11 to improve the fracture toughness of the
materials.12,13
While the nano-sized materials as anodes show the promise, there is a need to utilize
submicro/micro-sized materials for large-scale battery applications (e.g. electric vehicle)
because of their cost-effective process, high package density, ease to scale-up, and less
undesirable side reactions between submicro/micro-sized anodes and the electrolyte. To
improve the electrochemical performance of submicro-sized Si, meanwhile, keeping its
high capacity, Ge (1620 mAh g-1) and Si formed solid solution is an optimal choice.
Addition of Ge has been shown to improve the capacity retention in Si-Ge nanowires14 and
mechanically milled powders.15 However, more studies on process-structure-property
relations in the materials from a new synthetic route are needed to fully exploit their
potential. The mechanism still remains elusive. It is known that the addition of a solute
(Ge) into silicon creates a local stress field during the formation of solid solution, which
interacts with resident dislocations and subsequently impedes their motion. As a result, an
increase in yield stress in silicon-based anodes can be obtained, which are capable of

44
withholding greater stresses to initiate slip and the attendant yielding. Here we report that
a complete miscible Si-Ge solid solution series in a bulk form.16 The solid solution
synthesis is a simple single step process, which is easily scalable and cost- effective. The
process can be used to prepare anodes in kilograms per batch. Stable specific capacity was
obtained in Si-Ge solid-solutions. Despite the volume change of ~260%, the fracture
toughness of lithiated Ge is much larger than that of lithiated Si.17 Additionally, in
comparison with Si, Ge exhibits both higher electrical conductivity (104 times than that of
Si)18 and higher ionic diffusivity for lithium ions (400 times of Si).19 Electrochemical
performance tested results show that the crystalline Si-Ge solid solution electrodes
delivered much better stability than that of Si and Ge only, particularly in Si0.50Ge0.50. We
obtained a stable capacity of 1210 mAh g-1 at the current density of 500 mA g-1 after 80
cycles and 610 mAh g-1 at the current of 1600 mA g-1 after 400 cycles based on the total
mass of the electrode. In situ XRD technique was employed to investigate the phase
evolution during the electrochemical cycling.
3.2. Experimental
3.2.1 Materials preparation and characterization
Silicon (laser synthesized, US Research Nanomaterials) and germanium (Alfa
Aesar) powders were mixed with a proper ratio to form Si1-xGex. Boron powders were
added to Si1-xGex to obtain 2 wt.%. The mixed powders were added with isopropanol and
then kept ultrasonic dispersing for 30 min. The mixture was vacuum dried at 120 C for 2
hours, followed by heating the mixture up to the temperature of 1140C for 4 hours in the
presence of continuous flow of hydrogen gas (200 sccm). X-ray diffraction (XRD, Rigaku
X-ray diffractometer, Cu-K) analysis was performed to study the phase structure and

45
crystallinity. The particle size and the morphology of the anode materials were studied by
using a scanning electron microscopy (Zeiss Ultraplus Thermal Field Emission SEM). The
elemental mapping was carried out by using the aberration corrected scanning TEM
(STEM FEI Titan 80-300) with an energy dispersive spectroscopy (EDS).
3.2.2 Electrochemical measurements
The slurry for the working electrode consisting of 80 wt.% of active materials,10
wt.% of carbon black (1400 m2/g, Akzo Nobel Surface Chemistry, Inc.), and 10 wt% of
sodium alginate binder, dispersed in deionized water (MP Biomedicals, LLC), which were
mixed together followed by ball milling for eight hours. Finally, the slurry was casted on
a copper foil using a doctor blade, followed by vacuum drying at 90C for 16 hours and
stored inside a globe box under argon atmosphere.
Coin cells were assembled inside the argon-filled globe box with 1 M LiPF6 in
dimethyl carbonate and fluoroethylene carbonate (1:1 by volume) as the electrolyte and
lithium metal (Alfa-Aesar, 99.9%) as the counter electrode and Celgard 2400 as the
separator. The cells were galvanostatically discharged and charged on a battery test system
(Arbin BT2000) between 0.02 to 2.0 V at room temperature. The specific capacities were
measured based on the total mass of the electrode materials including the binder and the
conductive agent.
3.3. Results and Discussion
3.3.1 Theoretical Analysis of Strengthening in Si-Ge Solid-Solutions
Material fracture occurs when the energy available for the crack growth is sufficient
to overcome the resistance of the materials. The fracture toughness of a material represents
the resistance of a material (e.g. surface energy and plastic work) to the propagation of

46
defects such as dislocations. A number of mathematical expressions were developed to
estimate the critical particle size below which the fracture of the particles could be
prevented. Huggins et al. carried out an early attempt to estimate the critical size (dc) of the
anode particles:20
2)
3(
23
T
ICc
B
Kd
(3.1)
where KIC is the fracture toughness of the material, T= (V/V), representing
transformation strain, and B is the biaxial elastic modulus. The common parameters for
silicon are: T = 3, B = 170 GPa,9 KIC = 1.06 MPa·m1/2.21 The critical size is calculated to
be ~ 0.28 nm, which is not congruent with the experimental observations for silicon (up to
150 nm).6 The selection of proper parameters is a ubiquitous challenge in some mathematic
models to predict the critical size.
More than often, the models of lithiation-induced deformation and fracture
assumed the elastic behavior of the electrodes. Recently, Zhao et al. argued that the
observation of large morphological changes clearly indicates that charge/discharge cycles
caused inelastic deformation.22 A new model based on the assumption of inelastic
electrodes was developed by considering elastic-plastic deformation and fracture. This
model works well for high-capacity materials because of their large volume expansion
during lithiation. Center to the development of mathematic models for Si-Ge alloys is to
consider pre-existing flaws, e.g. constraints at the local solute atoms. For a non-linear
elastic body, the energy release rate can be obtained by J Contour Integral, defined as the
change in the potential energy of the material with respect to the change in crack area. For
the lithiation-induced cracks, the mode I fracture (i.e. the tensile stress acts normal to the

47
plane of crack) may be assumed. The concept of J integral applies equally well to structures
failing in elastic conditions and in fully plastic conditions, therefore, KIC is related to JIC
as23
E
KJ IC
JC
)1(2 (3.2)
where is the Poisson’s ratio, and E is the Young’s modulus of the materials. For the
inelastic host materials, Zhao et al. proposed a mathematical relation to estimate the critical
size of the inelastic hosts as electrodes for lithium ion battery by considering diffusion,
elastic-plastic deformation and fracture, as7
2Z
Ed c
(3.3)
where is the fracture energy of the particle, is a yield stress, and Z is dimensionless
number of order unity. We now can estimate the critical size of Si1-xGex by considering JJC
= K and using proper values of E, KIC and . Eq [3] becomes:
22
2
2
2
2
)1()1(
ZE
K
Z
E
E
K
Z
Ed ICIC
c
(3.4)
Mechanical properties, e.g. Young’s modulus, of Si-Ge alloys have been reported,
particularly in Yonenaga’s series of publications for the alloys at high temperatures (>
500oC).12, 13, 24-26 The stress-strain for germanium rich alloy was similar to Ge, likewise
silicon-rich alloy similar with Si. The unique behavior occurs in compositions with x ~0.50
at which an athermal stress is in its maximum.26 Below the athermal stress, dislocations are
pinned due to the dynamic interaction between a solute and surrounding dislocations, thus
strengthening Si-Ge alloys. Although much work was done at high temperatures, these
results are consistent with our electrochemical measurements.

48
3.3.2 Structure, Strain, and Critical Size of Si-Ge Solid Solutions
Silicon and germanium are fully miscible to form crystalline alloys due to their
similar chemical properties, including valence structure, bonding orbitals (sp3), crystal
structure (diamond FCC), and indirect bandgap. Our initial experiment focused on the
refinement of diffraction patterns of the Si-Ge alloys.
Figure 3.1 XRD patterns of Si, Ge and Si-Ge solid solution series
Figure 3.1 shows x-ray diffraction (XRD) patterns of Si1-xGex (x=0-1), suggesting
the formation of single phase solid solutions. The XRD patterns for the mixture of silicon,
germanium and boron particles is included for comparison. To confirm the composition,
elemental distribution of Ge and Si in the solid solutions were examined by elemental
mapping, which are presented in Figure 3.2. Homogenous distribution of Si and Ge in the
all of solid solutions can be observed. The atomic compositions obtained by quantitative
analysis of the elemental mapping results were closed to the feed ratio (Table 3.1).

49
Figure 3.2 TEM images and elemental mapping for Si, Ge and both components for
Si0.25Ge0.75 (a, b,c and d), Si0.5Ge0.5 (e,f,g,h) and Si0.75Ge0.25 (i,j,k,l).
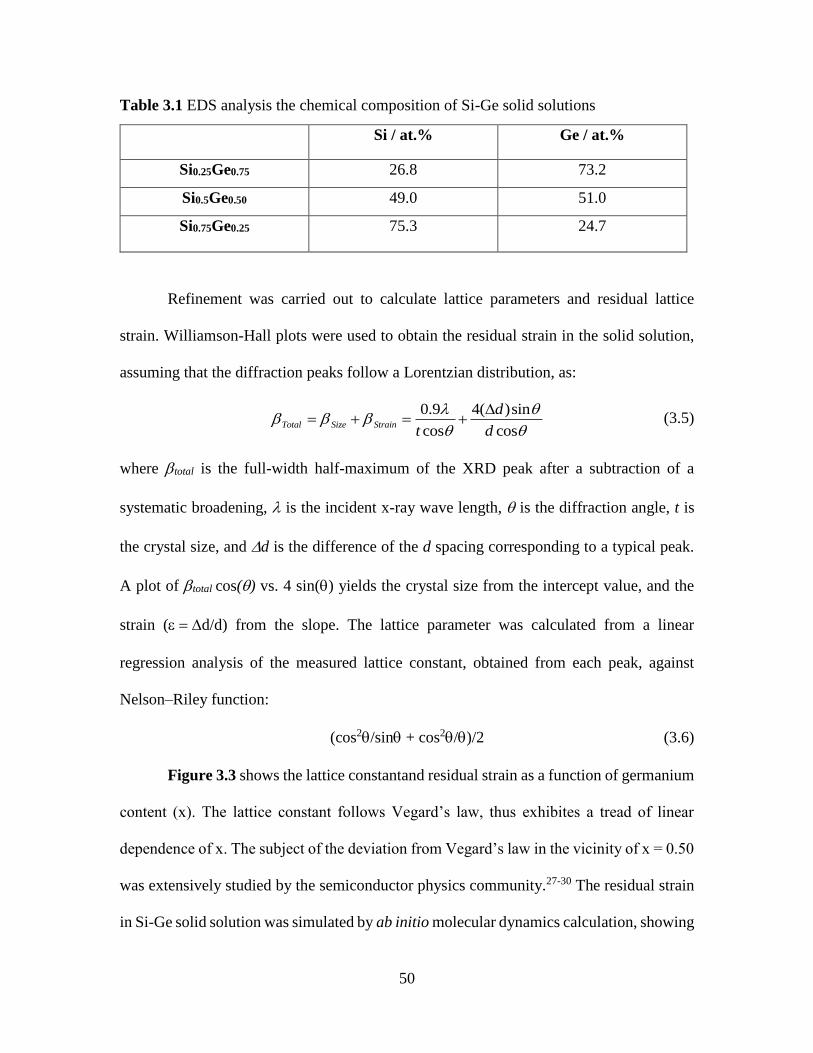
50
Table 3.1 EDS analysis the chemical composition of Si-Ge solid solutions
Si / at.% Ge / at.%
Si0.25Ge0.75 26.8 73.2
Si0.5Ge0.50 49.0 51.0
Si0.75Ge0.25 75.3 24.7
Refinement was carried out to calculate lattice parameters and residual lattice
strain. Williamson-Hall plots were used to obtain the residual strain in the solid solution,
assuming that the diffraction peaks follow a Lorentzian distribution, as:
cos
sin)(4
cos
9.0
d
d
tStrainSizeTotal
(3.5)
where total is the full-width half-maximum of the XRD peak after a subtraction of a
systematic broadening, is the incident x-ray wave length, is the diffraction angle, t is
the crystal size, and d is the difference of the d spacing corresponding to a typical peak.
A plot of total cos() vs. 4 sin() yields the crystal size from the intercept value, and the
strain (d/d) from the slope. The lattice parameter was calculated from a linear
regression analysis of the measured lattice constant, obtained from each peak, against
Nelson–Riley function:
(cos2/sin + cos2/)/2 (3.6)
Figure 3.3 shows the lattice constantand residual strain as a function of germanium
content (x). The lattice constant follows Vegard’s law, thus exhibites a tread of linear
dependence of x. The subject of the deviation from Vegard’s law in the vicinity of x = 0.50
was extensively studied by the semiconductor physics community.27-30 The residual strain
in Si-Ge solid solution was simulated by ab initio molecular dynamics calculation, showing
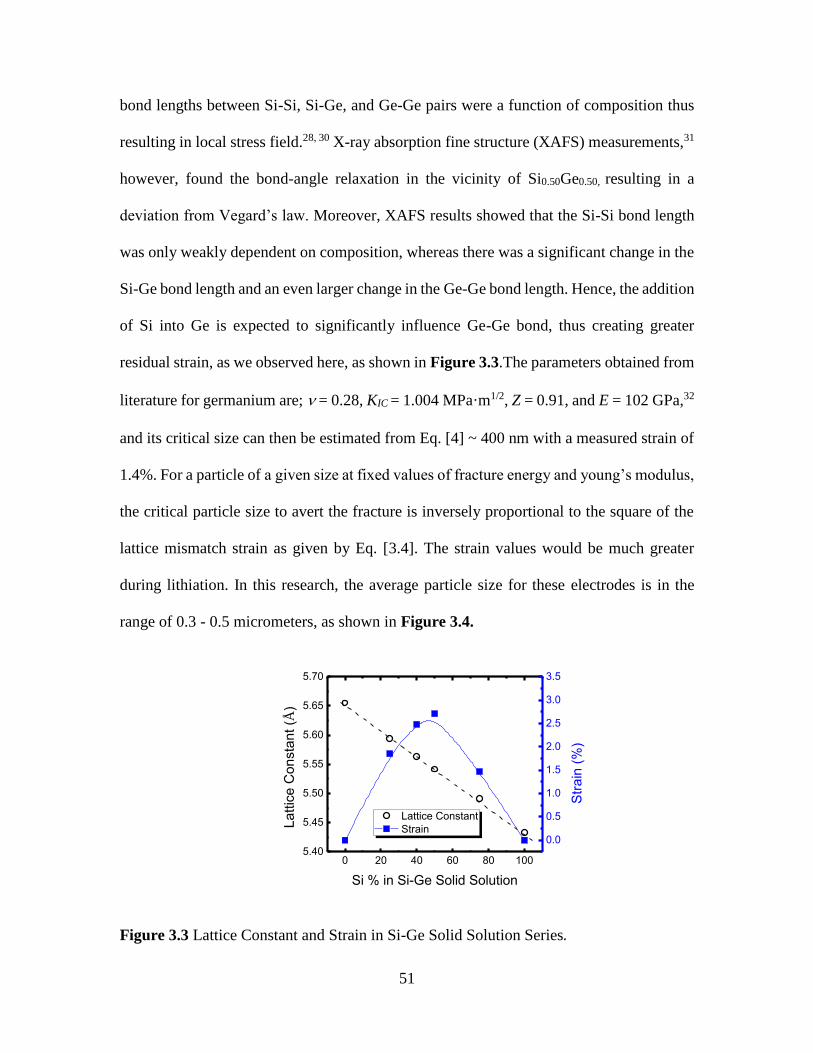
51
bond lengths between Si-Si, Si-Ge, and Ge-Ge pairs were a function of composition thus
resulting in local stress field.28, 30 X-ray absorption fine structure (XAFS) measurements,31
however, found the bond-angle relaxation in the vicinity of Si0.50Ge0.50, resulting in a
deviation from Vegard’s law. Moreover, XAFS results showed that the Si-Si bond length
was only weakly dependent on composition, whereas there was a significant change in the
Si-Ge bond length and an even larger change in the Ge-Ge bond length. Hence, the addition
of Si into Ge is expected to significantly influence Ge-Ge bond, thus creating greater
residual strain, as we observed here, as shown in Figure 3.3.The parameters obtained from
literature for germanium are; = 0.28, KIC = 1.004 MPa·m1/2, Z = 0.91, and E = 102 GPa,32
and its critical size can then be estimated from Eq. [4] ~ 400 nm with a measured strain of
1.4%. For a particle of a given size at fixed values of fracture energy and young’s modulus,
the critical particle size to avert the fracture is inversely proportional to the square of the
lattice mismatch strain as given by Eq. [3.4]. The strain values would be much greater
during lithiation. In this research, the average particle size for these electrodes is in the
range of 0.3 - 0.5 micrometers, as shown in Figure 3.4.
0 20 40 60 80 1005.40
5.45
5.50
5.55
5.60
5.65
5.70
Lattice Constant
Strain
Si % in Si-Ge Solid Solution
La
ttic
e C
on
sta
nt (Å
)
0.0
0.5
1.0
1.5
2.0
2.5
3.0
3.5
Str
ain
(%
)
Figure 3.3 Lattice Constant and Strain in Si-Ge Solid Solution Series.

52
Figure 3.4 SEM images of (a) Si, (b) Si0.25Ge0.75, (c) Si0.50Ge0.50, (d) Si0.75Ge0.25and (e) Ge
before cycling.
3.3.3 Electrochemical performance of Si-Ge Solid Solutions
Coin cells were used to evaluate the electrochemical performance of the Si-Ge solid
solutions. To embody the unique properties of the solid solutions, control experiments were
carried out Si and Ge electrode under same conditions. Figure 3.5 shows the cycling
performance of the Si, Ge, and Si-Ge solid solutions electrodes at a current density of 500
mA g-1 after 5 cycles of activation at 100 mA g-1. It is worthwhile to note that all of the
capacity is based on the total weight of electrodes, which include active materials, binder,
and conductor agent. The first discharge (lithiation) capacities of Si, Si0.75Ge0.25,
Si0.50Ge0.50, Si0.27Ge0.75 and Ge electrodes were 3197.9, 2715.7, 2228.4, 1968.2, and 1499.8
mAh g-1, and their first charge (delithiation) capacities are 2066.3, 2073.4, 1561.1, 1338.9,
and 963.6 mAh g-1, respectively. After five cycles of activitation at 100 mA g-1, the initial
capacity was 417.9, 1869.1, 1425.0, 1277.7, and 844.9 mAh g-1 for Si1-xGex (x = 0, 0.25,
0.50, 0.75, and 1), the corresponding to Coulombic efficiences are 87.1, 98.6, 96.1, 94.9,
(a)
(c) (d) (e)
(b)

53
and 95.4%, at a higher current density of 500 mA g-1, accordingly. The capacity retention
of the five samples in the 80th cycle are 16.0, 55.2, 84.6, 79.2, 98.2% for Si1-xGex (x = 0,
0.25, 0.50, 0.75, and 1).
Figure 3.5 Cyclic capacity performance of (a) Si, (b) Si0.75Ge0.25, (c) Si0.50Ge0.50, (d)
Si0.25Ge0.75 and (e) Ge. (f) Voltage profiles of Ge0.50Si0.50 electrode. The first 5 cycles
were measured at the current density of 100 mA g-1 while the rest were obtained at 500
mA g-1. Capacity is based on total weight of electrode.
As shown in Figure 3.5a, a rapid decrease in capacity was observed in silicon (0.3
– 0.5 micrometers), which consistent with literature reporting of the fracture of silicon
54
electrode with an average particle size > 150 nm.6 With Ge added int to the submicro sized
Si, the capacity retention and cyclic performance are clearly improved. It is illumistrated
that added Ge into Si will enhance the stabilty of Si. More interestingly, with increasing
the composition of Ge, the capacity retention increase at first, then decrease. It indicated
that the different component of Si-Ge solid solutions have different structral stability of
materials. As we discussed above, the Si-Ge solid solutions with different ratio have
different strain, which maybe the key part to effect the cycliability of Si-Ge solid soltuions.
According to the strain in Si-Ge solid solutions (Figure 3.3), the strain of Si0.5Ge0.5 solid
solution is the highest. As we known, the residual strain of the solid solution provides the
resistance for the movement of dislocations, due to interaction between the stress field of
the solute and the dislocation. Highest residual strain obtained around equi-molar
concentration. Compared to the Ge and Si0.5Ge0.5 solid solution electrode, although the
capacity retention of Ge is higher than that of Si0.5Ge0.5 solid solution, the capacity of
Si0.5Ge0.5 solid solution is 1.5 times higher than that of Ge electrode. Meanwhile, the
Coulombic efficiences of the solid solution is 99.4%, which higher than that of Ge (96.2%)
at the 80th cycle. It is clear that the Si0.5Ge0.5 solid soltion elecrode exhibithed the best
cycling performance and the highest capacity amongst the five electrodes, which can be
attributed to the highest stain.
The select voltage profile of the Si, Ge, and Si-Ge solid solutions are displayed in
Figures 3.6a to 3.6d. Compared to Si electrode (Figure 3.6a), the Si-Ge solid solutions
and Ge electrodes exhibited improved capacity retention, suggesting structural stability of
these materials compared to Si electrode. With the component of Ge increase, the length
of a small sloping region between 0.125 and 0.02 V vs Li/Li+ is increase. This sloping

55
region is attributed to LixGe covert to Li15Ge4, which is consistent with in-situ XRD studies
as follows.
Figure 3.6 Voltage profile for 1st, 2nd, 20th, 40th and 50th cycle for (a) Si, (b) Si0.75Ge0.25,
(c) Si0.25Ge0.75 and (d) Ge electrodes
Further research was carried out to investigate the rate capability of the best
performing Si0.50Ge0.50 electrode at various current densities, as shown in Figure 3.7a. The
rate capability of the solid solution is plotted at the current rates of up to 10 A g-1 for the
voltage range of 0.02 V to 2.0 V vs. Li/Li+. The specific capacity based on the total
electrode mass is ~ 1475, 1324, 1171, 982, 789, and 453 mAh g-1 at 0.1, 0.5, 1, 2, 4, and
10 A g-1, respectively. The subsequent cyclic capacity was measured again at 0.5 A g-1,
which was 1209 mAh g-1, indicating the capacity was recovered 91.3% after rate-

56
performance test. The electrode exhibited highest capacity fading at 10 A g-1, with the 15%
capacity loss during a five-cycle operation. Such a rapid capacity degradation during
charging/discharging at 10 A g-1 could be explained by the inhomogeneity in Li distribution
caused by crowded Li in the outer shell of the particles because of the lithiation rate being
faster than diffusion of lithium ion in the active anodes, resulting in large stress in the
particle, as reported by Zhao et al.33 Furthermore, it has been reported that such high stress
could lead to growth of preexisting cracks. The inhomogeneity of Li distribution is higher
at greater lithiation rates, resulting in large lattice mismatch and implying that the charging
rate (alloying with lithium) is the driving force for the fracture of materials. The slight loss
in capacity when the current rate is brought back to 0.5 A g-1 compared to previous cycles
at the same discharge rate could also be explained by the loss of active materials due to
some materials being fractured at a high discharge rate of 10 A g-1.
In order to further assess the stability of the Si0.50Ge0.50 solid solution electrode at
high rates, we evaluated the rate dependence of specific capacity of this solid solution, as
presented in Figure 3.7b. The discharge capacity of the Si-Ge solid solution electrode is
608 mAh g-1 after 400 cycles at a current density of 1600 mA g-1. The capacity retention
of the electrode after 400 cycles is as high as 76.7%, suggesting a marginal degradation
during cycling (~0.058% per cycle). The specific capacity is still about twice its theoretical
value for graphite electrode. This result illustrates that the Si0.50Ge0.50 solid solution
electrode has excellent capacity retention and a long cycle life at high rate.

57
Figure 3.7 (a) Rate capability of the Si0.50Ge0.50 solid solution at different current densities
(0.1 , 0.5, 1, 2, 4 and 10 A/g). (b) Cyclic capacity performance of Si0.5Ge0.5 electrode at the
current density of 1600 mA g-1, after 5 formation cycles at 200 mA g-1.
To understand why the Si0.50Ge0.50 solid solution electrode exhibits excellent
electrochemical performance, we analyzed the differential capacity of the Si, Ge and Si-
Ge solid solution electrodes. Differential capacity analysis was used to study the
mechanism of the electrochemical reactions during the lithiation and delithiation process.
Each peak generally represents an electrochemical reaction or phase transition in the active
material.34 Figure 3.8a - e show the differential capacity plots for solid solution electrodes.
For pure germanium, three peaks are initially observed at 0.14V, 0.27 V, and 0.49 V. After
first few cycles, they center at 0.16V and 0.36 V, suggesting a two-step alloying process.
For the delithiation process, the two peaks were initially observed at ~0.38 V and ~0.51 V.
Ultimately, after a few cycles, a single prominent peak was observed at ~0.39 V, suggesting
a single-step delithiation (dealloying) process.
(a) (b)

58
Figure 3.8 The differential capacity plots for solid solution electrodes for 1st, 2nd, 20th, 40th
and 50th cycle. (a) Si, (b) Si0.75Ge0.25, (c) Si0.50Ge0.50, (d) Si0.25Ge0.75 and (e) Ge electrodes
at the current density of 100 mA/g for the first five cycles and the rest at 500 mA/g
Figure 3.8a presents the dQ/dE plots for the silicon anode showing a single
lithiation and delithiation peak at ~0.1 V and ~0.44 V, respectively for the 1st cycle. Starting
from the 2nd cycle, two lithiation peaks were observed at the ~0.23V and ~0.1 V. Similarly,
two delithiation peaks were observed at ~0.27 and ~0.43 V. Figures 3.8 (b, c and d) show
the dQ/dV plots for the Si0.75Ge0.25, Si0.50Ge0.50 and Si0.25Ge0.75 solid solution electrodes
respectively, corresponding to voltage-capacity relations shown in Figures 3.6a to 3.6d.
For the Si0.25Ge0.75 electrode (Figure 3.8d), the major lithiation peaks can be observed at
~0.34 V and 0.15 V, and the delithiation process appears to be a two-step process at ~0.36
V and ~0.5 V. For the Si0.50Ge0.50 electrode, apart from the first cycle, the three lithiation
peaks are developed at ~0.42V, 0.29V and 0.12 V for rest of the cycles while the
delithiation peaks were observed at ~0.30V and 0.5 V. These results are congruent with the
previous work reported by Abel et al on thin film Si/Ge alloys.9 More discussion is

59
provided below. It may be interesting to note that the position of lithiation peaks are found
to shift to the slightly lower voltages as the concentration of Si increases in the Ge
electrode, indicating the formation of homogeneous solid solutions due to the absence of
separate peaks for pure Si and Ge. Furthermore, post cycling TEM and the corresponding
elemental mapping of the Si0.50Ge0.50 electrode were presented in Figure 3.9, which
revealed Si and Ge element in the solid solution still keep uniform distribution, without
aggreation after cycling. This result corroborates the stable cyclic performance of the Si0.
05Ge0.50 solid solution electrode.
It is commonly known that the ability of metals subject to plastic deformation can
be suppressed by reducing the mobility of dislocations. Alloying a metal with solute atoms
has been known to restrict the movement of dislocations and ultimately resulting in the
increase in tensile and yield strengths. Enhancement of the mechanical strength of silicon
by doping with germanium has been reported in semiconductor community, primarily at
elevated temperatures > 500 oC.12,13 Yonenaga, in several of his publications, reported that
Si/Ge alloy showed a maximum yield stress in Si0.50Ge0.50.26,24 This finding is consistent
with the more stable cyclic capacity observed in Si0.50Ge0.50 solid solution in our work.
Germanium (atomic radius 122 pm) is larger than that of silicon (111 pm) in size, hence
when the larger solute atom (Ge) is added to the solvent atoms (Si), a compressive stress
is generated near Ge atoms. This additional compressive stress can relieve strain created
during lithiation/delithiation, thus enables more stable cyclic performance. From the
differential capacity plots, it is apparent that the largest peak during lithiation of Ge is
formed ~0.16 V, suggesting most volume expansion around that voltage. For Si, however,
the first peak of lithiation forms at ~0.1 V, lower than that of Ge. The first peak of lithiation

60
for solid solutions largely overlaps with that of Ge. Hence, the presence of Ge atoms in the
Si can prevent from fracturing even at the particles sizes larger than the critical size (<150
nm) reported for Si by several other scholars.6,35
Figure 3.9 Post cycling TEM and elemental mapping images of (a,b,c) Si0.25Ge0.75, (d,e,f)
Si0.5Ge0.5 and (g,h,i) Si0.75Ge0.25
3.3.4 Phase evolution investigated by in situ XRD during electrochemical cycling
In situ XRD was used to understand the processes of lithiation and delithiation of
the Si-Ge solid solution anode. In this work, a high power (9 kW) diffractometer enabled
us to determine structures during the first two cycles between 0.01 and 3.0 V at the current

61
density of 0.15 A g-1. In addition to its high power, a significant advantage of this
diffractometer is its fast scan rate which allows one to gather sufficient structural details
during the electrochemical reaction. In addition, the XRD spectra exhibit higher resolution
than these obtained from a synchrotron setup.36,37 As shown in Figure 3.10, the peak
intensity of Si0.5Ge0.5 reflections initially increased during the 1st lithiation cycle, then
decreased (Figure 3.10c). Such increase in intensity is attributed to the reaction of the
residual Ge or Si oxides with Li-ions, which are converted to Ge or Si. When discharging
to ~0.165 V (scan number 20), the intensity of reflection, (220) and (311), is at its
maximum; while the intensity of (111) reflection continued to increase until 0.138 V (scan
number 40), then decreased again. This observation shows that Li-ions react with Si0.5Ge0.5
starting from higher index facets, i.e. (220) and (311), which exhibit more open structure
than that of (111) facet. With more lithium diffusing into the solid solution, the intensity
of all peaks of Si0.5Ge0.5 decreases. Further discharge to 0.112 V (scan number 75), a broad
peak appeared at 2θ ~ 41o, corresponding to nano-sized or amorphous Lix(Ge,Si). Another
broad peak appeared at 2θ ~ 23o when discharged to 0.038 V (scan number 120). When the
cell was fully discharged (scan number 154), the presence of crystalline Li15(Ge,Si)4 was
observed, along with a few broad reflections, suggesting the presence of cluster-size
Lix(Ge,Si). Interestingly, the (111) peak of Si0.5Ge0.5 was still seen after full discharge
which could be due to the high mass loading (~7 mg cm-2) of work electrode. Upon charge,
the reflections of the lithiated phases began to diminish. When charged to 0.608 V (scan
number 249), all peaks of Li15(Ge,Si)4 disappeared. During the delithiation process, the
crystalline phase was converted to nano or amorphous Si0.5Ge0.5 solid solution. In the
second cycle, similar phenomenon was observed, in which all of the crystalline Si0.5Ge0.5

62
disappeared at the end of discharge while the intensity of crystalline Li15(Ge,Si)4 was
stronger than that observed during the 1st cycle.
(a)
(b)

63
Figure 3.10 (a) First two-cycle discharge-charge curves and the corresponding in situ XRD
patterns corrected between 0.01 and 3.0 V at 0.15 A g-1 of the Si0.5Ge0.5 solid solution
anode. Last diffraction scan as background. (b) Discrete XRD, prior to background
subtraction, selected from (a). (c) Selected XRD patterns during the 1st discharge process
of the Si0.5Ge0.5 solid solution anode, prior to background subtraction.
(a)
(c)

64
.
(a)
(b)
Figure 3.11 (a) First cycle discharge-charge curves and the corresponding in situ XRD
patterns corrected between 0.01 and 3.0 V at 0.2 A g-1 of the Si anode. Last diffraction
scan as background. (b) Selected XRD patterns during the 1st discharge process of the Si
anode, prior to background subtraction

65
Figure 3.12 First cycle discharge-charge curves and the corresponding in situ XRD
patterns corrected between 0.01 and 2.0 V at 0.05 A g-1 of the Ge anode. Last diffraction
scan as background. (b) Selected XRD patterns during the 1st discharge process of the Ge
anode, prior to background subtraction.
To better understand the function of Si and Ge in the Si0.5Ge0.5 solid solution,
control experiments were carried out by using the parent Si and Ge anodes, as shown in
Figures 3.11 and 3.12, respectively. The Si anode behaved in a similar manner with
Si0.5Ge0.5, as show in Figure 3.11 with the formation of cluster-type LixSi, which is then
converted to Li15Si4 phase, and finally all of crystalline phase disappeared. It was surprising
to observe that the intensity of all Si peaks decreased at the beginning (Figure 3.11 a),
indicating there is no preferential lithiation facet for Si. For the Ge anode (Figure 3.12),
the first step involved with the conversion of surface GeO2 to Ge, shown by the increase
of the intensity of Ge peaks. The second step was the lithiation process of Ge to form
nanosized LixGe, and Li15Ge4 phase, and then the formation of Li11Ge6 phase. To the best
(b)

66
of our knowledge, the formation of Li11Ge6 was observed for the first time during the in
situ characterization,38,39 likely attributed to the use of high power diffractometer. Finally,
Li11Ge6 phase was converted to cluster-type Ge. According to the selected scan XRD
patterns (Figure 3.12b), the intensity of Ge (111) and (220) peaks increased at the
beginning (scan number 80) due to the conversion of GeO2 to Ge. However, the intensity
of Ge (311) peak decreased, which means that the Li ions react preferentially with Ge at
the (311) face. Based on the in situ XRD of Si and Ge anodes, the addition of Ge into Si
changed the direction of lithiation, result in improving the stability of Si anode.
3.4. Conclusions
A series of Si-Ge solid solutions were synthesized from a facile single step process.
Strain analysis and electrochemical measurements showed the presence of Ge solute
strengthening in Si-Ge solid solutions. The results revealed that Si0.50Ge0.50 exhibits a stable
discharge capacity of 1210 mAh g-1 at current density of 500 mA g-1 after 80 cycles, 610
mAh g-1 at 1600 mA g-1 after 400 cycles based on the total mass of the electrode. The
capacity retention of the electrode after 400 cycles is as high as 76.7%, suggesting a
marginal degradation during cycling (~0.058% per cycle). The observed electrochemical
performance offers a new perspective for the possibility of utilizing the sub-micron sized
SixGe1-x as advanced anode material of lithium ion battery. It can be inferred from the
obtained results that doping Si with Ge enhances the fracture resistance of Si. Solid
solutions with equimolar compositions of Si and Ge produced the stable capacity
performance, which is most likely due to the yield strength being highest at that
composition as reported in literature, implying its better structural stability. In situ XRD
studies were used to understand the phase evolution in Si0.50Ge0.50 electrode during the first

67
two cycles, which possessed three steps during the discharge process and one-step during
the charge processes. More interesting, it revealed that the lithiation process are faster from
the higher index facets than that of the low index facet.

68
References
1. C. K. Chan, H. Peng, G. Liu, K. McIlwrath, X. F. Zhang, R. A. Huggins and Y.
Cui, Nat Nano, 2008, 3, 31-35.
2. A. Dębski, W. Zakulski, Ł. Major, A. Góral and W. Gąsior, Thermochimica Acta,
2013, 551, 53-56.
3. T. D. Hatchard and J. R. Dahn, Journal of The Electrochemical Society, 2004,
151, A838-A842.
4. J. P. Dismukes, L. Ekstrom and R. J. Paff, The Journal of Physical Chemistry,
1964, 68, 3021-3027.
5. C. Wang, H. Wu, Z. Chen, M. T. McDowell, Y. Cui and Z. Bao, Nat Chem, 2013,
5, 1042-1048.
6. W. Liang, H. Yang, F. Fan, Y. Liu, X. H. Liu, J. Y. Huang, T. Zhu and S. Zhang,
ACS Nano, 2013, 7, 3427-3433.
7. K. Zhao, M. Pharr, J. J. Vlassak and Z. Suo, Journal of Applied Physics, 2011,
109, -.
8. S. Murugesan, J. T. Harris, B. A. Korgel and K. J. Stevenson, Chemistry of
Materials, 2012, 24, 1306-1315.
9. P. R. Abel, A. M. Chockla, Y.-M. Lin, V. C. Holmberg, J. T. Harris, B. A.
Korgel, A. Heller and C. B. Mullins, ACS Nano, 2013, 7, 2249-2257.
10. D. Munao, M. Valvo, J. van Erven, E. M. Kelder, J. Hassoun and S. Panero,
Journal of Materials Chemistry, 2012, 22, 1556-1561.
11. J. Guo, A. Sun, X. Chen, C. Wang and A. Manivannan, Electrochimica Acta,
2011, 56, 3981-3987.
12. D. Yang, Y. Xuegong, L. Xiaoqiang, W. Peng and W. Lei, Solid-State and
Integrated Circuit Technology (ICSICT), 2010 10th IEEE International
Conference on, 2010.
13. P. Wang, X. Yu, Z. Li and D. Yang, Journal of Crystal Growth, 2011, 318, 230-
233.
14. T. Song, H. Cheng, H. Choi, J.-H. Lee, H. Han, D. H. Lee, D. S. Yoo, M.-S.
Kwon, J.-M. Choi, S. G. Doo, H. Chang, J. Xiao, Y. Huang, W. I. Park, Y.-C.
Chung, H. Kim, J. A. Rogers and U. Paik, ACS Nano, 2011, 6, 303-309.
15. D. Duveau, B. Fraisse, F. Cunin and L. Monconduit, Chemistry of Materials,
2015, 27, 3226-3233.

69
16. K. Mishra, X.-C. Liu, M. Geppert, J. J. Wu, J.-T. Li, L. Huang, S.-G. Sun, X.-D.
Zhou and F.-S. Ke, Submitted to Jounal of Materials Science, 2017.
17. X. Wang, A. Yang and S. Xia, Journal of The Electrochemical Society, 2016,
163, A90-A95.
18. X. Gao, W. Luo, C. Zhong, D. Wexler, S.-L. Chou, H.-K. Liu, Z. Shi, G. Chen, K.
Ozawa and J.-Z. Wang, Sci. Rep., 2014, 4.
19. J. Graetz, C. C. Ahn, R. Yazami and B. Fultz, Journal of The Electrochemical
Society, 2004, 151, A698-A702.
20. R. A. Huggins and W. D. Nix, Ionics, 2000, 6, 57-63.
21. I. Chasiotis, S. W. Cho and K. Jonnalagadda, Journal of Applied Mechanics,
2005, 73, 714-722.
22. K. Zhao, M. Pharr, J. J. Vlassak and Z. Suo, Journal of Applied Physics, 2011,
109, 016110.
23. X.-K. Zhu and J. A. Joyce, Engineering Fracture Mechanics, 2012, 85, 1-46.
24. I. Yonenaga, Materials transactions, 2005, 46, 1979.
25. I. Yonenaga, Journal of Crystal Growth, 2005, 275, 91-98.
26. I. Yonenaga, Journal of Physics: Conference Series, 2013.
27. J. C. Aubry, T. Tyliszczak, A. P. Hitchcock, J. M. Baribeau and T. E. Jackman,
Physical Review B, 1999, 59, 12872-12883.
28. J. L. Martins and A. Zunger, Physical Review Letters, 1986, 56, 1400-1403.
29. C. Tzoumanekas and P. C. Kelires, Physical Review B, 2002, 66, 195209.
30. M. Yu, C. S. Jayanthi, D. A. Drabold and S. Y. Wu, Physical Review B, 2001, 64,
165205.
31. J. C. Aubry, T. Tyliszczak, A. P. Hitchcock, J. M. Baribeau and T. E. Jackman,
Physical Review B, 1999, 59, 12872-12883.
32. J. J. Wortman and R. A. Evans, Journal of Applied Physics, 1965, 36, 153-156.
33. K. Zhao, M. Pharr, J. J. Vlassak and Z. Suo, Journal of Applied Physics, 2010,
108, 073517.
34. F.-S. Ke, K. Mishra, L. Jamison, X.-X. Peng, S.-G. Ma, L. Huang, S.-G. Sun and
X.-D. Zhou, Chemical Communications, 2014, 50, 3713-3715.

70
35. J. N. Weker, N. Liu, S. Misra, J. C. Andrews, Y. Cui and M. F. Toney, Energy &
Environmental Science, 2014, 7, 2771-2777.
36. K. E. Silberstein, M. A. Lowe, B. Richards, J. Gao, T. Hanrath and H. D. Abruña,
Langmuir, 2015, 31, 2028-2035.
37. S. Misra, N. Liu, J. Nelson, S. S. Hong, Y. Cui and M. F. Toney, ACS Nano,
2012, 6, 5465-5473.
38. X. H. Liu, S. Huang, S. T. Picraux, J. Li, T. Zhu and J. Y. Huang, Nano Letters,
2011, 11, 3991-3997.
39. L. Baggetto and P. H. L. Notten, Journal of The Electrochemical Society, 2009,
156, A169-A175.

71
:
SUBMICRON SILICON ANODE STABILIZED BY SINGLE STEP
CARBON AND GERMANIUM COATINGS FOR HIGH CAPACITY
LITHIUM-ION BATTERIES
4.1 Introduction
During the past few decades, high energy density and sufficient power density have
enabled the widespread application of lithium-ion batteries (LIBs) in the portable
electronics. In recent years, they have attracted greater attention as an energy storage
medium for electric vehicles (EVs). Despite preliminary commercial success realized in
full-electric vehicles (FEVs) , the energy density of the state-of-the-art LIBs (~150 Wh/kg)
is yet not comparable to that of the internal combustion engine.1 For the 2020
commercialization of EV batteries, the United States Advanced Battery Consortium LLC
(USABC) has targeted the energy densities of 235 Wh/kg (system level) and 350 Wh/kg
(cell level) for economically viable applications.2 The critical value of the battery pack
energy density for successful commercialization of FEVs lies around 225 Wh/kg.3
The energy density of LIBs may be enhanced by increasing the cell working
potential (voltage), and/or the specific capacity of the electrode. The state-of-the-art LIBs
using graphite anode (specific capacity: 372 mAh/g) and lithium iron phosphate cathode
(specific capacity: 170 mAh/g) offers the energy density around 150 Wh/kg only.4
Therefore, the development of novel electrodes with a high specific capacity is needed.

72
The silicon (Si) electrode, with a high specific capacity (3579 mAh/g) and low working
potential (~0.5 V vs Li/Li+), has been widely pursued as an attractive alternative to the
graphite electrode. The high specific capacity in Si stems from its ability to incorporate
3.75 Li ions per Si atom (Li15Si4). However, the full lithiation of Si results in a volume
expansion of ~300% in the particle.5 The diffusion-induced stress due to the lithiation can
result in the fracture of individual Si particles, and the consequential loss of electrical
contact with the neighboring active materials or the current collectors. The mechanical
disintegration of the electrode could result in the loss of active materials, as well as increase
side reactions as new surfaces are exposed to the electrolyte.6
Engineering electrode morphology (e.g. porous nanomaterials)7, 8, reducing particle
size (<150 nm)5 and designing exotic nanostructures9-11 (nanowires, nanorods) have been
commonly employed to enhance the mechanical stability of Si electrodes. However, the
promising electrochemical performance delivered by nanomaterials is often accompanied
by the low specific and volumetric energy densities, and increased electrolyte reduction
owing to the high surface area In addition, nanomaterials are prone to undergo aggregation
during the lithiation/delithiation process, resulting in further pulverization in subsequent
cycles.12, 13 The cost and sophisticated synthesis techniques (e.g. chemical vapor
deposition, template growth, and laser ablation) associated with nanomaterials have
prevented the Si battery technology transfer from lab scale coin cells to the battery packs
of electric vehicles (EVs). 14, 15 Therefore, the stabilization of commercially available, low-
cost micro/submicron silicon would help pave the path for achieving scalable, long-cycle-
life, and high-energy-density LIBs, required for next generation applications.

73
A brief survey of recent literature reports reveals limited studies on the stabilization
of micron/submicron-sized Si as compared to the reports on nano-Si (100 nm or less) based
electrodes. Some recent approaches to stabilize macro-Si electrodes include nano-
structured Si-C micro particles16, self-healing polymer coating14, carbon coated sub-micron
Si17 and so on. The nano-structured Si-C micro particles achieved about 200 cycles,
however, the synthesis process required high temperature (950 C) operation, HF etching
(highly hazardous) and acetylene gas (extremely flammable).16 The scalability of such a
process may be challenging.14 Other reports typically have achieved around 100 cycles. 14,
17, 18
A common attribute among the aforementioned processes, involved coating Si with
carbon or a polymer. The significance of carbon coating on electrochemical properties and
the mechanical stability of Si electrode has been extensively studied. For instance, an in-
situ TEM study on the lithiation process examined in carbon-coated Si nanowires, revealed
that the coating not only increased the rate of lithiation but also constrained the total volume
expansion.19 A separate study on carbon coated tin electrodes also observed that the
amorphous carbon coatings prevented the pulverization of ~200 nm tin particles.20
Incorporation of the carbon coating on Si has also been reported to improve the electrical
conductivity due to the reduction of contact resistance between the active materials.21, 22
In this report, we have presented a facile, one-step synthesis of Si@Ge@C core-
shell anode for long life and high capacity LIBs. The advantages of Ge coating in the
electrode are three fold; first, it is an active material with a high theoretical capacity (1600
mAh/g), second, it has a higher fracture resistance than that of Si in the lithiated phase 23,
and third, the difference in the lithiation potential between Si and Ge, allow subsequent
74
release of stress/strain alleviating the mechanical disintegration24, 25. In-situ TEM studies
have also revealed that Ge particles (<620 nm) can avoid pulverization even upon full
lithiation.5 The Ge and coatings offered excellent electrochemical and mechanical
properties, essential for commercial applications.
4.2 Experimental
4.2.1 Synthesis and characterization
The carbon-germanium–silicon (Si@Ge@C) core-shell material was prepared by
thermal decomposition of tetraethyl germanium (CH3CH2)4Ge on Si powders (0.5-2 m).
1.24 grams of tetraethyl germanium (Alfa Aesar, 99%), was mixed with each of the three
different masses (0.12, 0.24 and 0.48 g) of sub-micron-sized Si (Sky Spring nanomaterial’s,
Inc.) and sealed in a ½” inch Swagelok reactor inside an argon glove box. The sealed
reactor was then heated inside a tube furnace at 580C for 5 hours. The product formed
after the decomposition was then transferred from the reactor to the glove box. The
products were respectively named as Si@Ge@C-12 (0.12 gram Si and 1.24 gram
(CH3CH2)4Ge), Si@Ge@C-24 (0.24 gram Si and 1.24 gram (CH3CH2)4Ge) and
Si@Ge@C-48 (0.48 gram Si and 1.24 gram (CH3CH2)4Ge), based on the weight of Si used
for the same amount of precursor.
The as-prepared core-shell material was then characterized by x-ray diffraction
(XRD, Rigaku X-ray diffractometer, Cu K), scanning electron microscopy (SEM, Zeiss
Ultraplus FESEM) coupled with energy-dispersive x-ray spectroscopy (EDXS), raman
spectroscopy (Horiba, 632 nm) and transmission electron microscopy (TEM, FEI Titan 80-
30).

75
4.2.2 Electrochemical tests
The electrodes were prepared by mixing a 80 wt% active material (core-shell
powder), 12 wt% poly(acrylic) acid binder and 8 wt% carbon black with the deionized (DI)
water, which was tape casted on a copper foil. The electrolyte comprised of 1 M LiPF6 in
a mixture of ethylene carbonate (EC) / dimethyl carbonate (DMC) / diethyl carbonate
(DEC) 1:1:1 (vol %) containing 2 wt% vinylene carbonate (VC). 10 wt% fluoroethylene
carbonate (FEC) was also added to enhance the cyclic stability. CR2016 coin cells were
assembled inside the glove box (O2< 0.1 ppm, H2O <0.1 ppm) with Li metal as the counter
/reference electrode. The electrochemical cycling tests were conducted in an Arbin BT2000
battery cycler at a constant-current charge/discharge process between the voltage range of
1.8 – 0.02 V. The specific capacities were calculated based on the weight of active materials
(C, Ge and Si). The mass loadings of the electrodes ranged from 0.5-0.7 mg/cm2.
Electrochemical impedance spectra were obtained using a Biologic potentiostat with a
galvanostatic current amplitude of 100 µA between the frequency 500 kHz and 0.1 Hz. For
post-cycling analysis (SEM, Raman and TEM), the electrodes were disassembled inside
the glove box, and washed with di-methyl carbonate (DMC) to remove the excess
electrolyte, and finally dried in vacuum at 80 °C prior to further characterization.
4.3 Results and Discussion
4.3.1 Material characterization
The morphology of the Si particles before and after coating C and Ge can be
compared in Figure 1. The size distribution of pristine Si is wide, ranging from 0.5 µm to
over 2 µm (Figure 1 a).

76
Figure 4.1 SEM images of (a) Si, (b) Si@Ge@C-12, (c) Si@Ge@C-24 and (d)
Si@Ge@C-48
After coating C and Ge, the random shaped Si particles evolve into spherical or
angular shapes, based on the amount of precursor decomposed. For the highest precursor
to Si mass ratio (1.24 gm precursor/0.12 gm Si), the majority of the coated particles assume
spherical shapes (Figure 4.1 b). The sphericity of the product is reduced with the decrease
in the ratio of precursor to Si (Figure 4.1 c and d). The morphology and size of the initial
particles also seem to affect the final morphology. For instance, all the spherical Si
nanomaterials (~50 nm) acquire uniform coating and assume spherical shape after coating
(Figure 4.2.) The TEM elemental mappings confirm the core shell architecture consisting
of Si core followed by intermediate Ge shell and the outermost C layer (Figure 4.3).
(a)
(c) (d)
(b)

77
Figure 4.2 SEM images of Si NP (a) before and (b) after C and Ge coating
Figure 4.3 TEM elemental mapping of the Si@Ge@C electrode prepared with 20-30 nm
Si core
(a) (b)

78
The evolution of final morphology may be attributed to the tendency to reduce the
surface area of coatings. The large particles with less sphericity require much larger amount
of precursor to achieve a spherical core-shell morphology.
Based on the previous reports, the decomposition of tetraethyl germanium to form
Ge and C coating may be summarized by the following reactions.26, 27
Ge(C2H5)4 Ge + 4C2H4 + 2H2
C2H4 (1+z)C + (1-z)CH4 + 2zH2
Tetraethygermanium can be reduced to Ge and the hydrocarbons at a temperature
higher than 420 °C. 28 The products mostly contain Ge , ethylene and hydrogen.27 Further
decomposition of ethylene leads to the formation of amorphous carbon.26
Figure 4.4 XRD patterns of Si along with the C and Ge coated Si (a) and the corresponding
raman spectrums (b)
(a) (b)
79
The X-ray diffraction (XRD) patterns of the Si particles before and after coating
are presented in Figure 4.4a. The broader peaks for Ge, adjacent to the Si peaks, suggest
nano-crystalline Ge grains. Using Scherrer equation (d=K/*cos, where d is the
crystalline size, K is the shape factor, is the wavelength of x-ray Cu K , is the full
width at half maximum and is the Bragg’s angle), the crystalline size (d) is estimated to
be ~20 nm. The absence of carbon reflections in the XRD pattern suggests the amorphous
nature of the carbon coatings. Further analysis with Raman spectroscopy confirms the
presence of carbon, indicated by the characteristic D and G peaks around the wave numbers
1340 and 1592 cm-1, respectively (Figure 4.4b). The sharp peaks at the wave numbers
~515 and ~300 cm-1 confirms the presence of crystalline Si and Ge in the material.
SEM EDXS analysis was employed to characterize the elemental composition of
each electrode. The results are presented in the Supplementary section (Figures 4.5, 4.6
and 4.7). The elemental compositions are measured to be 48.42 wt% C, 11.93 wt% Si and
29.65 wt% Ge for Si@Ge@C-12, 38.2 wt% C, 26.22 wt% Si and 35.57 wt% Ge for
Si@Ge@C-24 and 34.16wt% C, 39.01 wt% Si, and 26.82 wt% Ge for Si@Ge@C-48
respectively. It is also evident from the EDX spot analysis on individual particles in
Figures 4.5, 4.6 and 4.7, that the C and Ge rich particles are mostly spherical in shape.
The elemental distribution of C, Ge and Si in the electrode was investigated by
TEM elemental mapping. Figure 3 (a-e) indicate the presence of outermost layer of carbon,
followed by an inner layer of Ge and the innermost core of Si.
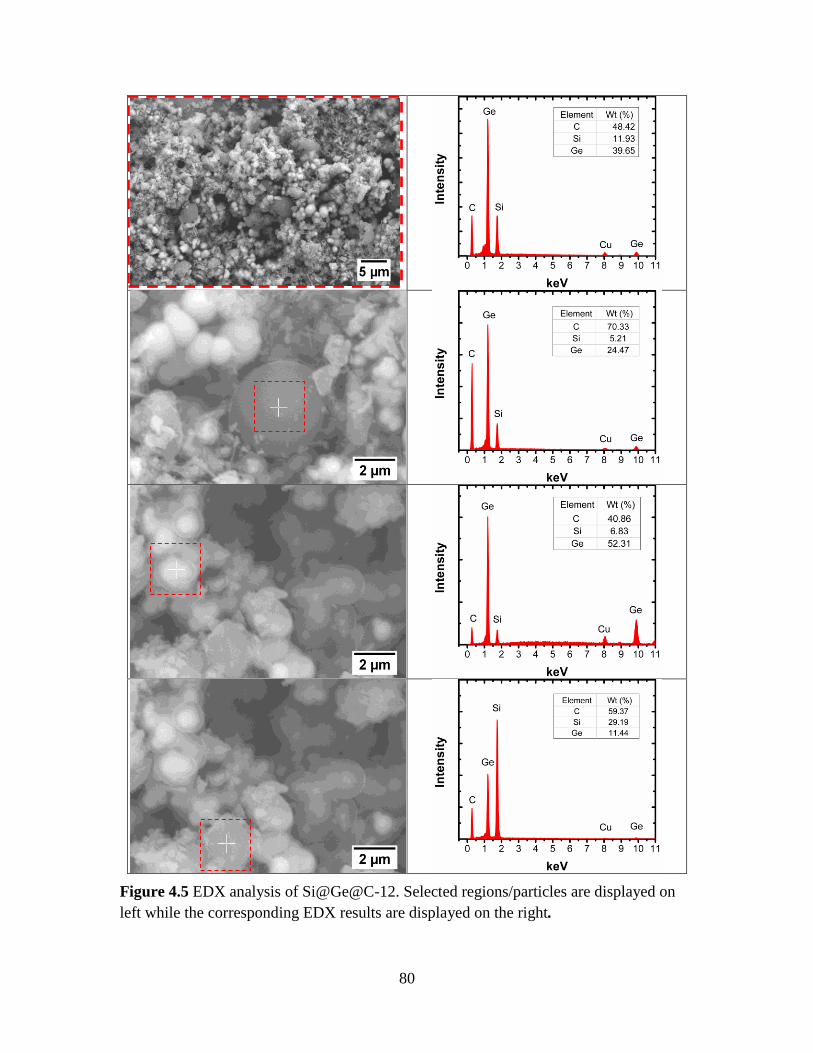
80
Figure 4.5 EDX analysis of Si@Ge@C-12. Selected regions/particles are displayed on
left while the corresponding EDX results are displayed on the right.

81
Figure 4.6 EDX analysis of Si@Ge@C-24. Selected regions/particles are displayed on
left while the corresponding EDX results are displayed on the right

82
Figure 4.7 EDX analysis of Si@Ge@C-48. Selected regions/ particles are displayed on
left while the corresponding EDX results are displayed on the right.

83
4.3.2 Electrochemical performance
The significance of core-shell architecture is demonstrated in Figure 4.8, by
comparing the cyclic performance of pristine micron-sized Si with the Si@Ge@C core
shell electrodes. The cells are cycled at 2 A/g after three formation cycles at 0.2 A/g. The
pristine Si suffers rapid capacity fade, losing more than 90% of its initial capacity (2,426
mAh/g, 1st cycle) within the first 50 cycles. At the end of 200 cycles, the specific capacity
is reduced to 58 mAh/g. In contrast, the Si@Ge@C core-shell electrodes demonstrate
excellent cyclic stability for the tested 200 cycles. The specific capacities at the end of 200
cycles for Si@Ge@C-12, Si@Ge@C-24 and Si@Ge@C-48 electrodes are 422, 671 and
772 mAh/g respectively. At the end of 200 cycles, all the electrodes were able to maintain
over 80% of their initial stable capacity.
Figure 4.8 (a) Cyclic performance (discharge capacities) of Si, Si@Ge@C-12,
Si@Ge@C-24 and Si@Ge@C-48 electrode at 2 A/g. The current rate of the first three
formation cycles was 200 mA/g. (b) rate performance of the four electrodes at different
current densities.
The rate performance of the three core-shell electrodes are presented in Figure
4.8b. The electrodes are cycled at the current densities of 0.1, 0.5, 1, 2, and 4 A/g. To
(a) (b)

84
examine the reversibility, the electrodes are cycled again at the previous current densities
of 2, 1 and 0.5 mA/g. The specific charge capacities at the corresponding current densities
are presented below
Figure 4.9 Coulombic efficiency (CE) of the core shell electrodes. FCE stands for first
cycle efficiency. CEs from second cycles are presented above
It can be observed that the initial coulombic efficiency (CE) of the electrode
increases as the weight content of the carbon decreases. The micropores in the amorphous
carbon are believed to increase SEI formation.29, 30 Therefore, the electrode with smaller
mass fraction of amorphous carbon can be expected to have higher first cycle CE. The first
cycle CEs of Si@Ge@C-48, Si@Ge@C-14 and Si@Ge@C-12 are 82, 75 and 73%
respectively (Figure 4.9). The coulombic efficiency reaches ~99% for all the electrodes
after 10 cycles.
While the capacity contribution from amorphous carbon by itself is not known
quantitatively in this work, its contribution to the total specific capacities of the electrodes
cannot be completely ruled out; at least for the initial cycles. The lithiation peak on cyclic

85
voltammetry (CV) plots or the differential capacity plots near 0 V have been commonly
attributed to the lithiation of amorphous carbon electrodes in several previous reports.31-35
It can be noted that such peaks are not observed in Si (Figure 4.10 d) or in Ge electrode36,
but are prominent in the Si@Ge@C electrodes (Figure 4.10 a, b and c). Therefore, these
peaks may be attributed to the lithiation of amorphous carbon in the core shell electrodes.
Furthermore, it can be observed that the peak sizes are proportional to the amount of carbon
in the electrode. A closer examination further reveals that these peaks get smaller with
increasing cycle numbers, indicating irreversible capacity loss typically observed in
amorphous carbon electrodes.30
Similarly, for Si and Ge, the contribution of each element to the total specific
capacity can be qualitatively verified by the post-cycling raman spectrum and differential
capacity plots (Figure 4.11). The cells are cycled at low current density (50 mA/g) to
maximize the lithiation. It is well known that the fully delithiated Si and Ge attain the
amorphous phase, provided that they are fully lithiated first. Compared to that of pristine
core shell electrodes (Figure 4.4), the raman spectra for lithiated electrodes exhibit broader
Ge and Si which are shifted to lower wave numbers (~480 cm-1 for Si and ~280 cm-1 for
Ge) (Figure 4.11). This indicate the formation of amorphous phases upon full delithiation.
Therefore, it may be concluded that both Si and Ge have contributed to the total specific
capacity. Differential capacity plots (Figure 4.10 a, b and c) further corroborate this idea.
Previous reports have demonstrated the lithiation potentials for Si electrodes to be around
0.1 and 0.25 V vs Li/Li+ and the delithiation processes around 0.28 and 0.45 V vs Li/Li+.37,
38

86
.
Figure 4.10 Differential capacity plots for (a) Si@Ge@C-12, (b) Si@Ge@C-24 and (c)
Si@Ge@C -48 electrodes (d) Si at 50 mA/g
Figure 4.11 Raman spectra of the electrodes cycled at 50 mA/g
(c) (d)
(a) (b)
87
Figure 4.10, presents the differential capacity plots for the control (micro Si)
electrode, which align with the aforementioned reports. Similarly, the distinct delithiation
peak at 0.5V vs Li/Li+ and the lithiation peaks at 0.1 V , ~0. 3 V and ~0.5V Li/Li+ can be
associated to Ge.36, 39, 40 The Ge lithiation peak at ~0.5 V, however, is not prominent for
being much smaller in height compared to the largest lithiation peak for the whole
electrode.
The area under a differential capacity plot provides the specific capacity of an active
material. Therefore, the decrease in size of the Ge delithiation peaks (0.5 V vs Li/Li+) with
the increase in the mass ratio of Si to precursor, suggests the decrease in the mass fraction
of Ge in the electrode. The amount of Ge decreases from 39.65% to 26.83 % as Si/precursor
ratio is changed from (0.12/1.24) to (0.48/1.24). At the same time, the increasing peak
height for Si (0.45 V vs Li/Li+) suggests increasing fraction of Si as the ratio increases. The
elemental composition data presented in the Figure 4.5, 4.6 and 4.7 further confirm this
observation.
The structural integrity of the electrodes was examined through SEM images. The
morphology of the electrodes before and after cycling can be compared in Figure 4.12.
The cells are cycled at 200 mA/g for 10 cycles. As compared to Figure 4.12 (a), the Si
electrode has undergone pulverization (Figure 4.12b) after cycling. In contrast, the post-
cycled morphology of the core-shell electrode reveal that the C and Ge-rich electrodes
(spherical ones) are more resistant to pulverization. Furthermore, the soft carbon in the
carbon rich electrodes can provide cushion for the surrounding electrodes during the
expansion and contraction, thus reduction the electrode delamination41. However, not all
the particles are able to retain their precycled morphologies. Si rich particles, with low

88
sphericity (elongated particles), are found to have undergone pulverization as observed in
Figures 4.12 (d, f and h).
Figure 4.12 SEM images of the (a) Si before cycling, (b) Si after cycling, (c) Si@Ge@C-
12 before cycling (d) Si@Ge@C-12 after cycling, (e) Si@Ge@C-24 before cycling, (f)
Si@Ge@C-24
(a)
(h) (g)
(e) (f)
(d) (c)
(b)

89
The mechanism of structural stabilization of core shell electrodes may be realized
by analyzing the lithiation potential of the core and shell(s) and the stress-strain behavior
in the interface. For example, the lithiation potential of Ge (~0.5 V) is larger than that of
Si (~0.25 V). With the Si core and Ge shell, the shell will be lithiated first. As a result, a
compressive strain is generated in the Si core which alleviates the structural disintegration
of the electrode during its lithiation. 25
In addition to Ge shell, the probable role of C shell in enhancing structural stability
needs some discussion. The effect of carbon coating on the structural stability of Si anode
during lithiation was recently examined by Xu et al., via in-situ transmission electron
microscopy (TEM). 42 It was reported that bare Si electrode pulverized into several small
pieces after full lithiation. However, the soft carbon coated Si electrode only suffered a
single crack on one side. The surface coatings such as C and Ni , have been reported to
transform the lithiation dynamics of Si from anisotropic to isotropic, thereby reducing the
number of fractures.42, 43 Increasing the coating thickness makes the lithiation more
isotropic43 and reduces the maximum tensile stress in the core to preserve the structural
integrity.44 These arguments could explain our observation about the structural stability of
spherical, C and Ge rich, electrodes and the pulverization of the large elongated electrodes
with higher Si content.
To further examine the role of C and Ge coatings on the cyclic stability of the three
Si@Ge@C electrodes, electrochemical impedance spectra (EIS) were collected after 5th
and 20th cycles (Figure 4.13a and b). An equivalent circuit model presented in Figure
4.13c is used to fit the experimental data in order to extract the parameters of interest.19
The Nyquist plots, along with the fitted results, for the four electrodes (Si, Si@Ge@C-12,
90
Si@Ge@C-24 and Si@Ge@C-48) are plotted together for 5th, and 20thcycles in Figure
4.13.The EIS consist of two partially overlapped semicircles at high frequencies while a
sloped line is observed at low frequencies. The first semicircle originates from the
geometric capacitance (C_film) and the Li+ migration resistance through the SEI (R_film),
while the second one at the intermediate frequencies represents the charge transfer
resistance (R_ct) and the double layer capacitance (C_dl) at the electrode/electrolyte
interface. And finally, the sloped line is associated with mass transfer (diffusion) resistance
(W0).19, 20 Previous studies have related the diameter at the intermediate frequency to the
interparticle contact resistance. 21, 22
The parameters obtained after fitting the experimental data to the above model are
presented in Figure 4.13d. The extracted parameters clearly suggest that the charge
transfer resistance in the Si electrode is higher than that of the other three electrodes and
the differences get more prominent with the increase in cycle number. The increased charge
transfer resistance in Si may be attributed to the fact that the Si electrode undergo fracture
and pulverization during cycling as observed in the SEM image in Figure 4.12b. The larger
inter-particle contact resistance in the Si electrode could be introduced due to
fracture/pulverization of the electrode and lack of conductive medium to connect the
fractured particles. However, the excellent cyclic stability along with the smaller charge
transfer resistances in the core-shell electrodes indicate that even the large Si@Ge@C
particles that might have undergone fracture can still maintain electrical contact with other
particles or current collectors.22 The contact resistances in the electrodes are fairly stable
from 5th to the 20th cycle. The electrochemical stability of core shell electrodes therefore
stems from the enhanced mechanical strength, and the ability of better maintain electrical
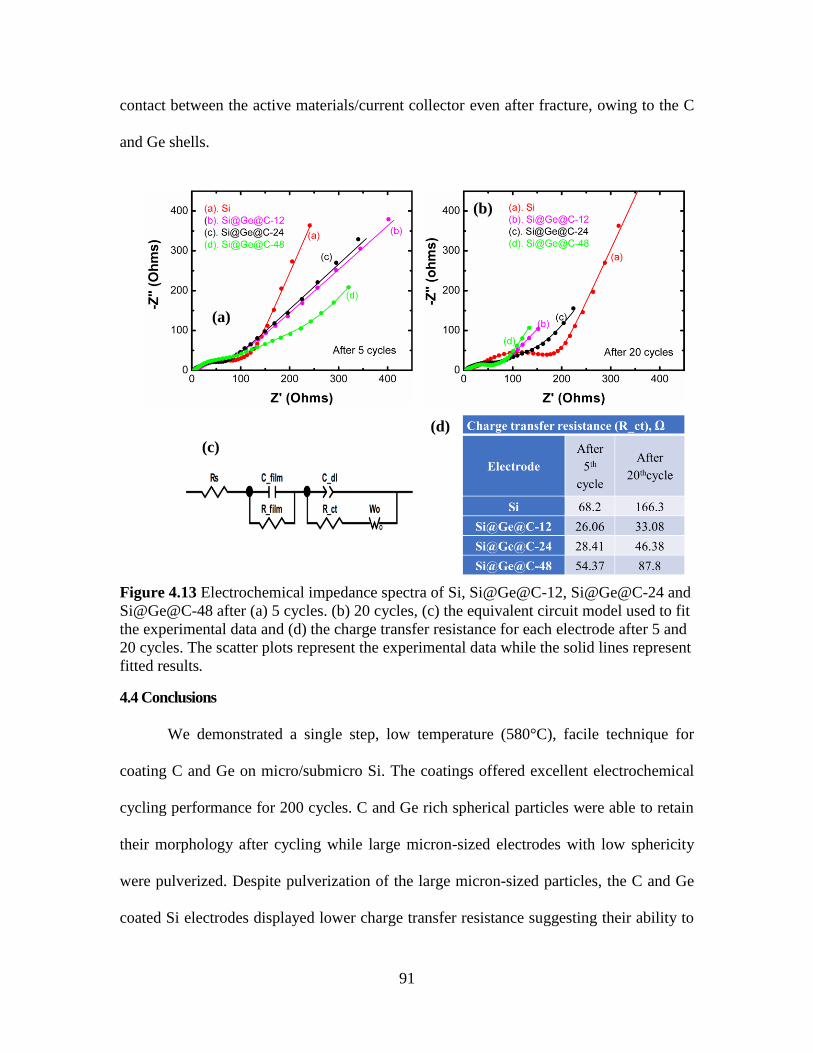
91
contact between the active materials/current collector even after fracture, owing to the C
and Ge shells.
Figure 4.13 Electrochemical impedance spectra of Si, Si@Ge@C-12, Si@Ge@C-24 and
Si@Ge@C-48 after (a) 5 cycles. (b) 20 cycles, (c) the equivalent circuit model used to fit
the experimental data and (d) the charge transfer resistance for each electrode after 5 and
20 cycles. The scatter plots represent the experimental data while the solid lines represent
fitted results.
4.4 Conclusions
We demonstrated a single step, low temperature (580°C), facile technique for
coating C and Ge on micro/submicro Si. The coatings offered excellent electrochemical
cycling performance for 200 cycles. C and Ge rich spherical particles were able to retain
their morphology after cycling while large micron-sized electrodes with low sphericity
were pulverized. Despite pulverization of the large micron-sized particles, the C and Ge
coated Si electrodes displayed lower charge transfer resistance suggesting their ability to
(a)
(b)
(c)
(d)

92
maintain better electrical contact with each other and the current collector. The coatings
allowed them to be more resistance to fracture and offer long cycle life. This method offers
a much simpler way to enable micron/submicron-sized Si electrodes for high-capacity LIBs
required for next-generation applications.

93
References
1. M. M. Thackeray, C. Wolverton and E. D. Isaacs, Energy & Environmental
Science, 2012, 5, 7854-7863.
2. USCAR, http://www.uscar.org/guest/article_view.php?articles_id=85.
3. K. G. Gallagher, S. E. Trask, C. Bauer, T. Woehrle, S. F. Lux, M. Tschech, P.
Lamp, B. J. Polzin, S. Ha, B. Long, Q. Wu, W. Lu, D. W. Dees and A. N. Jansen,
Journal of The Electrochemical Society, 2016, 163, A138-A149.
4. J. K. Lee, C. Oh, N. Kim, J.-Y. Hwang and Y.-K. Sun, Journal of Materials
Chemistry A, 2016, 4, 5366-5384.
5. W. Liang, H. Yang, F. Fan, Y. Liu, X. H. Liu, J. Y. Huang, T. Zhu and S. Zhang,
ACS Nano, 2013, 7, 3427-3433.
6. J. Xu, R. D. Deshpande, J. Pan, Y.-T. Cheng and V. S. Battaglia, Journal of The
Electrochemical Society, 2015, 162, A2026-A2035.
7. H. Wu, G. Zheng, N. Liu, T. J. Carney, Y. Yang and Y. Cui, Nano Letters, 2012,
12, 904-909.
8. M. Ge, J. Rong, X. Fang and C. Zhou, Nano Letters, 2012, 12, 2318-2323.
9. Z. Wen, G. Lu, S. Mao, H. Kim, S. Cui, K. Yu, X. Huang, P. T. Hurley, O. Mao
and J. Chen, Electrochemistry Communications, 2013, 29, 67-70.
10. T. Song, H. Cheng, H. Choi, J.-H. Lee, H. Han, D. H. Lee, D. S. Yoo, M.-S.
Kwon, J.-M. Choi, S. G. Doo, H. Chang, J. Xiao, Y. Huang, W. I. Park, Y.-C.
Chung, H. Kim, J. A. Rogers and U. Paik, ACS Nano, 2012, 6, 303-309.
11. C. K. Chan, H. Peng, G. Liu, K. McIlwrath, X. F. Zhang, R. A. Huggins and Y.
Cui, Nat Nano, 2008, 3, 31-35.
12. L. Luo, J. Wu, J. Luo, J. Huang and V. P. Dravid, Scientific Reports, 2014, 4,
3863.
13. Y. S. Jung, K. T. Lee, J. H. Ryu, D. Im and S. M. Oh, Journal of The
Electrochemical Society, 2005, 152, A1452-A1457.
14. C. Wang, H. Wu, Z. Chen, M. T. McDowell, Y. Cui and Z. Bao, Nat Chem, 2013,
5, 1042-1048.
15. K. Kierzek, J. Machnikowski and F. Béguin, Journal of Applied Electrochemistry,
2015, 45, 1-10.

94
16. R. Yi, F. Dai, M. L. Gordin, S. Chen and D. Wang, Advanced Energy Materials,
2013, 3, 295-300.
17. A. Magasinski, B. Zdyrko, I. Kovalenko, B. Hertzberg, R. Burtovyy, C. F.
Huebner, T. F. Fuller, I. Luzinov and G. Yushin, ACS Applied Materials &
Interfaces, 2010, 2, 3004-3010.
18. X.-K. Zhu and J. A. Joyce, Engineering Fracture Mechanics, 2012, 85, 1-46.
19. T. D. Bogart, D. Oka, X. Lu, M. Gu, C. Wang and B. A. Korgel, ACS Nano, 2014,
8, 915-922.
20. M. Noh, Y. Kwon, H. Lee, J. Cho, Y. Kim and M. G. Kim, Chemistry of
Materials, 2005, 17, 1926-1929.
21. D. Lin, Z. Lu, P.-C. Hsu, H. R. Lee, N. Liu, J. Zhao, H. Wang, C. Liu and Y. Cui,
Energy & Environmental Science, 2015, 8, 2371-2376.
22. S. H. Ng, J. Wang, D. Wexler, S. Y. Chew and H. K. Liu, The Journal of Physical
Chemistry C, 2007, 111, 11131-11138.
23. X. Wang, A. Yang and S. Xia, Journal of The Electrochemical Society, 2016,
163, A90-A95.
24. W. Luo, D. Shen, R. Zhang, B. Zhang, Y. Wang, S. X. Dou, H. K. Liu and J.
Yang, Advanced Functional Materials, 2016, 26, 7800-7806.
25. T. Song, H. Cheng, K. Town, H. Park, R. W. Black, S. Lee, W. I. Park, Y. Huang,
J. A. Rogers, L. F. Nazar and U. Paik, Advanced Functional Materials, 2014, 24,
1458-1464.
26. A. Bertucco and G. Vetter, High pressure process technology: fundamentals and
applications, Elsevier, 2001.
27. J. El Boucham, F. Maury and R. Morancho, Journal of Analytical and Applied
Pyrolysis, 1998, 44, 153-165.
28. R. L. Geddes and E. Mack Jr, Journal of the American Chemical Society, 1930,
52, 4372-4380.
29. S. R. Mukai, T. Hasegawa, M. Takagi and H. Tamon, Carbon, 2004, 42, 837-842.
30. Y. Wu, Lithium-ion batteries: Fundamentals and Applications, CRC Press, 2015.
31. M.-D. Fang, T.-H. Ho, J.-P. Yen, Y.-R. Lin, J.-L. Hong, S.-H. Wu and J.-J. Jow,
Materials, 2015, 8, 3550.

95
32. V. Subramanian, T. Karabacak, C. Masarapu, R. Teki, T.-M. Lu and B. Wei,
Journal of Power Sources, 2010, 195, 2044-2049.
33. J. Tang, V. Etacheri and V. G. Pol, ACS Sustainable Chemistry & Engineering,
2016, 4, 2624-2631.
34. W. Wang, M. K. Datta and P. N. Kumta, Journal of Materials Chemistry, 2007,
17, 3229-3237.
35. Y.-X. Wang, S.-L. Chou, J. H. Kim, H.-K. Liu and S.-X. Dou, Electrochimica
Acta, 2013, 93, 213-221.
36. F.-S. Ke, K. Mishra, L. Jamison, X.-X. Peng, S.-G. Ma, L. Huang, S.-G. Sun and
X.-D. Zhou, Chemical Communications, 2014, 50, 3713-3715.
37. M. N. Obrovac and L. Christensen, Electrochemical and Solid-State Letters,
2004, 7, A93-A96.
38. W. S. Tang, J.-N. Chotard and R. Janot, Journal of The Electrochemical Society,
2013, 160, A1232-A1240.
39. L. Baggetto and P. H. L. Notten, Journal of The Electrochemical Society, 2009,
156, A169-A175.
40. E. J. Powell, S. M. Wood, H. Celio, A. Heller and C. B. Mullins, Journal of
Materials Chemistry A, 2015, 3, 23442-23447.
41. Q. Xiao, M. Gu, H. Yang, B. Li, C. Zhang, Y. Liu, F. Liu, F. Dai, L. Yang, Z.
Liu, X. Xiao, G. Liu, P. Zhao, S. Zhang, C. Wang, Y. Lu and M. Cai, 2015, 6,
8844.
42. Z.-L. Xu, K. Cao, S. Abouali, M. Akbari Garakani, J. Huang, J.-Q. Huang, E.
Kamali Heidari, H. Wang and J.-K. Kim, Energy Storage Materials, 2016, 3, 45-
54.
43. G. Sandu, L. Brassart, J.-F. Gohy, T. Pardoen, S. Melinte and A. Vlad, ACS Nano,
2014, 8, 9427-9436.
44. F. Hao and D. Fang, Journal of The Electrochemical Society, 2013, 160, A595-
A600.

96
CHAPTER 5 :
HIGH PERFORMANCE POROUS SILICON@C ANODE
SYNTHESIZED BY LOW TEMPERATURE ALUMINOTHERMIC
REACTION
5.1 Introduction
Silicon (Si) has received increasing attention as a promising anode material for the
next generation lithium-ion batteries (LIBs) because of its high theoretical specific capacity
(3579 mAh/g) and low lithiation potential (<0.5 vs Li/Li+). By replacing the conventional
graphite electrode (specific capacity: 372 mAh/g) with Si-based anode, LIBs are expected
to have > 300 Wh/kg specific energy which could allow the electric vehicles drive 300-400
miles range in a single charge.1, 2 Significant efforts have been made in the development of
Si-based anodes since it was first studied by Boukamp et al. in 1981.3-6 However, the key
challenge for commercial application of Si anodes, as shared by other alloying elements
such as tin (Sn) and germanium (Ge), has been the fracture and pulverization of the
electrodes upon full lithiation. The diffusion induced stress generated during lithiation
leads to the mechanical disintegration and electrical isolation of the electrodes, resulting in
rapid capacity fade.7, 8
The cycling performance of an electrode can be greatly affected by the structural
design of the electrode materials.9-11 Materials engineering approaches to address the

97
mechanical disintegration of Si have mainly been employed towards the development of
various Si/C composites and novel electrode architectures.4, 9, 12-15 Porous silicon materials,
among all the nanostructured Si, have been demonstrated to have excellent cycling stability
owing to its ability to alleviate the net volume expansion.5, 16-18 The porous architecture
also delivers enhanced rate performance by virtue of the short diffusion length.18 Hence,
numerous techniques have been reported for the synthesis of porous Si including
electroless etching, electrochemical etching, template assisted synthesis, magnesiothermic
reduction and aluminothermic reduction.19-23
Beyond the above progresses in the porous Si structure, production of battery grade
Si materials with a scalable and low-cost approach is essential to lower the manufacturing
cost of LIBs and hence promote the market penetration of electrical vehicles.
Metallothermic reduction of silica into elemental Si using aluminum (Al) or magnesium
(Mg) has recently received great attention for battery applications due to its simplicity,
low-cost and scalability.16, 24 Aluminothermic reduction in particular has important
advantages over magnesiothermic reduction. First, it can avoid the formation of
magnesium silicide and the potential release of dangerous silane gas in the subsequent
byproduct removal process. Second, the aluminothermic reduction of silica can be
conducted at a temperature below 300 °C with the reaction media such as AlCl3. These
features make the procedure attractive for scaling up the production. Recently, nano Si was
produced by reduction of high silica zeolite at 250 °C in aluminium-aluminum chloride
(m.p. ~192 °C) system. Yet, the Si anode lacked engineered porous structure and exhibited
rapid fade losing 50% capacity after 200 cycles.25 In another report, silica nanoparticles

98
were reduced with excess AlCl3 to form hollow Si microspheres yet it also lost about half
of its initial capacity within 100 cycles.23
Because the porous structure of the product can be greatly affected by the precursor,
one way to control the porous structure is to select the porous SiO2 precursor with desired
porous structure and manage to preserve the porous morphology in the final product. The
porosity of the electrode can greatly affect its energy density. Higher porosity in the final
product due to pulverization of p-Si can significantly reduce the volumetric energy density
of the electrode. Similarly, aggregation of the microstructures due to high local temperature
achieved during the exothermic reaction can be detrimental to its electrochemical
performance. Therefore, new methods for metallothermic reduction of p-SiO2 have to be
developed to enable its shape preservation in the final product in order to achieve the
desired energy density.
In this work, we developed a new aluminothermic reduction reaction that uses a
eutectic mixture of AlCl3 and ZnCl2 as the mediator. AlCl3 (m.p. ~190°C) and ZnCl2 (m.p.
~290°C) forms a eutectic mixture around the composition of 0.52 mole fraction of ZnCl2
with the melting point of 116 ± 2 °C.26-28 It not only serves as the reaction media, but also
enables the aluminothermic reduction to be done through the unique reaction route at a
temperature as low as ~180 °C. Furthermore, the addition of ZnCl2 makes the mixture less
sensitive to ambient moisture, thus more convenient for handling.29 With carbon pre-
coating on the porous SiO2 precursor, porous Si@C core shell structured anodes could be
obtained with structure and morphology similar to that of the porous precursor. Therefore,
this work represents a new low-cost approach for Si synthesis and represents a step forward
for the development of Si anodes for high-energy-density lithium ion batteries.
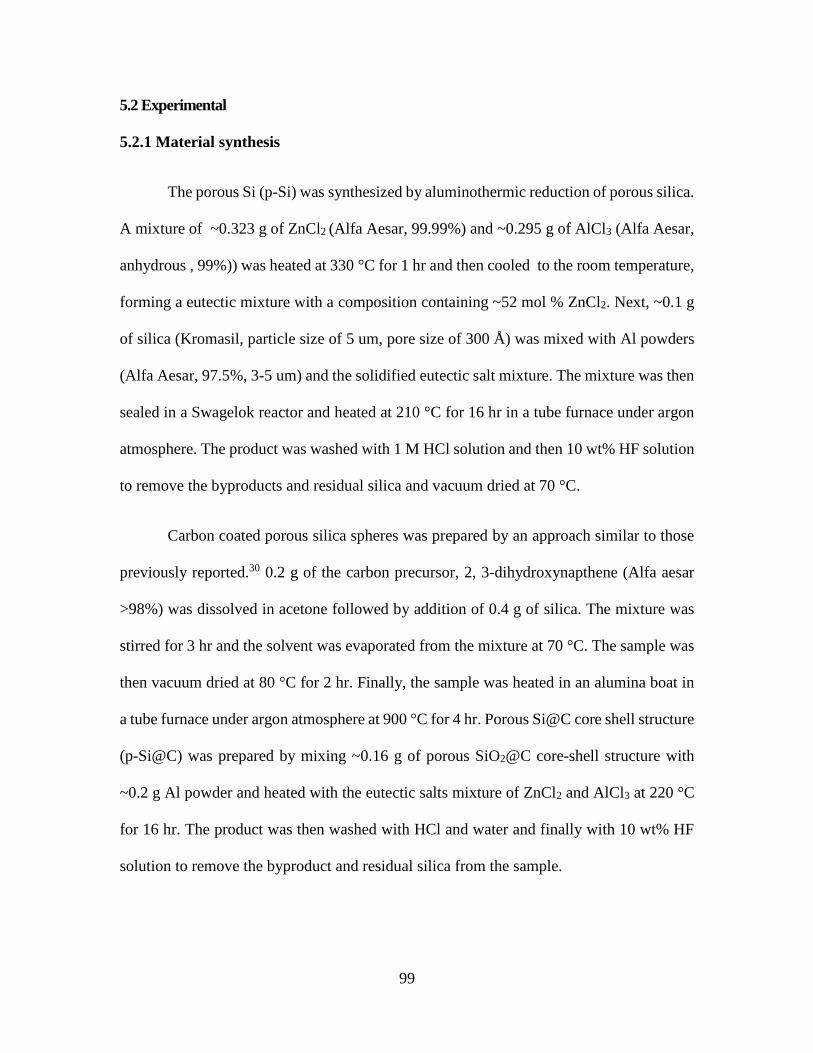
99
5.2 Experimental
5.2.1 Material synthesis
The porous Si (p-Si) was synthesized by aluminothermic reduction of porous silica.
A mixture of ~0.323 g of ZnCl2 (Alfa Aesar, 99.99%) and ~0.295 g of AlCl3 (Alfa Aesar,
anhydrous , 99%)) was heated at 330 °C for 1 hr and then cooled to the room temperature,
forming a eutectic mixture with a composition containing ~52 mol % ZnCl2. Next, ~0.1 g
of silica (Kromasil, particle size of 5 um, pore size of 300 Å) was mixed with Al powders
(Alfa Aesar, 97.5%, 3-5 um) and the solidified eutectic salt mixture. The mixture was then
sealed in a Swagelok reactor and heated at 210 °C for 16 hr in a tube furnace under argon
atmosphere. The product was washed with 1 M HCl solution and then 10 wt% HF solution
to remove the byproducts and residual silica and vacuum dried at 70 °C.
Carbon coated porous silica spheres was prepared by an approach similar to those
previously reported.30 0.2 g of the carbon precursor, 2, 3-dihydroxynapthene (Alfa aesar
>98%) was dissolved in acetone followed by addition of 0.4 g of silica. The mixture was
stirred for 3 hr and the solvent was evaporated from the mixture at 70 °C. The sample was
then vacuum dried at 80 °C for 2 hr. Finally, the sample was heated in an alumina boat in
a tube furnace under argon atmosphere at 900 °C for 4 hr. Porous Si@C core shell structure
(p-Si@C) was prepared by mixing ~0.16 g of porous SiO2@C core-shell structure with
~0.2 g Al powder and heated with the eutectic salts mixture of ZnCl2 and AlCl3 at 220 °C
for 16 hr. The product was then washed with HCl and water and finally with 10 wt% HF
solution to remove the byproduct and residual silica from the sample.

100
5.2.2 Sample characterization
The X-ray diffraction (XRD) patterns were obtained using Rigaku X-ray
diffractometer (Cu Kα radiation). The Morphology and structure of the samples were
examined on FEI Helios Nano lab dual-beam focused ion beam scanning electron
microscopy (SEM) and high-resolution transmission electron microscopy (HRTEM) using
an FEI Titan 80–300 microscope operating at an accelerating voltage of 300 kV. Raman
spectra were collected using Horiba Raman spectrometer using 632 nm laser. Surface area
and the corresponding pore volume of the samples were examined by a Quanta chrome
Autosorb automated gas sorption system using nitrogen adsorption isotherm at the relative
pressure P/P0 of ~0.99 using Brunauer-Emmett-Teller (BET) and Barrett-Joyner-Halenda
(BJH) methods.
5.2.3 Electrochemical measurement
The electrodes were prepared by tape casting the slurry composed of 70 wt% active
materials (p-Si or p-Si@C), 20 wt% Poly(acrylic acid) and 10 wt% acetylene black on a
copper foil. The electrochemical properties of the electrode were examined by assembling
CR2032 coin cells in an Ar filled glovebox with water and oxygen concentration less than
0.1 ppm. The Li metal was used as the counter/reference electrode while Celgard 2400
served as the separator. The electrolyte was prepared by mixing 1 M LiPF6 in a mixture of
ethylene carbonate (EC) and diethyl carbonate (DEC) in the weight ratio 1:1. FEC (10
wt%) was added as additive in the electrolyte to enhance the cycling stability. The cells
were tested between 0.02 – 1.6 V using galvanostatic discharge and charge on an Arbin
BT-2000 battery tester. The mass loadings of the electrodes were between 0.6 to 0.8
mg/cm2. The cells were cycled at the current density of 0.1 A/g for first two cycles while

101
the rest were cycled at 1.2 A/g. The current densities and the specific capacities were
calculated based on the weight of p-Si. The electrochemical impedance spectra (EIS) were
obtained through Solartron 1287 frequency response analyzer between the frequency range
from 1 MHz to 0.5 Hz with an ac amplitude of 10 mV. For the cycling postmortem analysis,
the cycled electrodes were retrieved by disassembling the cells inside the glovebox at
charged state, washed with dimethyl carbonate several times and dried.
5.3 Results and Discussion
Figure 5.1a schematically illustrates the design principle for the synthesis of porous
Si@C (p-Si@C) core-shell structure that effectively preserves the spherical and large
secondary particle morphology. Without the pre-coated carbon shell, spherical structure of
the micron size secondary particle could not be maintained, only obtaining broken pieces
consisting of porous Si. On the contrary, with the carbon coating framework, p-Si@C can
inherit the spherical shape of the porous SiO2 precursor. It has to be noted that the reduction
reaction in the carbon coated precursor can happen at almost the same temperature as that
without coating. This is confirmed by the similar diffraction patterns of p-Si and p-Si@C
with strong Si characteristic peaks indicating similar crystalline size of Si (Figure 5.1b).
The scanning electron microscopy (SEM) results of p-Si and p-Si@C in Figure
5.1c-f corroborate the feasibility of our synthesis principle. The morphology of the silica
precursor and the Si product is compared in Figures 5.1c and 5.2d. The SEM images reveal
that the spherical shaped porous silica (~ 5 um) powders (Figure 5.1c) are reduced to
randomly shaped Si with wide distribution of characteristic sizes (Figure 5.1d). A close
comparison of the mesoporous p-SiO2 (Figure 5.1c inset and Figure 5.2) to the p-Si further
reveals that the pore sizes in p-Si are remarkably increased to the macroporous range

102
(Figure 5.1d inset). The secondary particles of p-Si are reduced to less than 3 µm. The
TEM images also reveal the variation of grain sizes from ~10 nm to a few hundred nm
(submicron) (Figures 5.2b and c). The dark field STEM image further confirms the 3D
porous architecture composed of the Si nanoparticles (Figure 5.2d).
Figure 5.1 (a)Schematics of the process of synthesis of p-Si and p-Si@C. (b) XRD
spectrum of final p-Si and p-Si@C obtained after reduction in eutectic mixture of AlCl3
and ZnCl2. (c) SEM images of the (c) p-SiO2 at low and high magnification (inset), (d) p-
Si at low and high magnification (inset), (e) SEM images of p-SiO2@C and (f) SEM
images p-Si@C obtained from p-SiO2@C
Figure 5.2 TEM images of (a) pristine p-SiO2, (b) p-Si showing nano crystalline and larger
dense grains, (c) higher magnification of (b) displaying nano-crystallites, and (d) STEM
image of p-Si

103
With carbon pre-coating on porous SiO2, the obtained p-Si@C exhibits the same
spherical morphology as the p-SiO2@C and the porous SiO2 precursor (Figures 5.1e and
1f), which is because the carbon coating network could efficiently hold the porous
nanosized SiO2 or Si particles together during the synthesis process. Carbon coating was
confirmed by the Raman spectra (Figures 5.3a and 5.3b) and SEM EDX elemental
mapping (Figures 5.4), and the weight content of carbon in p-Si@C is determined to be
17.32 wt. %, as measured by thermogravimetric analysis (TGA) (Figure 5.5). The sharp G
band at 1600 cm-1 along with low intensity ratio between the D and G bands (ID/IG =0.75)
indicate high degree of graphitization (Figure 5.3a).31 The ID/IG ratio remains similar
(0.77) after the reduction reaction, which suggests the graphitic properties of the carbon
coating layer is well preserved and is beneficial for enhancing the electrical conductivity
of the p-Si@C material. In addition, a sharp absorption band also appears at ~520 cm-1,
further confirming the presence of crystalline Si (Figure 5.3b).
Figure 5.3 Raman spectra of (a) p-SiO2@C and (b) p-Si@C.
(a) (b
)
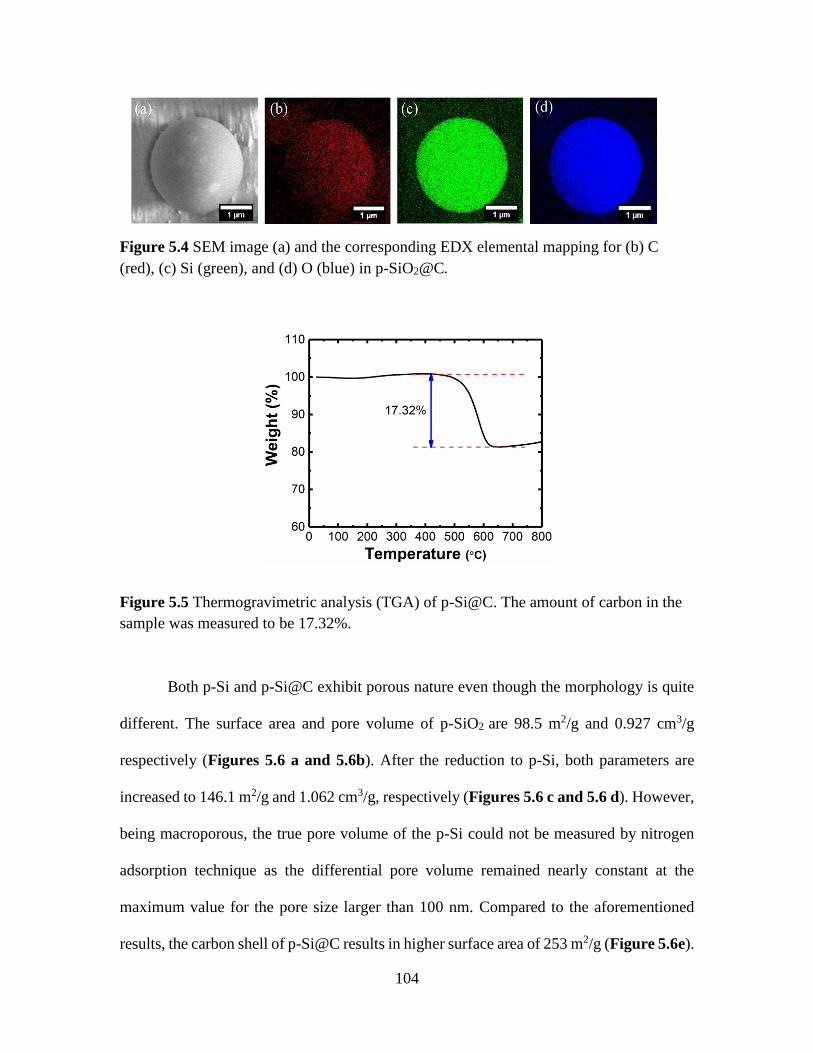
104
Figure 5.4 SEM image (a) and the corresponding EDX elemental mapping for (b) C
(red), (c) Si (green), and (d) O (blue) in p-SiO2@C.
Figure 5.5 Thermogravimetric analysis (TGA) of p-Si@C. The amount of carbon in the
sample was measured to be 17.32%.
Both p-Si and p-Si@C exhibit porous nature even though the morphology is quite
different. The surface area and pore volume of p-SiO2 are 98.5 m2/g and 0.927 cm3/g
respectively (Figures 5.6 a and 5.6b). After the reduction to p-Si, both parameters are
increased to 146.1 m2/g and 1.062 cm3/g, respectively (Figures 5.6 c and 5.6 d). However,
being macroporous, the true pore volume of the p-Si could not be measured by nitrogen
adsorption technique as the differential pore volume remained nearly constant at the
maximum value for the pore size larger than 100 nm. Compared to the aforementioned
results, the carbon shell of p-Si@C results in higher surface area of 253 m2/g (Figure 5.6e).

105
However, the pores in p-Si@C are found to be smaller than those of both p-SiO2 and p-Si.
The average pore diameter of p-Si@C is 18-45 nm (Figure 5.6f). The higher pore volume
(1.12 cm3/g) and smaller average pore size indicate the highly porous property of the
carbon coating.
Figure 5.7 shows the detailed porous structure of p-SiO2@C and p-Si@C. The
cross-section SEM images show pores of 30-50 nm distributed uniformly throughout the
particle of p-SiO2@C (Figure 5.7a and 5.7b). After the reduction to p-Si@C, the pores
between Si become larger (Figure 5.7c and 5.7d) which may be attributed to the shrinkage
of Si grains owing to its smaller molar volume (12.17 cm3/mol) than that of amorphous
Figure 5.6. Nitrogen adsorption/desorption isotherms and BJH pore size distribution for
p-SiO2 (a and b), p-Si (c and d) and p-Si@C (e and f)

106
silica (27.27 cm3/mol).32 SEM elemental mappings (Figure 5.8) further reveal that both
samples have carbon coating in the pores inside the particle. A small amount of residual
oxygen can be observed in p-Si@C (Figure 5.8h). The carbon coated 3D porous
architecture can be expected to improve electrolyte accessibility, enhance electron and Li
ion conduction and minimize the net volume change during lithiation and delithiation.
The final morphology of the p-Si was governed by the unique mechanism of the
mediated Al reduction reaction. The reaction mechanism was investigated by systematic
study of the phase compositions of the precursor and the as-synthesized product. Al and
AlCl3 were fed in stoichiometrically excess amount to maximize reduction of the silica.
Figure 5.9 confirms the presence of Al, AlCl3 and ZnCl2 in the reactants. Being amorphous,
the silica phase is not observed. After the reaction, the product mostly contains Zn, AlCl3,
and AlOCl (Figure 5.9b). The XRD reflections for Si are not pronounced owing to its
small fraction in the product. Based on the evolution of phase compositions, it could be
inferred that the ZnCl2 is consumed in the presence of Al to form crystalline Zn.33 After
that, the porous SiO2 is reduced by Al and AlCl3 to form porous Si along with the formation
of aluminum oxychloride (AlOCl) .25 The possible reaction routes are therefore
summarized as follows.
2Al(s) + 3ZnCl2(l) → 3Zn(s) + 2AlCl3(g) Grxn (210 °C) = -103 kJ/mol (1)
4Al(s) + 3SiO2(s) + 2AlCl3(g) → 3Si(s) + 6AlOCl(s) Grxn (210 °C) = -627 kJ/mol (2)
Due to the volume shrinkage (from SiO2 to Si) after the solid/gas phase reaction,
the original morphology of the parent p-SiO2 could not be preserved, resulting in the
random shaped macroporous morphology of the p-Si. Consistent with previous reports, the

107
original morphology of the precursor during reduction to elemental Si could not be
maintained.34, 35
The pulverization of p-Si during the aluminothermic reduction of p-SiO2 was
circumvented by pre-coating the p-SiO2 with carbon before the reduction. It was observed
that the carbon coating slightly lowered the extent of reduction at 210°C; therefore, the
reduction was carried out at 220 °C. In addition to lowering the reduction temperature, the
eutectic mixture of the AlCl3 and ZnCl2, also prevented the formation of SiC, an electrical
insulator at room temperature, which is known to be fatal to the battery performance.36
The significance of the eutectic mixture on reducing the reaction temperature can
be realized by comparing the XRDs of the products obtained at different temperature. The
eutectic salt mixture allowed the reduction reaction to proceed at the temperature as low as
180 °C. (Figure 5.10a). The reaction at ~210 °C is very thorough using the eutectic
mixture. XRD patterns of the products obtained after being washed with aqueous HCl by
using the eutectic mixture and AlCl3 are compared side-by-side. Under the similar
conditions (input temperature, duration of reaction and Al/silica/salt ratio) with AlCl3 salt
alone, only a small fraction of silica is reduced to Si (Figure 5.10b). In contrast, in the
eutectic mixture, most of the silica has been successfully reduced to Si, with very marginal
silica phase observed in the XRD pattern of the product (Figure 5.10c). The role of ZnCl2
in lowering the melting point of the salt mixture and therefore lowering the reduction
initiation temperature is thus clearly demonstrated even when the ZnCl2 may not directly
participate in the reduction of Silica.

108
Figure 5.7 SEM images of the electrode cross-section of p-SiO2@C at (a) low
magnification and (b) high magnification, and p-Si@C at (c) low magnification and (d)
high magnification

109
Figure 5.8 SEM images and the corresponding elemental mapping of the cross-section
of the p-SiO2@C (a, b, c and d) and p-Si@C (e, f, g and h) for elements C (red), Si
(green) and O (blue).

110
Electrochemical performance: p-Si and p-Si@C show similar charge/discharge curves
to typical Si electrodes and exhibit good cycling stability (Figure 5.11). The p-Si electrode
initially delivers a high specific capacity of ~2100 mAh/g after the formation cycles. After
250 cycles, the electrode is able to retain ~76% of its highest initial capacity achieved at
Figure 5.9 XRD spectrum of the (a) reactants mixture before the reduction reaction, (b)
the products after the reaction and (c) reactants analyzed separately for reference. The
samples were sealed with Kapton tape to prevent the exposure to air /moisture.
Figure 5.10 XRD spectrum of the HCl washed products formed after reduction for 16
hours of p-SiO2 at 180 °C (a) and at 210 °C in (b) AlCl3 and (c) eutectic mixture of AlCl3
and ZnCl2

111
the current density 1.2 A/g. Calculated based on the active mass of Si, the specific capacity
for p-Si@C stabilizes at ~2100 mAh/g after initially increasing from ~1950 mAh/g for the
first cycle at 1.2 A/g. As shown in Figure 5.11a, the p-Si@C (blue plot) delivers higher
specific capacity of ~1880 mAh/g after 250 cycles, retaining ~89% of its initial specific
capacity. It is believed that in addition to preserving the morphology, the pre-coated C
offered enhanced structural integrity, thereby leading to the enhanced cycling performance.
The electrochemical performance of control electrodes consisting of Si nanoparticles (Si
NPs) is also compared with those of p-Si and p-Si@C. The control electrode with Si NPs,
despite demonstrating fairly stable cycling performance for first 60 cycles, loses 56% of
its capacity after 140 cycles. The inferior cycling performance of Si NPs may be attributed
to the lack on interconnected Si network and the electrical isolation from the conducting
agents as well as instability of the SEI formed on its surface during repeated cycling.37-39
It is interesting to notice that despite lower first cycle efficiency (~79%) of the p-
Si@C than that of p-Si (87%), the coulombic efficiency (CE) exceeds that of p-Si after the
4th cycle and remains higher for the subsequent 200 cycles (Figure 5.11b). The CE for p-
Si reaches 99% after 83 cycles while p-Si@C is able to do so at the 27th cycle. The lower
first cycle efficiency of the p-Si@C, compared to p-Si, is attributed to the greater
irreversible capacity loss during the formation of solid electrolyte interface (SEI) in the
microspores of the amorphous carbon coating2, 10. It is consistent with the fact that the p-
Si@C material has a lot of micropores and large surface area. Yet, once the micropores are
filled with stable SEI, the exposure of the Si core to the electrolyte is restricted leading to
high CE and stable cycling.2, 40

112
Figure 5.11 (A)Cycling performance of p-Si (red plot) and p-Si@C (blue plot) and (b)
corresponding coulombic efficiencies, voltage profile of (c) p-Si and (d) p-Si@C, (e)
normalized specific capacity of p-Si and p-Si@C, and (f) rate performance of p-Si and
p-Si@C at different current densities
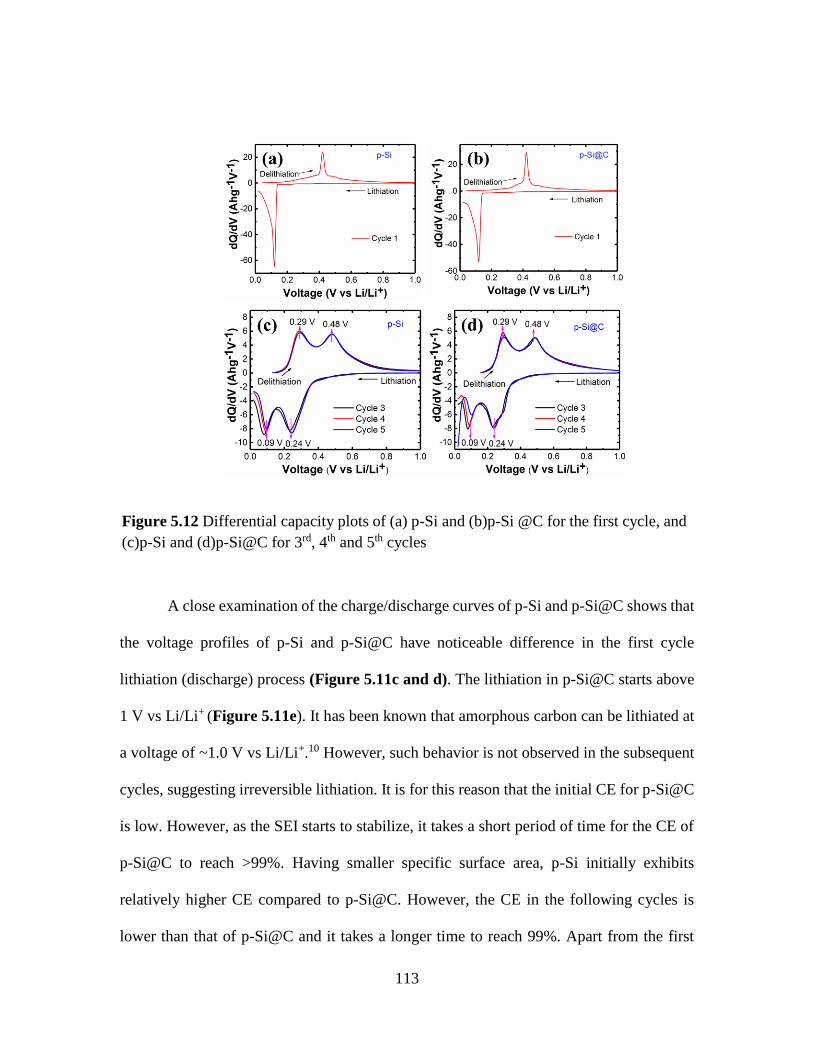
113
A close examination of the charge/discharge curves of p-Si and p-Si@C shows that
the voltage profiles of p-Si and p-Si@C have noticeable difference in the first cycle
lithiation (discharge) process (Figure 5.11c and d). The lithiation in p-Si@C starts above
1 V vs Li/Li+ (Figure 5.11e). It has been known that amorphous carbon can be lithiated at
a voltage of ~1.0 V vs Li/Li+.10 However, such behavior is not observed in the subsequent
cycles, suggesting irreversible lithiation. It is for this reason that the initial CE for p-Si@C
is low. However, as the SEI starts to stabilize, it takes a short period of time for the CE of
p-Si@C to reach >99%. Having smaller specific surface area, p-Si initially exhibits
relatively higher CE compared to p-Si@C. However, the CE in the following cycles is
lower than that of p-Si@C and it takes a longer time to reach 99%. Apart from the first
Figure 5.12 Differential capacity plots of (a) p-Si and (b)p-Si @C for the first cycle, and
(c)p-Si and (d)p-Si@C for 3rd, 4th and 5th cycles

114
cycle, the rest of the voltage profiles and the differential capacity plots (Figure 5.12) show
no apparent difference. Both p-Si and p-Si@C exhibit two step lithiation (0.24 and 0.09 V
vs Li/Li+) and two step delithiation (0.29 and 0.48 V vs Li/Li+) (Figure 5.12 c and d) in
agreement with the previous reports on Si electrodes.41, 42
Because of the improved electronic conduction from the carbon coating, p-Si@C
exhibits an improved rate capability over p-Si (Figure 5.11f). The p-Si@C electrode is
able to deliver ~1290 mAh/g even at the high current density of 8 A/g which is significantly
higher than that achieved by p-Si ( ~980 mAh/g)at the same current density. The reason
for p-Si@C delivers higher specific capacities than that of p-Si at the current densities of
2 and 4 A/g, can attributed to the enhanced kinetics of lithiation/electron transport due to
the carbon coating in the external Si surface as well as the internal pores.43 Electrochemical
impedance spectra were obtained for the electrodes after 200 cycles to compare the charge
transfer resistance between the two electrodes. A typical EIS consists of two overlapped
semicircles at high frequencies and a sloped line at low frequencies. The first semicircle at
the highest frequency domain is usually attributed to the Li+ migration through the surface
films while the one at the intermediate frequencies is associated with interfacial charge
transfer.44 The experimental data were fitted with an equivalent circuit model presented in
Figure 5.13a. From the fitted spectra (Figure 5.13b), the Li+ migration resistance through
the SEI (R_film) is found to be higher in p-Si (9.0 ohms) than that of p-Si@C (3.2 ohms).
This indicates that SEI in p-Si@C is thinner.45 Similarly, the charge transfer resistance
(R_ct) is also higher in p-Si (89.0 ohms) than that of p-Si@C (49.1 ohms). The smaller
resistances for p-Si@C may be attributed to thinner SEI and enhanced electrical
connections between the nanosized Si particles by virtue of the carbon coatings.

115
Apart from the superior cycling performance, another advantage of the carbon
coating is that it improved the structural integrity of the electrode during cycling. SEM
images of electrode before (Figure 5.14a) and after cycling (Figure 5.14b) demonstrates
that the p-Si@C material was able to retain the overall spherical shape even after 200
cycles. That is because the carbon coating provides the mechanical support to the Si
framework to minimize electrode pulverization that is associated with large volume change
during lithiation/delithiation.
Furthermore, it can also help maintain the required electrical contact, even after
electrode undergoes fracture.46 Therefore, the superior cycling performance of p-Si@C
could be attributed to the interconnected Si network and its greater resistance to undergo
mechanical disintegration, formation of more stable SEI, and the uniform carbon coating
which can better maintain the electrical contact with the neighboring Si/current collector.
Figure 5.13 (a) Equivalent circuit model used to fit the experimental data and (b)
electrochemical impedance spectra (EIS) of p-Si and p-Si@C after 200 cycles
(experimental and fitted results)

116
Figure 5.14 SEM images of the p-Si@C electrode (a) before cycling and (b) after 200
cycles at 1.2 A/g in the voltage range of 0.02 – 1.6 V
5.4 Conclusion
A low temperature (210 °C) aluminothermic reduction reaction process has been
successfully developed to synthesize porous silicon (Si) as an anode for LIB applications.
The process was enabled by using a eutectic mixture of AlCl3 and ZnCl2 as the mediator.
The porous Si exhibited excellent cycling performance, delivering the initial specific
capacity ~ 2100 mAh/g at the current density of 1.2 A/g. Pre-coating the carbon on the
silica before the reduction displayed much better cycling stability and higher coulombic
efficiency (>99%) through preserving the overall spherical shape. The superior
electrochemical performance of both p-Si and p-Si@C over Si NP electrode demonstrated
the importance of interconnect Si network for extending cycle life. This simple one-step
reduction process may be widely employed to synthesize porous Si from the silica with
various initial morphologies.
(a) (b)

117
References
1. M. M. Thackeray, C. Wolverton and E. D. Isaacs, Energy & Environmental
Science, 2012, 5, 7854-7863.
2. S. R. Mukai, T. Hasegawa, M. Takagi and H. Tamon, Carbon, 2004, 42, 837-842.
3. B. A. Boukamp, G. C. Lesh and R. A. Huggins, Journal of The Electrochemical
Society, 1981, 128, 725-729.
4. C. K. Chan, H. Peng, G. Liu, K. McIlwrath, X. F. Zhang, R. A. Huggins and Y.
Cui, Nat Nano, 2008, 3, 31-35.
5. X. Li, M. Gu, S. Hu, R. Kennard, P. Yan, X. Chen, C. Wang, M. J. Sailor, J.-G.
Zhang and J. Liu, Nat Commun, 2014, 5.
6. C. Wang, H. Wu, Z. Chen, M. T. McDowell, Y. Cui and Z. Bao, Nat Chem, 2013,
5, 1042-1048.
7. C.-Y. Chen, T. Sano, T. Tsuda, K. Ui, Y. Oshima, M. Yamagata, M. Ishikawa, M.
Haruta, T. Doi, M. Inaba and S. Kuwabata, Scientific Reports, 2016, 6, 36153.
8. W. W. Deng, X. M. Liang, X. Y. Wu, J. F. Qian, Y. L. Cao, X. P. Ai, J. W. Feng
and H. X. Yang, Sci. Rep., 2013, 3, 2671.
9. F.-S. Ke, K. Mishra, L. Jamison, X.-X. Peng, S.-G. Ma, L. Huang, S.-G. Sun and
X.-D. Zhou, Chemical Communications, 2014, 50, 3713-3715.
10. Y. Wu, Lithium-ion batteries: Fundamentals and Applications, CRC Press, 2015.
11. J. Ye, A. C. Baumgaertel, Y. M. Wang, J. Biener and M. M. Biener, ACS Nano,
2015, 9, 2194-2202.
12. T. H. Hwang, Y. M. Lee, B.-S. Kong, J.-S. Seo and J. W. Choi, Nano Letters,
2012, 12, 802-807.
13. J. Liu, Q. Zhang, T. Zhang, J.-T. Li, L. Huang and S.-G. Sun, Advanced
Functional Materials, 2015, 25, 3599-3605.
14. H. Wu, G. Chan, J. W. Choi, I. Ryu, Y. Yao, M. T. McDowell, S. W. Lee, A.
Jackson, Y. Yang, L. Hu and Y. Cui, Nat Nano, 2012, 7, 310-315.
15. Y. Xu, G. Yin, Y. Ma, P. Zuo and X. Cheng, Journal of Materials Chemistry,
2010, 20, 3216-3220.
16. X. Li, P. Yan, B. W. Arey, W. Luo, X. Ji, C. Wang, J. Liu and J.-G. Zhang, Nano
Energy, 2016, 20, 68-75.

118
17. W. Ren, Y. Wang, Z. Zhang, Q. Tan, Z. Zhong and F. Su, Journal of Materials
Chemistry A, 2016, 4, 552-560.
18. W. Wang, Z. Favors, R. Ionescu, R. Ye, H. H. Bay, M. Ozkan and C. S. Ozkan,
Scientific reports, 2015, 5.
19. Z. Bao, M. R. Weatherspoon, S. Shian, Y. Cai, P. D. Graham, S. M. Allan, G.
Ahmad, M. B. Dickerson, B. C. Church, Z. Kang, H. W. Abernathy Iii, C. J.
Summers, M. Liu and K. H. Sandhage, Nature, 2007, 446, 172-175.
20. M. Ge, J. Rong, X. Fang and C. Zhou, Nano Letters, 2012, 12, 2318-2323.
21. M. Thakur, S. L. Sinsabaugh, M. J. Isaacson, M. S. Wong and S. L. Biswal, 2012,
2, 795.
22. Y. Yao, M. T. McDowell, I. Ryu, H. Wu, N. Liu, L. Hu, W. D. Nix and Y. Cui,
Nano Letters, 2011, 11, 2949-2954.
23. Z.-W. Zhou, Y.-T. Liu, X.-M. Xie and X.-Y. Ye, Chemical Communications,
2016, 52, 8401-8404.
24. S. Choi, T. Bok, J. Ryu, J.-I. Lee, J. Cho and S. Park, Nano Energy, 2015, 12,
161-168.
25. N. Lin, Y. Han, J. Zhou, K. Zhang, T. Xu, Y. Zhu and Y. Qian, Energy &
Environmental Science, 2015, 8, 3187-3191.
26. FACT Salt Phase Diagram,
http://www.crct.polymtl.ca/fact/phase_diagram.php?file=AlCl3-
ZnCl2.jpg&dir=FTsalt, 2017.
27. S. Pedersen, Viscosity, structure and glass formationin the AlCl3-ZnCl2 system,
Fakultet for naturvitenskap og teknologi, 2001.
28. K. Mishra, J. Zheng, R. Patel, L. Estevez, H. Jia, L. Luo, P. Z. El-Khoury, X. Li,
X.-D. Zhou and J.-G. Zhang, Submitted to Advanced Energy Materials, 2017.
29. G. A. Olah and A. Molnar, Hydrocarbon chemistry, John Wiley & Sons, 2003.
30. T. Kamegawa, D. Yamahana and H. Yamashita, The Journal of Physical
Chemistry C, 2010, 114, 15049-15053.
31. R. Atchudan, S. Perumal, T. N. Jebakumar Immanuel Edison and Y. R. Lee, RSC
Advances, 2015, 5, 93364-93373.
32. S. Franssila, Introduction to microfabrication, John Wiley & Sons, 2010.
33. H. K. Thomas, US Patent US4612168 A, 1986.
119
34. X. Liu, C. Giordano and M. Antonietti, Journal of Materials Chemistry, 2012, 22,
5454-5459.
35. W. Luo, X. Wang, C. Meyers, N. Wannenmacher, W. Sirisaksoontorn, M. M.
Lerner and X. Ji, 2013, 3, 2222.
36. I. H. Son, J. H. Park, S. Kwon, S. Park, M. H. Rümmeli, A. Bachmatiuk, H. J.
Song, J. Ku, J. W. Choi and J.-m. Choi, Nature communications, 2015, 6, 7393.
37. D. S. Jung, T. H. Hwang, S. B. Park and J. W. Choi, Nano Letters, 2013, 13,
2092-2097.
38. J. M. Kim, V. Guccini, K.-d. Seong, J. Oh, G. Salazar-Alvarez and Y. Piao,
Carbon, 2017, 118, 8-17.
39. D. Tang, R. Yi, M. L. Gordin, M. Melnyk, F. Dai, S. Chen, J. Song and D. Wang,
Journal of Materials Chemistry A, 2014, 2, 10375-10378.
40. Y. Liu, X. Guo, J. Li, Q. Lv, T. Ma, W. Zhu and X. Qiu, Journal of Materials
Chemistry A, 2013, 1, 14075-14079.
41. M. J. Loveridge, M. J. Lain, I. D. Johnson, A. Roberts, S. D. Beattie, R.
Dashwood, J. A. Darr and R. Bhagat, Scientific Reports, 2016, 6, 37787.
42. D. Qin, L. Xue, B. Du, J. Wang, F. Nie and L. Wen, Journal of Materials
Chemistry A, 2015, 3, 10928-10934.
43. P. G. Bruce, B. Scrosati and J. M. Tarascon, Angewandte Chemie International
Edition, 2008, 47, 2930-2946.
44. S. S. Zhang, K. Xu and T. R. Jow, Electrochimica Acta, 2004, 49, 1057-1061.
45. V. Etacheri, O. Haik, Y. Goffer, G. A. Roberts, I. C. Stefan, R. Fasching and D.
Aurbach, Langmuir, 2012, 28, 965-976.
46. S. H. Ng, J. Wang, D. Wexler, S. Y. Chew and H. K. Liu, The Journal of Physical
Chemistry C, 2007, 111, 11131-11138.