stability and churning in medi-cal and healthy families
DESCRIPTION
Stability and Churning in Medi-Cal and Healthy Families. Gerry Fairbrother, PhD Joseph Schuchter, MPH. Presented at California State Legislature Sacramento April 29, 2008. Studies have shown that children with stable coverage - PowerPoint PPT PresentationTRANSCRIPT

Stability and Churning in Medi-Cal and Healthy Families
Gerry Fairbrother, PhD
Joseph Schuchter, MPH
Presented atCalifornia State Legislature
SacramentoApril 29, 2008

Why is Stability Important?
• Studies have shown that children with stable coverage
– More likely to have a usual source of care – and to use it for most care
– Less likely to have unmet needs– Less likely to experience delays in care

Why is Stability Important?
• Stable is needed to manage care.
• Health Plans need time to:– Monitor care– Institute corrective action, if needed
• Stable promotes attachment to a regular provider and a medical home

In this study we:
• Followed newly-enrolled children in Medi-Cal and Healthy Families to see patterns of enrollment
• Examined cost after a gap

5251
40
60
80
100
0 3 6 9 12 15 18
Months after initial enrollment
% o
f ch
ildre
n s
till
enro
lled
Healthy Fam
Medi-Cal
Retention is Poor in both Medi-Cal and Healthy Families

Different Eligibility Groupings have Different Patterns
82
61
52
40
60
80
100
0 3 6 9 12 15 18
Months after initial enrollment
% o
f ch
ildre
n s
till
enro
lled
SSI
CALWORKS
1931(B)
100 PERCENT
133 PERCENT4039
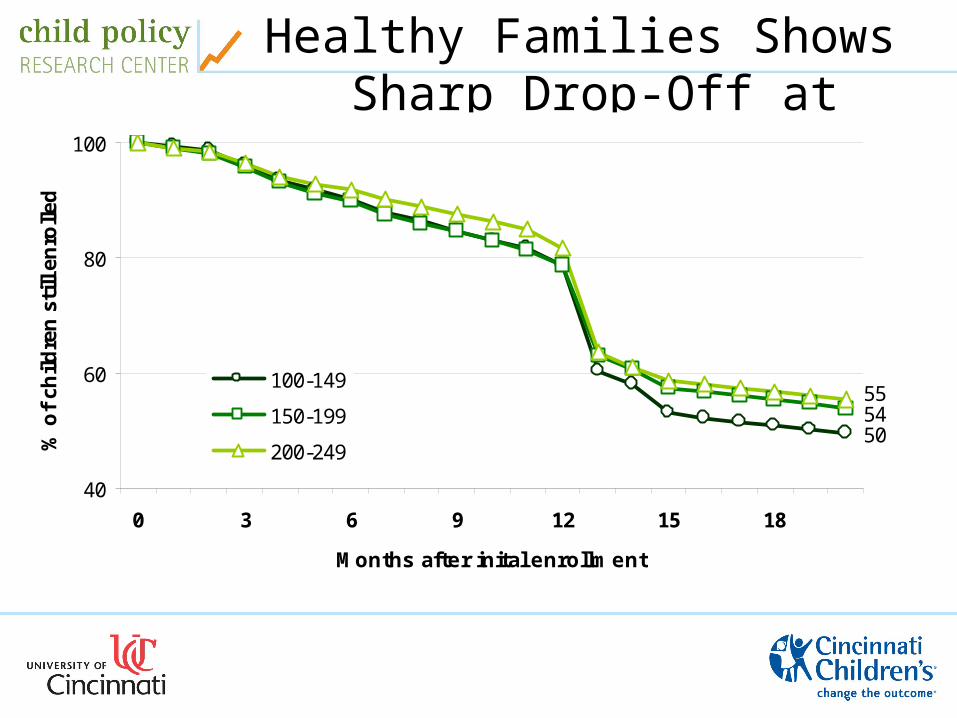
Healthy Families Shows Sharp Drop-Off at Renewal
505455
40
60
80
100
0 3 6 9 12 15 18
Months after inital enrollment
% o
f ch
ildre
n s
till
enro
lled
100-149
150-199
200-249
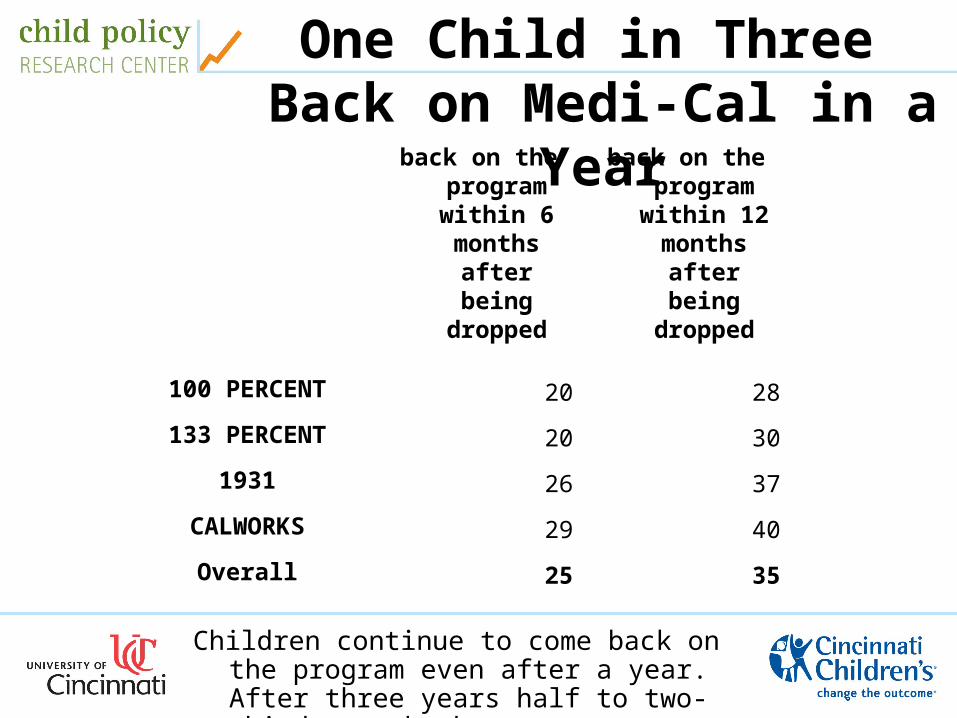
One Child in Three Back on Medi-Cal in a Year
back on the program within 6
months after being
dropped
back on the program within 12
months after being
dropped
100 PERCENT 20 28
133 PERCENT 20 30
1931 26 37
CALWORKS 29 40
Overall 25 35
Children continue to come back on the program even after a year. After three years half to two-thirds are back on.

National data shows children are still eligible
• Two uninsured children in three are eligible for coverage
• 42% of uninsured, eligible children had been enrolled in Medicaid in the prior year
– Therefore, states could reduce uninsured by 42% by just retaining eligible children
Somers BD. Why millions of children eligible for Medicaid and SCHIP are uninsured: poor retention vs. poor take-up. Health Affairs 2007;26(5):w560-67.

• COSTS OF CHURNING

Medical Costs are Substantial After a Gap
0.0
4.0
8.0
12.0
16.0
20.0
6 5 4 3 2 1 1 2 3 4 5 6
Months before gap - Months after gap
To
tal c
ost
s (m
illio
ns
$)
_
OTHER
medical equip
lab
prescriptions
psychiatric
provider visits
inpatient
• Gap>= 3 months (n=164,520)

Costs are Higher After 6 mo
0.0
4.0
8.0
12.0
16.0
20.0
6 5 4 3 2 1 1 2 3 4 5 6
Months before gap - Months after gap
To
tal c
ost
s (m
illio
ns
$)
_
OTHER
medical equip
lab
prescriptions
psychiatric
provider visits
inpatient
• Gap>= 6 months (n=83,058)

And Highest After 12 mo
0.0
4.0
8.0
12.0
16.0
20.0
6 5 4 3 2 1 1 2 3 4 5 6
Months before gap - Months after gap
To
tal c
ost
s (m
illio
ns
$)
_
OTHER
medical equip
lab
prescriptions
psychiatric
provider visits
inpatient
• Gap>= 12 months (n=23,492)

There are also administrative costs
Elements of Cost PA CA OH MI OR
State/County costs for Outreach and
Eligibility Determination
$95 $68 $47 $58 $69
Enrollment Broker $34 $28 $7 $13 No
broker
Health Plan (approximate)
$20 $26 $17 $15 $20
TOTAL $149 $122 $ 71 $ 86 $ 89

Level of Churning Varies
53 52 4634
25
31 3031
2731
16 18 2239 44
0%10%20%30%40%50%60%70%80%90%
100%
PA CA OH MI OR
Enrolled Continuously for 3 Years Came On the Rolls During the 3 Years
Fell Off the Rolls and Came Back
Data Source: State Medicaid Enrollment Files. Data includes children ages 5-18.
N=319,636 N=1,838,672 N=525,057 N=414,868 N=90,800
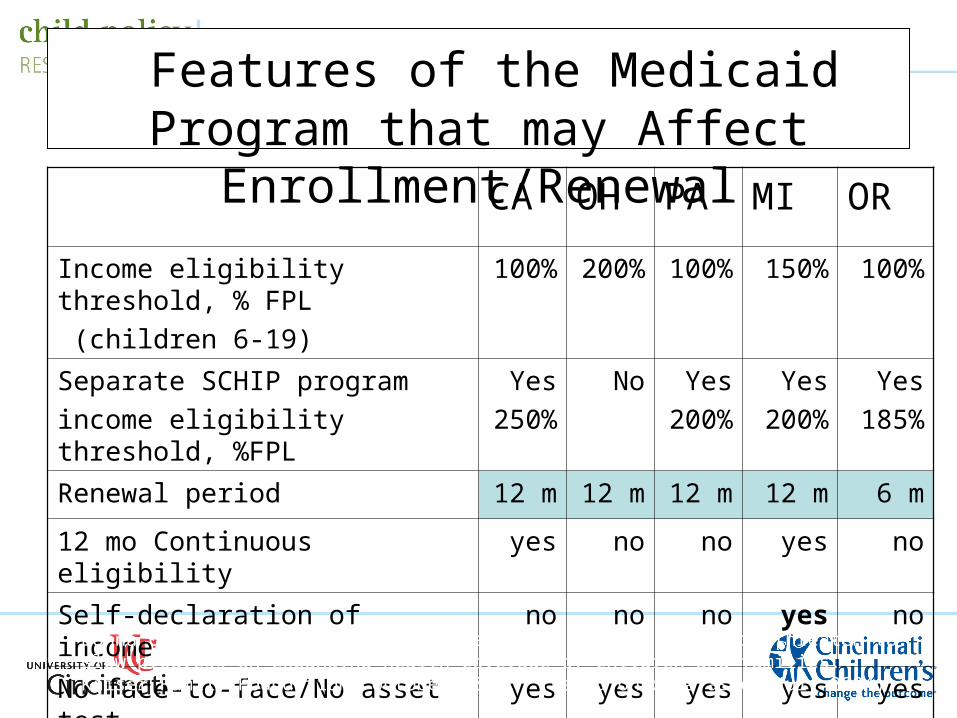
Features of the Medicaid Program that may Affect Enrollment/Renewal
CA OH PA MI OR
Income eligibility threshold, % FPL
(children 6-19)
100% 200% 100% 150% 100%
Separate SCHIP program
income eligibility threshold, %FPL
Yes
250%
No Yes
200%
Yes
200%
Yes
185%
Renewal period 12 m 12 m 12 m 12 m 6 m
12 mo Continuous eligibility yes no no yes no
Self-declaration of income no no no yes no
No face-to-face/No asset test yes yes yes yes yes
Donna Cohen Ross and Laura Cox. Beneath the Surface: Barriers threaten to slow progress on expanding health coverage of children and families. Kaiser Family Foundation. October 2004. (Based on data as of July 2004)

Conclusions
• Only half newly-enrolled children “survive” after 21 months
• Sharpest drop occurs at the 12-month renewal period
• Drop is more gradual for children in families receiving cash assistance or food stamps

Conclusions
• More frequent renewals will hit hardest children in 1931(B) and percentage programs
• These families are teetering on the brink of poverty and may need to support health care provides
• Costs are higher after a gap; the longer the gap the higher the cost when children return to coverage