st tammany parish tmdl response plan – progress in 2014
DESCRIPTION
St Tammany Parish TMDL Response Plan – Progress in 2014. “Green & Grey Infrastructure for a Cleaner, Greener STP”. Elizabeth deEtte Smythe, Ph.D. LA Urban Stormwater Coalition October 1, 2014. The DRIVER: Water Quality Impairments. EPA 303(d) List of Impaired Waterbodies (2006-2010). - PowerPoint PPT PresentationTRANSCRIPT

St Tammany Parish TMDL Response Plan – Progress in 2014
Elizabeth deEtte Smythe, Ph.D.LA Urban Stormwater Coalition
October 1, 2014
“Green & Grey Infrastructure for a Cleaner, Greener STP”

The DRIVER: Water Quality Impairments
Dissolved Oxygen Impairments in all watersheds from:• Individual
Sewer Systems
• Construction & Development
• Illicit Discharges
Hg (fish tissue)
Low DO FC Turb Chloride Sulfate TDS Low pH Benzo (a)
pyrene (PAHs)
Lead
2006 40 11 23 16 3 1 NaN NaN NaN NaN
2010 40 22 9 22 25 29 28 3 4 2
2.5
7.5
12.5
17.5
22.5
27.5
32.5
37.5
42.5
47.5
40
11
23
16
31
40
22
9
22
25
29 28
3 42
Nu
mb
er o
f Im
pai
red
S
egm
ents
EPA 303(d) List of Impaired Waterbodies (2006-2010)

Calibration Model - Current Conditions
TMDL Model – Projection to “worst case” conditions
TMDL = Allowable quantity of pollutant to meet standard …“pollutant budget”
TMDL = LA + WLA + MOS
The GOAL: Water Quality Improvement
The TMDL ProcessTotal Maximum Daily Load

TMDL Implementation LDEQ has established more stringent discharge limits
Phase I TMDL Implementation allocates changes to hundreds of permitted & unpermitted facilities
STP has begun implementation of WW & SW projects in response to TMDLs
CPRA has re-modeled TMDLs to determine potential DO improvements from the projects
St Tammany Parish must enforce through MS4 Permit (Stormwater Ordinance required) Require BMPs for NPS
Plan for Regionalization/upgrades
Encourage more WW Assimilation projects

The VEHICLE for WQ Improvement:STP MS4 Permit
LDEQ Multiple Separate Storm Sewer permit (MS4)

37 TMDLs Prepared by EPA & LDEQ for STP Impaired Waterbodies
Subsegment Waterbody Impairment
40802Tchefuncte River
BOD (13)
40803
40901Bayou Lacombe
40902
40903
Bayou Cane40904
40905 Bayou Liberty
40906 Bayou Paquet
40907 Bayou Vincent
40908 Bayou Bonfouca
90105Pearl River Navigation Canal
90204
90207 Middle & West Middle River
40909 W-14 Diversion Canal
Fecal Coliform (4)40910 Salt Bayou
90101 Pearl River
90207 Middle & West Middle River
40801 Tchefuncte River
Mercury (13)
40905 Bayou Liberty
40906 Bayou Paquet
90101Pearl River
90107
90102East Pearl River
90103
90105Pearl River Navigation Canal
90204
90106 Holmes Bayou
90201 West Pearl River
90205 Wilson Slough
90207 Middle & West Middle River
90105Pearl River Navigation Canal
Nitrate (3)90204
90207 Middle & West Middle River
40903 Bayou Cane TSS
90106 Holmes Bayou
Turbidity (3)90201 West Pearl River
90202 Morgan River
Total 37
TMDL = Allowable quantity of pollutant to meet WQ standard…“pollutant budget”

The “DO TMDL Effect” on STP Dischargers
• Distinct areas where loadings must be reduced
• “No Parish Action” will severely impact permittees in the next permitting cycle
LDEQ Subseg Watershed
Permitted Dischargers
Total Permitted
GPD
40802 &
40803
Lower Tchefuncte, Ponchitolawa, Tete L'Ours,
DeZaire (Dissolved Oxygen)211 4,347,327
40901Bayou Lacombe
(Dissolved Oxygen)61 129,641
40902Cypress Bayou & Big Branch
(Dissolved Oxygen)17 282,979
40903Bayou Cane (Dissolved
Oxygen)4 287,500
40905 -
40908
Bayous Liberty, Vincent, Bonfouca, Paquet
(Dissolved Oxygen)184 1,223,107
40909 W-14 Canal (Fecal Coliform) 47 7,093,471
40910 Salt Bayou (Fecal Coliform) 6 37,426
530 13,401,451 TOTALS
Drastic reduction of discharge limits for LPDES permittees

What we found out about STP aka “the DO TMDL Effect”
• 530+ LPDES dischargers impacted in STP
• Five significant areas of impact “Clusters”
• 35 “hot spots” indicating “failed standards”

Point & Nonpoint Source LOADS Create DO “Hot Spots”
“Hot spots” – (Red Circles)
Failed sites usually located near
• Multiple Point Sources
• Unsewered S/Ds
Failed sites characterized by HIGH Nonpoint Source loads in TMDL models
R#10
R#2
R#4-6

The DO TMDL Effect: STP Response• Establish “cluster” areas where Parish will link SW
and WW projects for max benefit
• Evaluate/develop strategy for reducing loadings at “hot spots”
• Retrofit drainage projects by adding WQ improvement components
• Review Parish laws and modify (if necessary) to meet WQ goals
• Implement education/outreach program for permit holders and the public

Four-Pronged Approach to Water Quality Improvement
1. Wastewater
2. Stormwater
3. Conservation & Mitigation
4. Education & Outreach
An Integrated, “green” concept

1. WW Consolidation Program ($54.4 Million spent to date)
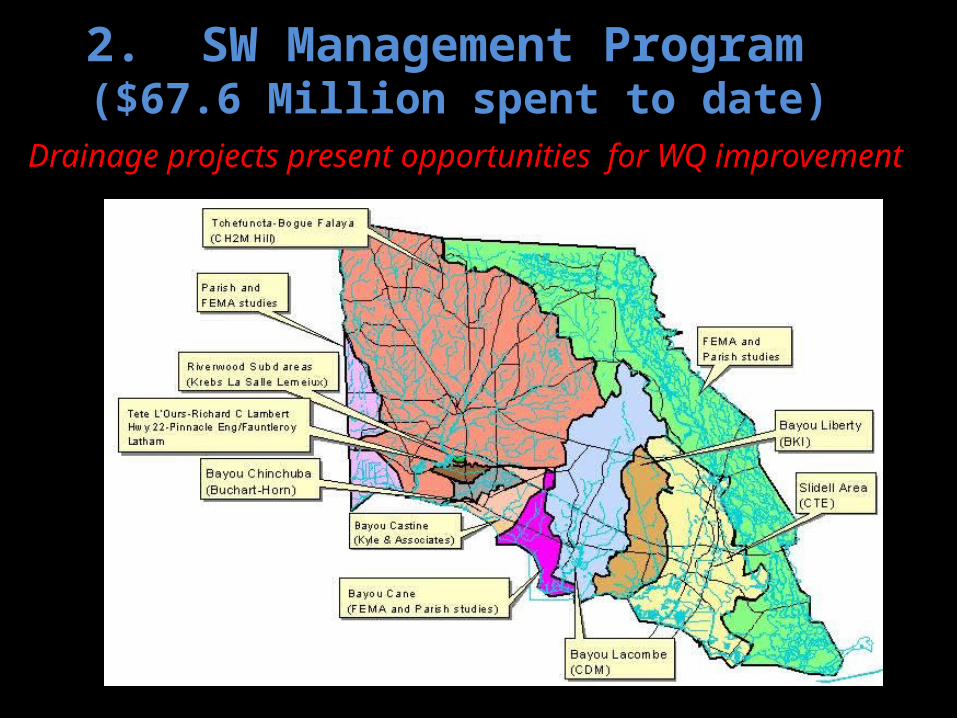
2. SW Management Program ($67.6 Million spent to date)
Drainage projects present opportunities for WQ improvement

3. Coastal, Conservation & Mitigation Program ($38.6 million spent to date)
Criteria WeightMitigate Floods &
Stormwater25%
Protect Critical & Sensitive Areas
25%
Protect & Restore Wetlands
50%
Greenprint Conservation Priorities

4. Education & Outreach Program
• TMDL Outreach Meetings
• BMP Workshops
• WQ Task Force Meetings
• LA Urban SW Coalition (LUSC)
• Staff SW Certifications & Training
• Clean Marina Workshops
• Re-Tree St Tammany
• World WQ Monitoring Day
• Household HW Day
STP is active in WQ improvement Education & Outreach Programs

TMDL Action Plan: SW Progress (2014)
• SW Demonstration Ponds (various BMPs)
• SW Retention Ponds (Planted w/wetland vegetation)
• LPBF has completed Year 1 “Hot Spot” monitoring
• WW improvements completed
• CPRA has re-modeled TMDLs to determine potential DO improvements from projects

Stormwater Demonstration & WQ Ponds

“Hot Spots” Identified by TMDLs at Locations Failing DO Standards
Allows STP to analyze CAUSE of standards failure
Most HS are in streams determined to be:
• Flow-limited (stagnant)
• Intermittant
• Wetland-dominated
34 “Hot spots”

Casa Bella SD(Aeration BMP)
Casa Bella
Aeration
(n=46)
RE, %
TSS (CBOD) 74TN 64
NO3-N 25TKN 52TP 47
Constituents
• 25 homes•2 schools (1250 students & staff)• Sewered SD

Del Sol SDFloating Wetland BMP ($250,000)
Bioremediation: Floating wetlands mimic natural functions, transforming nutrients & pollutants into forms that are useful for organisms
Del Sol
Floating Wetland(n=19)
RE, %
TSS (CBOD) 66TN 38
NO3-N 59TKN 59TP 65
Constituents
•>250 homes in micro watershed• 150 Sewered• 100 Unsewered

LaBarre Street Vegetative Planting BMP ($3.5 million)
• 205 homes benefitting• Sewer connections under construction
Labarre Street
Vegetative Planting(n=57)
RE, %
TSS (CBOD) 66TN 84
NO3-N 53TKNTP 39
Constituents

Little Creek Commercial Pond (Induced Flow BMP: HS-03)
Little Creek
Induced Flow
(n=32)
RE, %
TSS (CBOD) 37TN 37
NO3-NTKN 17TP 28
Constituents
• drainage benefit• commercial & residential runoff•Benefit to 5 “hot spots”

CPRA Model: WW Consolidation Program in Bayou Vincent
• Eagle Lake MHP removes 10,600 GPD (RKm 20.4)
• Alton SD removes 34,100 GPD (RKm 16.5)
• Estimated to Improve DO from ~1 mg/L 4.6 mg/L
AltonEagle Lake MHP

CPRA Model: Ben Thomas Road Pond (Flow Augmentation)
Proposed Pond will improve drainage AND WQ in the area
AltonEagle Lake MHP
IF Pond

Volunteers planted over 500 trees in November 2012
7.5-Acre Tammany Hills SW Pond( Vegetative Planting)

Tammany Hills SD(Vegetative Planting)
• 401 homes benefitting• Unsewered SD
Tammany Hills
Vegetative Planting(n=57)
RE, %
TSS (CBOD) 66TN 84
NO3-N 53TKNTP 39
Constituents

CPRA Model: 7.5-Acre Tammany Hills Sewer Improvements & SW Pond
( Vegetative Planting)
SW/WQ Pond
Sewer improvements
• Sewerage improvements to Tammany Hills SD (RKm 8.3) removes 215,000 GPD
• Adding the SW/WQ Pond provides additional DO benefits

14-Acre Chinchuba SW Pond (Vegetative Planting )
Volunteers planted over 4400 trees in February 2013

CPRA Model: 14-Acre Chinchuba SW Pond (Vegetative Planting)
• Even with sewer and pond improvements will be inadequate to meet the current DO standard
• Area is minimally developed & wetland dominated (naturally dystrophic)• LDEQ and EPA are working to produce a UAA, lowering the DO Standard to a
more appropriate level.
Sewer improvements
SW/WQ Pond

90-Acre Cypress Bayou SW Pond (Vegetative Planting/Flow Augmentation
$5.3 million)Volunteers planted over 4,000 trees & herbaceous shrubs in December 2013
IF Pond
• Even with Induced Flow, the WQ improvements will be inadequate. • The area is minimally developed & wetland dominated (naturally dystrophic)• LDEQ and EPA are working to justify a UAA lowering the DO Standard to a more
appropriate level.

Parish Financial Commitments to Drainage/WQ ($160.6 Million)
Project Element CommitmentWastewater $ 54,400,000
Utility Acquisitions 46,000,000$
Wetland Assimilation (Mandeville) 4,000,000$
System Expansions (residential) 4,400,000$
Stormwater 67,559,521$
Engineering Drainage Projets & Watershed Studies (from 2004) $60,393,300
CIAP 500,000$
Slidell Reine Canal 1,600,000$
USGS Streamgauging Co-operative Funding 563,375$
Levee Systems & Pump Stations 4,502,846$
Conservation 38,616,675$
Coastal Program 26,026,675$
Conservation Easements & Property Acquisitions 12,590,000$
TOTALs 160,576,196$
A substantial achievement for any local government

TMDL Response: Proposed Projects (Estimated Costs $37 Million)
Project Cost
S&W Projects 27,100,000$
Hot Spot cluster 3,250,000$
Drainage enhancement 5,000,000$
Environmental plan 500,000$
Public info plan 100,000$
Ordinance Overhaul 50,000$
Inspection & Enforcement 500,000$
Environmental plan 500,000$
Total 37,000,000$

Demonstrated WQ Improvement: 2012 303(d) List
Hg (fish tissue)
TDS Temp Low DO FC Low pH Copper Chlorides Lead
2006 (82) 41 NaN NaN 12 26 NaN NaN 3 NaN
2008 (53) 12 2 0 23 9 7 0 0 0
2010 (57) 13 5 0 19 9 6 0 3 2
2012 30) 6 6 6 5 3 2 2 0 0
2.5
7.5
12.5
17.5
22.5
27.5
32.5
37.5
42.5
47.5
41
12
26
3
6 6 65
32 2
0 0
Nu
mb
er o
f Im
pai
red
S
egm
ents

Questions?