st t f id h ate of idaho
TRANSCRIPT
St t f Id hState of IdahoBenefits Analysis & Total Compensation Review
JANUARY 2013
P d bPrepared by:
Ron KeimachPrincipalp
Malinda RileyBenefits Consultant
Lisa BaileyAssociate Consultant
Chris EwingAnalyst
2© 2013 Hay Group. All rights reserved

C t tContents
Background and Objectives
Benefits Market Analysis
1
2 y
Summary of Salary Market Competitiveness
Market Competitiveness Total Compensation
3
4
2
B fit V l ti M th d l
Market Competitiveness – Total Compensation
Appendices5
4
A. Benefits Valuation MethodologyB. Benefits Participant ListsC. Benefit Value Comparison Charts – General MarketD B fit V l C i Ch t W t P bli S t M k tD. Benefit Value Comparison Charts – Western Public Sector MarketE. Benefits Prevalence of Practice Report
3© 2013 Hay Group. All rights reserved

B k d d Obj tiBackground and Objectives
B k d d bj tiBackground and objectives
The State of Idaho (the “State”) has requested a comprehensive benefits market analysis and a review of the State’s total compensation market position. Specifically, the State has asked Hay Group to:
Provide a detailed benefits analysis including a review of the competitive position in health care, retirement, death benefits, disability paid time off (sick leave vacation and holidays) and otherdisability, paid time off (sick leave, vacation and holidays) and other benefits relative to general market organizations in Idaho, as well as Nevada, Oregon, Utah and Washington, and public sector organizations in the West excluding California;organizations in the West, excluding California; Conduct a high level review of the State’s total compensation market position, including benefits and salary, based on salary market data provided by the State; andPrepare a report and present our key findings on the overall competitiveness of the State’s compensation and benefits program to
5© 2013 Hay Group. All rights reserved
competitiveness of the State s compensation and benefits program to the legislature.

B k d d bj tiBackground and objectives
The following steps have been undertaken to achieve the State’s project objectives:
Initial planning and scoping meeting;p g p g g;Mutual agreement on the market comparator groupCollection of current State of Idaho benefits dataCollection of appropriate salary data (State and Market);Analysis of benefits data;Analysis of salary dataAnalysis of salary dataReview of total compensation; andPresentation of this preliminary reportp y p
6© 2013 Hay Group. All rights reserved
B k d & bj ti d fi iti f tBackground & objectives – definition of terms
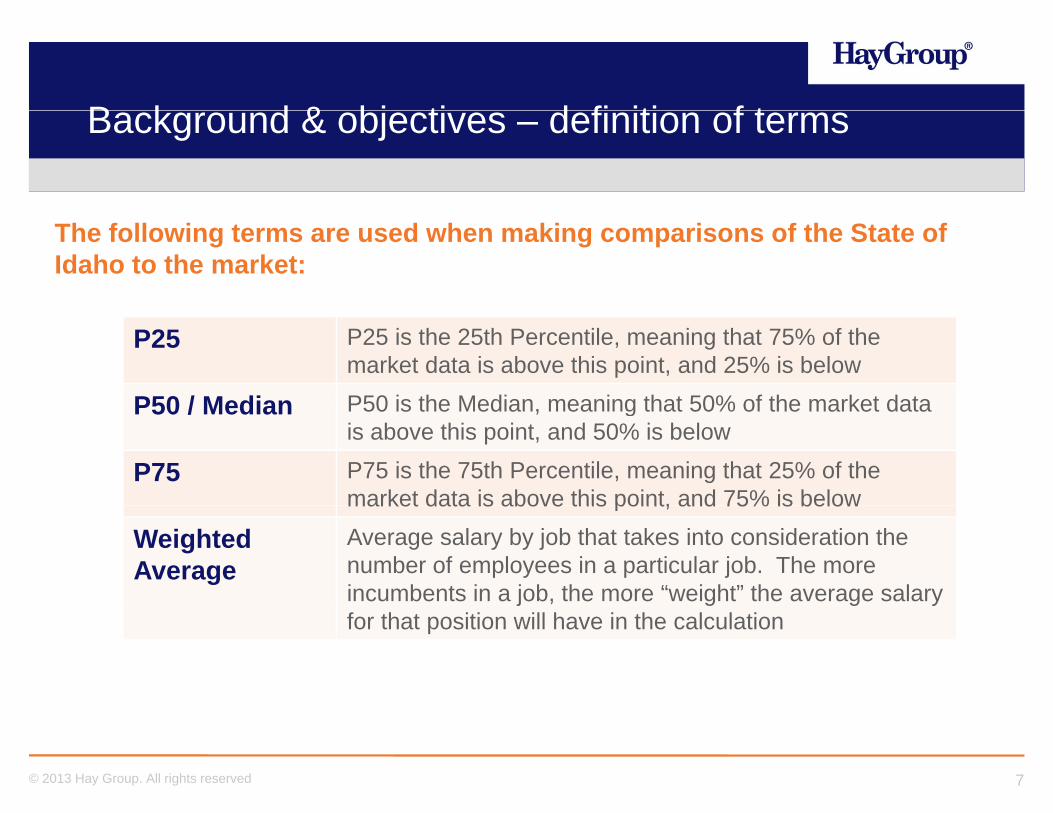
The following terms are used when making comparisons of the State of Idaho to the market:
P25 P25 is the 25th Percentile, meaning that 75% of the market data is above this point, and 25% is below
P50 / Median P50 is the Median meaning that 50% of the market dataP50 / Median P50 is the Median, meaning that 50% of the market data is above this point, and 50% is below
P75 P75 is the 75th Percentile, meaning that 25% of the market data is above this point, and 75% is belowmarket data is above this point, and 75% is below
Weighted Average
Average salary by job that takes into consideration the number of employees in a particular job. The more incumbents in a job, the more “weight” the average salary j , g g yfor that position will have in the calculation
7© 2013 Hay Group. All rights reserved

B fit M k t A l iBenefits Market Analysis

M k t C titi B fitMarket Competitiveness – Benefits
In order for compensation decisions to be based on the competitiveness ofIn order for compensation decisions to be based on the competitiveness of total compensation, Hay Group has conducted a comprehensive analysis of the competitiveness of the benefits program offered by the State
Thi l i h b b d th b fit i f tiThis analysis has been based on the benefits program information provided by the State for its current fiscal year benefits programHay Group used two comparator markets for the benefits analysis y p p y
− General Market – General market organizations with employees in the State of Idaho, as well as Nevada, Oregon, Utah and Washington contained in our current benefits databaseWashington contained in our current benefits database
− Public Sector Market – Public sector organizations (states, counties, cities, etc.) in the West, excluding California
Given the changing workforce demographics and increased mobility it is important to compare to a broad market of organizations (both public and private sector) as it represents the State’s employee talent
9© 2013 Hay Group. All rights reserved
public and private sector) as it represents the State s employee talent pool
M k t C titi B fitMarket Competitiveness – Benefits
The State pro ides a f ll range of benefit programs to its emplo eesThe State provides a full range of benefit programs to its employees that is market competitive in aggregate.
− Health care and retirement, the two primary drivers of overall market ycompetitiveness, are at or above market median relative to both the General Market and the Public Sector marketDeath disability and paid leave (holiday/vacation) are also− Death, disability and paid leave (holiday/vacation) are also competitive relative to both comparator groups; however, these benefits comprise a smaller portion of the total benefit package
− Other benefits are below market, as the State does not provide any state-wide employer paid benefits in the area of tuition reimbursement, dependent care or commuter subsidies
10© 2013 Hay Group. All rights reserved
M k t C titi B fitMarket Competitiveness – Benefits
It i i t t t t th t th diff b t P25 P50 d P75 iIt is important to note that the differences between P25, P50 and P75 in the Public Sector market are not as big as we typically see in other industries:
− Specifically, the Public Sector Market cash equivalent difference between the market P50 and P75 ranges from 5% to 9% for most salary levels while the difference in the General Market is at least 15%salary levels while the difference in the General Market is at least 15%
− Compression in public sector market values is common and demonstrates the significant similarities in current public sector benefit programs, especially retirement and health care
The following pages summarize the State’s competitive position relative to both markets Please refer to the appendix for a description of theto both markets. Please refer to the appendix for a description of the benefits valuation methodology (A), a listing of the comparator organizations (B), detailed charts illustrating market competitiveness for all benefit program components (C and D) as well as a comparison of the
11© 2013 Hay Group. All rights reserved
benefit program components (C and D) as well as a comparison of the State’s benefit program provisions to the markets (E).

G l M k t C titi B fitGeneral Market Competitiveness – BenefitsEMPLOYER PAID TOTAL BENEFITS VALUES – Salary Levels $20,000 - $200,000 General Market
$70,000
$60,000
$70,000
P75Idaho
At all salary levels, the State’s benefit program is at or above the 75th percentile of the General Market
The above market position is primarily due to the
$50,000
alue
P50
P25
The above market position is primarily due to the strong health care and retirement programs provided by the State
$30,000
$40,000
Ben
efit
Va P25
$20,000
$0
$10,000
12© 2013 Hay Group. All rights reserved
$20 $30 $40 $50 $60 $70 $80 $90 $100 $150 $200
Salary Levels (000s)

G l M k t C titi B fit
B fit M k t K Fi di
General Market Competitiveness – BenefitsSTATE OF IDAHO VS. GENERAL MARKET
Benefit Area
Market Comparison
Key Findings
Total Benefits
P75 Market position is driven primarily by the retirement and health care benefits. Benefits that are a direct function of pay and have a higher likelihood of being utilized determineBenefits that are a direct function of pay and have a higher likelihood of being utilized determine overall program value.
Health Care P75 The State’s lower premium cost sharing is the primary driver of the above market position relative to the General Market. Deductibles, out of pocket maximums, copayments, etc. are within market norms. p y ,
Retirement Above P75 The defined benefit plan with a 2% formula puts the State well above typical General Market practice, where defined contribution plans are more prevalent.
Death Below P25 The State’s basic death benefit of 1 times salary is aligned with typical General Market practice however the limited supplemental benefits decreases overall valuepractice, however, the limited supplemental benefits decreases overall value
Disability Above P75 The combination of sick leave (with no maximum accrual) and employer paid Short Term Disability (STD) coverage, puts the State above the General Market, where more limited sick leave is typical along with employer paid STD coverage.
Oth B l P25 Th St t id t di l d d d t di t b tOther Below P25 The State provides access to medical and dependent care spending accounts, but does not contribute toward programs such as tuition reimbursement or commuting assistance, resulting in a below market position in this category.
Holiday/ V ti
N/A Holiday and vacation is excluded from benefit values so time off is not double counted as a benefit and as part of salary
13© 2013 Hay Group. All rights reserved
Vacation as a benefit and as part of salary

P bli S t M k t C titi B fitPublic Sector Market Competitiveness – BenefitsEMPLOYER PAID TOTAL BENEFITS VALUES – Salary Levels $20,000 - $200,000 Public Sector Market
$70,000
$60,000
$70,000
P50P75
P25Idaho
The State is aligned with the Market Median of the Public Sector.
The market median position is due to the fact that the
$50,000
alue
The market median position is due to the fact that the State’s retirement formula and health care program cost sharing are similar to the market
$30,000
$40,000
Ben
efit
Va
$20,000
$0
$10,000
14© 2013 Hay Group. All rights reserved
$20 $30 $40 $50 $60 $70 $80 $90 $100 $150 $200
Salary Levels (000s)

P bli S t M k t C titi B fitSTATE OF IDAHO VS. PUBLIC SECTOR MARKET
Public Sector Market Competitiveness – Benefits
B fit M k t K Fi diBenefit Area
Market Comparison
Key Findings
Total Benefits
P50 Market position is driven primarily by the retirement and health care benefits. Benefits that are a direct function of pay and have a higher likelihood of being utilized determineBenefits that are a direct function of pay and have a higher likelihood of being utilized determine overall program value.
Health Care P50 The State’s premium cost sharing as well as deductibles, out of pocket maximums, copayments, etc. are aligned with typical Public Sector practice.
R ti t P50 The State’s defined benefit plan is aligned with the public sector The 2% benefit planRetirement P50 The State s defined benefit plan is aligned with the public sector. The 2% benefit plan formula is slightly above the average of 1.88%.
Death Varies by Salary
The State’s basic death benefit of 1 times salary is not the prevalent plan design for Public Sector organizations, which results in a below P25 position for lower paid employees and an above market median position for higher paid employees Typicalemployees and an above market median position for higher paid employees. Typical design is a flat dollar benefit of $40-$50K.
Disability Above P75 The combination of sick leave (with no maximum accrual) and employer paid Short Term Disability (STD) coverage, puts the State above the Public Sector, where employee paid STD coverage is more prevalent.employee paid STD coverage is more prevalent.
Other Below P25 The State provides access to medical and dependent care spending accounts, but does not contribute toward programs such as tuition reimbursement or commuting assistance, resulting in a below market position in this category.
Holiday/ N/A Holiday and vacation is excluded from benefit values so time off is not double counted
15© 2013 Hay Group. All rights reserved
Holiday/ Vacation
N/A Holiday and vacation is excluded from benefit values so time off is not double counted as a benefit and as part of salary

M k t C titi H lth C B fitMarket Competitiveness – Health Care Benefits
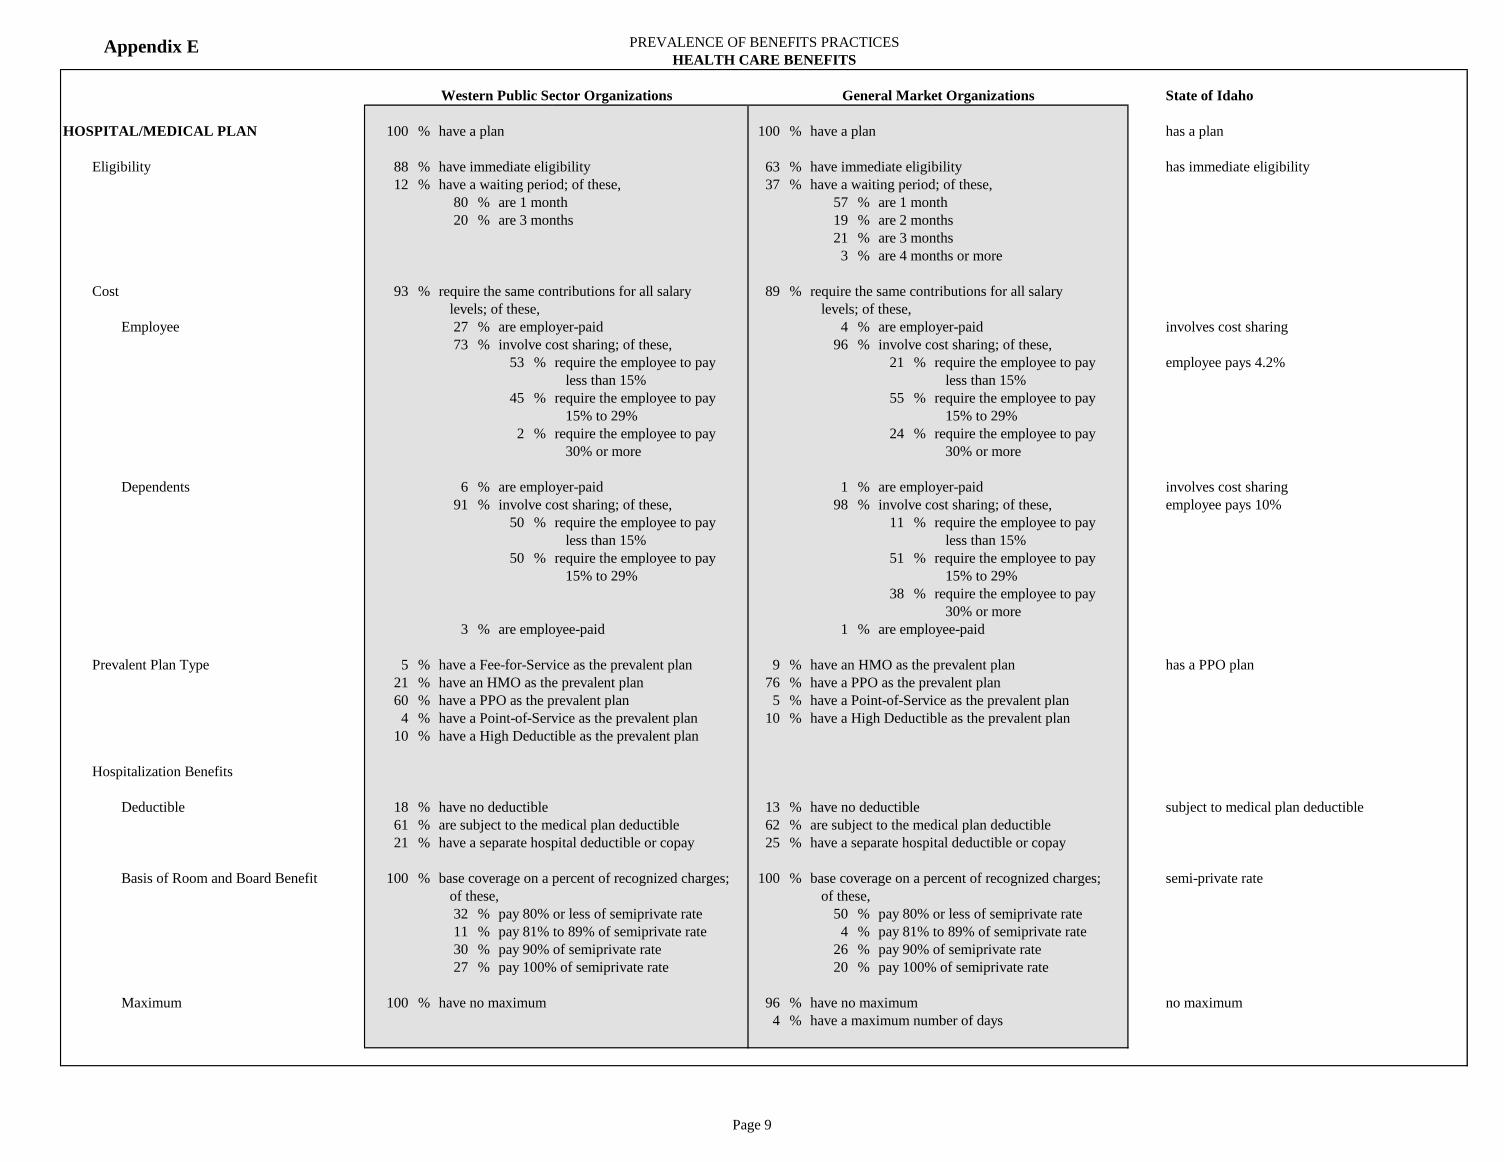
The State’s most prevalent plan is a PPO plan. A PPO plan is the most common for both comparator groups (76% for General Market and 60% for Public Sector)The State requires employees to pay 4.2% of the premium for single coverage and 10% for family coverage This feature puts the State above both marketsfor family coverage. This feature puts the State above both markets− 4% of the General Market and 27% of the Public Sector Market provide employer
paid coverage for single coverage. Only 1% of the General Market and 6% of the Public Sector Market provides employer paid coverage for dependentsPublic Sector Market provides employer paid coverage for dependents
− The most prevalent cost sharing range for employee coverage in the General Market is 15% to 29% (55%) and less than 15% for the Public Sector (53%)
− The most prevalent cost sharing range for dependent coverage is 15% to 29% for theThe most prevalent cost sharing range for dependent coverage is 15% to 29% for the General Market (51%) and split 50/50 between less than 15% and 15% to 29% for the Public Sector Market
The State pays 85% coinsurance for most services, while 64% of the Public Sector p y ,maintains 100% coinsurance. The General Market is split between 80% coinsurance (46%) and 100% coinsurance (50%)The State’s $20 office visit copayment is aligned with both markets
16© 2013 Hay Group. All rights reserved

M k t C titi H lth C B fitMarket Competitiveness – Health Care Benefits
The State’s individual deductible of $250 is better than both markets while the family deductible of $750 is more aligned with both markets − 69% of the Public Sector Market and 75% of General Market have an individual
deductible of $300 or moredeductible of $300 or more− 55% of the Public Sector Market has a family deductible of less than $1,000, while
59% of General Market has a family deductible between $500 and $1,500 The State’s individual and family out of pocket maximums of $3 000 and $6 000The State’s individual and family out of pocket maximums of $3,000 and $6,000, respectively, are slightly below both markets − 50% of the Public Sector and 39% of the General Market have individual maximums
of $2 000 to $2 999 20% and 18% of the PS and GM respectively have individualof $2,000 to $2,999. 20% and 18% of the PS and GM, respectively have individual maximums of $1,001 to $1,999
− Only 27% of the Public Sector market has a family maximum of greater than $5,000, while 45% of the General Market’s family maximum is greater than $5,000y g ,
The State’s 3 tier prescription copayment structure of $10 / $25 / $50 is aligned with both the Public Sector and General Markets
17© 2013 Hay Group. All rights reserved
M k t C titi H lth C B fitMarket Competitiveness – Health Care Benefits
The State’s dental program is below typical market practice when compared to both Public and General Market practice for the following reasons:− Employee cost sharing of 27% and 100%− Less than 100% coverage for preventative (the State covers 80%)− $1,000 annual maximum is lower than $1,500 prevalent market levelThe State of Idaho’s health care program is at the median of Public Sector organizations and at the P75 of General Market organizations
18© 2013 Hay Group. All rights reserved

M k t C titi R ti M di lMarket Competitiveness – Retiree Medical
With regard to retiree medical coverage, prevalent market practice is as follows:− 61% of the General Market provides no retiree coverage− 64% of the Public Sector Market covers both early and normal retirees− 5% of the General Market and 18% of the Public Sector Market provide coverage to
early retirees only, which is the State’s practice for employees hired before July 1, 2009 The prevalent practice in the Public Sector is to provide retiree paid coverage (69%), while
l t G l M k t ti i t h th t ith ti (59%)prevalent General Market practice is to share the cost with retirees (59%)For employees hired prior to July 1, 2009, the State offers pre-65 retiree medical coverage. Employees may use unused sick leave to pay the premiums for certain State provided medical programs provided they meet eligibility requirements:medical programs, provided they meet eligibility requirements:− The sick leave conversion formula is based on credited hours/years of state service,
with a maximum of 600 hours (for employees with 15 or more years of service)− The hours are converted to dollars at retirement based on an employee’s final rate ofThe hours are converted to dollars at retirement based on an employee s final rate of
pay. For example, an employee with 800 hours of unused sick leave, has 400 hours of usable sick leave or 50 days. If the employee earns $50,000 annually ($192 daily rate), they would receive $9,615 to fund retiree medical. ($192 x 50 = $9,615)
19© 2013 Hay Group. All rights reserved
− Idaho statistics show the average value of unused sick leave at retirement is $8,000
M k t C titi R ti M di lMarket Competitiveness – Retiree Medical
In order to compare the State’s program on an apples to apples basis with the market, our methodology values benefits provided to someone hired today. As a result, the value of the program for employees hired before July 1, 2009 was not valued in the analysisanalysis If the value of this closed program were valued, it would not change the overall market position of the State’s health care programEmployees hired after July 1 2009 are still able to convert unused sick leave atEmployees hired after July 1, 2009, are still able to convert unused sick leave at retirement; however, they may use the monies for purchase of individual Medicare supplement plan coverageGiven that employees hired after July 1, 2009 do not have access to group retireeGiven that employees hired after July 1, 2009 do not have access to group retiree coverage, the value of the benefit is not significant and does not impact the State’s overall health care market position of the P75 relative to the General Market and the P50 relative to the Public Sector market
20© 2013 Hay Group. All rights reserved

M k t C titi R ti t B fitMarket Competitiveness – Retirement Benefits
The State of Idaho sponsors a defined benefit retirement plan, a voluntary 401(k) plan and voluntary 457 plan− The defined benefit plan is a career average pay plan with a 2% formula based on
the highest 3.5 years of pay during an employee’s career. The program requires employees to contribute 6.23% of pay to the plan
− The defined contribution plans – 401(k) and 457 – permit employees to make l t t d f l th t t t h d b th St tvoluntary pre-tax deferrals that are not matched by the State
In the market, 95% of Public Sector Market and 31% of the General Market offer a defined benefit pension plan
57% f P bli S t l f ll l id hil 95% f G l M k t− 57% of Public Sector plans are fully employer paid, while 95% of General Market plans are employer paid
− 35% of the Public Sector Market and 29% of the General Market also make employer contributions to a defined contribution plan in addition to the pension plancontributions to a defined contribution plan, in addition to the pension plan
The General Market most typically makes contributions to a defined contribution retirement program only (63%)
21© 2013 Hay Group. All rights reserved
M k t C titi R ti t B fitMarket Competitiveness – Retirement Benefits
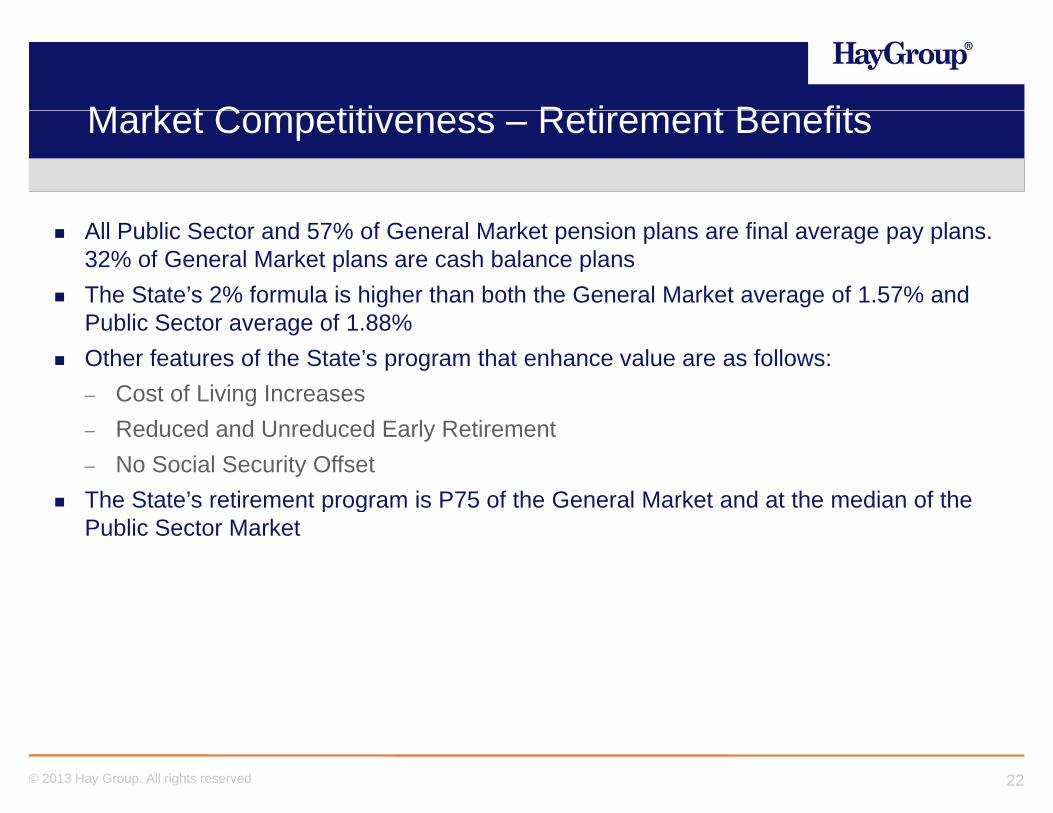
All Public Sector and 57% of General Market pension plans are final average pay plans. 32% of General Market plans are cash balance plansThe State’s 2% formula is higher than both the General Market average of 1.57% and Public Sector average of 1.88%Other features of the State’s program that enhance value are as follows:− Cost of Living Increases− Reduced and Unreduced Early Retirement− No Social Security OffsetThe State’s retirement program is P75 of the General Market and at the median of theThe State s retirement program is P75 of the General Market and at the median of the Public Sector Market
22© 2013 Hay Group. All rights reserved

M k t C titi D th B fitMarket Competitiveness – Death Benefits
The State provides a basic life insurance and an Accidental Death and Dismemberment (AD&D) plan that provides a benefit of 1 times salary, with no maximum. Only 38% of the Public Sector Market provides a salary based benefit, while 88% of the General Market provides a salary based benefitprovides a salary based benefitWhile typical Public Sector Market practice provides a flat dollar benefit, the General Market provides a benefit based on a uniform earnings multiple, such as 1x or 2x pay, with 1x pay as the most prevalent benefit level in the General Market (50%)p ( )The median flat dollar benefit for the Public Sector Market is approximately $40,000, which explains the State’s below market position for employees earning less than $50,000 and more competitive position for those earning more than $50,000The State’s basic benefit is augmented by employee paid supplemental group life plan; however, it only provides an additional 1 times pay, while in both markets employees may purchase 3 to 5 times pay. − Effective January 1, 2013, employees will be able to purchase supplemental life
coverage up to 3 times pay The State does not provide supplemental AD&D coverage, while 53% of the Public Sector
d 55% f th G l M k t id l t l AD&D
23© 2013 Hay Group. All rights reserved
and 55% of the General Market provide supplemental AD&D
M k t C titi D th B fitMarket Competitiveness – Death Benefits
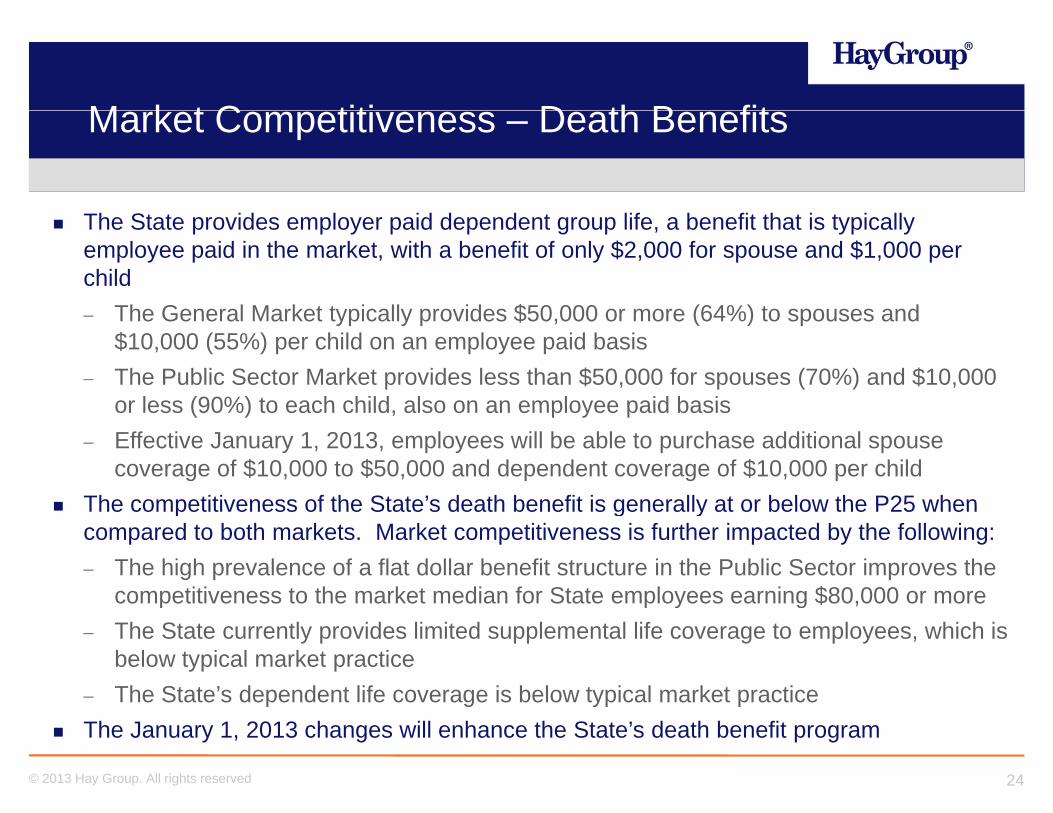
The State provides employer paid dependent group life, a benefit that is typically employee paid in the market, with a benefit of only $2,000 for spouse and $1,000 per child
Th G l M k t t i ll id $50 000 (64%) t d− The General Market typically provides $50,000 or more (64%) to spouses and $10,000 (55%) per child on an employee paid basis
− The Public Sector Market provides less than $50,000 for spouses (70%) and $10,000 or less (90%) to each child also on an employee paid basisor less (90%) to each child, also on an employee paid basis
− Effective January 1, 2013, employees will be able to purchase additional spouse coverage of $10,000 to $50,000 and dependent coverage of $10,000 per child
The competitiveness of the State’s death benefit is generally at or below the P25 whenThe competitiveness of the State s death benefit is generally at or below the P25 when compared to both markets. Market competitiveness is further impacted by the following:− The high prevalence of a flat dollar benefit structure in the Public Sector improves the
competitiveness to the market median for State employees earning $80,000 or morep p y g $ ,− The State currently provides limited supplemental life coverage to employees, which is
below typical market practice− The State’s dependent life coverage is below typical market practice
24© 2013 Hay Group. All rights reserved
p g yp pThe January 1, 2013 changes will enhance the State’s death benefit program

M k t C titi Di bilit B fitMarket Competitiveness – Disability Benefits
The State provides a salary continuation plan (sick leave) plus employer paid short term disability. Salary continuation provides benefits at full pay based on accumulation of days (12 days per year) with no maximum accumulation− 54% of the General Market provides a salary continuance plan only and another 43%
provide both a salary continuance plan and STD plan− 55% of the Public Sector Market provides salary continuance plan only and 45%
id b th l ti d STD lprovide both salary continuance and STD plans General Market organizations typically base salary continuance on a uniform benefit (54%) or service schedule (25%), while 78% of the Public Sector Market bases salary continuance on an accumulation of days as Idaho doescontinuance on an accumulation of days, as Idaho does61% of the Public Sector Market accrues 12 days of sick leave annually, as Idaho does, while another 28% accrue 13 days or more per yearThe State has no limit on the number of sick days an employee can accumulate whichThe State has no limit on the number of sick days an employee can accumulate, which is in line with the Public Sector (69%), while only 24% of the General Market has no maximum. The most prevalent maximum in the General Market is 60 days or lessThe State provides immediate eligibility as does 78% of the Public Sector Market, while
25© 2013 Hay Group. All rights reserved
The State provides immediate eligibility as does 78% of the Public Sector Market, while 54% of the General Market provides immediate eligibility
M k t C titi Di bilit B fitMarket Competitiveness – Disability Benefits
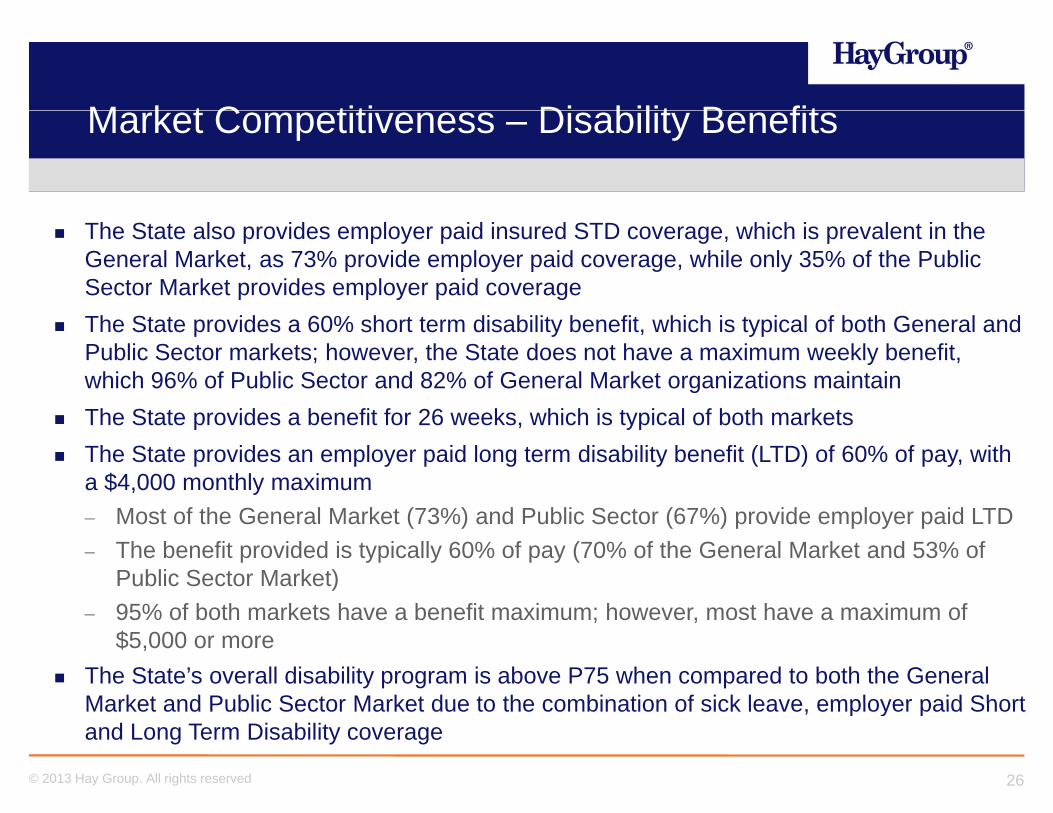
The State also provides employer paid insured STD coverage, which is prevalent in the General Market, as 73% provide employer paid coverage, while only 35% of the Public Sector Market provides employer paid coverageThe State provides a 60% short term disability benefit, which is typical of both General and Public Sector markets; however, the State does not have a maximum weekly benefit, which 96% of Public Sector and 82% of General Market organizations maintainThe State provides a benefit for 26 weeks, which is typical of both marketsThe State provides an employer paid long term disability benefit (LTD) of 60% of pay, with a $4,000 monthly maximum− Most of the General Market (73%) and Public Sector (67%) provide employer paid LTD− The benefit provided is typically 60% of pay (70% of the General Market and 53% of
Public Sector Market) 95% f b th k t h b fit i h t h i f− 95% of both markets have a benefit maximum; however, most have a maximum of $5,000 or more
The State’s overall disability program is above P75 when compared to both the General Market and Public Sector Market due to the combination of sick leave employer paid Short
26© 2013 Hay Group. All rights reserved
Market and Public Sector Market due to the combination of sick leave, employer paid Short and Long Term Disability coverage
Market Competitiveness –Oth B fit & H lid /V tiOther Benefits & Holiday/Vacation
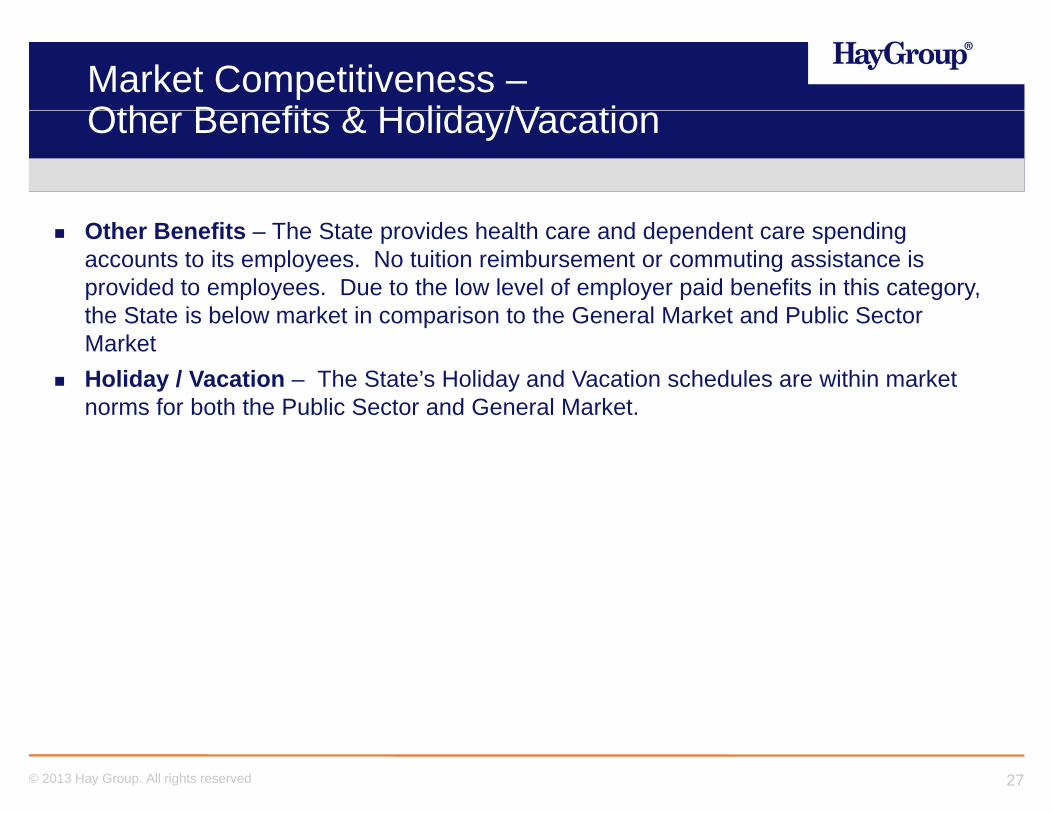
Other Benefits – The State provides health care and dependent care spending accounts to its employees. No tuition reimbursement or commuting assistance is provided to employees. Due to the low level of employer paid benefits in this category, th St t i b l k t i i t th G l M k t d P bli S tthe State is below market in comparison to the General Market and Public Sector MarketHoliday / Vacation – The State’s Holiday and Vacation schedules are within market norms for both the Public Sector and General Marketnorms for both the Public Sector and General Market.
27© 2013 Hay Group. All rights reserved

M k t C titi L l C id tiMarket Competitiveness – Local Considerations
Although Ada County and Boise City are not included in the Public Sector Market group, Hay Group reviewed their benefit programs in order to provide a high level comparison to the State’s programs. Retirement – The County and Boise both participate in PERSI, so the retirement benefit is the same; however, the County also makes a 3% matching contribution to a 457 plan, which enhances its total retirement plan value relative to the State H lth C Th C t i l l d i t h i b t hi hHealth Care – The County requires lower plan design cost sharing, but higher
premium contributions than the State. The City provides a fixed contribution to employees depending on their coverage tier, to purchase medical, dental, vision and other coverage. The State compares favorably with both the County and Cityother coverage. The State compares favorably with both the County and CityDisability – The County provides employer paid STD coverage, however, LTD coverage is employee paid. The City does not provide STD coverage, but provides a 40% LTD benefit that is employer paid. The State’s program is more competitive than the County and CityDeath – The City provides a flat dollar benefit of $10,000, which is below the State’s benefit level, while the County provides a 1 times salary benefit up to $50,000, which is
li d t th St t ’ b fit
28© 2013 Hay Group. All rights reserved
aligned to the State’s benefit
Summary of Salary Market C titiCompetitiveness

M k t C titi S lMarket Competitiveness – Salary
To determine the current competitiveness of the State’s salaries :The State average pay was compared to survey average
The following survey sources were compiled and provided to Hay GroupThe following survey sources were compiled and provided to Hay Group by the State:
Private Sector: Western Management Group (January 2012)Milli H lth S (J 2012)Milliman Health Survey (January 2012)Milliman Management Professional Survey (May 2012)Milliman IT Survey (July 2012)
Public Sector: NCASG – 8 Western States (July 2012) All data are effective or projected to July 2012 based on a 2.5% annual salary trend that combines both public and private sector salary data and is based on the following:− The World at Work 2012 Salary Budget Survey reports Median 2012 salary increase
budget of 2.0% for Public Administration and 3.0% for All Industries (private sector)− Hay Group’s General Industry survey (primarily private sector) reports 3.0% for 2012
t l l b d t i
30© 2013 Hay Group. All rights reserved
actual salary budget increases.

M k t C titi S lMarket Competitiveness – Salary
Based on the market data sources used for this analysis, the findings are as follows:
Average actual pay for State employees (not weighted by incumbent) isAverage actual pay for State employees (not weighted by incumbent) is approximately 29% below the private sector market averageThe State’s policy is 20% below the private sector market averageAverage actual pay for State employees is approximately 10% below the public sector market averageThe State’s policy is 2% above the public sector market averageThese results are based on Hay Group’s analysis of external survey data provided and compiled by the State of Idaho
31© 2013 Hay Group. All rights reserved
M k t C titi S lMarket Competitiveness – Salary
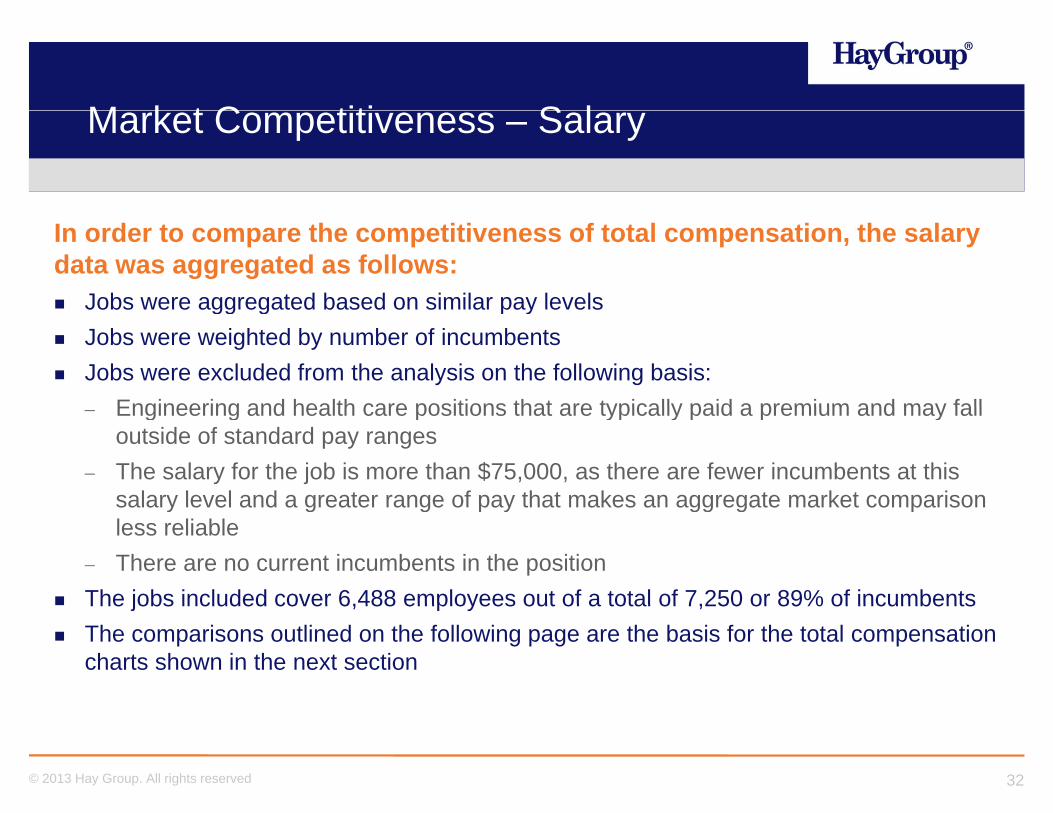
In order to compare the competitiveness of total compensation, the salary data was aggregated as follows:
Jobs were aggregated based on similar pay levelsJobs were aggregated based on similar pay levelsJobs were weighted by number of incumbentsJobs were excluded from the analysis on the following basis:
Engineering and health care positions that are typically paid a premium and may fall− Engineering and health care positions that are typically paid a premium and may fall outside of standard pay ranges
− The salary for the job is more than $75,000, as there are fewer incumbents at this salary level and a greater range of pay that makes an aggregate market comparisonsalary level and a greater range of pay that makes an aggregate market comparison less reliable
− There are no current incumbents in the positionThe jobs included cover 6,488 employees out of a total of 7,250 or 89% of incumbentsThe jobs included cover 6,488 employees out of a total of 7,250 or 89% of incumbents The comparisons outlined on the following page are the basis for the total compensation charts shown in the next section
32© 2013 Hay Group. All rights reserved

M k t C titi S lMarket Competitiveness – Salary
Pay level increments for total compensation comparison
Weighted Weighted
Idaho Employees PrivateIdahoWeighted
Public
Pay Level Increments # %Weighted
Salary Idaho % DiffWeighted
Salary Idaho % Diff$19,000 - $29,000 1720 26.5% $25,491 $29,327 ‐13% $30,312 -16%$29,001 - $34,000 1734 26.7% $30,638 $38,693 ‐21% $39,947 -23%$34 001 $46 000 1644 25 3% $38 801 $54 252 28% $43 341 10%
Weighted Salary
$34,001 - $46,000 1644 25.3% $38,801 $54,252 ‐28% $43,341 -10%$46,001 - $56,000 1011 15.6% $49,712 $67,310 ‐26% $55,429 -10%$56,001 - $66,000 295 4.5% $60,102 $79,528 ‐24% $56,335 7%$66,001 - $75,000 84 1.3% $71,221 $94,943 ‐25% $71,445 0%
33© 2013 Hay Group. All rights reserved

Market Competitiveness – Total C tiCompensation

M k t C titi T t l C tiMarket Competitiveness – Total Compensation
The State’s total compensation program is below market average when compared to both the Private Sector and Public Sector Markets. Below are key findings regarding specific aspects of the State’s compensation program:
Cash compensation for State employees lags the Private Sector by an average ofCash compensation for State employees lags the Private Sector by an average of 29%. The State generally trails their counterparts in other States by an average of 10%Benefits are at or above the market average of both markets for all employeesBenefits are at or above the market average of both markets for all employees driven by strong retirement and health care programsTotal Compensation is below the market average in the Private and Public Sector Markets, as the higher benefits program value does not offset the low cash , g p gcompensation. Pay Mix for State employees varies against the market depending on salary. Note: Only those components of pay provided by the State are included in total y p p y p ycompensation. It is common in the private sector to pay annual incentives, which if included would make the State less competitive relative to the Private Sector Market
35© 2013 Hay Group. All rights reserved
M k t C titi T t l C ti
Salary Increment ($19,000 ‐ $29,000) Idaho Actual PayMix
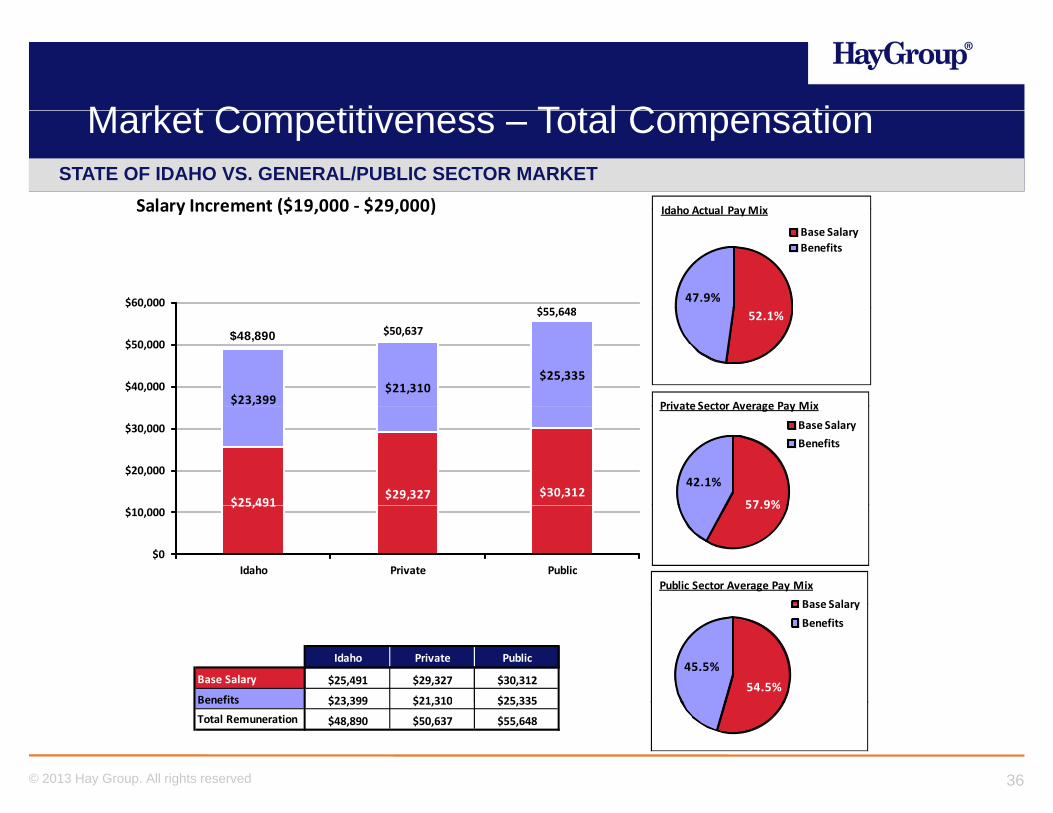
Market Competitiveness – Total Compensation STATE OF IDAHO VS. GENERAL/PUBLIC SECTOR MARKET
Salary Increment ($19,000 $29,000)
$60,000$55 648
47.9%
Idaho Actual Pay Mix
Base SalaryBenefits
$23,399$21,310
$25,335$40,000
$50,000$50,637
$55,648 52.1%
Private Sector Average Pay Mix
$48,890
$25,491 $29,327 $30,312
$20,000
$30,000
57 9%
42.1%
Private Sector Average Pay Mix
Base SalaryBenefits
$25,491
$0
$10,000
Idaho Private Public
57.9%
Public Sector Average Pay MixBase Salary
Idaho Private Public
Base Salary $25,491 $29,327 $30,312
Benefits $23,399 $21,310 $25,33554.5%
45.5%
Base SalaryBenefits
36© 2013 Hay Group. All rights reserved
Benefits $23,399 $21,310 $25,335Total Remuneration $48,890 $50,637 $55,648
M k t C titi T t l C ti
Salary Increment ($29,001 ‐ $34,000) Idaho Actual PayMix
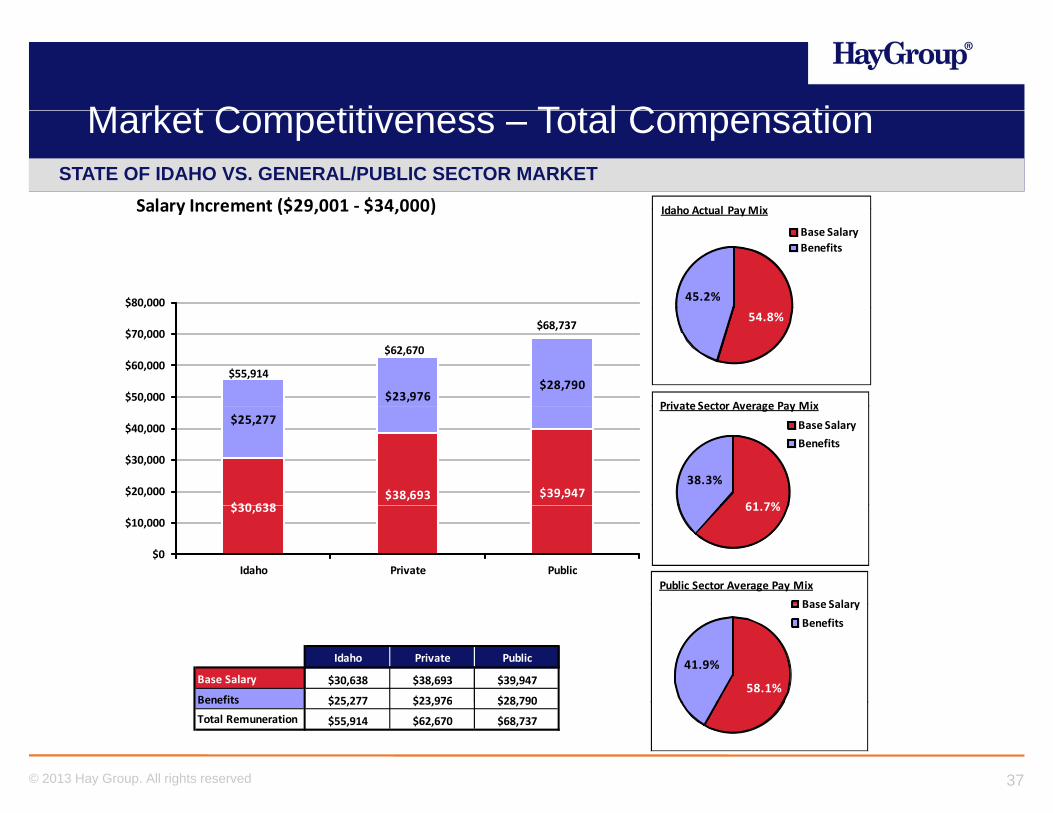
Market Competitiveness – Total Compensation STATE OF IDAHO VS. GENERAL/PUBLIC SECTOR MARKET
Salary Increment ($29,001 $34,000)
$80,000 45.2%
Idaho Actual Pay Mix
Base SalaryBenefits
$23,976$28,790
$50,000
$60,000
$70,000$62,670
$68,73754.8%
Private Sector Average Pay Mix
$55,914
$30 638$38,693 $39,947
$25,277
$20,000
$30,000
$40,000
61 7%
38.3%
Private Sector Average Pay Mix
Base SalaryBenefits
$30,638
$0
$10,000
Idaho Private Public
61.7%
Public Sector Average Pay MixBase Salary
Idaho Private Public
Base Salary $30,638 $38,693 $39,947
Benefits $25,277 $23,976 $28,79058.1%
41.9%
Base SalaryBenefits
37© 2013 Hay Group. All rights reserved
Benefits $25,277 $23,976 $28,790Total Remuneration $55,914 $62,670 $68,737

M k t C titi T t l C ti
Salary Increment ($34,001 ‐ $46,000) Idaho Actual PayMix
Market Competitiveness – Total Compensation STATE OF IDAHO VS. GENERAL/PUBLIC SECTOR MARKET
Salary Increment ($34,001 $46,000)
$90,00042.1%
Idaho Actual Pay Mix
Base SalaryBenefits
$28 251
$28,482
$30,021$60,000
$70,000
$80,000$82,734
$73,362
57.9%
Private Sector Average Pay Mix
$67,052
$38,801
$54,252$43,341
$28,251
$20,000
$30,000
$40,000
$50,000
65 6%
34.4%
Private Sector Average Pay Mix
Base SalaryBenefits
$38,801
$0
$10,000
Idaho Private Public
65.6%
Public Sector Average Pay MixBase Salary
Idaho Private Public
Base Salary $38,801 $54,252 $43,341
Benefits $28,251 $28,482 $30,02159.1%
40.9%
Base SalaryBenefits
38© 2013 Hay Group. All rights reserved
Benefits $28,251 $28,482 $30,021Total Remuneration $67,052 $82,734 $73,362

M k t C titi T t l C ti
Salary Increment ($46,001 ‐ $56,000) Idaho Actual PayMix
Market Competitiveness – Total Compensation STATE OF IDAHO VS. GENERAL/PUBLIC SECTOR MARKET
Salary Increment ($46,001 $56,000)
$120,00039.3%
Idaho Actual Pay Mix
Base SalaryBenefits
$32,370
$34,479$80,000
$100,000 $99,681
$89,908
60.7%
Private Sector Average Pay Mix
$81,957
$49 712$67,310
$55,429
$32,245$34,479
$40,000
$60,000
67 5%
32.5%
Private Sector Average Pay Mix
Base SalaryBenefits
$49,712
$0
$20,000
Idaho Private Public
67.5%
Public Sector Average Pay MixBase Salary
Idaho Private Public
Base Salary $49,712 $67,310 $55,429
Benefits $32,245 $32,370 $34,47961.7%
38.3%
Base SalaryBenefits
39© 2013 Hay Group. All rights reserved
Benefits $32,245 $32,370 $34,479Total Remuneration $81,957 $99,681 $89,908

M k t C titi T t l C ti
Salary Increment ($56,001 ‐ $66,000) Idaho Actual PayMix
Market Competitiveness – Total Compensation STATE OF IDAHO VS. GENERAL/PUBLIC SECTOR MARKET
Salary Increment ($56,001 $66,000)
$140,00037.5%
Idaho Actual Pay Mix
Base SalaryBenefits
$36,522
$80 000
$100,000
$120,000 $116,051
$91,155
62.5%
Private Sector Average Pay Mix
$96,149
$60,102$79,528
$56 335
$36,047 $34,820
$40,000
$60,000
$80,000
68 5%
31.5%
Private Sector Average Pay Mix
Base SalaryBenefits
$60,102 $56,335
$0
$20,000
Idaho Private Public
68.5%
Public Sector Average Pay MixBase Salary
Idaho Private Public
Base Salary $60,102 $79,528 $56,335
Benefits $36,047 $36,522 $34,82061.8%
38.2%
Base SalaryBenefits
40© 2013 Hay Group. All rights reserved
Benefits $36,047 $36,522 $34,820Total Remuneration $96,149 $116,051 $91,155
M k t C titi T t l C ti
Salary Increment ($66,001 ‐ $75,000) Idaho Actual PayMix
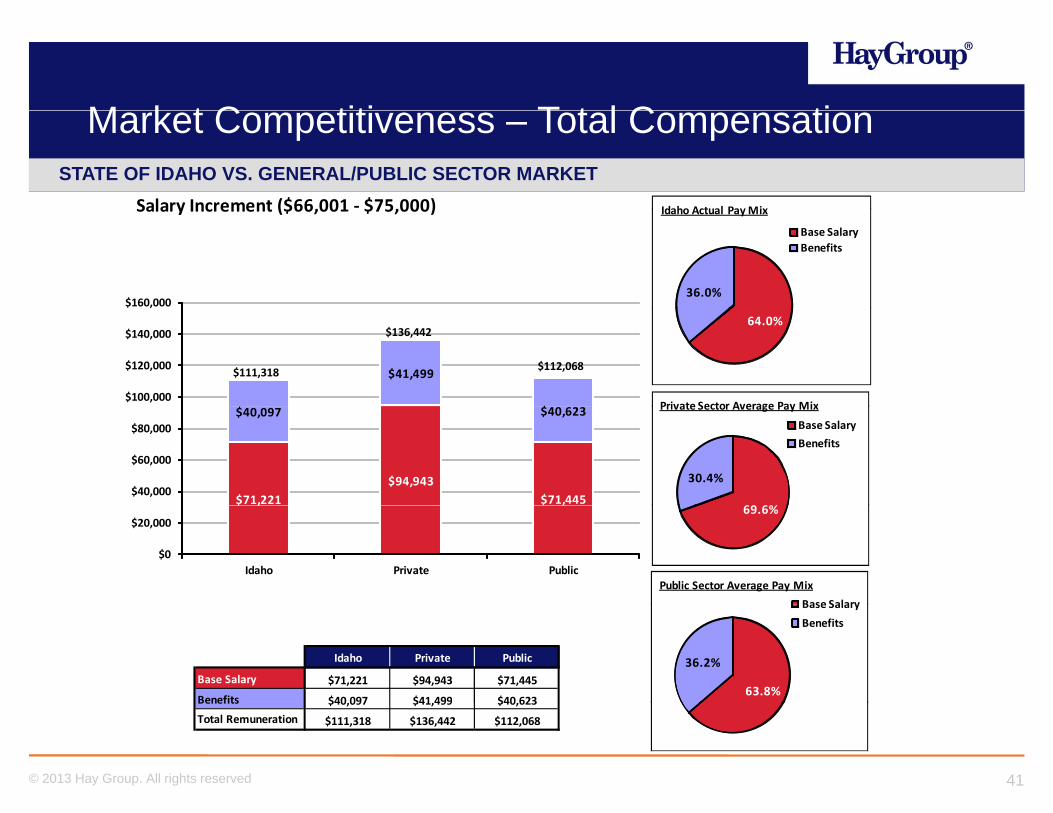
Market Competitiveness – Total Compensation STATE OF IDAHO VS. GENERAL/PUBLIC SECTOR MARKET
Salary Increment ($66,001 $75,000)
$160,00036.0%
Idaho Actual Pay Mix
Base SalaryBenefits
$
$41,499
$$100,000
$120,000
$140,000 $136,442
$112,068
64.0%
Private Sector Average Pay Mix
$111,318
$71,221$94,943
$71,445
$40,097 $40,623
$40,000
$60,000
$80,000
69 6%
30.4%
Private Sector Average Pay Mix
Base SalaryBenefits
$ , ,
$0
$20,000
Idaho Private Public
69.6%
Public Sector Average Pay MixBase Salary
Idaho Private Public
Base Salary $71,221 $94,943 $71,445
Benefits $40,097 $41,499 $40,62363.8%
36.2%
Base SalaryBenefits
41© 2013 Hay Group. All rights reserved
Benefits $40,097 $41,499 $40,623Total Remuneration $111,318 $136,442 $112,068
A diAppendices
B fit V l ti M th d lBenefits Valuation Methodology

Methodology:C t D t b d M k t L lComparator Database and Market Level
Marketplace data references for this report were drawn from the Hay Group Benefits Database. The comparator organizations valued by the Hay Methodology in this report include general market organizations contained in Hay Group’s current database plus select Public Sector organizations in the West excluding California Refer to Appendix
The selected comparator organizations’ benefit programs are ranked according
select Public Sector organizations in the West, excluding California. Refer to Appendix B for comparator group information.
HIGHEST VALUE COMPANYbenefit programs are ranked according to the following percentile measures:
− 75% (P75) is a “high-end” measure
75th Percentile (P75)
Median (P50) % ( ) g− 25% (P25) is a “low-end” measure− Median (P50) is a mid-market
measure
( )
25th Percentile (P25)
measureLOWEST VALUE COMPANY
44© 2013 Hay Group. All rights reserved

Methodology:H B fit V l ti M th d lHay Benefit Valuation Methodology
Hay Group utilizes a proprietary actuarial valuation methodology to evaluate benefit plans in terms of the cash equivalence of the benefits. In establishing a program’s overall market competitiveness the Hay Benefit Valuation model uses “standard cost assumptions”, instead of a company’s specific costs, which eliminates the impact of such cost variables as demographics, geography, funding method, or purchasing power, etc.Th tili ti f “ t d d t ti ” id ifThe utilization of “standard or common cost assumptions” provides a uniform quantitative evaluation method which produces values based solely on the level of the benefit provided.The valuation model places a relative value on each specific feature of a benefitThe valuation model places a relative value on each specific feature of a benefit program. The value for each plan is then compiled to produce an overall program value appropriate for market comparison. In general, the more generous a particular feature is the higher the relative value.
45© 2013 Hay Group. All rights reserved
Methodology:H B fit V l ti M th d lHay Benefit Valuation Methodology
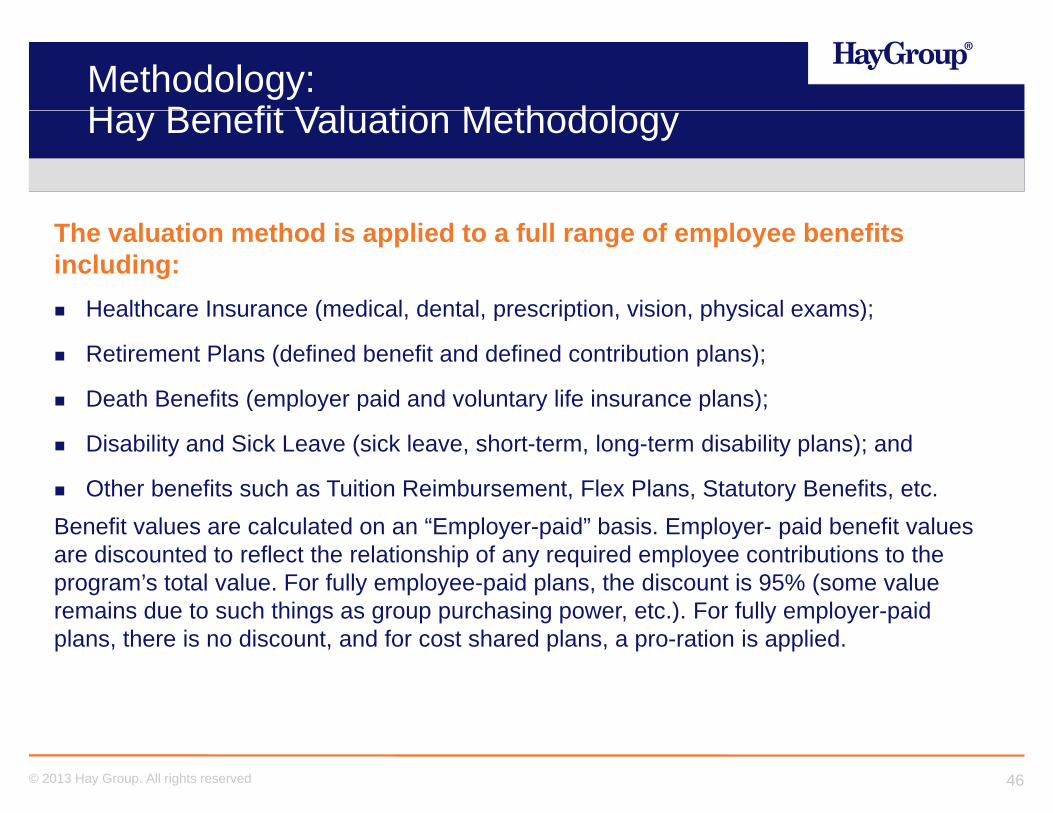
The valuation method is applied to a full range of employee benefits including:
Healthcare Insurance (medical dental prescription vision physical exams);Healthcare Insurance (medical, dental, prescription, vision, physical exams);
Retirement Plans (defined benefit and defined contribution plans);
Death Benefits (employer paid and voluntary life insurance plans);ea e e s (e p oye pa d a d o u a y e su a ce p a s);
Disability and Sick Leave (sick leave, short-term, long-term disability plans); and
Other benefits such as Tuition Reimbursement, Flex Plans, Statutory Benefits, etc.Benefit values are calculated on an “Employer-paid” basis. Employer- paid benefit values are discounted to reflect the relationship of any required employee contributions to the program’s total value. For fully employee-paid plans, the discount is 95% (some value
i d t h thi h i t ) F f ll l idremains due to such things as group purchasing power, etc.). For fully employer-paid plans, there is no discount, and for cost shared plans, a pro-ration is applied.
46© 2013 Hay Group. All rights reserved

Methodology:I t l E itInternal Equity
Internal equity is the inter-relationship between reward opportunities within an organization. Many benefit plans (death benefits, disability, retirement, etc.) have features or benefit levels that are related to salary. Internal equity is achieved in a b fit h th l ti hi b t th b fit l l d th lbenefit program when the relationships between the benefit level and the employee salary are consistent within each employee population (Note: While benefit program differences can often be found between employee classes, most organizations provide consistent policies within a class).consistent policies within a class). Organizations that wish to achieve internal equity within a benefit plan typically establish benefit levels that are based on uniform salary multiples (i.e. death benefits of one times salary or disability income replacement level of 60% of salary).In order to observe the internal equity of an employee benefits program, benefit values are typically illustrated at several salary levels. For this review of benefits, values are shown for salaries from $20,000 to $200,000.
47© 2013 Hay Group. All rights reserved

B fit P ti i t Li tBenefits Participant Lists

G l M k t O i ti ID NV UT WAGeneral Market Organizations – ID, NV, UT, WA
7-ElevenAbercrombie & FitchAce HardwareAES
Baker PetroliteBASFBattelle Energy AllianceBig-D Construction
CF IndustriesChampion TechnologiesCharlotte RusseCheesecake FactoryAES
AgriumAir Liquide AmericaAkzo Nobel
Big-D ConstructionBoston MarketBridgestone AmericasBuffets
Cheesecake FactoryCHI - St. Joseph's Health SystemChico's
Alexander & BaldwinAmazon.comAmerican Eagle OutfittersAndersons, The
Build A Bear WorkshopBurger KingCargillCarson Tahoe Regional
Children's Place, TheChipotle Mexican GrillChiquita Brands InternationalCNH Global,
Anheuser-Busch InBev --Anheuser-BuschAptalis PharmaAsante Health System
gHealthcareCarter'sCaterpillarCatholic Health Initiatives
CoachCoca-ColaColdwater CreekCollective BrandsAsante Health System
Ascension HealthAshlandASML
Catholic Health InitiativesCatholic Healthcare WestCBRL Group -- Cracker Barrel Country Store
Collective BrandsColvin EngineeringConAgra FoodsCoventry Health Care
49© 2013 Hay Group. All rights reserved
AutoZoneBacardi Limited -- Bacardi
CEC EntertainmentCentene
CUNA Mutual Group
G l M k t O i ti ID NV UT WAGeneral Market Organizations – ID, NV, UT, WA
CVSCytec IndustriesDaiichi SankyoDarden Restaurants
FC Organizational ProductsFerrero USAFired Up -- Johnny Carino's Italian
HCA Healthcare -- Wesley Medical CenterHealth NetHeineken USADarden Restaurants
Day & ZimmermannDeereDepartment of Veterans Affairs
ItalianFM GlobalFMCFossil
Heineken USAHelzberg DiamondsHershey FoodsHilti -- US
DiasorinDick's Sporting GoodsDomino's PizzaDow Chemical
Foster's Group -- Foster's Wine Estates AmericasFuller (H.B.)Galderma Laboratories
Home DepotHot TopicHuntsmanICL
Dunkin' BrandsDyno NobelEinstein Noah Restaurant Group
Georgia GulfGolden CorralGraceway PharmaceuticalsGruma Corporation Mission
Ingersoll-RandIntermountain HealthcareINVISTAIowa Farm Bureau FederationGroup
El Pollo LocoEvonik DegussaExpress
Gruma Corporation -- Mission FoodsHallmark CardsHard Rock Café
Iowa Farm Bureau FederationJack in the BoxjcpenneyJoe's Crab Shack
50© 2013 Hay Group. All rights reserved
Express ScriptsFBL Financial Group
HCA - Mountain Division Johnny RocketsJoy Global
G l M k t O i ti ID NV UT WAGeneral Market Organizations – ID, NV, UT, WA
Kaiser Foundation Health PlanKansas City Life InsuranceKohl'sLANXESS
Momentive Specialty ChemicalsMoogMorton's Restaurant Group
Consumer ElectronicsPhillips-Van HeusenPier 1 ImportsPioneer Hi-Bred InternationalLANXESS
Lehigh Hanson -- Building Materials AmericaLimited Brands
Morton s Restaurant GroupMultiCare Health SystemNewark InOneNoodles & Company
Pioneer Hi-Bred InternationalPRA InternationalPraxairPremera Blue Cross
Limited StoresLivingston InternationalLonzaLVMH Moet Hennessy Louis
NordstromNPC -- Pizza HutOffice DepotOfficeMax
PremierQuestarRalph LaurenReal Mex Restaurantsy
Vuitton -- Moet HennessyMacDermidMargaritavilleMatthews International
P.F. Chang's China BistroPanera BreadPapa John's InternationalPatina Restaurant Group
Recreational EquipmentRestaurants UnlimitedRGA ReinsuranceRhodiaMatthews International
McDonald'sMellor EngineeringMerit Energy
Patina Restaurant GroupPenske Truck LeasingPerkins Restaurant & BakeryPernod Ricard SA -- Pernod
RhodiaRitchie Bros. AuctioneersRock Bottom RestaurantsRuby Tuesday
51© 2013 Hay Group. All rights reserved
Mitsubishi International Ricard USAPhilips Electronics -- Phillips
Ruth's Chris Steak House
G l M k t O i ti ID NV UT WAGeneral Market Organizations – ID, NV, UT, WA
SABIC Innovative PlasticsSafewaySanofi-AventisSazerac
Takeda Pharmaceuticals North AmericaTargetTexas RoadhouseSazerac
Scripps HealthSearsSecurian
Texas RoadhouseTJXToys R UsTronox
ShopkoSkyy SpiritsSolvay America -- Solvay North America
Tween BrandsUnited WaterUnitedHealth GroupVoith - Voith Hydro
Southwest GasSouthwest Washington Medical CenterStage Stores
yWendy's / Arby's Group --Arby'sWilliam Grant & SonsWilliams CompaniesStage Stores
StaplesSUPERVALUTaco John's International
Williams CompaniesWorkers Compensation FundWorld VisionYum!
52© 2013 Hay Group. All rights reserved
Zep
P bli S t O i ti W tPublic Sector Organizations – West
Campbell County School District #1City of Bountiful, UTCity of Colorado Springs, COCity of Denver CO
County of Klickitat, WACounty of Laramie, WYCounty of Pierce, WACounty of Snohomish WACity of Denver, CO
City of Gillette, WYCity of Jackson, WYCity of Las Vegas, NV
County of Snohomish, WACounty of Whitman, WADavis County PersonnelFederal Government
City of Ogden City, UTCity of Pasco, WACity of Portland, ORCity of Renton, WA
Fremont County School District #21Granite School DistrictJordan Valley Water Conservancy DistrictLaramie County Community Collegey ,
City of Rock Springs, WYCity of Salt Lake, UTCity of Seattle, WACity of Seattle WA Seattle Public Utilities
y y gMaricopa County Community College DistrictMontana State FundNatrona County School DistrictNew Mexico State UniversityCity of Seattle, WA - Seattle Public Utilities
City of Tucson, AZColorado PERACounty of Franklin, WA
New Mexico State UniversityPlatte River Power AuthorityPort of Portland, ORSalt Lake County Human Resources
53© 2013 Hay Group. All rights reserved
County of King, WACounty of Kittitas, WA
Sierra Southwest Co-Op Services

P bli S t O i ti W tPublic Sector Organizations – West
State of ArizonaState of ColoradoState of MontanaState of NevadaState of NevadaState of New MexicoState of OregonState of UtahState of WashingtonState of WyomingUnified Police Department of Greater Salt LakeUniversity of UtahyUniversity of WyomingUtah County GovernmentUtah Retirement SystemsUtah System of Higher EducationUtah System of Higher EducationUtah Valley UniversityWeber State UniversityWestern Wyoming Community College
54© 2013 Hay Group. All rights reserved
Benefit Value Comparison Charts –G l M k tGeneral Market
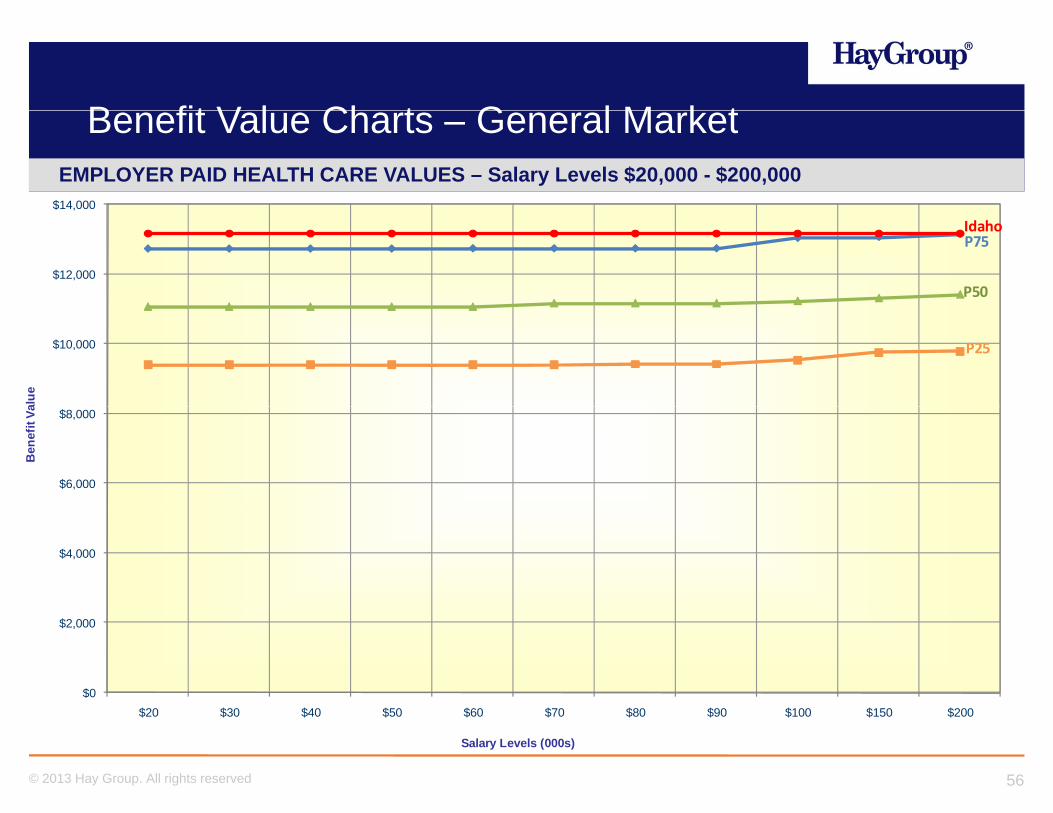
B fit V l Ch t G l M k tBenefit Value Charts – General MarketEMPLOYER PAID HEALTH CARE VALUES – Salary Levels $20,000 - $200,000
$14,000
$12,000
$ ,
P50
P75Idaho
$10,000
alue
P25
$6,000
$8,000
Ben
efit
Va
$4,000
$0
$2,000
56© 2013 Hay Group. All rights reserved
$20 $30 $40 $50 $60 $70 $80 $90 $100 $150 $200
Salary Levels (000s)
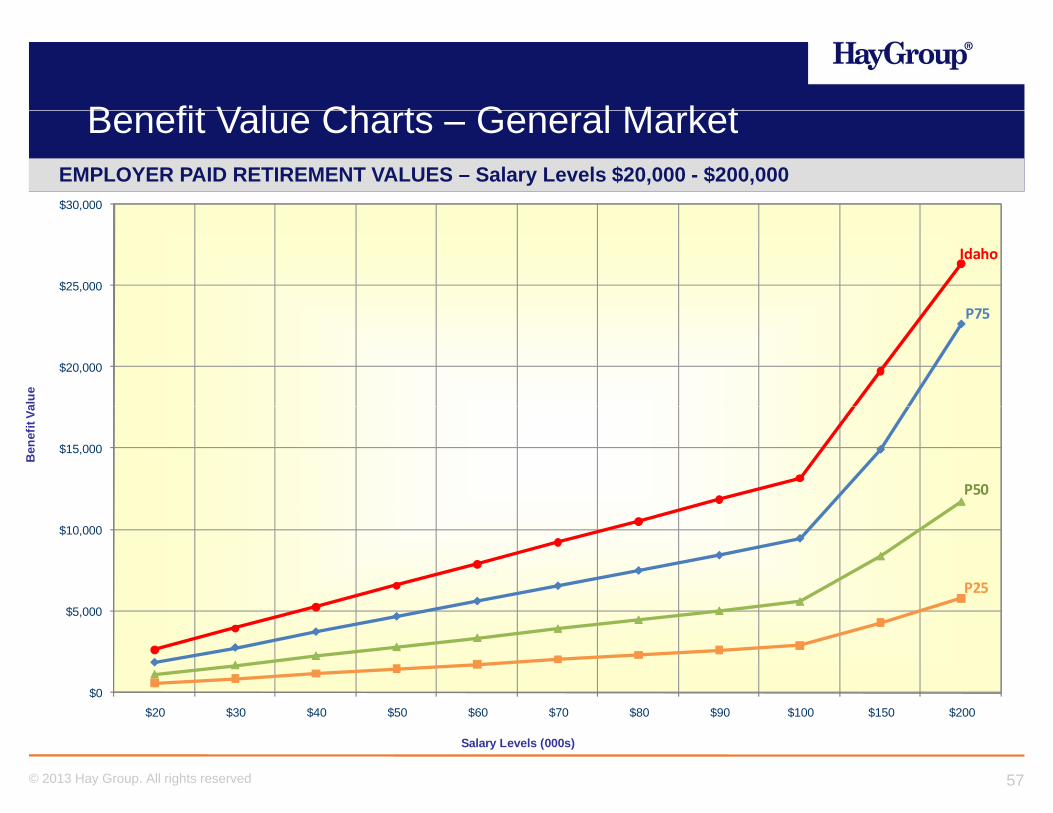
B fit V l Ch t G l M k tBenefit Value Charts – General MarketEMPLOYER PAID RETIREMENT VALUES – Salary Levels $20,000 - $200,000$30,000
$25,000
$ ,
Idaho
$20,000
alue
P75
$15,000
Ben
efit
Va
P50
$10,000
P25
$0
$5,000
57© 2013 Hay Group. All rights reserved
$20 $30 $40 $50 $60 $70 $80 $90 $100 $150 $200
Salary Levels (000s)

B fit V l Ch t G l M k tBenefit Value Charts – General MarketEMPLOYER PAID DEATH BENEFIT VALUES – Salary Levels $20,000 - $200,000$1,400
$1,200
$ ,
P75
$1,000
alue
P50
$600
$800
Ben
efit
Va
Idaho
P25
$400
$0
$200
58© 2013 Hay Group. All rights reserved
$20 $30 $40 $50 $60 $70 $80 $90 $100 $150 $200
Salary Levels (000s)

B fit V l Ch t G l M k tBenefit Value Charts – General MarketEMPLOYER PAID DISABILITY VALUES – Salary Levels $20,000 - $200,000
$12,000
$10,000
$ ,
Idaho
$8,000
alue P50
P75
$6,000
Ben
efit
Va
P50
P25
$4,000
$0
$2,000
59© 2013 Hay Group. All rights reserved
$20 $30 $40 $50 $60 $70 $80 $90 $100 $150 $200
Salary Levels (000s)
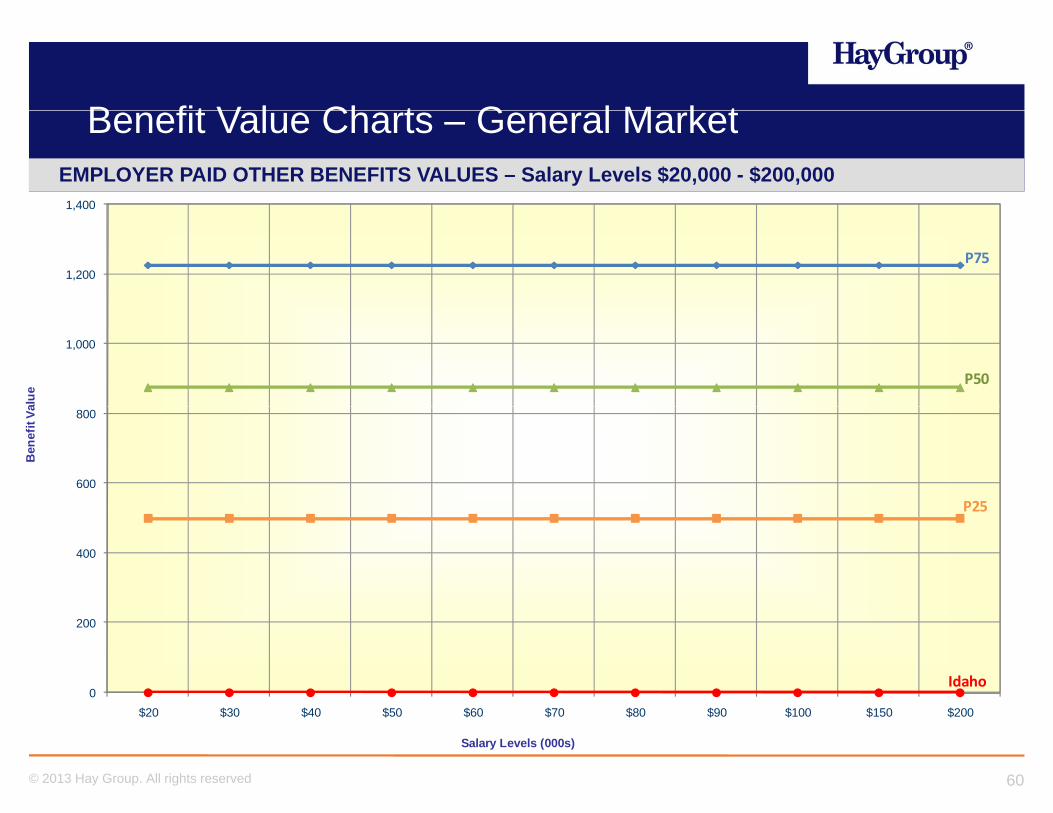
B fit V l Ch t G l M k tBenefit Value Charts – General MarketEMPLOYER PAID OTHER BENEFITS VALUES – Salary Levels $20,000 - $200,000
1,400
1,200
,
P75
1,000
alue
P50
600
800
Ben
efit
Va
P25
400
P25
0
200
Idaho
60© 2013 Hay Group. All rights reserved
$20 $30 $40 $50 $60 $70 $80 $90 $100 $150 $200
Salary Levels (000s)

Benefit Value Comparison Charts –W t P bli S t O i tiWestern Public Sector Organizations
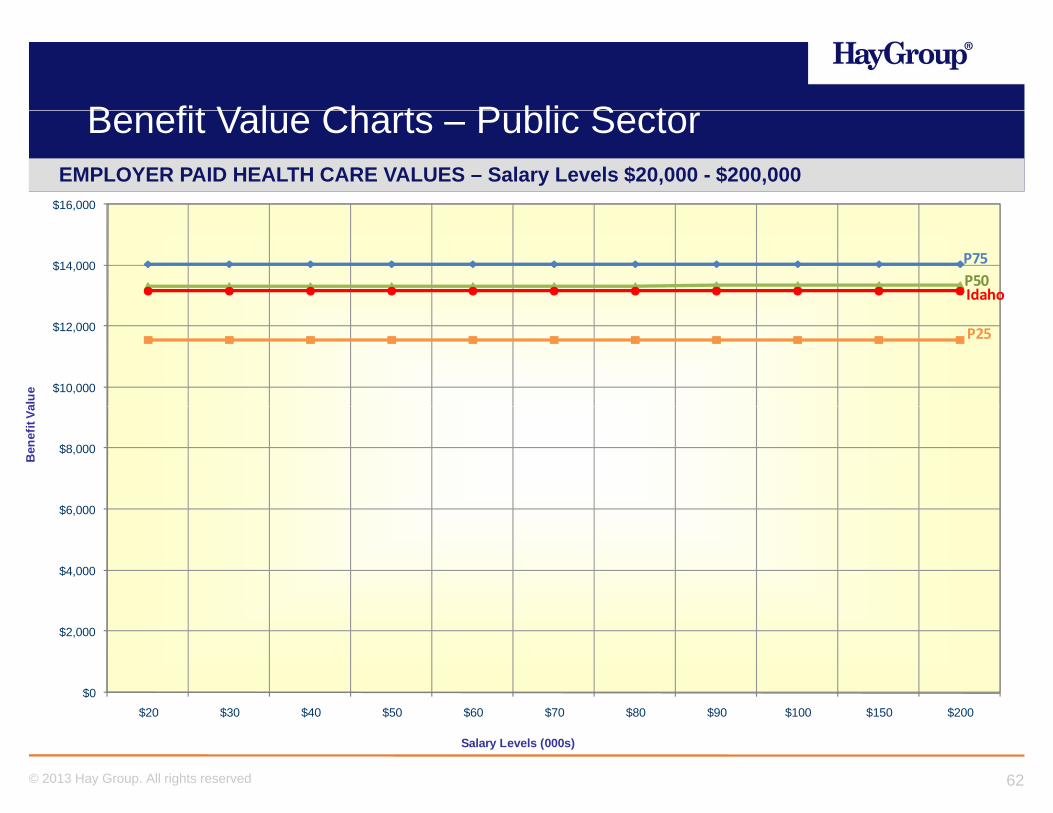
B fit V l Ch t P bli S tBenefit Value Charts – Public SectorEMPLOYER PAID HEALTH CARE VALUES – Salary Levels $20,000 - $200,000
$16,000
$14,000
$ ,
P50P75
Idaho
$10,000
$12,000
alue
P25
$6 000
$8,000
Ben
efit
Va
$4,000
$6,000
$0
$2,000
62© 2013 Hay Group. All rights reserved
$20 $30 $40 $50 $60 $70 $80 $90 $100 $150 $200
Salary Levels (000s)
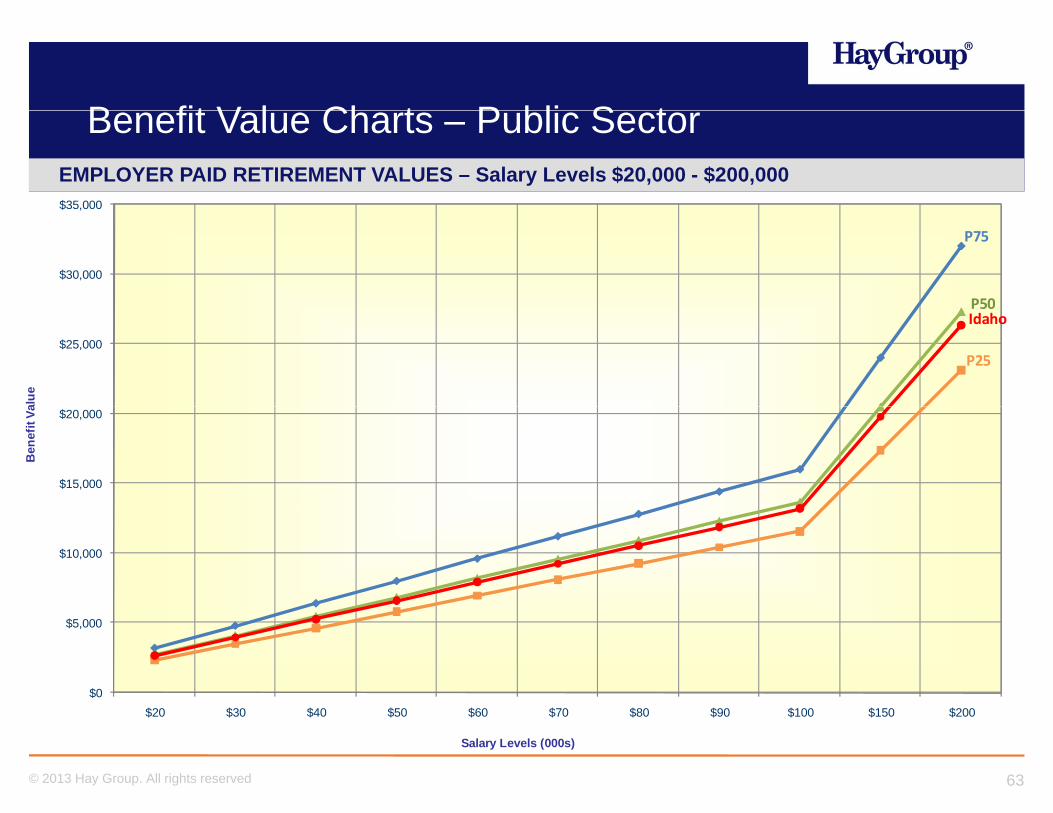
B fit V l Ch t P bli S tEMPLOYER PAID RETIREMENT VALUES – Salary Levels $20,000 - $200,000
Benefit Value Charts – Public Sector
$35,000
$30,000
$ ,
P50
P75
$25,000
alue
P50Idaho
P25
$15,000
$20,000
Ben
efit
Va
$10,000
$0
$5,000
63© 2013 Hay Group. All rights reserved
$20 $30 $40 $50 $60 $70 $80 $90 $100 $150 $200
Salary Levels (000s)

B fit V l Ch t P bli S tEMPLOYER PAID DEATH BENEFIT VALUES – Salary Levels $20,000 - $200,000
Benefit Value Charts – Public Sector
$800
$700
$
P75
$500
$600
alue
Idaho
$300
$400
Ben
efit
Va
P50
$200
$300
P25
$0
$100
64© 2013 Hay Group. All rights reserved
$20 $30 $40 $50 $60 $70 $80 $90 $100 $150 $200
Salary Levels (000s)
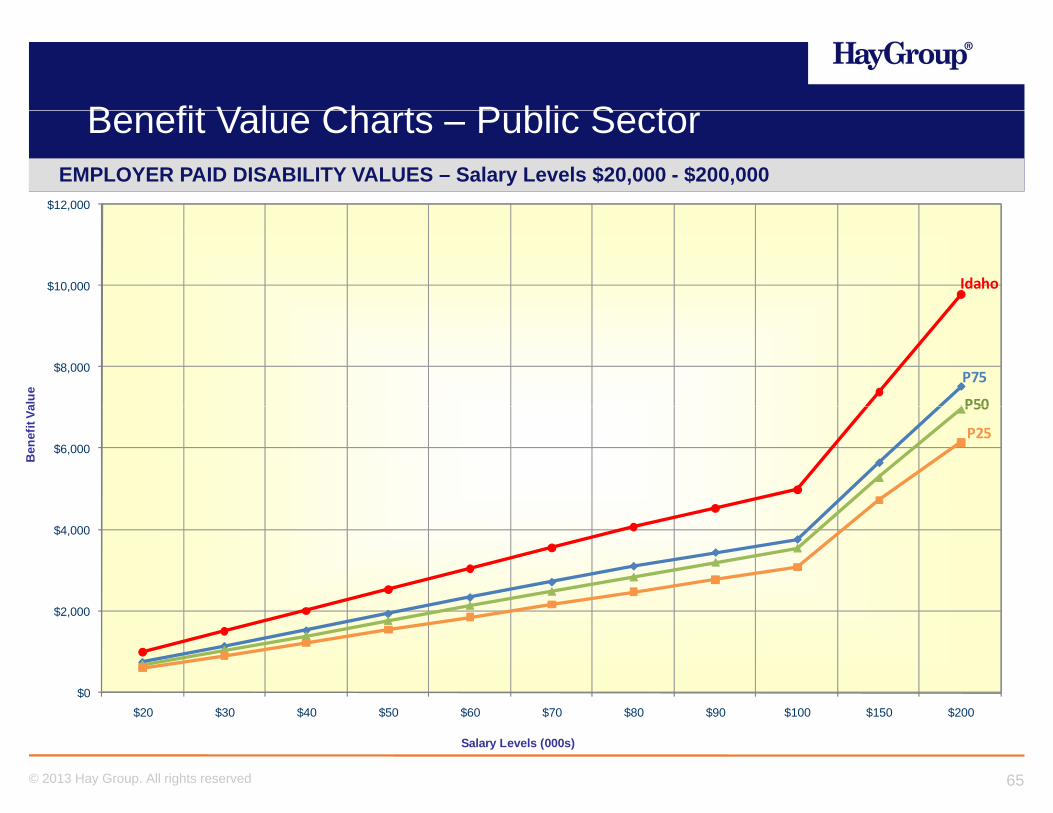
B fit V l Ch t P bli S tEMPLOYER PAID DISABILITY VALUES – Salary Levels $20,000 - $200,000
Benefit Value Charts – Public Sector
$12,000
$10,000
$ ,
Idaho
$8,000
alue P50
P75
$6,000
Ben
efit
Va
P50
P25
$4,000
$0
$2,000
65© 2013 Hay Group. All rights reserved
$20 $30 $40 $50 $60 $70 $80 $90 $100 $150 $200
Salary Levels (000s)

B fit V l Ch t P bli S tEMPLOYER PAID OTHER BENEFITS VALUES – Salary Levels $20,000 - $200,000
Benefit Value Charts – Public Sector
900
800P75
600
700
alue
400
500
Ben
efit
Va
P50
200
300 P25
0
100
Idaho
66© 2013 Hay Group. All rights reserved
$20 $30 $40 $50 $60 $70 $80 $90 $100 $150 $200
Salary Levels (000s)
Benefits Prevalence of Practice R tReport
Appendix E
SUMMARY
Western Public Sector Organizations General Market Organizations State of Idaho
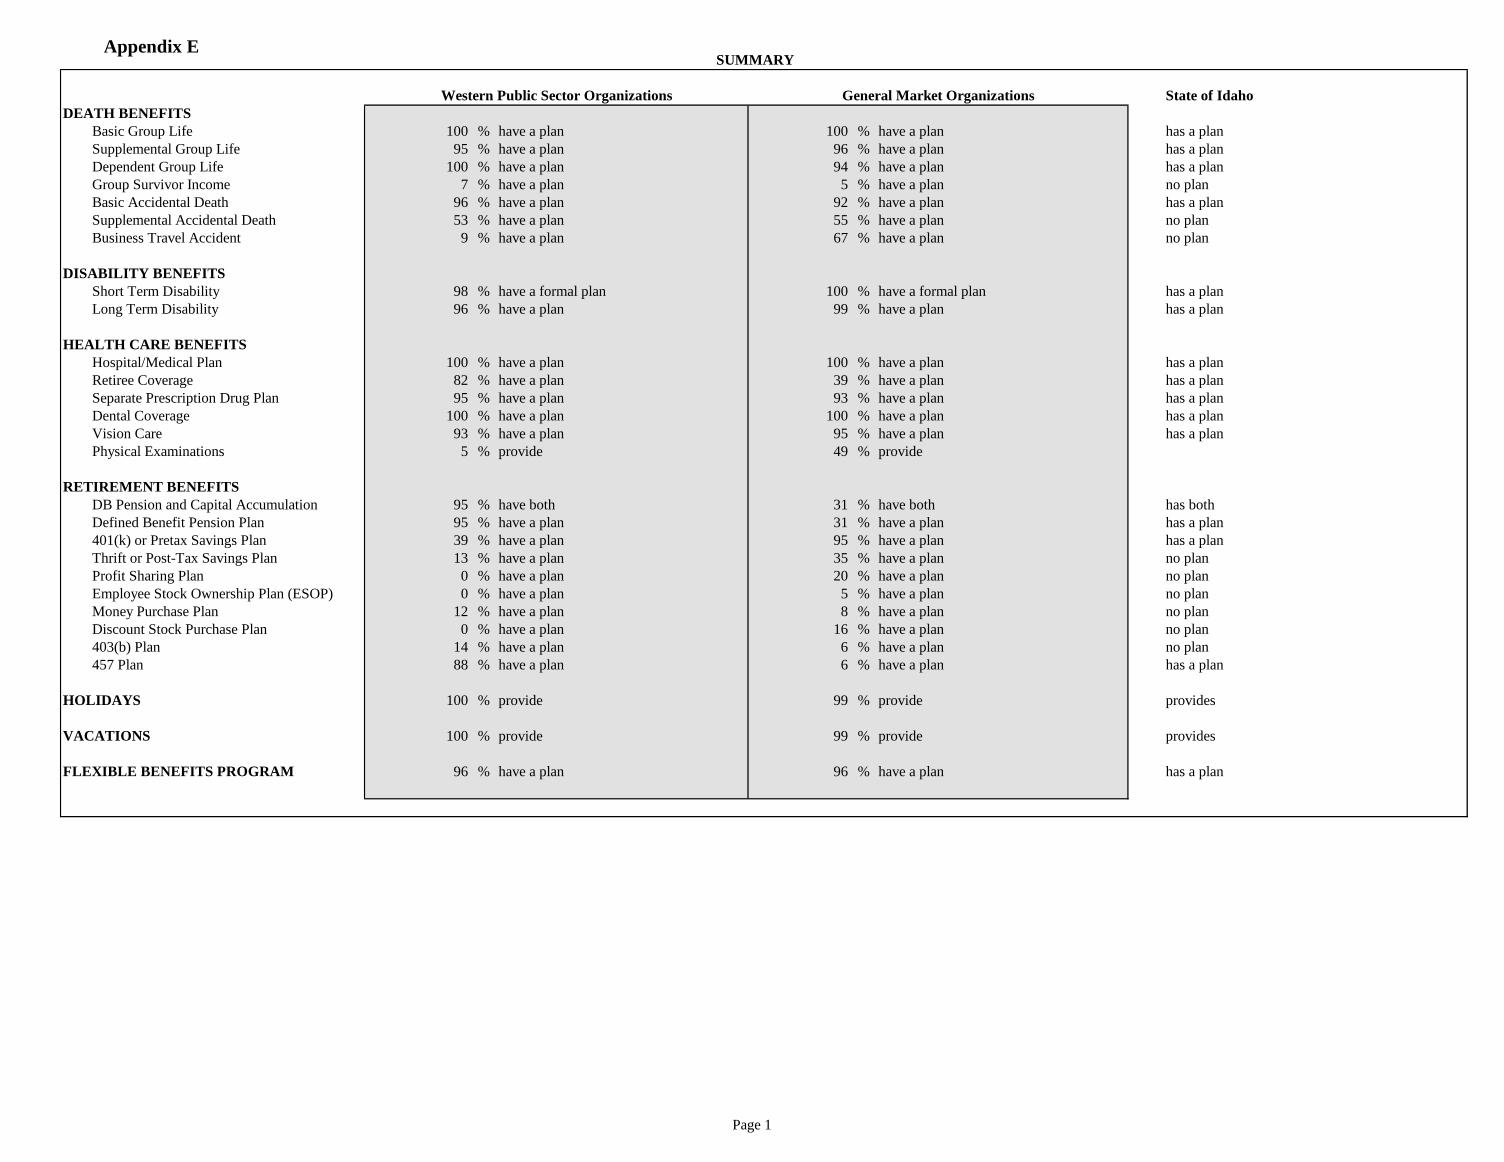
DEATH BENEFITS
Basic Group Life 100 % have a plan 100 % have a plan has a plan
Supplemental Group Life 95 % have a plan 96 % have a plan has a plan
Dependent Group Life 100 % have a plan 94 % have a plan has a plan
Group Survivor Income 7 % have a plan 5 % have a plan no plan
Basic Accidental Death 96 % have a plan 92 % have a plan has a plan
Supplemental Accidental Death 53 % have a plan 55 % have a plan no plan
Business Travel Accident 9 % have a plan 67 % have a plan no plan
DISABILITY BENEFITS
Short Term Disability 98 % have a formal plan 100 % have a formal plan has a plan
Long Term Disability 96 % have a plan 99 % have a plan has a plan
HEALTH CARE BENEFITS
Hospital/Medical Plan 100 % have a plan 100 % have a plan has a plan
Retiree Coverage 82 % have a plan 39 % have a plan has a plan
Separate Prescription Drug Plan 95 % have a plan 93 % have a plan has a plan
Dental Coverage 100 % have a plan 100 % have a plan has a plan
Vision Care 93 % have a plan 95 % have a plan has a plan
Physical Examinations 5 % provide 49 % provide
RETIREMENT BENEFITS
DB Pension and Capital Accumulation 95 % have both 31 % have both has both
Defined Benefit Pension Plan 95 % have a plan 31 % have a plan has a plan
401(k) or Pretax Savings Plan 39 % have a plan 95 % have a plan has a plan
Thrift or Post-Tax Savings Plan 13 % have a plan 35 % have a plan no plan
Profit Sharing Plan 0 % have a plan 20 % have a plan no plan
Employee Stock Ownership Plan (ESOP) 0 % have a plan 5 % have a plan no plan
Money Purchase Plan 12 % have a plan 8 % have a plan no plan
Discount Stock Purchase Plan 0 % have a plan 16 % have a plan no plan
403(b) Plan 14 % have a plan 6 % have a plan no plan
457 Plan 88 % have a plan 6 % have a plan has a plan
HOLIDAYS 100 % provide 99 % provide provides
VACATIONS 100 % provide 99 % provide provides
FLEXIBLE BENEFITS PROGRAM 96 % have a plan 96 % have a plan has a plan
Page 1
Appendix E PREVALENCE OF BENEFITS PRACTICES
DEATH BENEFITS
Western Public Sector Organizations General Market Organizations State of Idaho
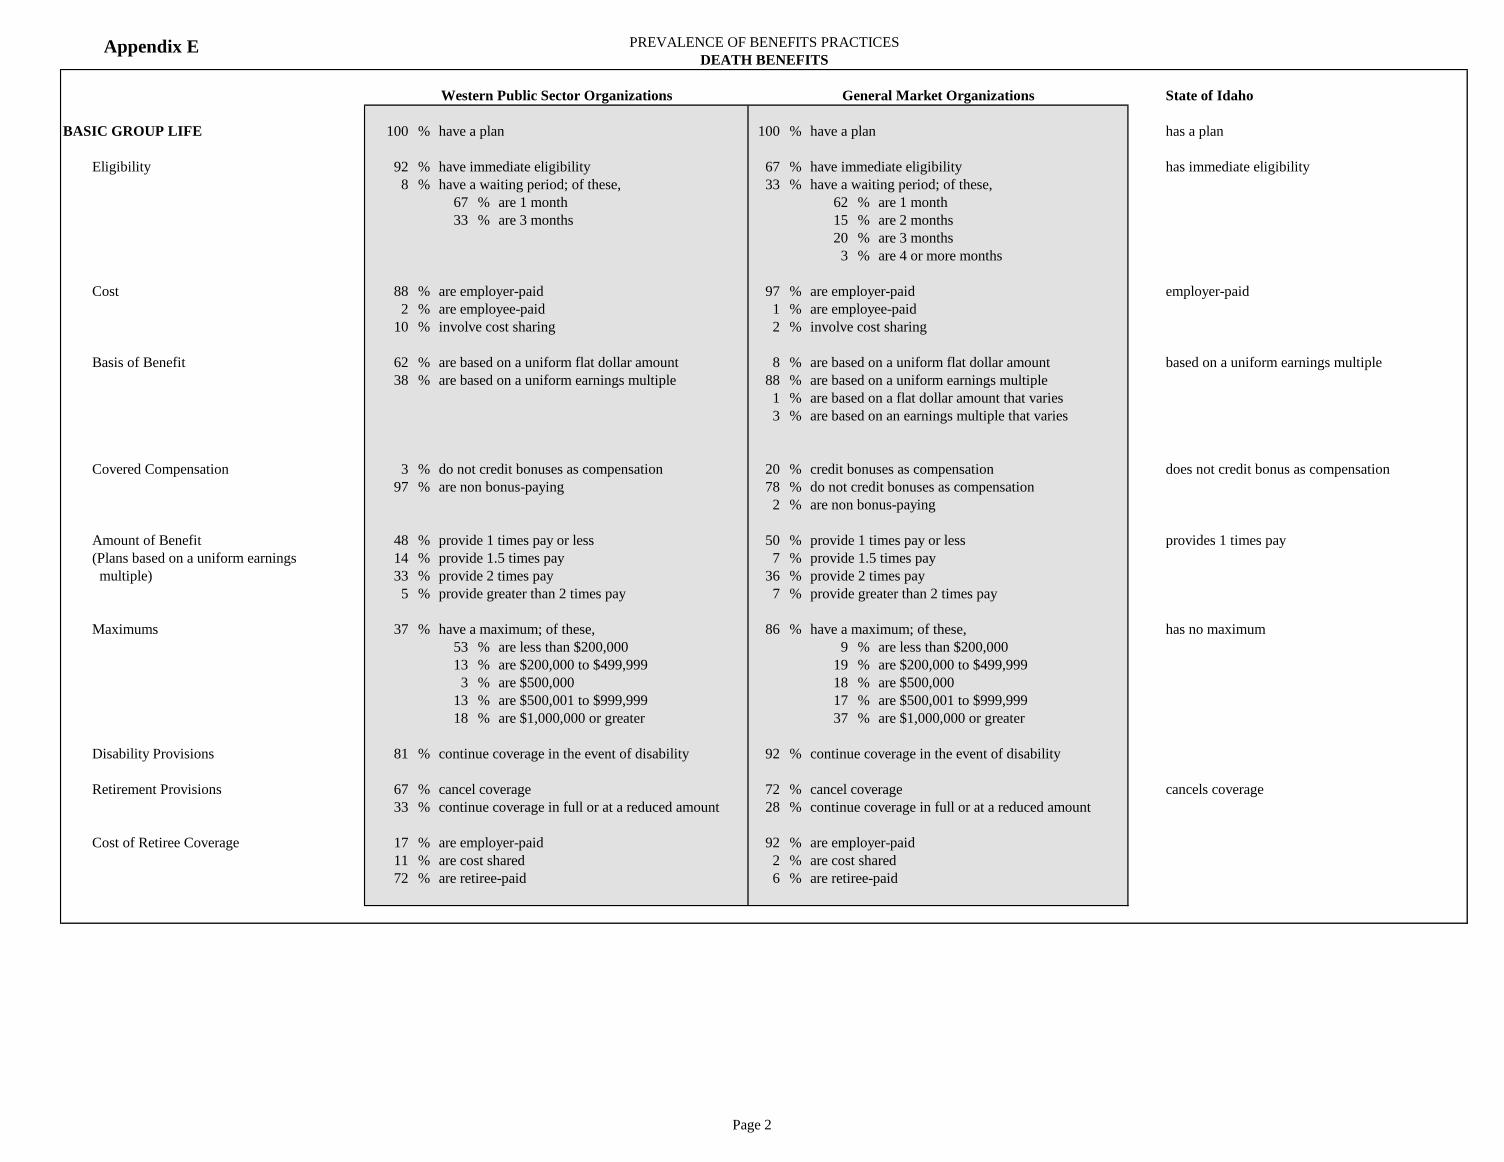
BASIC GROUP LIFE 100 % have a plan 100 % have a plan has a plan
Eligibility 92 % have immediate eligibility 67 % have immediate eligibility has immediate eligibility
8 % have a waiting period; of these, 33 % have a waiting period; of these,
67 % are 1 month 62 % are 1 month
33 % are 3 months 15 % are 2 months
20 % are 3 months
3 % are 4 or more months
Cost 88 % are employer-paid 97 % are employer-paid employer-paid
2 % are employee-paid 1 % are employee-paid
10 % involve cost sharing 2 % involve cost sharing
Basis of Benefit 62 % are based on a uniform flat dollar amount 8 % are based on a uniform flat dollar amount based on a uniform earnings multiple
38 % are based on a uniform earnings multiple 88 % are based on a uniform earnings multiple
1 % are based on a flat dollar amount that varies
3 % are based on an earnings multiple that varies
Covered Compensation 3 % do not credit bonuses as compensation 20 % credit bonuses as compensation does not credit bonus as compensation
97 % are non bonus-paying 78 % do not credit bonuses as compensation
2 % are non bonus-paying
Amount of Benefit 48 % provide 1 times pay or less 50 % provide 1 times pay or less provides 1 times pay
(Plans based on a uniform earnings 14 % provide 1.5 times pay 7 % provide 1.5 times pay
multiple) 33 % provide 2 times pay 36 % provide 2 times pay
5 % provide greater than 2 times pay 7 % provide greater than 2 times pay
Maximums 37 % have a maximum; of these, 86 % have a maximum; of these, has no maximum
53 % are less than $200,000 9 % are less than $200,000
13 % are $200,000 to $499,999 19 % are $200,000 to $499,999
3 % are $500,000 18 % are $500,000
13 % are $500,001 to $999,999 17 % are $500,001 to $999,999
18 % are $1,000,000 or greater 37 % are $1,000,000 or greater
Disability Provisions 81 % continue coverage in the event of disability 92 % continue coverage in the event of disability
Retirement Provisions 67 % cancel coverage 72 % cancel coverage cancels coverage
33 % continue coverage in full or at a reduced amount 28 % continue coverage in full or at a reduced amount
Cost of Retiree Coverage 17 % are employer-paid 92 % are employer-paid
11 % are cost shared 2 % are cost shared
72 % are retiree-paid 6 % are retiree-paid
Page 2
Appendix E PREVALENCE OF BENEFITS PRACTICES
DEATH BENEFITS
Western Public Sector Organizations General Market Organizations State of Idaho
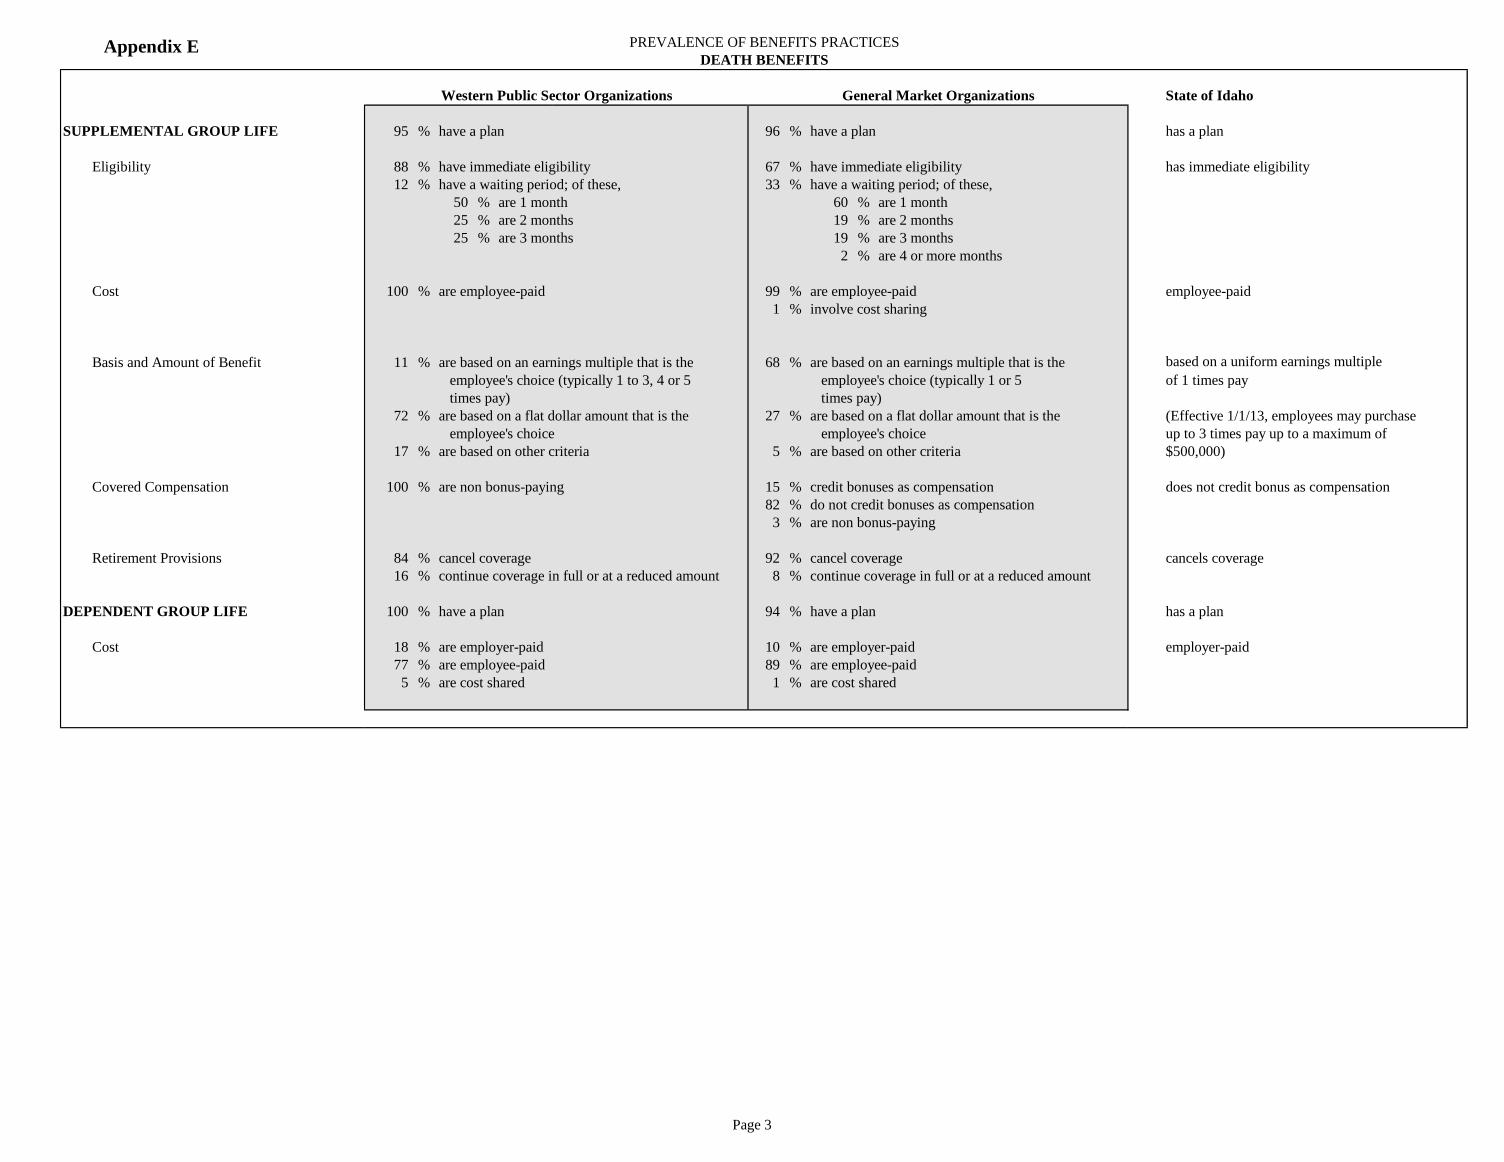
SUPPLEMENTAL GROUP LIFE 95 % have a plan 96 % have a plan has a plan
Eligibility 88 % have immediate eligibility 67 % have immediate eligibility has immediate eligibility
12 % have a waiting period; of these, 33 % have a waiting period; of these,
50 % are 1 month 60 % are 1 month
25 % are 2 months 19 % are 2 months
25 % are 3 months 19 % are 3 months
2 % are 4 or more months
Cost 100 % are employee-paid 99 % are employee-paid employee-paid
1 % involve cost sharing
Basis and Amount of Benefit 11 % are based on an earnings multiple that is the 68 % are based on an earnings multiple that is the based on a uniform earnings multiple
employee's choice (typically 1 to 3, 4 or 5 employee's choice (typically 1 or 5 of 1 times pay
times pay) times pay)
72 % are based on a flat dollar amount that is the 27 % are based on a flat dollar amount that is the (Effective 1/1/13, employees may purchase
employee's choice employee's choice up to 3 times pay up to a maximum of
17 % are based on other criteria 5 % are based on other criteria $500,000)
Covered Compensation 100 % are non bonus-paying 15 % credit bonuses as compensation does not credit bonus as compensation
82 % do not credit bonuses as compensation
3 % are non bonus-paying
Retirement Provisions 84 % cancel coverage 92 % cancel coverage cancels coverage
16 % continue coverage in full or at a reduced amount 8 % continue coverage in full or at a reduced amount
DEPENDENT GROUP LIFE 100 % have a plan 94 % have a plan has a plan
Cost 18 % are employer-paid 10 % are employer-paid employer-paid
77 % are employee-paid 89 % are employee-paid
5 % are cost shared 1 % are cost shared
Page 3
Appendix E PREVALENCE OF BENEFITS PRACTICES
DEATH BENEFITS
Western Public Sector Organizations General Market Organizations State of Idaho
DEPENDENT GROUP LIFE (Continued)
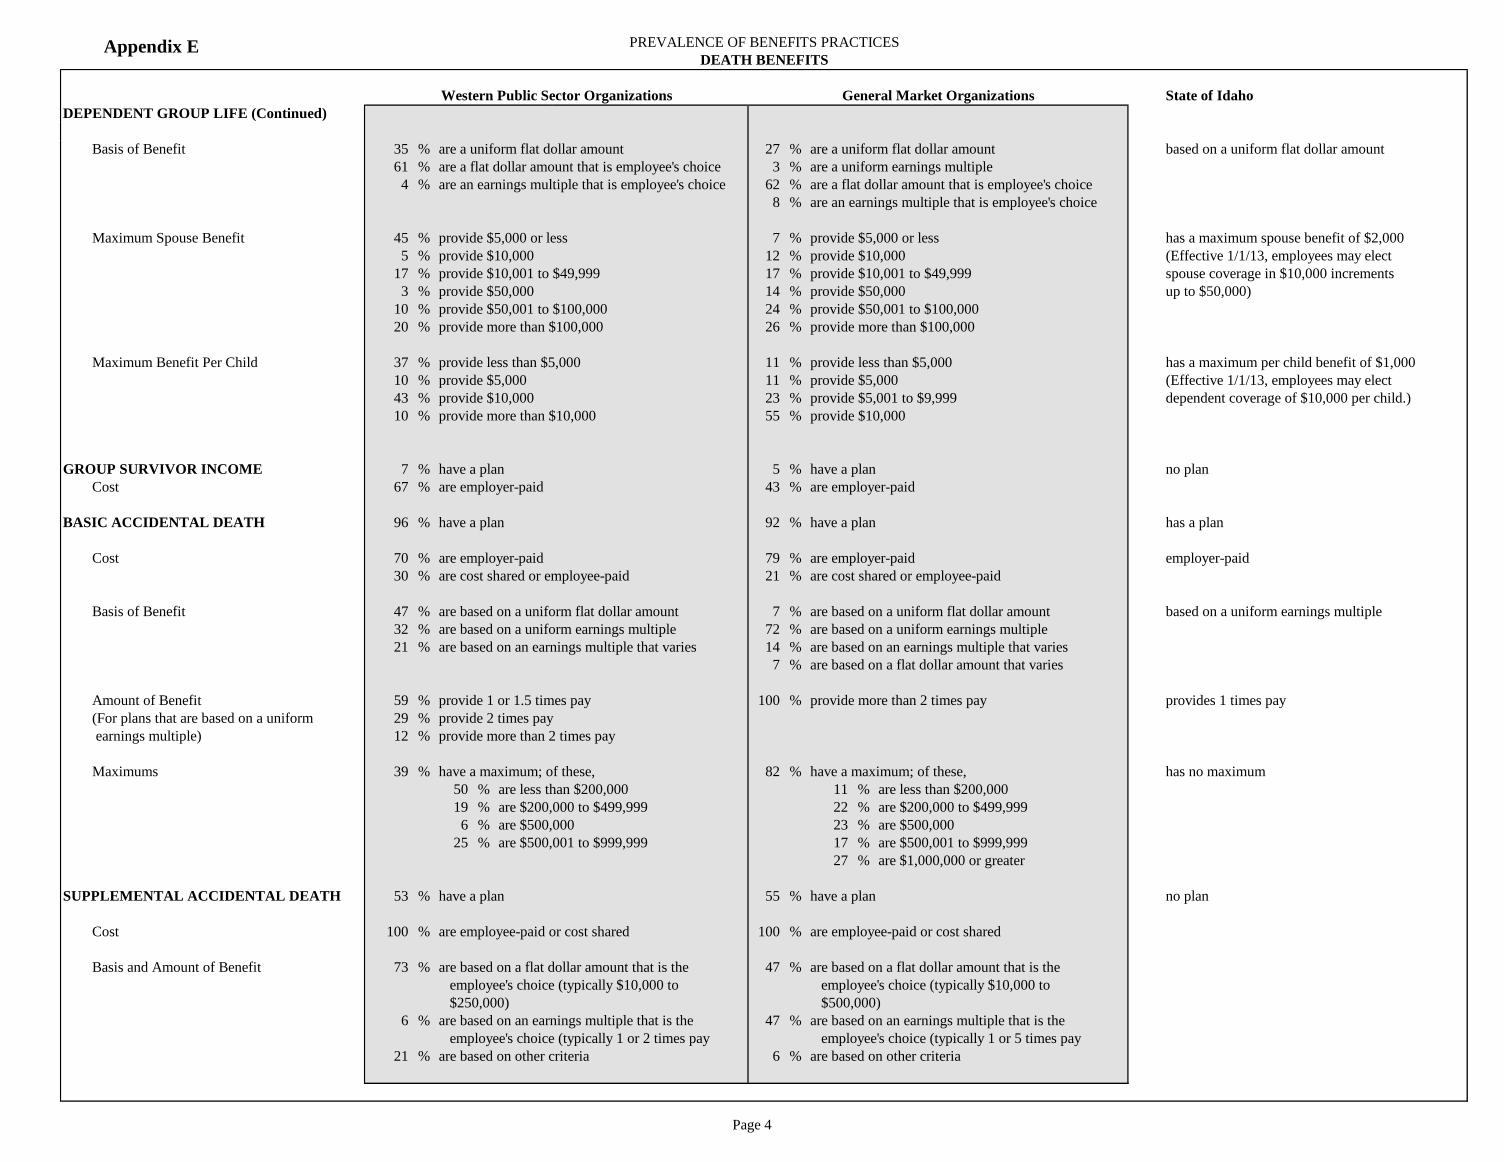
Basis of Benefit 35 % are a uniform flat dollar amount 27 % are a uniform flat dollar amount based on a uniform flat dollar amount
61 % are a flat dollar amount that is employee's choice 3 % are a uniform earnings multiple
4 % are an earnings multiple that is employee's choice 62 % are a flat dollar amount that is employee's choice
8 % are an earnings multiple that is employee's choice
Maximum Spouse Benefit 45 % provide $5,000 or less 7 % provide $5,000 or less has a maximum spouse benefit of $2,000
5 % provide $10,000 12 % provide $10,000 (Effective 1/1/13, employees may elect
17 % provide $10,001 to $49,999 17 % provide $10,001 to $49,999 spouse coverage in $10,000 increments
3 % provide $50,000 14 % provide $50,000 up to $50,000)
10 % provide $50,001 to $100,000 24 % provide $50,001 to $100,000
20 % provide more than $100,000 26 % provide more than $100,000
Maximum Benefit Per Child 37 % provide less than $5,000 11 % provide less than $5,000 has a maximum per child benefit of $1,000
10 % provide $5,000 11 % provide $5,000 (Effective 1/1/13, employees may elect
43 % provide $10,000 23 % provide $5,001 to $9,999 dependent coverage of $10,000 per child.)
10 % provide more than $10,000 55 % provide $10,000
GROUP SURVIVOR INCOME 7 % have a plan 5 % have a plan no plan
Cost 67 % are employer-paid 43 % are employer-paid
BASIC ACCIDENTAL DEATH 96 % have a plan 92 % have a plan has a plan
Cost 70 % are employer-paid 79 % are employer-paid employer-paid
30 % are cost shared or employee-paid 21 % are cost shared or employee-paid
Basis of Benefit 47 % are based on a uniform flat dollar amount 7 % are based on a uniform flat dollar amount based on a uniform earnings multiple
32 % are based on a uniform earnings multiple 72 % are based on a uniform earnings multiple
21 % are based on an earnings multiple that varies 14 % are based on an earnings multiple that varies
7 % are based on a flat dollar amount that varies
Amount of Benefit 59 % provide 1 or 1.5 times pay 100 % provide more than 2 times pay provides 1 times pay
(For plans that are based on a uniform 29 % provide 2 times pay
earnings multiple) 12 % provide more than 2 times pay
Maximums 39 % have a maximum; of these, 82 % have a maximum; of these, has no maximum
50 % are less than $200,000 11 % are less than $200,000
19 % are $200,000 to $499,999 22 % are $200,000 to $499,999
6 % are $500,000 23 % are $500,000
25 % are $500,001 to $999,999 17 % are $500,001 to $999,999
27 % are $1,000,000 or greater
SUPPLEMENTAL ACCIDENTAL DEATH 53 % have a plan 55 % have a plan no plan
Cost 100 % are employee-paid or cost shared 100 % are employee-paid or cost shared
Basis and Amount of Benefit 73 % are based on a flat dollar amount that is the 47 % are based on a flat dollar amount that is the
employee's choice (typically $10,000 to employee's choice (typically $10,000 to
$250,000) $500,000)
6 % are based on an earnings multiple that is the 47 % are based on an earnings multiple that is the
employee's choice (typically 1 or 2 times pay employee's choice (typically 1 or 5 times pay
21 % are based on other criteria 6 % are based on other criteria
Page 4

Appendix E PREVALENCE OF BENEFITS PRACTICES
DEATH BENEFITS
Western Public Sector Organizations General Market Organizations State of Idaho
BUSINESS TRAVEL ACCIDENT 9 % have a plan 67 % have a plan no plan
Cost 100 % are employer-paid 99 % are employer-paid
1 % are employee-paid or cost shared
Basis and Amount of Benefit 50 % are based on a uniform flat dollar amount 26 % are based on a uniform flat dollar amount
(typically $100,000 or greater) (typically $250,000 or greater)
50 % are based on a uniform earnings multiple 58 % are based on a uniform earnings multiple
(typically 3, 4, or 5 times pay) (typically 3 or 5 times pay)
16 % are based on other criteria
LIFE INSURANCE COMBINATIONS 5 % provide Basic and Dependent Group Life 2 % provide Basic Group Life only provides Basic, Supplemental, and
88 % provide Basic, Supplemental, and Dependent 6 % provide Basic and Supplemental Group Life Dependent Group Life
Group Life 1 % provide Basic Group Life and Survivor Income
7 % provide other combinations 2 % provide Basic and Dependent Group Life
86 % provide Basic, Supplemental, and Dependent
Group Life
3 % provide other combinations
EXECUTIVE GROUP LIFE 12 % have a plan 36 % have a plan no plan
Cost 100 % are employer-paid 86 % are employer-paid
4 % are employee-paid
10 % are cost shared
Coordination of Coverage 25 % offer Executive Group Life in lieu of the Basic 36 % offer Executive Group Life in lieu of the Basic
Group Life plan Group Life plan
25 % offer Executive Group Life in lieu of all 4 % offer Executive Group Life in lieu of the
other coverages Supplemental Group Life plan
50 % offer Executive Group Life in addition to all other 5 % offer Executive Group Life in lieu of all
life coverages other coverages
55 % offer Executive Group Life in addition to all other
life coverages
Basis and Amount of Benefit 67 % are based on a uniform flat dollar amount 17 % are based on a uniform flat dollar amount
33 % are based on a uniform earnings multiple 69 % are based on a uniform earnings multiple
(typically 2 times pay) (typically 2 times pay)
3 % are based on an earnings multiple that varies
11 % are based on a flat dollar amount that varies
Covered Compensation 50 % do not credit bonuses as compensation 18 % credit bonuses as compensation
50 % are non bonus-paying 80 % do not credit bonuses as compensation
2 % are non bonus-paying
Retirement Provisions 100 % cancel coverage 74 % cancel coverage
14 % continue coverage in full
12 % continue coverage at a reduced amount
Page 5

Appendix E PREVALENCE OF BENEFITS PRACTICES
DISABILITY BENEFITS
Western Public Sector Organizations General Market Organizations State of Idaho
SHORT TERM DISABILITY 98 % have a formal plan 100 % have a formal plan has a plan
(Sick Leave)
55 % are salary continuance plans only 54 % are salary continuance plans only combination of salary continuance and insured
45 % are a combination 3 % are insured STD plans only STD plans
43 % are a combination
Eligibility 78 % have immediate eligibility 54 % have immediate eligibility has immediate eligibility
22 % have a waiting period; of these, 46 % have a waiting period; of these,
33 % are 1 month 25 % are 1 month
17 % are 3 months 5 % are 2 months
50 % are 4 months or more 38 % are 3 months
32 % are 4 months or more
Salary Continuance Plans 78 % are based on an accumulation of days 16 % are based on an accumulation of days based on an accumulation of days
(may include PTO days) 18 % are based on a uniform benefit 25 % are based on a service schedule
4 % are based on a combination 54 % are based on a uniform benefit
5 % are based on a combination
Uniform Benefit 73 % provide less than 2 weeks full pay 53 % provide less than 2 weeks full pay
18 % provide 2 to 5 weeks full pay 15 % provide 2 to 5 weeks full pay
9 % provide 6 to 12 weeks full pay 14 % provide 6 to 12 weeks full pay
10 % provide 13 weeks full pay
6 % provide 26 weeks full pay
2 % provide more than 26 weeks full pay
Accumulation of Days 2 % provide 6 days or fewer per year 54 % provide 6 days or fewer per year accumulates 12 days per year
9 % provide 10 to 11 days per year 17 % provide 7 to 9 days per year
61 % provide 12 days per year 14 % provide 10 to 11 days per year
28 % provide more than 12 days per year 6 % provide 12 days per year
9 % provide more than 12 days per year
31 % have a maximum; of these, 76 % have a maximum; of these, with no maximum
15 % allow a maximum of fewer than 60 days 62 % allow a maximum of fewer than 60 days
15 % allow a maximum of 60 to 99 days 15 % allow a maximum of 60 to 99 days
70 % allow a maximum of 100 or more days 23 % allow a maximum of 100 or more days
69 % have no maximum 24 % have no maximum
Service Schedule 100 % provide a max of up to 13 wks full pay 37 % provide a max of up to 13 wks full pay
9 % provide a max of 13.1 to 25.9 wks full pay
50 % provide a max of 26 wks full pay
4 % provide a max of more than 26 wks full pay
Page 6

Appendix E PREVALENCE OF BENEFITS PRACTICES
DISABILITY BENEFITS
Western Public Sector Organizations General Market Organizations State of Idaho
SHORT TERM DISABILITY (Continued)
Insured STD Plans
Basis of Plan 100 % are private plans or supplements to 12 % are statutory plans whose provisions are not provides private or supplemental plan
statutory plans included below
88 % are private plans or supplements to
statutory plans
Cost 35 % are employer-paid 73 % are employer-paid employer-paid
4 % are cost shared 5 % are cost shared
61 % are employee-paid 22 % are employee-paid
Amount of Benefit 57 % are based on a uniform 60% to 65% of earnings 11 % are based on a uniform 59% of earnings or less base of a uniform 60% of earnings
(for plans that are based on 39 % are based on a uniform 66% to 70% of earnings 45 % are based on a uniform 60% to 65% of earnings
uniform earnings percent) 4 % are based on a uniform 75% of earnings or more 28 % are based on a uniform 66% to 70% of earnings
16 % are based on a uniform 75% of earnings or more
Maximum Benefit 96 % have a weekly maximum; of these, 82 % have a weekly maximum; of these, has no maximum
18 % are less than $750 11 % are less than $750
9 % are $750 to $999 10 % are $750 to $999
59 % are $1,000 to $1,999 38 % are $1,000 to $1,999
14 % are $2,000 to $3,499 30 % are $2,000 to $3,499
6 % are $3,500 to $4,999
5 % are $5,000 or greater
Maximum Duration of Benefit 9 % provide fewer than 13 weeks 17 % provide fewer than 13 weeks provides 26 weeks
14 % provide 13 weeks 13 % provide 13 weeks
23 % provide 14 to 25 weeks 15 % provide 14 to 25 weeks
45 % provide 26 weeks 54 % provide 26 weeks
9 % provide more than 26 weeks 1 % provide more than 26 weeks
Executive STD 0 % have a plan 28 % have a plan; of these no plan
68 % provide fewer than 26 weeks full pay
18 % provide 26 weeks full pay
14 % provide more than 26 weeks full pay
Page 7

Appendix E PREVALENCE OF BENEFITS PRACTICES
DISABILITY BENEFITS
Western Public Sector Organizations General Market Organizations State of Idaho
LONG TERM DISABILITY 96 % have a plan 99 % have a plan has a plan
Eligibility 68 % have immediate eligibility 48 % have immediate eligibility all
32 % have a waiting period; of these, 52 % have a waiting period; of these,
20 % are 1 month 36 % are 1 month
40 % are 3 months 6 % are 2 months
40 % are 4 months or more 28 % are 3 months
30 % are 4 months or more
Cost 67 % are employer-paid 73 % are employer-paid employer-paid
11 % are cost shared 11 % are cost shared
22 % are employee-paid 16 % are employee-paid
Exclusion Period 38 % begin LTD benefits after 1 to 3 months of disability 27 % begin LTD benefits after 1 to 3 months of disability begins LTD benefits after 6 months
(for plans with a uniform 11 % begin LTD benefits after 4 or 5 months of disability 4 % begin LTD benefits after 4 or 5 months of disability
number of months) 49 % begin LTD benefits after 6 months of disability 67 % begin LTD benefits after 6 months of disability
2 % begin LTD benefits after 7 or more months of 2 % begin LTD benefits after 7 or more months of
disability disability
Amount of Benefit 94 % base benefits on a flat percent of earnings; of 95 % base benefits on a flat percent of earnings; of provides 60% of pay
these, these,
10 % provide 55% of pay or less 18 % provide 55% of pay or less
53 % provide 60% of pay 70 % provide 60% of pay
37 % provide 65% to 70% of pay 12 % provide 65% to 70% of pay
Covered Compensation 4 % credit bonuses as compensation 20 % credit bonuses as compensation does not credit bonus as compensation
7 % do not credit bonuses as compensation 77 % do not credit bonuses as compensation
89 % are non bonus-paying 3 % are non bonus-paying
Maximum Benefit 95 % have a monthly maximum; of these, 95 % have a monthly maximum; of these, monthly maximum of $4,000
21 % are less than $5,000 2 % are less than $5,000
18 % are $5,000 7 % are $5,000
46 % are $5,001 to $9,999 20 % are $5,001 to $9,999
8 % are $10,000 28 % are $10,000
5 % are $10,001 to $14,999 11 % are $10,001 to $14,999
2 % are $15,000 19 % are $15,000
13 % are greater than $15,000
Social Security Offset 7 % directly offset by primary Social Security 29 % directly offset by primary Social Security offset by family Social Security
86 % directly offset by family Social Security 57 % directly offset by family Social Security
4 % directly offset by primary Social Security and 10 % offset only after LTD benefit plus Social Security
excess offset for family Social Security exceeds a specified percentage of earnings
3 % have no offset 1 % directly offset by primary Social Security and
excess offset for family Social Security
3 % have no offset
Executive LTD 6 % have a plan; of these, 45 % have a plan; of these, no plan
50 % provide to restore benefits in excess 78 % provide to restore benefits in excess
of basic plan maximum of basic plan maximum
100 % provide to base benefit on a higher 28 % provide to base benefit on a higher
percentage percentage
Page 8
Appendix E PREVALENCE OF BENEFITS PRACTICES
HEALTH CARE BENEFITS
Western Public Sector Organizations General Market Organizations State of Idaho
HOSPITAL/MEDICAL PLAN 100 % have a plan 100 % have a plan has a plan
Eligibility 88 % have immediate eligibility 63 % have immediate eligibility has immediate eligibility
12 % have a waiting period; of these, 37 % have a waiting period; of these,
80 % are 1 month 57 % are 1 month
20 % are 3 months 19 % are 2 months
21 % are 3 months
3 % are 4 months or more
Cost 93 % require the same contributions for all salary 89 % require the same contributions for all salary
levels; of these, levels; of these,
Employee 27 % are employer-paid 4 % are employer-paid involves cost sharing
73 % involve cost sharing; of these, 96 % involve cost sharing; of these,
53 % require the employee to pay 21 % require the employee to pay employee pays 4.2%
less than 15% less than 15%
45 % require the employee to pay 55 % require the employee to pay
15% to 29% 15% to 29%
2 % require the employee to pay 24 % require the employee to pay
30% or more 30% or more
Dependents 6 % are employer-paid 1 % are employer-paid involves cost sharing
91 % involve cost sharing; of these, 98 % involve cost sharing; of these, employee pays 10%
50 % require the employee to pay 11 % require the employee to pay
less than 15% less than 15%
50 % require the employee to pay 51 % require the employee to pay
15% to 29% 15% to 29%
38 % require the employee to pay
30% or more
3 % are employee-paid 1 % are employee-paid
Prevalent Plan Type 5 % have a Fee-for-Service as the prevalent plan 9 % have an HMO as the prevalent plan has a PPO plan
21 % have an HMO as the prevalent plan 76 % have a PPO as the prevalent plan
60 % have a PPO as the prevalent plan 5 % have a Point-of-Service as the prevalent plan
4 % have a Point-of-Service as the prevalent plan 10 % have a High Deductible as the prevalent plan
10 % have a High Deductible as the prevalent plan
Hospitalization Benefits
Deductible 18 % have no deductible 13 % have no deductible subject to medical plan deductible
61 % are subject to the medical plan deductible 62 % are subject to the medical plan deductible
21 % have a separate hospital deductible or copay 25 % have a separate hospital deductible or copay
Basis of Room and Board Benefit 100 % base coverage on a percent of recognized charges; 100 % base coverage on a percent of recognized charges; semi-private rate
of these, of these,
32 % pay 80% or less of semiprivate rate 50 % pay 80% or less of semiprivate rate
11 % pay 81% to 89% of semiprivate rate 4 % pay 81% to 89% of semiprivate rate
30 % pay 90% of semiprivate rate 26 % pay 90% of semiprivate rate
27 % pay 100% of semiprivate rate 20 % pay 100% of semiprivate rate
Maximum 100 % have no maximum 96 % have no maximum no maximum
4 % have a maximum number of days
Page 9

Appendix E PREVALENCE OF BENEFITS PRACTICES
HEALTH CARE BENEFITS
Western Public Sector Organizations General Market Organizations State of Idaho
HOSPITAL/MEDICAL PLAN (Continued)
In Hospital Doctor's Visit 95 % base coverage on a percent of recognized charges; 96 % base coverage on a percent of recognized charges; bases coverage on a percent of recognized charges
of these, of these, pays 85% of recognized charges
42 % pay 80% or less 48 % pay 80% or less
5 % pay 81% to 89% 4 % pay 81% to 89%
29 % pay 90% 27 % pay 90%
24 % pay 100% 21 % pay 100%
5 % base coverage on a copay per visit or a 4 % base coverage on a copay per visit or a
dollar schedule dollar schedule
Psychiatric Care in the Hospital 100 % provide coverage 99 % provide coverage provides coverage
Basis of Benefit 41 % pay 80% or less of recognized charges 51 % pay 80% or less of recognized charges pays 85% of recognized charges
11 % pay 81% to 89% of recognized charges 4 % pay 81% to 89% of recognized charges
21 % pay 90% of recognized charges 24 % pay 90% of recognized charges
27 % pay 100% of recognized charges 21 % pay 100% of recognized charges
Surgical Benefits
Deductible 4 % are subject to a separate surgical deductible 4 % are subject to a separate surgical deductible subject to medical plan deductible
67 % are subject to the medical plan deductible 75 % are subject to the medical plan deductible
29 % have no deductible 21 % have no deductible
Basis of Benefit 100 % base coverage on a percent of recognized charges; 99 % base coverage on a percent of recognized charges; pays 85% of recognized charges
of these, of these,
35 % pay 80% or less 50 % pay 80% or less
11 % pay 81% to 89% 4 % pay 81% to 89%
29 % pay 90% 26 % pay 90%
25 % pay 100% 20 % pay 100%
Doctor's Office Visits 100 % cover doctor's office visits 100 % cover doctor's office visits covers
Deductible/Copay 4 % have no deductible or copay 4 % have no deductible or copay subject to a separate copay
65 % have a separate deductible or copay 74 % have a separate deductible or copay
31 % are subject to the medical plan deductible 22 % are subject to the medical plan deductible
Copay coverage is based on a percent of recognized charges coverage is based on a percent of recognized charges has a $20 copay
(typically 100%) after a copay; of these, (typically 100%) after a copay; of these,
8 % have a copay of less than $10 1 % have a copay of less than $10
8 % have a copay of $10 5 % have a copay of $10
24 % have a copay of $15 20 % have a copay of $15
11 % have a copay of $20 39 % have a copay of $20
38 % have a copay of $25 23 % have a copay of $25
11 % have a copay of more than $25 12 % have a copay of more than $25
Preventive Care
Well-baby Care 98 % provide coverage 100 % provide coverage provides
Routine Doctor's Office Visits 100 % provide coverage 99 % provide coverage provides
Page 10
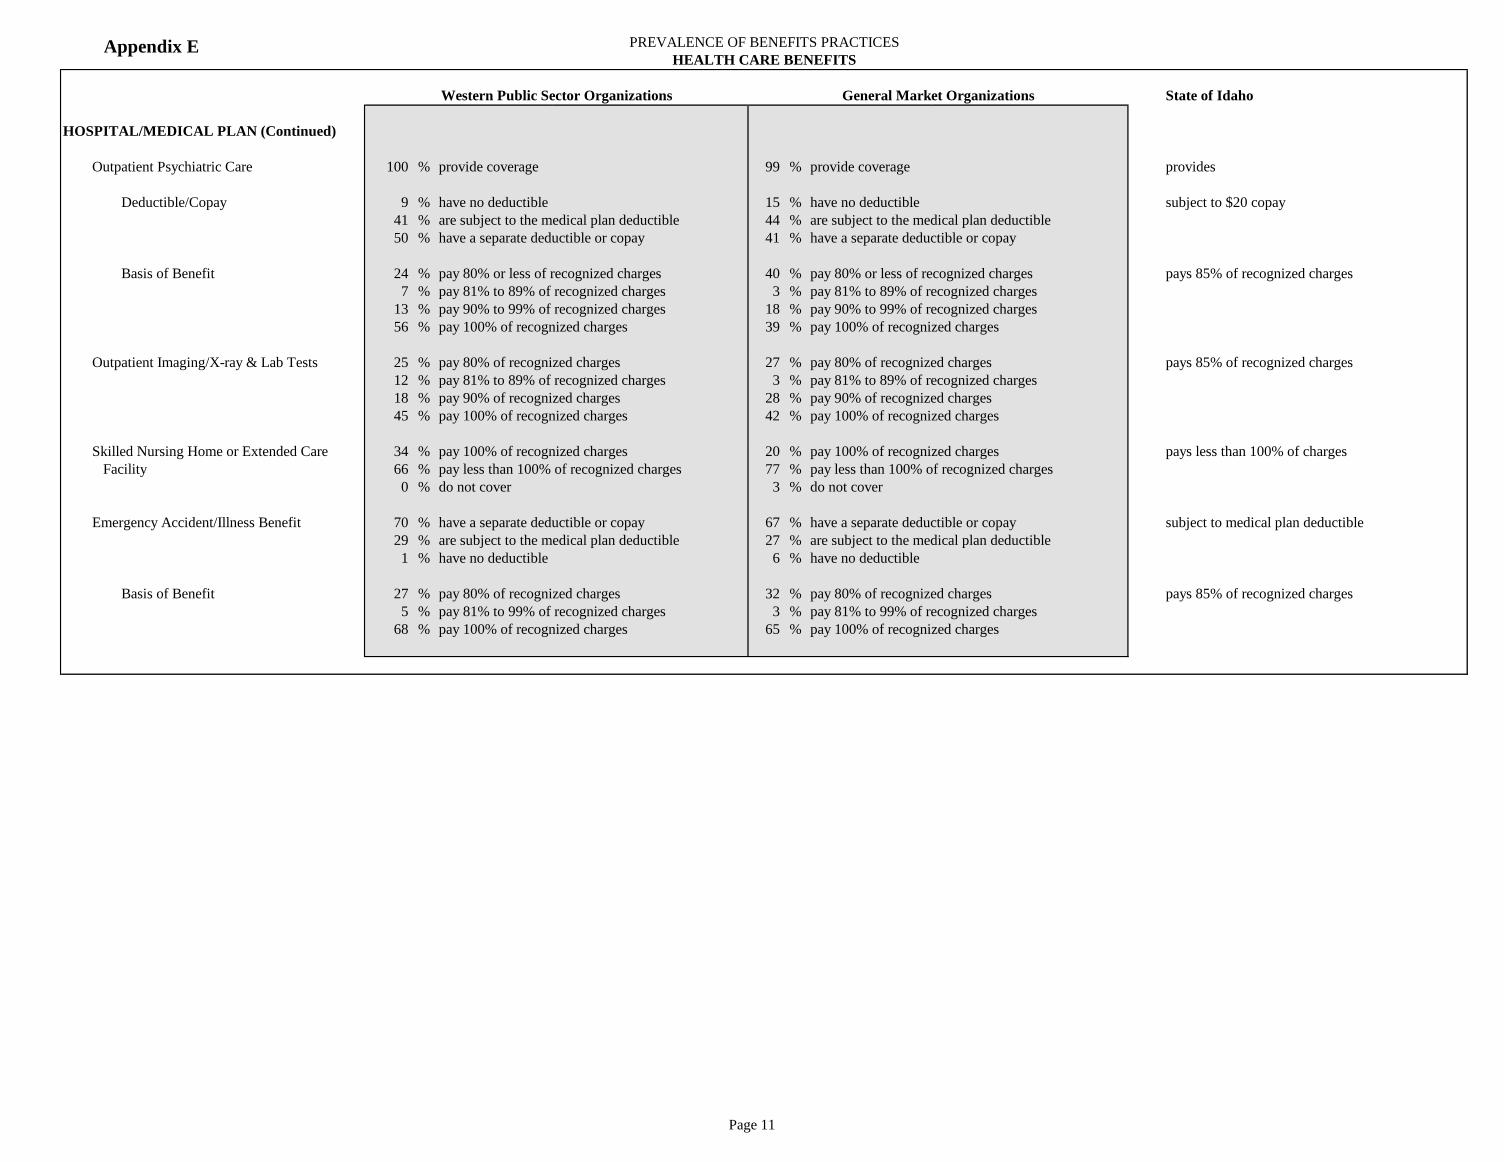
Appendix E PREVALENCE OF BENEFITS PRACTICES
HEALTH CARE BENEFITS
Western Public Sector Organizations General Market Organizations State of Idaho
HOSPITAL/MEDICAL PLAN (Continued)
Outpatient Psychiatric Care 100 % provide coverage 99 % provide coverage provides
Deductible/Copay 9 % have no deductible 15 % have no deductible subject to $20 copay
41 % are subject to the medical plan deductible 44 % are subject to the medical plan deductible
50 % have a separate deductible or copay 41 % have a separate deductible or copay
Basis of Benefit 24 % pay 80% or less of recognized charges 40 % pay 80% or less of recognized charges pays 85% of recognized charges
7 % pay 81% to 89% of recognized charges 3 % pay 81% to 89% of recognized charges
13 % pay 90% to 99% of recognized charges 18 % pay 90% to 99% of recognized charges
56 % pay 100% of recognized charges 39 % pay 100% of recognized charges
Outpatient Imaging/X-ray & Lab Tests 25 % pay 80% of recognized charges 27 % pay 80% of recognized charges pays 85% of recognized charges
12 % pay 81% to 89% of recognized charges 3 % pay 81% to 89% of recognized charges
18 % pay 90% of recognized charges 28 % pay 90% of recognized charges
45 % pay 100% of recognized charges 42 % pay 100% of recognized charges
Skilled Nursing Home or Extended Care 34 % pay 100% of recognized charges 20 % pay 100% of recognized charges pays less than 100% of charges
Facility 66 % pay less than 100% of recognized charges 77 % pay less than 100% of recognized charges
0 % do not cover 3 % do not cover
Emergency Accident/Illness Benefit 70 % have a separate deductible or copay 67 % have a separate deductible or copay subject to medical plan deductible
29 % are subject to the medical plan deductible 27 % are subject to the medical plan deductible
1 % have no deductible 6 % have no deductible
Basis of Benefit 27 % pay 80% of recognized charges 32 % pay 80% of recognized charges pays 85% of recognized charges
5 % pay 81% to 99% of recognized charges 3 % pay 81% to 99% of recognized charges
68 % pay 100% of recognized charges 65 % pay 100% of recognized charges
Page 11
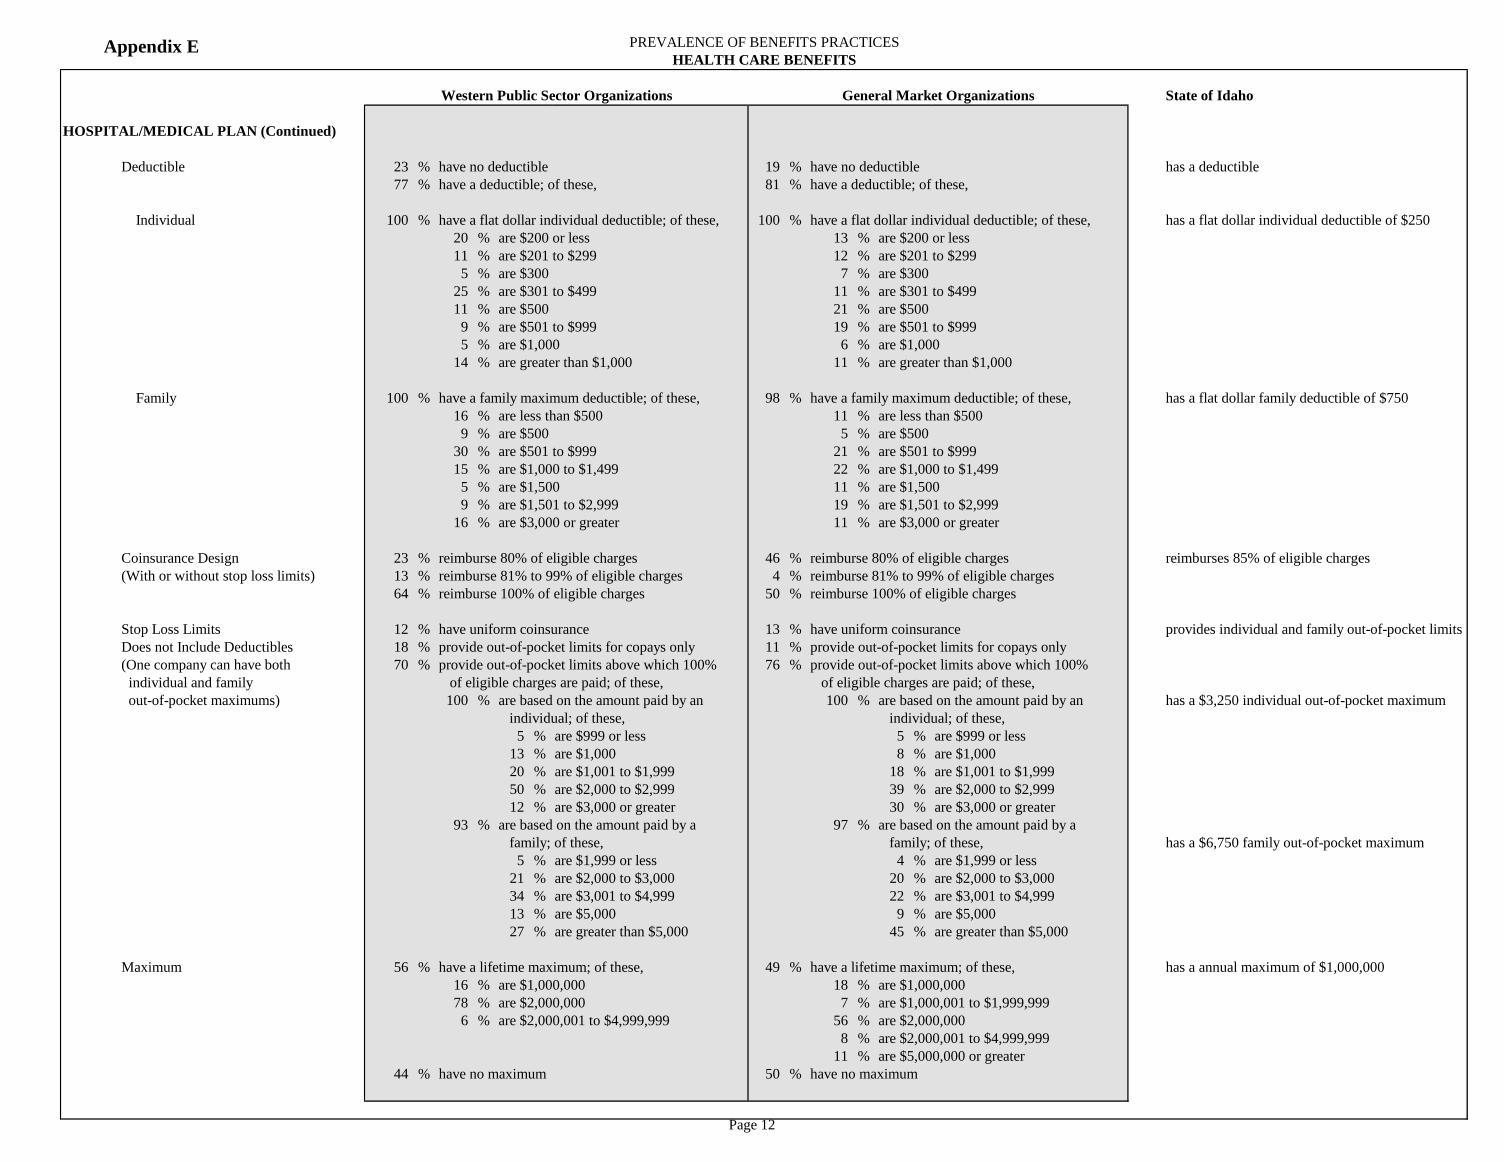
Appendix E PREVALENCE OF BENEFITS PRACTICES
HEALTH CARE BENEFITS
Western Public Sector Organizations General Market Organizations State of Idaho
HOSPITAL/MEDICAL PLAN (Continued)
Deductible 23 % have no deductible 19 % have no deductible has a deductible
77 % have a deductible; of these, 81 % have a deductible; of these,
Individual 100 % have a flat dollar individual deductible; of these, 100 % have a flat dollar individual deductible; of these, has a flat dollar individual deductible of $250
20 % are $200 or less 13 % are $200 or less
11 % are $201 to $299 12 % are $201 to $299
5 % are $300 7 % are $300
25 % are $301 to $499 11 % are $301 to $499
11 % are $500 21 % are $500
9 % are $501 to $999 19 % are $501 to $999
5 % are $1,000 6 % are $1,000
14 % are greater than $1,000 11 % are greater than $1,000
Family 100 % have a family maximum deductible; of these, 98 % have a family maximum deductible; of these, has a flat dollar family deductible of $750
16 % are less than $500 11 % are less than $500
9 % are $500 5 % are $500
30 % are $501 to $999 21 % are $501 to $999
15 % are $1,000 to $1,499 22 % are $1,000 to $1,499
5 % are $1,500 11 % are $1,500
9 % are $1,501 to $2,999 19 % are $1,501 to $2,999
16 % are $3,000 or greater 11 % are $3,000 or greater
Coinsurance Design 23 % reimburse 80% of eligible charges 46 % reimburse 80% of eligible charges reimburses 85% of eligible charges
(With or without stop loss limits) 13 % reimburse 81% to 99% of eligible charges 4 % reimburse 81% to 99% of eligible charges
64 % reimburse 100% of eligible charges 50 % reimburse 100% of eligible charges
Stop Loss Limits 12 % have uniform coinsurance 13 % have uniform coinsurance provides individual and family out-of-pocket limits
Does not Include Deductibles 18 % provide out-of-pocket limits for copays only 11 % provide out-of-pocket limits for copays only
(One company can have both 70 % provide out-of-pocket limits above which 100% 76 % provide out-of-pocket limits above which 100%
individual and family of eligible charges are paid; of these, of eligible charges are paid; of these,
out-of-pocket maximums) 100 % are based on the amount paid by an 100 % are based on the amount paid by an has a $3,250 individual out-of-pocket maximum
individual; of these, individual; of these,
5 % are $999 or less 5 % are $999 or less
13 % are $1,000 8 % are $1,000
20 % are $1,001 to $1,999 18 % are $1,001 to $1,999
50 % are $2,000 to $2,999 39 % are $2,000 to $2,999
12 % are $3,000 or greater 30 % are $3,000 or greater
93 % are based on the amount paid by a 97 % are based on the amount paid by a
family; of these, family; of these, has a $6,750 family out-of-pocket maximum
5 % are $1,999 or less 4 % are $1,999 or less
21 % are $2,000 to $3,000 20 % are $2,000 to $3,000
34 % are $3,001 to $4,999 22 % are $3,001 to $4,999
13 % are $5,000 9 % are $5,000
27 % are greater than $5,000 45 % are greater than $5,000
Maximum 56 % have a lifetime maximum; of these, 49 % have a lifetime maximum; of these, has a annual maximum of $1,000,000
16 % are $1,000,000 18 % are $1,000,000
78 % are $2,000,000 7 % are $1,000,001 to $1,999,999
6 % are $2,000,001 to $4,999,999 56 % are $2,000,000
8 % are $2,000,001 to $4,999,999
11 % are $5,000,000 or greater
44 % have no maximum 50 % have no maximum
Page 12

Appendix E PREVALENCE OF BENEFITS PRACTICES
HEALTH CARE BENEFITS
Western Public Sector Organizations General Market Organizations State of Idaho
RETIREE COVERAGE 18 % cover early retirees only 5 % cover early retirees only does not provide group coverage to
64 % cover both early and normal retirees 2 % cover normal retirees only retirees hired after July 1, 2009
18 % cover neither 32 % cover both early and normal retirees
61 % cover neither
Cost (Normal Retirees)
Retiree Coverage 31 % involve cost sharing 5 % are employer-paid retiree-paid
69 % are retiree-paid 59 % involve cost sharing (unused sick leave may be converted to
36 % are retiree-paid offset premiums for individually
Cost (Continued) purchased coverage)
Dependent Coverage 30 % involve cost sharing 4 % are employer-paid retiree-paid
70 % are retiree-paid 58 % involve cost sharing
38 % are retiree-paid
PRESCRIPTION DRUGS 5 % cover as an eligible expense under the medical 7 % cover as an eligible expense under the medical covers with separate treatment from medical plan
plan plan
95 % cover under a separate plan 93 % cover under a separate plan
Generic or Lowest Copay 4 % have a copay of less than $5 1 % have a copay of less than $5 has a $10 copay
(For separate plans) 15 % have a copay of $5 14 % have a copay of $5
13 % have a copay of $6 to $9 14 % have a copay of $6 to $9
55 % have a copay of $10 49 % have a copay of $10
9 % have a copay of $15 2 % have a copay of $11 to $14
4 % have a copay of greater than $15 14 % have a copay of $15
6 % have a copay of greater than $15
Formulary Drug Copay 14 % have a copay of less than $20 9 % have a copay of less than $20 has a $25 copay
(For separate plans) 28 % have a copay of $20 14 % have a copay of $20
3 % have a copay of $21 to $24 2 % have a copay of $21 to $24
17 % have a copay of $25 31 % have a copay of $25
25 % have a copay of $30 1 % have a copay of $26 to $29
13 % have a copay of greater than $30 22 % have a copay of $30
21 % have a copay of greater than $30
Brand Name Copay 8 % have a copay of less than $25 8 % have a copay of less than $25 has a $50 copay
(For separate plans) 3 % have a copay of $25 3 % have a copay of $25
5 % have a copay of $26 to $34 6 % have a copay of $26 to $34
5 % have a copay of $35 to $39 7 % have a copay of $35 to $39
21 % have a copay of $40 to $49 34 % have a copay of $40 to $49
34 % have a copay of $50 27 % have a copay of $50
24 % have a copay of greater than $50 15 % have a copay of greater than $50
Page 13

Appendix E PREVALENCE OF BENEFITS PRACTICES
HEALTH CARE BENEFITS
Western Public Sector Organizations General Market Organizations State of Idaho
DENTAL COVERAGE provides coverage
100 % covered under a separate plan 100 % covered under a separate plan
Eligibility 14 % have a waiting period; of these, 45 % have a waiting period; of these, has immediate eligibility
75 % are 1 month 56 % are 1 month
25 % are 3 months 17 % are 2 months
21 % are 3 months
6 % are 4 or more months
86 % have immediate eligibility 55 % have immediate eligibility
Cost
Employee 31 % are employer-paid 8 % are employer-paid involves cost sharing
11 % are employee-paid 6 % are employee-paid
9 % are included in medical cost 5 % are included in medical cost employee pays 27%
49 % involve cost sharing; of these, 81 % involve cost sharing; of these,
42 % require the employee to pay less than 20% 17 % require the employee to pay less than 20%
28 % require the employee to pay 20% to 39% 45 % require the employee to pay 20% to 39%
30 % require the employee to pay 40% or more 38 % require the employee to pay 40% or more
Dependents 19 % are employer-paid 6 % are employer-paid employee-paid
20 % are employee-paid 8 % are employee-paid
7 % are included in medical cost 5 % are included in medical cost
54 % involve cost sharing; of these, 81 % involve cost sharing; of these,
40 % require the employee to pay less than 20% 13 % require the employee to pay less than 20%
28 % require the employee to pay 20% to 39% 47 % require the employee to pay 20% to 39%
32 % require the employee to pay 40% or more 40 % require the employee to pay 40% or more
Basis of Coverage 9 % have a uniform coinsurance 98 % coinsurance varies by type of expense varies coinsurance by type of expense
83 % coinsurance varies by type of expense 2 % coinsurance varies based on other criteria
8 % coinsurance varies based on other criteria
Coinsurance 92 % reimburse 100% for preventive 93 % reimburse 100% for preventive reimburses 80% for preventive
(dollar schedules have been converted 55 % reimburse 80% for basic restorative 73 % reimburse 80% for basic restorative reimburses 80% for basic restorative
to percentage of recognized charges) 71 % reimburse 50% for major restorative 73 % reimburse 50% for major restorative reimburses 50% for major restorative
Deductible 69 % have a deductible; of these, 91 % have a deductible; of these, has a $25 annual deductible
21 % are $25 19 % are $25
73 % are $50 71 % are $50
10 % are greater than $50
Page 14
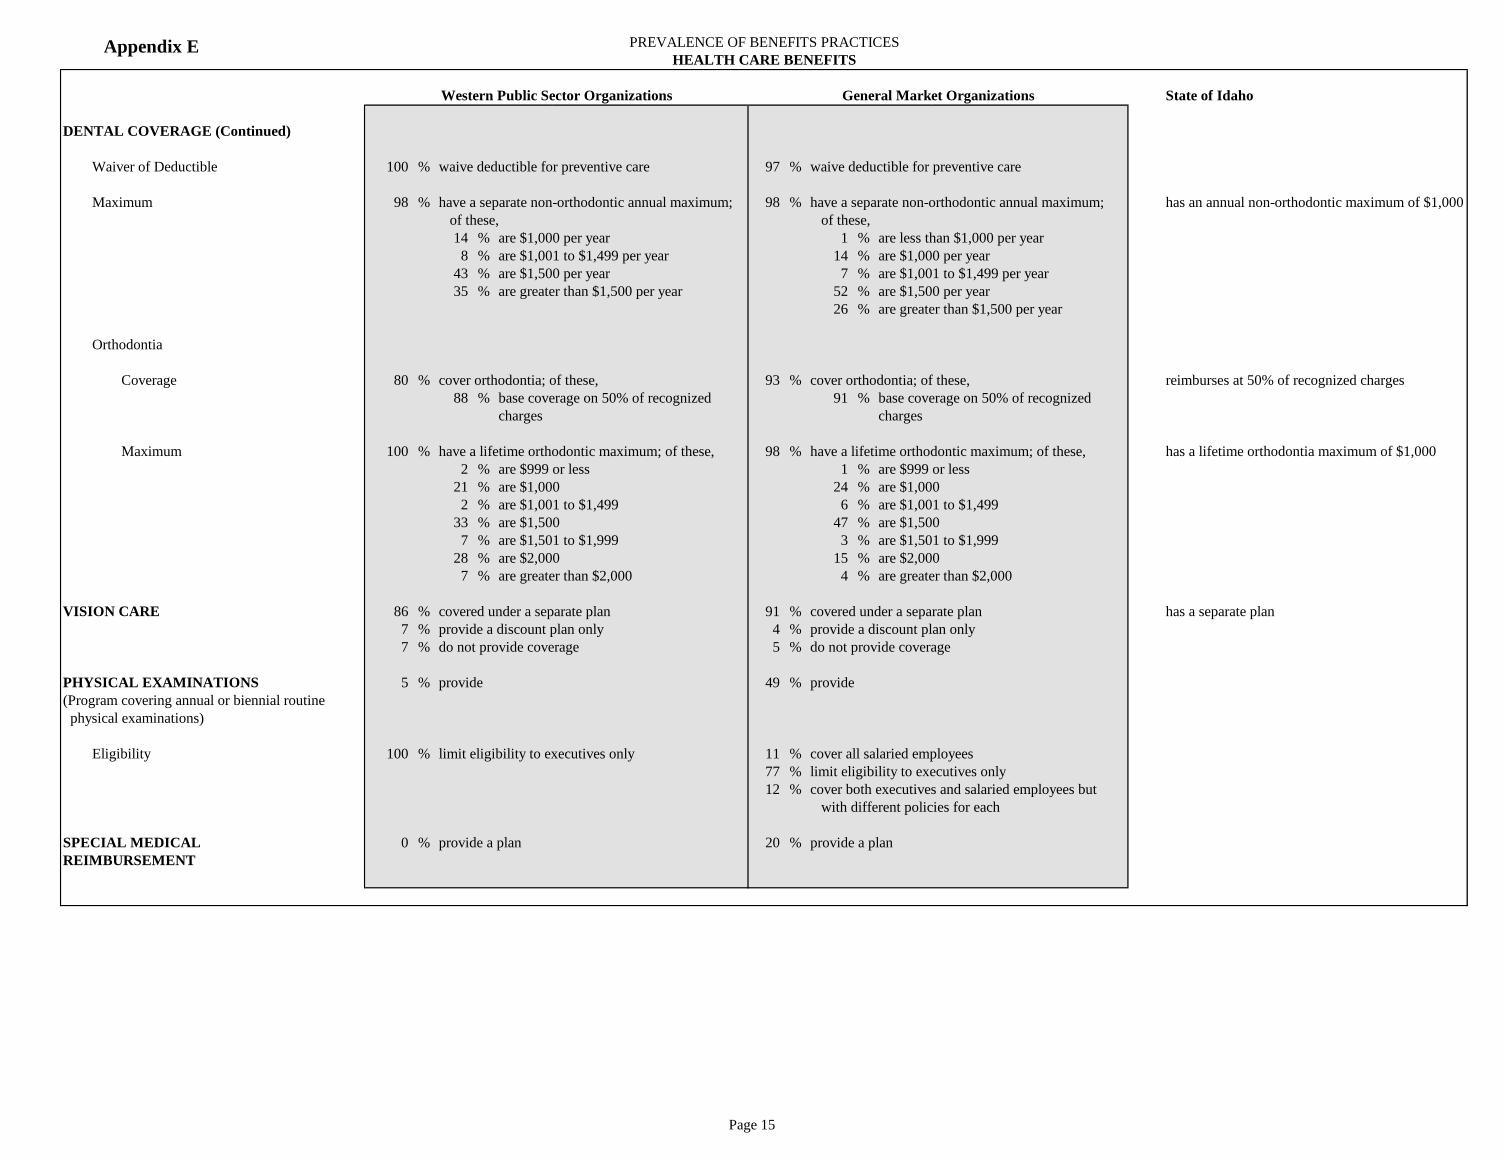
Appendix E PREVALENCE OF BENEFITS PRACTICES
HEALTH CARE BENEFITS
Western Public Sector Organizations General Market Organizations State of Idaho
DENTAL COVERAGE (Continued)
Waiver of Deductible 100 % waive deductible for preventive care 97 % waive deductible for preventive care
Maximum 98 % have a separate non-orthodontic annual maximum; 98 % have a separate non-orthodontic annual maximum; has an annual non-orthodontic maximum of $1,000
of these, of these,
14 % are $1,000 per year 1 % are less than $1,000 per year
8 % are $1,001 to $1,499 per year 14 % are $1,000 per year
43 % are $1,500 per year 7 % are $1,001 to $1,499 per year
35 % are greater than $1,500 per year 52 % are $1,500 per year
26 % are greater than $1,500 per year
Orthodontia
Coverage 80 % cover orthodontia; of these, 93 % cover orthodontia; of these, reimburses at 50% of recognized charges
88 % base coverage on 50% of recognized 91 % base coverage on 50% of recognized
charges charges
Maximum 100 % have a lifetime orthodontic maximum; of these, 98 % have a lifetime orthodontic maximum; of these, has a lifetime orthodontia maximum of $1,000
2 % are $999 or less 1 % are $999 or less
21 % are $1,000 24 % are $1,000
2 % are $1,001 to $1,499 6 % are $1,001 to $1,499
33 % are $1,500 47 % are $1,500
7 % are $1,501 to $1,999 3 % are $1,501 to $1,999
28 % are $2,000 15 % are $2,000
7 % are greater than $2,000 4 % are greater than $2,000
VISION CARE 86 % covered under a separate plan 91 % covered under a separate plan has a separate plan
7 % provide a discount plan only 4 % provide a discount plan only
7 % do not provide coverage 5 % do not provide coverage
PHYSICAL EXAMINATIONS 5 % provide 49 % provide
(Program covering annual or biennial routine
physical examinations)
Eligibility 100 % limit eligibility to executives only 11 % cover all salaried employees
77 % limit eligibility to executives only
12 % cover both executives and salaried employees but
with different policies for each
SPECIAL MEDICAL 0 % provide a plan 20 % provide a plan
REIMBURSEMENT
Page 15
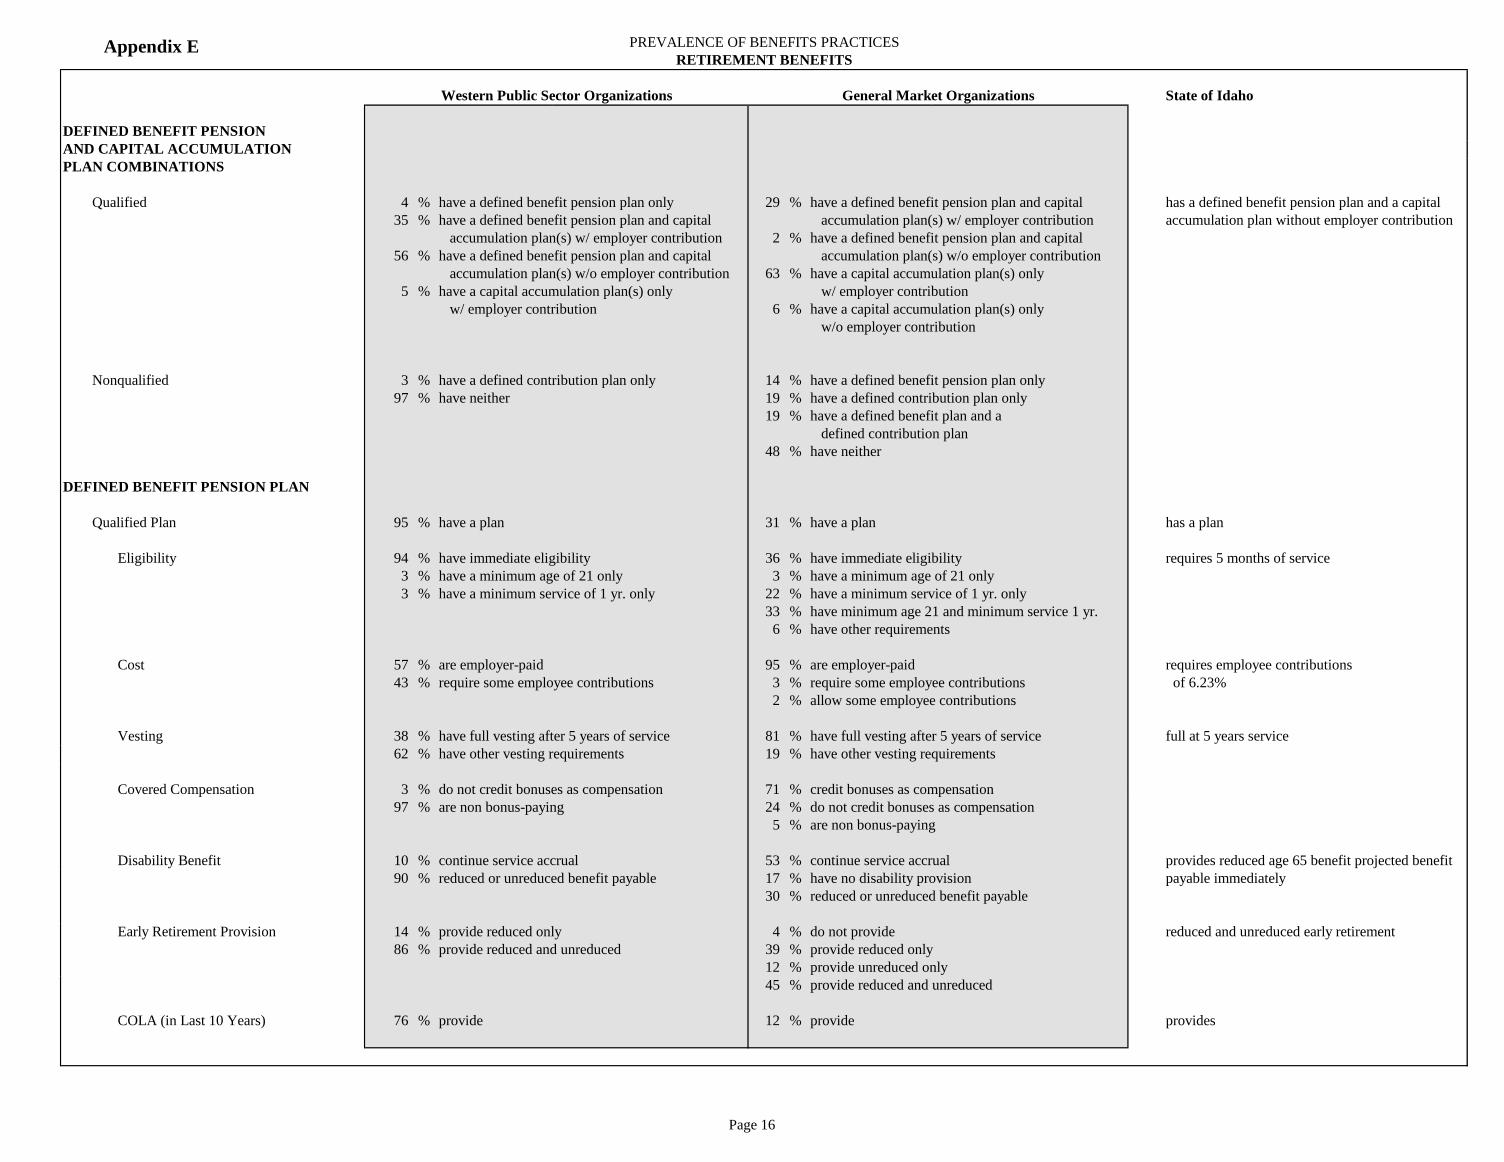
Appendix E PREVALENCE OF BENEFITS PRACTICES
RETIREMENT BENEFITS
Western Public Sector Organizations General Market Organizations State of Idaho
DEFINED BENEFIT PENSION
AND CAPITAL ACCUMULATION
PLAN COMBINATIONS
Qualified 4 % have a defined benefit pension plan only 29 % have a defined benefit pension plan and capital has a defined benefit pension plan and a capital
35 % have a defined benefit pension plan and capital accumulation plan(s) w/ employer contribution accumulation plan without employer contribution
accumulation plan(s) w/ employer contribution 2 % have a defined benefit pension plan and capital
56 % have a defined benefit pension plan and capital accumulation plan(s) w/o employer contribution
accumulation plan(s) w/o employer contribution 63 % have a capital accumulation plan(s) only
5 % have a capital accumulation plan(s) only w/ employer contribution
w/ employer contribution 6 % have a capital accumulation plan(s) only
w/o employer contribution
Nonqualified 3 % have a defined contribution plan only 14 % have a defined benefit pension plan only
97 % have neither 19 % have a defined contribution plan only
19 % have a defined benefit plan and a
defined contribution plan
48 % have neither
DEFINED BENEFIT PENSION PLAN
Qualified Plan 95 % have a plan 31 % have a plan has a plan
Eligibility 94 % have immediate eligibility 36 % have immediate eligibility requires 5 months of service
3 % have a minimum age of 21 only 3 % have a minimum age of 21 only
3 % have a minimum service of 1 yr. only 22 % have a minimum service of 1 yr. only
33 % have minimum age 21 and minimum service 1 yr.
6 % have other requirements
Cost 57 % are employer-paid 95 % are employer-paid requires employee contributions
43 % require some employee contributions 3 % require some employee contributions of 6.23%
2 % allow some employee contributions
Vesting 38 % have full vesting after 5 years of service 81 % have full vesting after 5 years of service full at 5 years service
62 % have other vesting requirements 19 % have other vesting requirements
Covered Compensation 3 % do not credit bonuses as compensation 71 % credit bonuses as compensation
97 % are non bonus-paying 24 % do not credit bonuses as compensation
5 % are non bonus-paying
Disability Benefit 10 % continue service accrual 53 % continue service accrual provides reduced age 65 benefit projected benefit
90 % reduced or unreduced benefit payable 17 % have no disability provision payable immediately
30 % reduced or unreduced benefit payable
Early Retirement Provision 14 % provide reduced only 4 % do not provide reduced and unreduced early retirement
86 % provide reduced and unreduced 39 % provide reduced only
12 % provide unreduced only
45 % provide reduced and unreduced
COLA (in Last 10 Years) 76 % provide 12 % provide provides
Page 16
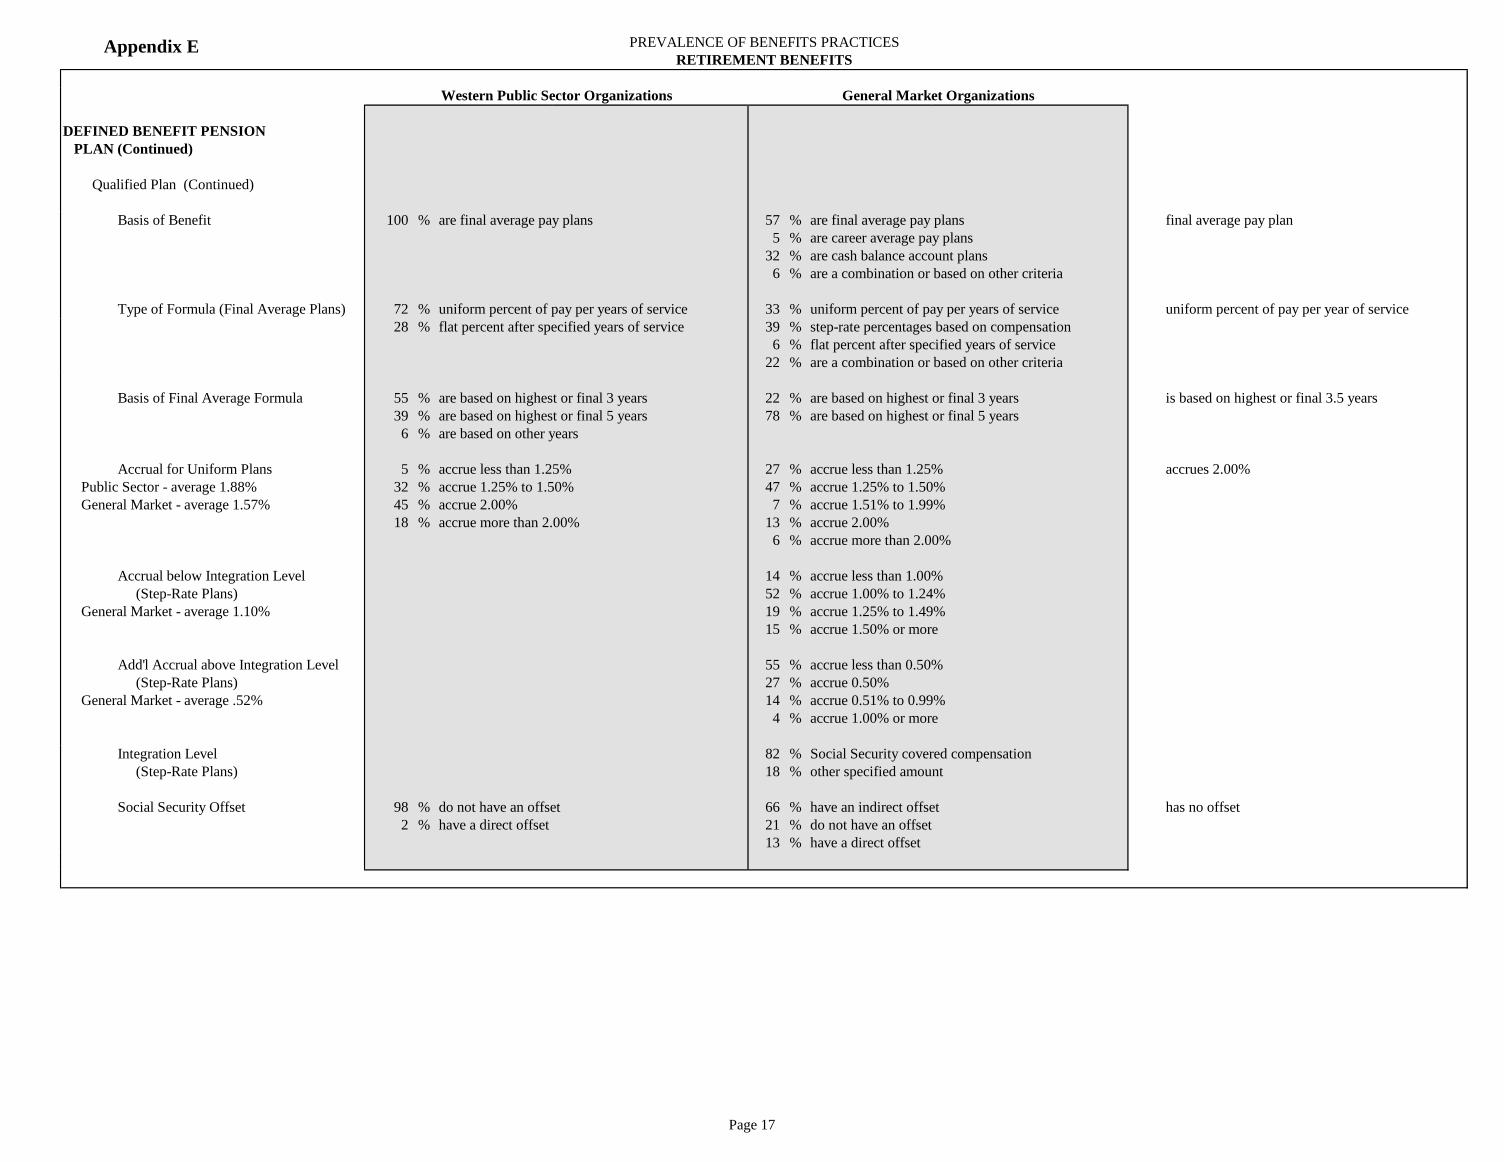
Appendix E PREVALENCE OF BENEFITS PRACTICES
RETIREMENT BENEFITS
Western Public Sector Organizations General Market Organizations
DEFINED BENEFIT PENSION
PLAN (Continued)
Qualified Plan (Continued)
Basis of Benefit 100 % are final average pay plans 57 % are final average pay plans final average pay plan
5 % are career average pay plans
32 % are cash balance account plans
6 % are a combination or based on other criteria
Type of Formula (Final Average Plans) 72 % uniform percent of pay per years of service 33 % uniform percent of pay per years of service uniform percent of pay per year of service
28 % flat percent after specified years of service 39 % step-rate percentages based on compensation
6 % flat percent after specified years of service
22 % are a combination or based on other criteria
Basis of Final Average Formula 55 % are based on highest or final 3 years 22 % are based on highest or final 3 years is based on highest or final 3.5 years
39 % are based on highest or final 5 years 78 % are based on highest or final 5 years
6 % are based on other years
Accrual for Uniform Plans 5 % accrue less than 1.25% 27 % accrue less than 1.25% accrues 2.00%
Public Sector - average 1.88% 32 % accrue 1.25% to 1.50% 47 % accrue 1.25% to 1.50%
General Market - average 1.57% 45 % accrue 2.00% 7 % accrue 1.51% to 1.99%
18 % accrue more than 2.00% 13 % accrue 2.00%
6 % accrue more than 2.00%
Accrual below Integration Level 14 % accrue less than 1.00%
(Step-Rate Plans) 52 % accrue 1.00% to 1.24%
General Market - average 1.10% 19 % accrue 1.25% to 1.49%
15 % accrue 1.50% or more
Add'l Accrual above Integration Level 55 % accrue less than 0.50%
(Step-Rate Plans) 27 % accrue 0.50%
General Market - average .52% 14 % accrue 0.51% to 0.99%
4 % accrue 1.00% or more
Integration Level 82 % Social Security covered compensation
(Step-Rate Plans) 18 % other specified amount
Social Security Offset 98 % do not have an offset 66 % have an indirect offset has no offset
2 % have a direct offset 21 % do not have an offset
13 % have a direct offset
Page 17

Appendix E PREVALENCE OF BENEFITS PRACTICES
RETIREMENT BENEFITS
Western Public Sector Organizations General Market Organizations State of Idaho
DEFINED BENEFIT PENSION
PLAN (Continued)
Nonqualified Plan 0 % have a plan 33 % have a plan; of these,
42 % provide an excess benefit plan (to
remove compensation and Section 415
limits)
58 % provide a supplemental executive
retirement plan (SERP)
Covered Compensation 83 % credit bonuses as compensation
17 % do not credit bonuses as compensation
Benefit Income Objective 50 % have a target replacement objective; of these,
(lowest on only stated target) 10 % are less than 50%
40 % are 50% to 59%
40 % are 60%
10 % are 61% to 70%
8 % have an annual accrual rate
Offsets 88 % are offset by the qualified plan
(Each company may offset by more 41 % are offset by Social Security
than one benefit) 12 % are offset by a capital accumulation plan
Page 18

Appendix E PREVALENCE OF BENEFITS PRACTICES
RETIREMENT BENEFITS
Western Public Sector Organizations General Market Organizations State of Idaho
CAPITAL ACCUMULATION
401(k) or Pretax Savings Plan 39 % have a plan 95 % have a plan has a plan
Employer Contributions 45 % provide an employer match 90 % provide an employer match does not provide an employer match
Maximum Employee Contribution 33 % permit 3% or less 6 % permit 3% or less
Matched by Employer 11 % permit 4% 19 % permit 4%
22 % permit 5% 25 % permit 5%
34 % permit 6% 41 % permit 6%
4 % permit 7% or 8%
5 % permit 9% or more
Employer Matching as a Percent 100 % match based on a specified percent; of these, 93 % match based on a specified percent; of these,
of Employee Contribution 33 % match 50% of the employee's 14 % match 49% or less of the employee's
contribution contribution
11 % match 51% to 99% of the employee's 30 % match 50% of the employee's
contribution contribution
56 % match 100% of the employee's 21 % match 51% to 99% of the employee's
contribution contribution
34 % match 100% of the employee's
contribution
1 % match more than 100% of the employee's
contribution
1 % match varies by service
3 % match based on profits
3 % match based on other criteria
Eligibility 73 % have immediate eligibility 31 % have immediate eligibility requires 5 months of employment
20 % are based on service only 7 % are based on age only
7 % are based on age and service 23 % are based on service only
39 % are based on age and service
Vesting 40 % are based on service; of these, 68 % are based on service; of these,
50 % have full vesting after 1 to 4 years of 46 % have full vesting after 1 to 4 years of
service service
50 % have full vesting after 5 years of service 46 % have full vesting after 5 years of service
8 % have full vesting after 6 to 10 years of
60 % are full and immediate service
1 % are based on other criteria
31 % are full and immediate
Covered Compensation 6 % do not credit bonuses as compensation 58 % credit bonuses as compensation
94 % are non bonus-paying 40 % do not credit bonuses as compensation
2 % are non bonus-paying
Page 19
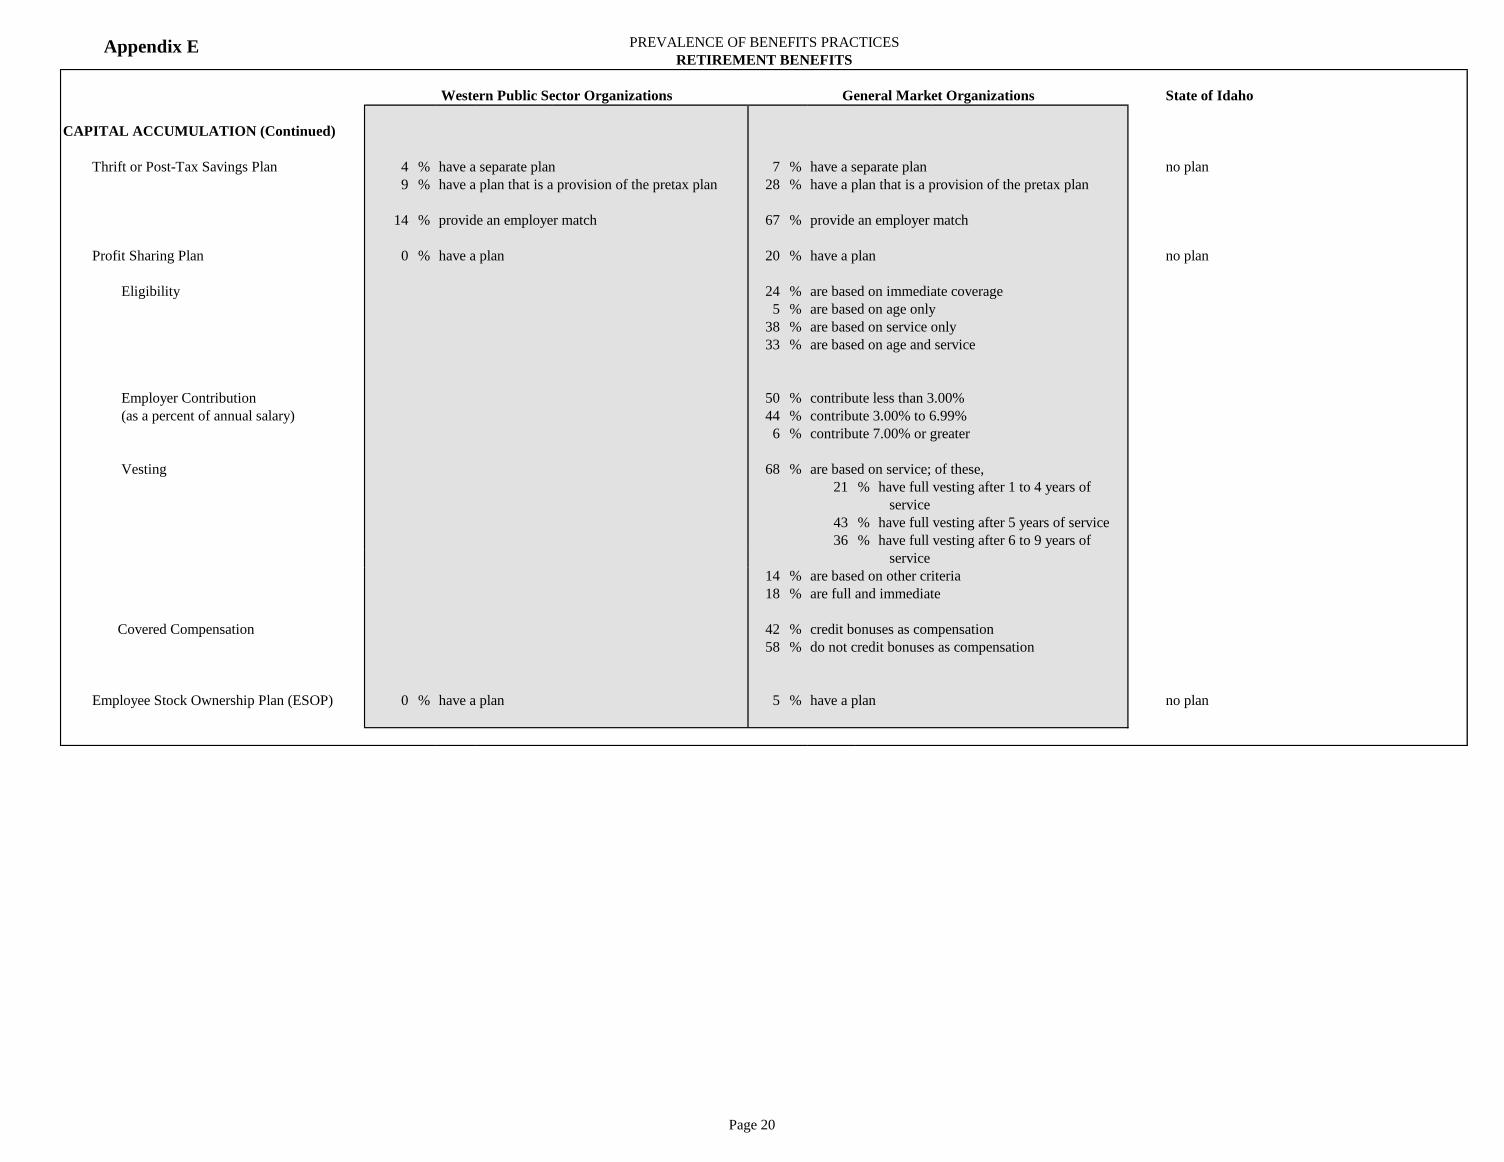
Appendix E PREVALENCE OF BENEFITS PRACTICES
RETIREMENT BENEFITS
Western Public Sector Organizations General Market Organizations State of Idaho
CAPITAL ACCUMULATION (Continued)
Thrift or Post-Tax Savings Plan 4 % have a separate plan 7 % have a separate plan no plan
9 % have a plan that is a provision of the pretax plan 28 % have a plan that is a provision of the pretax plan
14 % provide an employer match 67 % provide an employer match
Profit Sharing Plan 0 % have a plan 20 % have a plan no plan
Eligibility 24 % are based on immediate coverage
5 % are based on age only
38 % are based on service only
33 % are based on age and service
Employer Contribution 50 % contribute less than 3.00%
(as a percent of annual salary) 44 % contribute 3.00% to 6.99%
6 % contribute 7.00% or greater
Vesting 68 % are based on service; of these,
21 % have full vesting after 1 to 4 years of
service
43 % have full vesting after 5 years of service
36 % have full vesting after 6 to 9 years of
service
14 % are based on other criteria
18 % are full and immediate
Covered Compensation 42 % credit bonuses as compensation
58 % do not credit bonuses as compensation
Employee Stock Ownership Plan (ESOP) 0 % have a plan 5 % have a plan no plan
Page 20

Appendix E PREVALENCE OF BENEFITS PRACTICES
RETIREMENT BENEFITS
Western Public Sector Organizations General Market Organizations State of Idaho
CAPITAL ACCUMULATION (Continued)
Money Purchase Plan 12 % have a plan 8 % have a plan no plan
Eligibility 83 % have immediate eligibility 41 % have immediate eligibility
17 % are based on age and service 6 % are based on age only
24 % are based on service only
29 % are based on age and service
Vesting 100 % are full and immediate 78 % are based on service; of these,
38 % have full vesting after 1 to 4 years of
service
31 % have full vesting after 5 years of service
31 % have full vesting after 6 to 10 years of
service
6 % are based on other criteria
16 % are full and immediate
Covered Compensation 100 % are non bonus-paying 50 % credit bonuses as compensation
50 % do not credit bonuses as compensation
Employee Contributions 86 % do not require or allow employee contributions 88 % do not require or allow employee contributions
14 % allow, but do not require employee contributions 12 % allow, but do not require employee contributions
Formula 100 % are based on a uniform percent of pay; of these; 79 % are based on a uniform percent of pay; of these;
(includes employee contributions, 33 % are less than 5% 54 % are less than 5%
if required) 67 % are 14% or greater 46 % are 5% to 8.99%
Discount Stock Purchase Plan 0 % have a plan 16 % have a plan no plan
Page 21

Appendix E PREVALENCE OF BENEFITS PRACTICES
RETIREMENT BENEFITS
Western Public Sector Organizations General Market Organizations State of Idaho
CAPITAL ACCUMULATION (Continued)
403(b) Plan 14 % have a plan 6 % have a plan no plan
Employer Contributions 0 % provide an employer match 42 % provide an employer match
Maximum Employee Contribution 20 % permit 3% or less
Matched by Employer 20 % permit 4%
20 % permit 5%
40 % permit 6%
Employer Matching as a Percent 80 % match based on a specified percent; of these,
of Employee Contribution 20 % match 49% or less of the employee's
contribution
60 % match 50% of the employee's
contribution
20 % match 100% of the employee's
contribution
20 % match varies by service
Eligibility 100 % have immediate eligibility 80 % have immediate eligibility
10 % are based on service only
10 % are based on age and service
Vesting 100 % are full and immediate 25 % are based on service; of these,
100 % have full vesting after 5 years of service
75 % are full and immediate
Covered Compensation 100 % are non bonus-paying 44 % credit bonuses as compensation
33 % do not credit bonuses as compensation
23 % are non bonus-paying
457 Plan 88 % have a plan 6 % have a plan has a plan
18 % provide an employer match 0 % provide an employer match does not provide an employer match
Nonqualified Plan 3 % have a plan 38 % have a plan; of these,
67 % provide an excess benefit plan (to remove
compensation and Section 415 limits)
33 % provide a supplemental executive
retirement plan (SERP)
Covered Compensation 73 % credit bonuses as compensation
27 % do not credit bonuses as compensation
Employer Contribution 25 % contribute 2.5% or less
25 % contribute 2.6% to 5.0%
15 % contribute 5.1% to 7.5%
19 % contribute 7.6% to 10.0%
16 % contribute more than 10.0%
Page 22

Appendix E PREVALENCE OF BENEFITS PRACTICES
HOLIDAYS AND VACATIONS
Western Public Sector Organizations General Market Organizations State of Idaho
HOLIDAYS
Total (Fixed and Floating) 100 % provide holidays; of these, 99 % provide holidays; of these, provides 10 total holidays
(may include PTO days) 2 % provide 8 or 9 holidays 17 % provide fewer than 8 holidays
20 % provide 10 holidays 23 % provide 8 or 9 holidays
33 % provide 11 holidays 25 % provide 10 holidays
33 % provide 12 holidays 15 % provide 11 holidays
12 % provide 13 or more holidays 8 % provide 12 holidays
12 % provide 13 or more holidays
Floating Holidays 69 % provide floating holidays or personal holidays; 62 % provide floating holidays or personal holidays; does not provide
of these, of these,
58 % provide 1 day 34 % provide 1 day
32 % provide 2 days 29 % provide 2 days
8 % provide 3 days 25 % provide 3 days
2 % provide 4 days 7 % provide 4 days
5 % provide 5 or more days
VACATIONS
Vacation Days 54 % provide 11-14 days at 2 years of service 63 % provide 10 days at 2 years of service 2 years - 12 days
(may include PTO days) 42 % provide 15 days at 5 years of service 64 % provide 15 days at 5 years of service 5 years - 15 days
46 % provide 16-19 days at 10 years of service 21 % provide 15 days at 10 years of service 10 years - 18 days
17 % provide 20 days at 10 years of service 53 % provide 20 days at 10 years of service 15 years - 21 days
17 % provide 20 days at 20 years of service 62 % provide 20 days at 15 years of service 20 years - 21 days
50 % provide 21-24 days at 15 years of service 39 % provide 20 days at 20 years of service maximum - 21 days
16 % provide a maximum of 20 days 29 % provide a maximum of 20 days
33 % provide a maximum of 21-24 days 33 % provide a maximum of 25 days
Sabbatical/Long Service Vacation 14 % provide 8 % provide does not provide
Special Executive Vacation Schedule 27 % provide special vacation schedules for executives; 30 % provide special vacation schedules for executives;
of these, of these,
50 % are based on the regular schedule with a 33 % are based on the regular schedule with a
minimum amount based on position minimum amount based on position
50 % provide a separate vacation schedule 14 % are based on the regular schedule plus
extra vacation
53 % provide a separate vacation schedule
Page 23
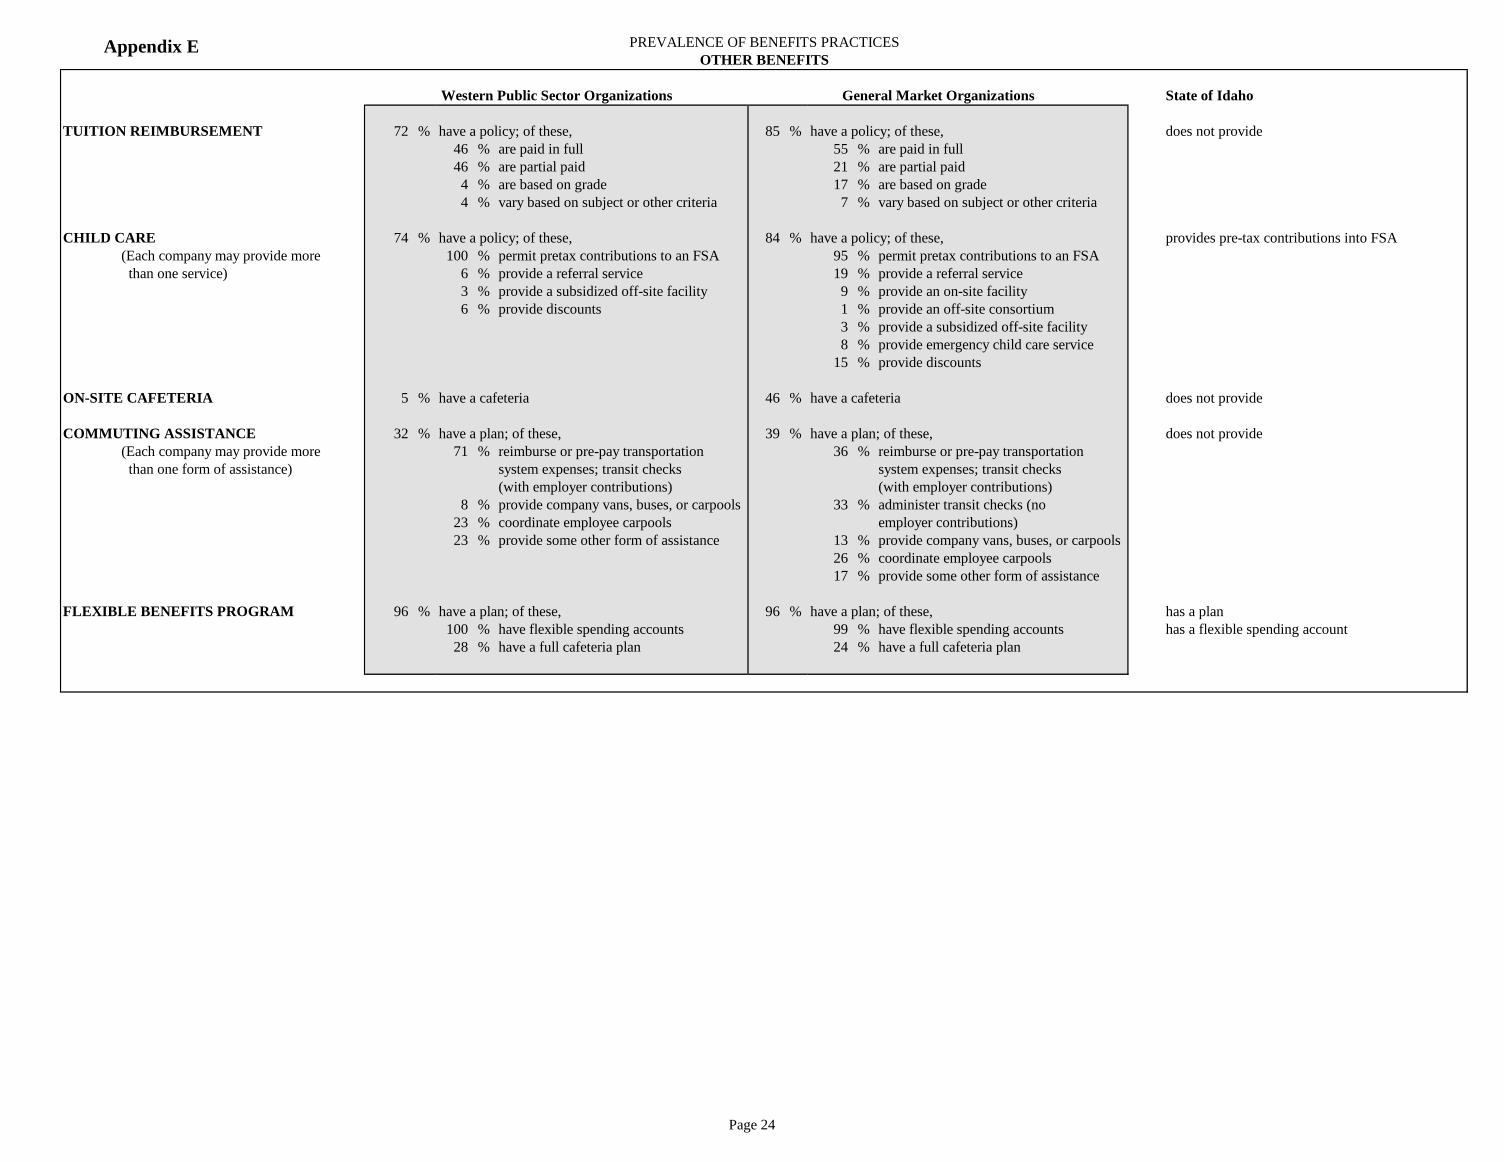
Appendix E PREVALENCE OF BENEFITS PRACTICES
OTHER BENEFITS
Western Public Sector Organizations General Market Organizations State of Idaho
TUITION REIMBURSEMENT 72 % have a policy; of these, 85 % have a policy; of these, does not provide
46 % are paid in full 55 % are paid in full
46 % are partial paid 21 % are partial paid
4 % are based on grade 17 % are based on grade
4 % vary based on subject or other criteria 7 % vary based on subject or other criteria
CHILD CARE 74 % have a policy; of these, 84 % have a policy; of these, provides pre-tax contributions into FSA
(Each company may provide more 100 % permit pretax contributions to an FSA 95 % permit pretax contributions to an FSA
than one service) 6 % provide a referral service 19 % provide a referral service
3 % provide a subsidized off-site facility 9 % provide an on-site facility
6 % provide discounts 1 % provide an off-site consortium
3 % provide a subsidized off-site facility
8 % provide emergency child care service
15 % provide discounts
ON-SITE CAFETERIA 5 % have a cafeteria 46 % have a cafeteria does not provide
COMMUTING ASSISTANCE 32 % have a plan; of these, 39 % have a plan; of these, does not provide
(Each company may provide more 71 % reimburse or pre-pay transportation 36 % reimburse or pre-pay transportation
than one form of assistance) system expenses; transit checks system expenses; transit checks
(with employer contributions) (with employer contributions)
8 % provide company vans, buses, or carpools 33 % administer transit checks (no
23 % coordinate employee carpools employer contributions)
23 % provide some other form of assistance 13 % provide company vans, buses, or carpools
26 % coordinate employee carpools
17 % provide some other form of assistance
FLEXIBLE BENEFITS PROGRAM 96 % have a plan; of these, 96 % have a plan; of these, has a plan
100 % have flexible spending accounts 99 % have flexible spending accounts has a flexible spending account
28 % have a full cafeteria plan 24 % have a full cafeteria plan
Page 24

Appendix E PREVALENCE OF BENEFITS PRACTICES
EXECUTIVE PERQUISITES
Western Public Sector Organizations General Market Organizations State of Idaho
Split Dollar Life Insurance 0 % provide 7 % provide
Key Person Life Insurance 0 % provide 10 % provide
Waiver of Insurance Waiting Periods 0 % provide 5 % provide
Excess Personal Liability Insurance 3 % provide 8 % provide
Executive Retiree Medical 4 % provide 8 % provide
Apartments/Houses/Suites 14 % provide 3 % provide
Voluntary Nonqualified Deferred Compensation 7 % provide 57 % provide
Employment Contracts 24 % provide 48 % provide
Golden Parachutes 0 % provide 15 % provide
Executive Severance Pay Practice 14 % provide 54 % provide
Athletic/Fitness Club Membership 7 % provide 11 % provide
Country Club Membership 7 % provide 19 % provide
Luncheon Club Membership 0 % provide 7 % provide
Executive Dining Room 0 % provide 2 % provide
Company Cars or Car Allowance 57 % provide 62 % provide
Cellular Phones 50 % provide 75 % provide
Chauffeur 3 % provide 8 % provide
Executive Parking 25 % provide 31 % provide
Company Aircraft 0 % provide 25 % provide
Paid Spouse Travel Expenses 4 % provide 11 % provide
Personal Financial Counseling and Tax
Preparation Services 0 % provide 44 % provide
Personal Legal Services 3 % provide 6 % provide
Executive Flexible Benefits Plan 0 % provide 9 % provide
Home Office Equipment 15 % provide 23 % provide
Sabbatical 12 % provide 5 % provide
Executive Coaching 0 % provide 20 % provide
Dependent College Tuition 15 % provide 0 % provide
Page 25