st. mary catholic school massey, ontario · st. mary catholic school massey, ontario project no.:...
TRANSCRIPT
LEVEL I ENERGY AUDIT
ST. MARY CATHOLIC SCHOOL
MASSEY, ONTARIO
Project No.: 13M86-13 Date: May 30, 2014 Revision: 0

Document No.: 13M86-13/R001 2 of 27
Executive Summary
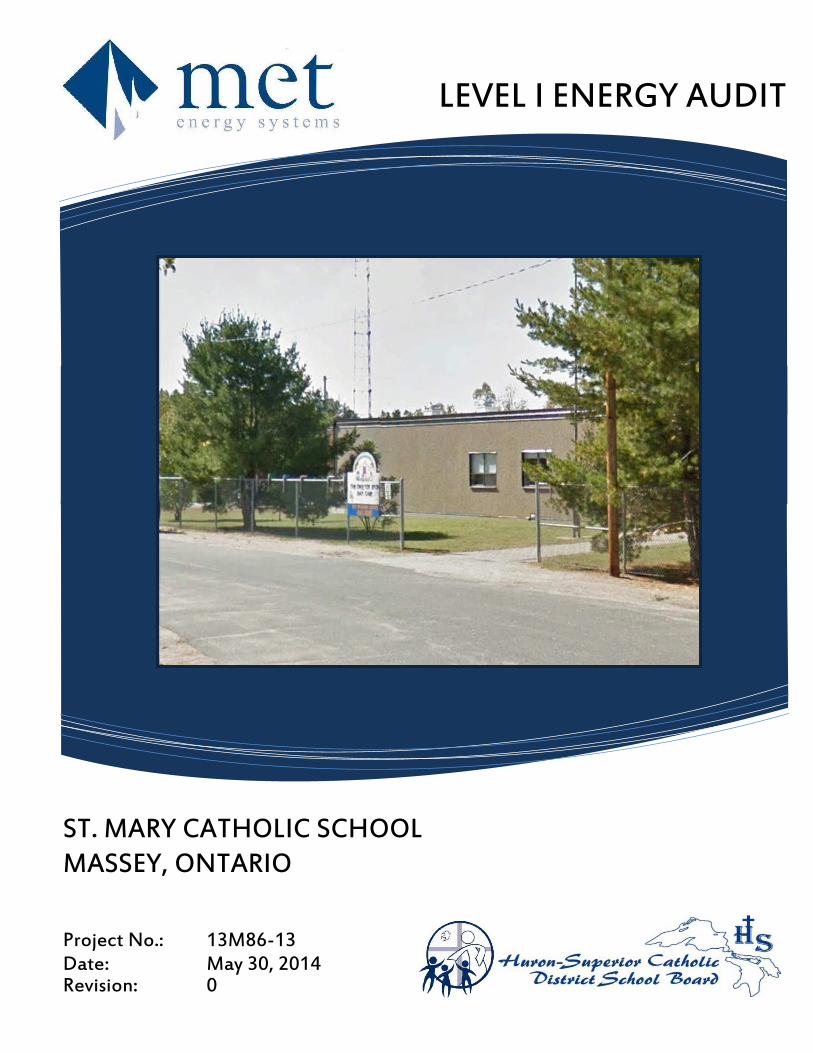
This report presents the findings of the energy efficiency audit of the St. Mary Catholic School located at 270 Algoma Street in Massey Ontario. The building houses an elementary level school and has an approximate floor area of 18,513 sq. ft. The review focused on the identifying the current building conditions and energy consumption of building services including lighting, heating, ventilation, air conditioning, and domestic hot water. Electricity is the only source of energy in use at the facility. Total energy use is summarized in Table 1 below.
Table 1 – Annual Energy Use Summary
Energy Type Consumption (GJ) Annual Cost Consumption
per Ft 2 Cost per Ft 2
Electricity 993 $ 41,103 0.054 $ 2.22 Total 993 $ 41,103 0.054 $ 2.22
When St. Mary is compared to various other HSCDSB schools in the area it is the lowest energy per square foot consumers among all the full time buildings. This is because the most aspects of the building and equipment have been renovated and maintained properly. Based on the findings of this review, the building was found to be in excellent condition and there are few upgrades that identified as providing potential energy efficiency upgrades with feasible payback of the initial capital cost. The most basic measures that should be taken are to replace weather seals and adjust exterior doors to reduce air infiltration. Draft proofing the building is an easy and cost effective way to save on energy. Additionally the gymnasium lighting could be replaced with more efficient LED or T5 highbay light fixtures. Refer to Section 6 of this report for additional recommendations and further details.
Document No.: 13M86-13/R001 3 of 27
Table of Contents
1. INTRODUCTION ........................................................................................................ 4
2. BUILDING OVERVIEW ............................................................................................... 5
3. ENERGY CONSUMPTION ....................................................................................... 12
4. AVAILABLE INCENTIVES ........................................................................................ 21
5. GENERAL RULE FOR ENERGY SAVING ................................................................ 24
6. RECOMMENDED CAPITAL PROJECTS .................................................................. 26
APPENDIX `I’ – PHOTOS
APPENDIX `II’ – FOOR PLAN
APPENDIX `III’ – HSCDSB SCHOOL ENERGY CONSUMPTION SUMMARY

Document No.: 13M86-13/R001 4 of 27
1. Introduction
MET Energy Systems was formed in 1991. Our office is located in Sault Ste. Marie, Ontario. We are committed to providing our clients with the highest quality of service and superior engineered solutions for all of your needs. MET Energy Systems is a comprehensive energy auditing firm. With our vast experience and most advanced energy management techniques, we have had great success in serving our clients to provide cost saving opportunities and minimize capital investment. Our goal is to provide our clients with the most cost effective solutions to reduce overall energy consumption in their buildings. MET Energy Systems has completed many successful energy efficient upgrades for the Huron Superior District Catholic School Board over the past 20 years, which have been very advantageous in preparing the energy Audit and understanding the energy dynamics of the building. The Huron Superior Catholic District School Board (HSCDSB) has commissioned MET Energy Systems (MET) to complete a Level I energy audit of St. Mary Catholic School located at 270 Algoma Street in Massey Ontario. The building houses an elementary school. The purpose of the audit is to conduct a review of the key building elements and energy usage. St. Mary school utilizes electricity supplied by Hydro One as the sole source of energy. The following report summarizes all investigation and findings by MET. Relevant consumption information was provided by the HSCDSB for periods identified within the report. Recommendations have been included for upgrades and repairs to the existing systems. The main focus for potential upgrades is to reduce energy consumption resulting in increased energy efficiency.

Document No.: 13M86-13/R001 5 of 27
2. Building Overview
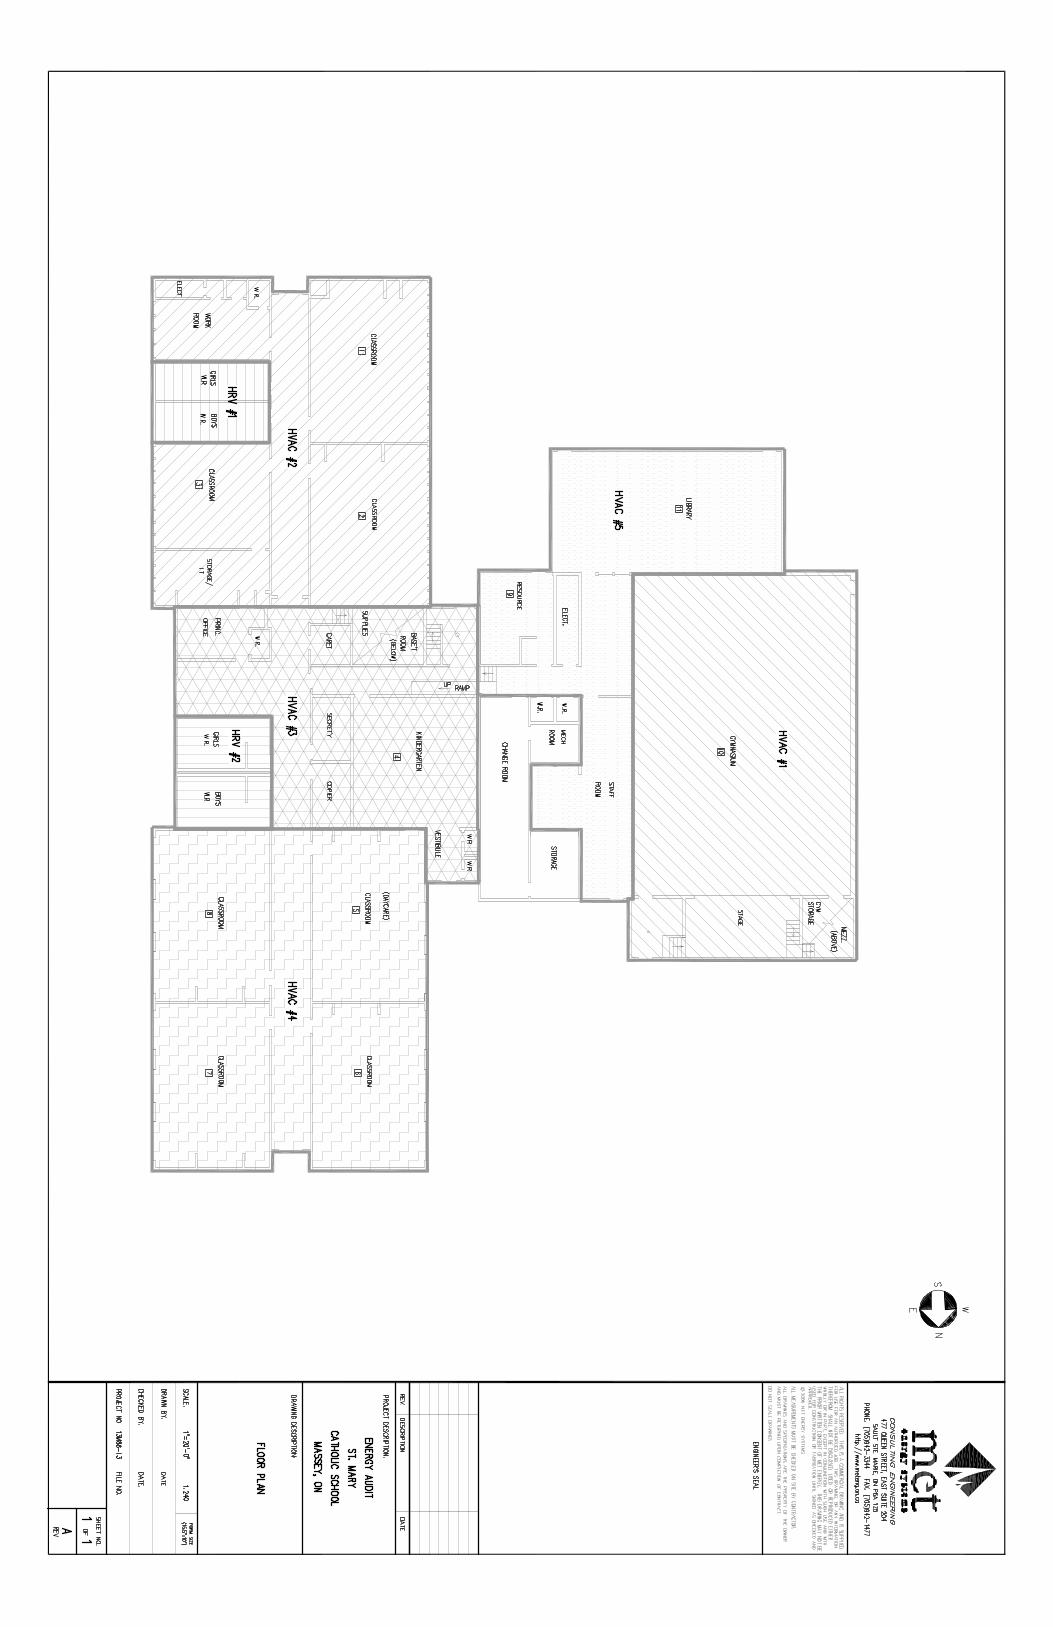
Address: 270 Algoma Street, Massey, Ontario Year Constructed: 1950s Major Additions/Renovations: 1964 – North Wing Addition 1973 – Gymnasium & Library Addition Building Height: Single (1) Storey Gross Building Area: +/- 18,513 sq. ft Streets Facing: 2 Construction: Non-Combustible Exterior Cladding: Brick & Stucco Roof: Sarnafil Sprinklers: None Energy Types Consumed Electricity Heating Energy Electricity Air Conditioning Throughout
2.1 Occupancy Hours
Between the months of September and June the school is generally occupied from 8:00 am to 6:00 pm Monday to Friday with some additional occupancy on weekends for special events. During the months of July and August the building is not occupied apart from cleaning and maintenance staff.
2.2 Building Envelope
The exterior of building appears to be overall generally in good condition. Construction consists of brick and stucco with a flat sarnafil roof. Drafts or air leakage can be a major source of discomfort and heat loss. In winter, drafts can increase your heating costs by up to 25%. However, draft proofing your building is an easy and cost effective way to save on energy. Air can leak in and out of a building through cracks around doors, windows, joints between different materials, pipe and wire penetrations, and other gaps and openings. Ceiling Lights, cracks, electrical and flue penetrations, wall to masonry connections, rim joist or foundations sills, and plumbing penetrations are all potential sources of air leakage. This leakage can increase heating costs and reduce indoor comfort. Air leakage tests vary from simple to complicated engineering tests. Increasing insulation levels and sealing off air leaks produce rapid paybacks in comfort and utility savings. To install and operate energy efficient heating equipment provides energy savings, but if the building envelope doesn’t maintain the heat, the equipment must run longer in order to make up for the temperature difference and the increase efficiency is effectively lost.
2.2.1 Windows Windows throughout the school were replaced in 2000 with double pane units. The caulking around the windows is generally in good condition.

Document No.: 13M86-13/R001 6 of 27
2.2.2 Exterior Doors Most exterior doors are in good condition however the set of doors at the end of the South wing as well as the door in the Staff room have poor weather stripping and are out of alignment as they do not properly close, leaving unsealed gaps. Additionally the bottom threshold on the exterior door in the gymnasium is in poor condition.
2.2.3 Roofing A Sarnafil roofing membrane is used for the entire building and is in good condition.
2.3 Electrical Service
A single 600V, 3P, 600A electrical feed serves the building with the main switchgear and metering equipment installed in the main electrical room located in the West wing near the gymnasium.
2.4 Lighting System
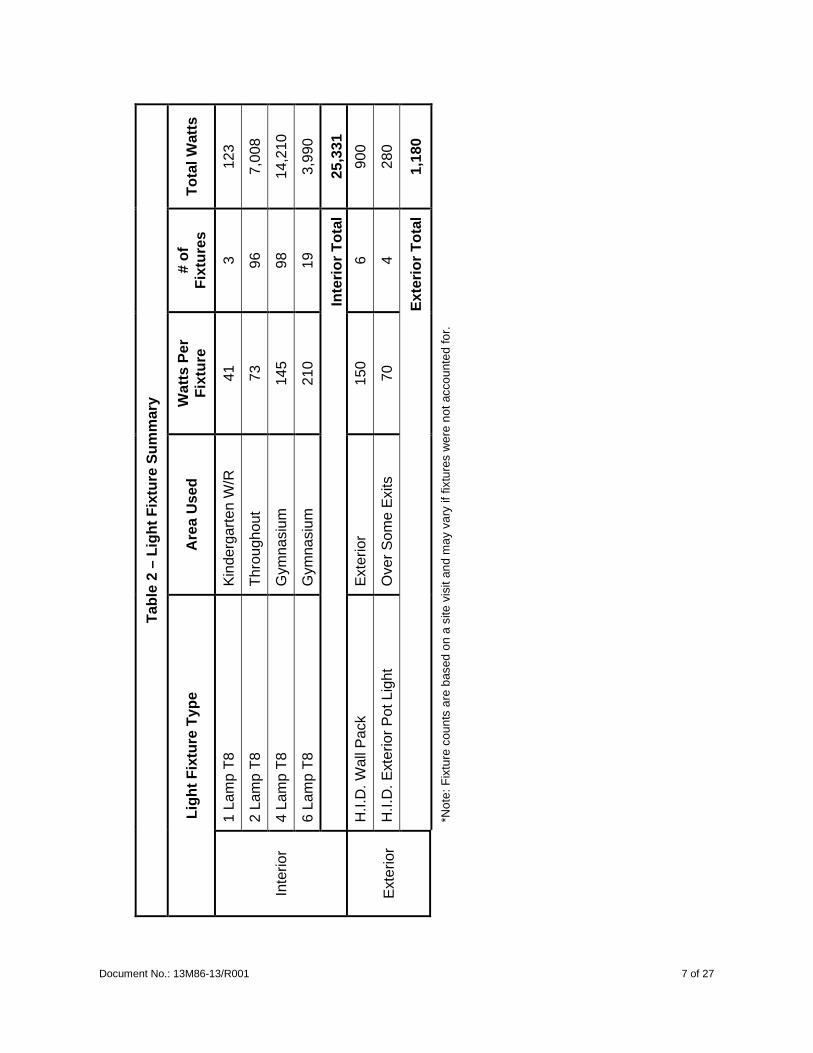
2.4.1 Interior Lighting All Interior lighting was retrofitted to 32W T8 fluorescent light fixtures throughout approximately five years ago. The gymnasium presently utilizes 6 Lamp T8 fixtures. Refer to Table 2 for additional detail.
2.4.2 Lighting Controls The manner in which lights are controlled is sometimes the most important factor when analyzing any lighting system. Even the most efficient type of lamps can show further energy savings when controls such as occupancy sensors and timers are installed. During the previous lighting retrofit occupancy sensors were installed throughout the school to control the interior lighting.
2.4.3 Exterior Lighting
A combination of H.I.D. wall pack fixtures and ceiling mounted H.I.D. pot lights provide exterior site lighting. Exterior lighting is controlled by a time clock and photocell, however these are not always closely monitored by care staff. The time clock is often not set correctly causing an incorrect lighting schedule. At a minimum, the time clock should be monitored and programming be reviewed 3-4 times a year to ensure proper operation Refer to Table 2 for additional detail.
Document No.: 13M86-13/R001 7 of 27
Tab
le 2
– L
ight
Fix
ture
Sum
mar
y
Tot
al W
atts
123
7,00
8
14,2
10
3,99
0
25,3
31
900
280
1,18
0
*Not
e: F
ixtu
re c
ount
s ar
e ba
sed
on a
site
vis
it an
d m
ay v
ary
if fix
ture
s w
ere
not a
ccou
nted
for.
# of
F
ixtu
res
3 96
98
19
Inte
rior
Tot
al
6 4
Ext
erio
r T
otal
Wat
ts P
er
Fix
ture
41
73
145
210
150
70
Are
a U
sed
Kin
derg
arte
n W
/R
Thr
ough
out
Gym
nasi
um
Gym
nasi
um
Ext
erio
r
Ove
r S
ome
Exi
ts
Ligh
t Fix
ture
Typ
e
1 La
mp
T8
2 La
mp
T8
4 La
mp
T8
6 La
mp
T8
H.I.
D. W
all P
ack
H.I.
D. E
xter
ior
Pot
Lig
ht
Inte
rior
Ext
erio
r
Document No.: 13M86-13/R001 8 of 27
2.4.4 Lighting Power Usage Based on the information from Table 2 the total watts per square foot for the interior lighting was calculated as 1.37 W/ft2. By comparison, the latest edition of the ASHRAE 90.1 standard calls for lighting density of 0.87 W/ft2 for new construction of schools. Though these guidelines only apply to new construction, they are a good value for existing installations to strive for. ASHRAE standards for exterior lighting that apply for this property are based on area of the parking lots / driveways, linear measurement of building facade, and number of entrances. Currently there is 1,180W of exterior lighting; based on the calculation criteria outlined in the standard, ASHRAE allows for 2,973 W of exterior lighting. Though the current power usage is below the allowable it should be noted that the current lighting is concentrated in areas and does not provide proper lighting to all areas, resulting in a skewed result.
2.5 Heating Ventilation & Air Conditioning System ( HVAC)
The current HVAC distribution system consists of rooftop air handling units for fresh air, primary space heat and air conditioning. There are also an assortment of electrical radiators and force flow heaters for secondary heating. The five rooftop units are located around the building. Table 3 is a summary of the major HVAC equipment.

Document No.: 13M86-13/R001 9 of 27
Tab
le 3
– H
VA
C E
quip
men
t Sum
mar
y
Age
5 5 5 5 5 5 5 9 15
Rat
ing
4,40
0 C
FM
, 80k
W
Hea
t, 1
1 T
ons
of
Coo
ling
3,60
0 C
FM
, 50k
W
Hea
t, 9
Ton
s of
C
oolin
g
Unk
now
n C
FM
, 50k
W
Hea
t, U
nkno
wn
tons
of
Coo
ling
Unk
now
n C
FM
, 50k
W
Hea
t, U
nkno
wn
tons
of
Coo
ling
Unk
now
n C
FM
, 50k
W
Hea
t, U
nkno
wn
tons
of
Coo
ling
800
CF
M
800
CF
M
40 G
al
208V
, 300
0W
40 G
al
208V
, 300
0W
Ser
ial #
Unk
now
n
Unk
now
n
Unk
now
n
Unk
now
n
Unk
now
n
Unk
now
n
Unk
now
n
Unk
now
n
Unk
now
n
Mod
el
RN
-011
-4-0
-B
A02
-17A
RN
-009
-4-0
-B
A02
-15A
RN
-009
-4-0
-B
A02
-15A
RN
-009
-4-0
-B
A02
-15A
RN
-009
-4-0
-B
A02
-15A
815D
D
815D
D
152E
TE
-3F
7M
CD
6822
0RT
973
Man
ufac
ture
r
AA
ON
AA
ON
AA
ON
AA
ON
AA
ON
Life
brea
th
Life
brea
th
Gia
nt
Sta
te S
elec
t
Des
crip
tion
Roo
ftop
Air
Han
dlin
g U
nit c
/w E
lect
ric H
eat
Roo
ftop
Air
Han
dlin
g U
nit c
/w E
lect
ric H
eat
Roo
ftop
Air
Han
dlin
g U
nit c
/w E
lect
ric H
eat
Roo
ftop
Air
Han
dlin
g U
nit c
/w E
lect
ric H
eat
Roo
ftop
Air
Han
dlin
g U
nit c
/w E
lect
ric H
eat
Hea
t Rec
over
y V
entil
ator
Hea
t Rec
over
y V
entil
ator
Ele
ctric
Dom
estic
Hot
W
ater
Tan
k
Ele
ctric
Dom
estic
Hot
W
ater
Tan
k
Are
a S
erve
d
Gym
nasi
um
Sou
th W
ing
Adm
inis
trat
ion
/ Kin
derg
arte
n
Nor
th W
ing
Libr
ary
Sou
th W
ing
Was
hroo
ms
Nor
th W
ing
Was
hroo
ms
Nor
th &
Sou
th
Win
gs
Wes
t Win
g
Tag
HV
AC
#1
HV
AC
#2
HV
AC
#3
HV
AC
#4
HV
AC
#5
HR
V
#1
HR
V
#2
HW
T-1
HW
T-2
Document No.: 13M86-13/R001 10 of 27
2.5.1 Air Handling Units 2.5.1.1 HVAC #1
HVAC #1 is a rooftop unit located above the Gymnasium. HVAC #1 is an AAON unit with an 80kW electric heating element as well as 11 tons of air conditioning to provide fresh air and heating/cooling for the gymnasium. This unit is in good condition.
2.5.1.2 HVAC #2
Servicing the South wing is HVAC #2, a rooftop unit located above the South wing corridor. HVAC #2 is an AAON unit with a 50kW electric heating element as well as 9 tons of air conditioning to provide fresh air and heating/cooling. This unit is in good condition.
2.5.1.3 HVAC #3
HVAC #3 is a rooftop unit located above the administration area. HVAC #3 is an AAON unit with a 50kW electric heating element as well as 9 tons of air conditioning to provide fresh air and heating/cooling for the administration area and kindergarten classroom. This unit is in good condition.
2.5.1.4 HVAC #4
Servicing the North wing is HVAC #4, a rooftop unit located above the North wing corridor. HVAC #4 is an AAON unit with a 50kW electric heating element as well as 9 tons of air conditioning to provide fresh air and heating/cooling. This unit is in good condition.
2.5.1.5 HVAC #5
HVAC #5 is a rooftop unit located above the Library. HVAC #5 is an AAON unit with a 50kW electric heating element as well as 9 tons of air conditioning to provide fresh air and heating/cooling for the Library. This unit is in good condition.
2.5.1.6 HRV #1
There is an 800 CFM Heat Recovery Ventilator (HRV) manufactured by Lifebreath located in the ceiling space above the South wing washrooms. This HRV provides required exhaust from the washrooms while recovering a portion of the heat before it is discharged.

Document No.: 13M86-13/R001 11 of 27
2.5.1.7 HRV #2 There is an 800 CFM Heat Recovery Ventilator (HRV) manufactured by Lifebreath located in the ceiling space above the North wing washrooms. This HRV provides required exhaust from the washrooms while recovering a portion of the heat before it is discharged.
2.5.2 Exhaust Fans
Individual ceiling mounted exhaust fans are installed in the Kindergarten and staff washrooms as well as the main electrical room and the caretaker’s room. These exhaust fans are operated with manual wall switches.
2.5.3 Radiators & Entrance Heaters Throughout the school electric radiators are used to provide secondary space heating. There are electric baseboard heaters installed in the small washrooms. Entrance heaters in the corridors are wall mounted electric force flow heaters
2.5.4 Controls A wide range of functions within a facility can be programmed and monitored with a Building Automation System (BAS). Mechanical Systems throughout the building will operate more efficiently and economically. Easy to operate controls can decrease your energy costs. Today’s technology offers a long list of features, which can be used to maximize energy savings through central control and monitoring of all systems.
There is an existing remote accessible Carrier Comfort Network (CCN) controls system in place to control the building’s rooftop units and associated VAV boxes. These controls were upgraded roughly five years ago at the same time that the rooftop units were upgraded. The existing controls systems appear well implemented and currently have scheduling programmed for the operation of the rooftop units.
2.6 Domestic Hot Water
Domestic hot water for the school is produced by two electric hot water tanks. The tanks that are currently installed are both 40 gal. 208V, 3000W. One is a Giant model 152ETE-3F7M and the other is a State Select model CD68220RT973. One tank is located in the basement below the South wing supplies room while the other is in the West wing mechanical room. There is currently a domestic hot water recirculation system set up on the South wing HWT only.
Document No.: 13M86-13/R001 12 of 27
3. Energy Consumption
Energy consumption information was obtained from the HSCDSB for a one year period. These readings were taken from invoices provided by the school board for the period indicated. There are no meters in place to monitor energy usage.
3.1 Electricity
3.1.1 Existing Consumption
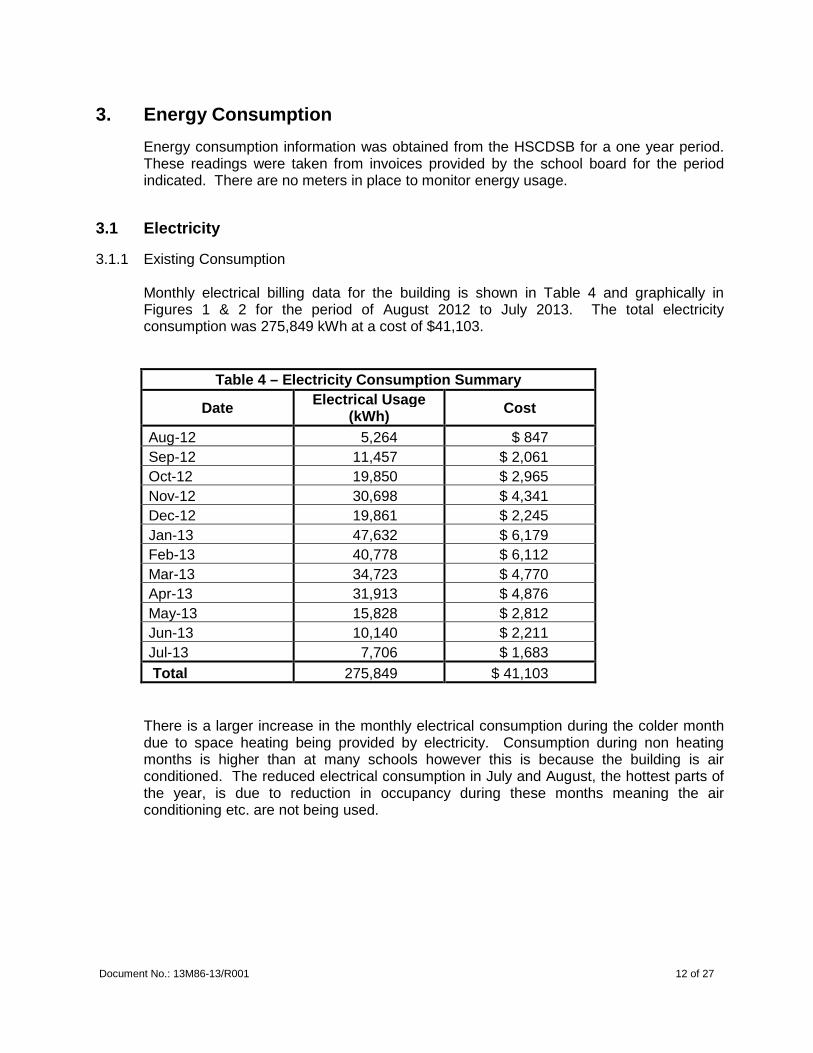
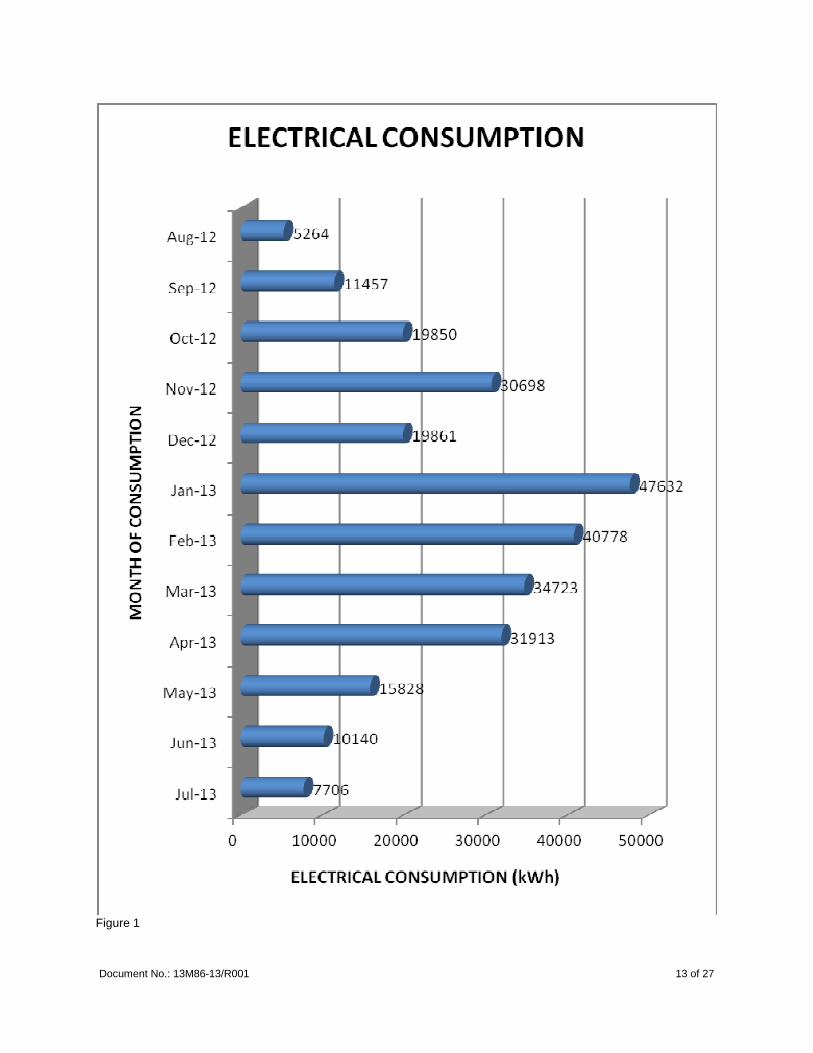
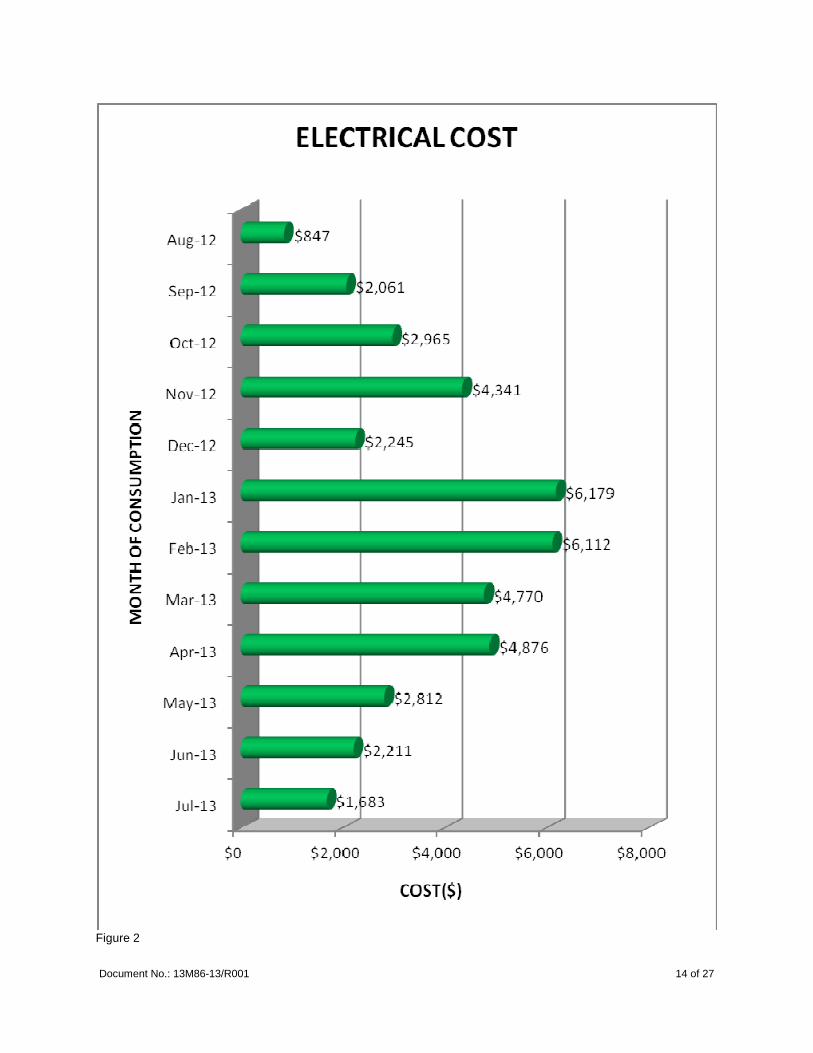
Monthly electrical billing data for the building is shown in Table 4 and graphically in Figures 1 & 2 for the period of August 2012 to July 2013. The total electricity consumption was 275,849 kWh at a cost of $41,103.
Table 4 – Electricity Consumption Summary
Date Electrical Usage (kWh) Cost
Aug-12 5,264 $ 847 Sep-12 11,457 $ 2,061 Oct-12 19,850 $ 2,965 Nov-12 30,698 $ 4,341 Dec-12 19,861 $ 2,245 Jan-13 47,632 $ 6,179 Feb-13 40,778 $ 6,112 Mar-13 34,723 $ 4,770 Apr-13 31,913 $ 4,876 May-13 15,828 $ 2,812 Jun-13 10,140 $ 2,211 Jul-13 7,706 $ 1,683 Total 275,849 $ 41,103
There is a larger increase in the monthly electrical consumption during the colder month due to space heating being provided by electricity. Consumption during non heating months is higher than at many schools however this is because the building is air conditioned. The reduced electrical consumption in July and August, the hottest parts of the year, is due to reduction in occupancy during these months meaning the air conditioning etc. are not being used.
Document No.: 13M86-13/R001 13 of 27
Figure 1
Document No.: 13M86-13/R001 14 of 27
Figure 2

Document No.: 13M86-13/R001 15 of 27
3.1.2 Electricity Rates
Costs shown in this report reflect 2012/2013 electrical cost rates for Hydro One. These rates have remained relatively consistent in the past ten years however significant rate increases have been proposed for implementation in over the next three years. Figure 3 shows a record of the changing electricity rates since 2006 as recorded by the Ontario Energy Board.
Figure 3 – Historical Electricity Rates from Ontario Energy Board
Smart meters have been implemented for electricity metering. A smart meter is a meter that adds timing to usage information, which can facilitate a consumer to take advantage of time-of-use and seasonal electrical energy rates, as well as provide critical peak pricing data to the customer. TOU billing results in consumers being charged different rates for their usage depending on time of day and day of week, and thus should shift their consumption patterns to save money. Customers will pay according to what they use and when they use it. And those who conserve will not subsidize those who do not. When customers are charged based on time-of-use, they have an incentive to shift load or reduce load from peak periods when electricity costs more. This can be done in some areas, but in buildings such as a school it is not possible to shift a load to off peak hours.
Document No.: 13M86-13/R001 16 of 27
3.2 Water Consumption
Water usage for this building is not currently metered and therefore could not be analyzed for this building.
3.3 Building Energy Consumption Summary
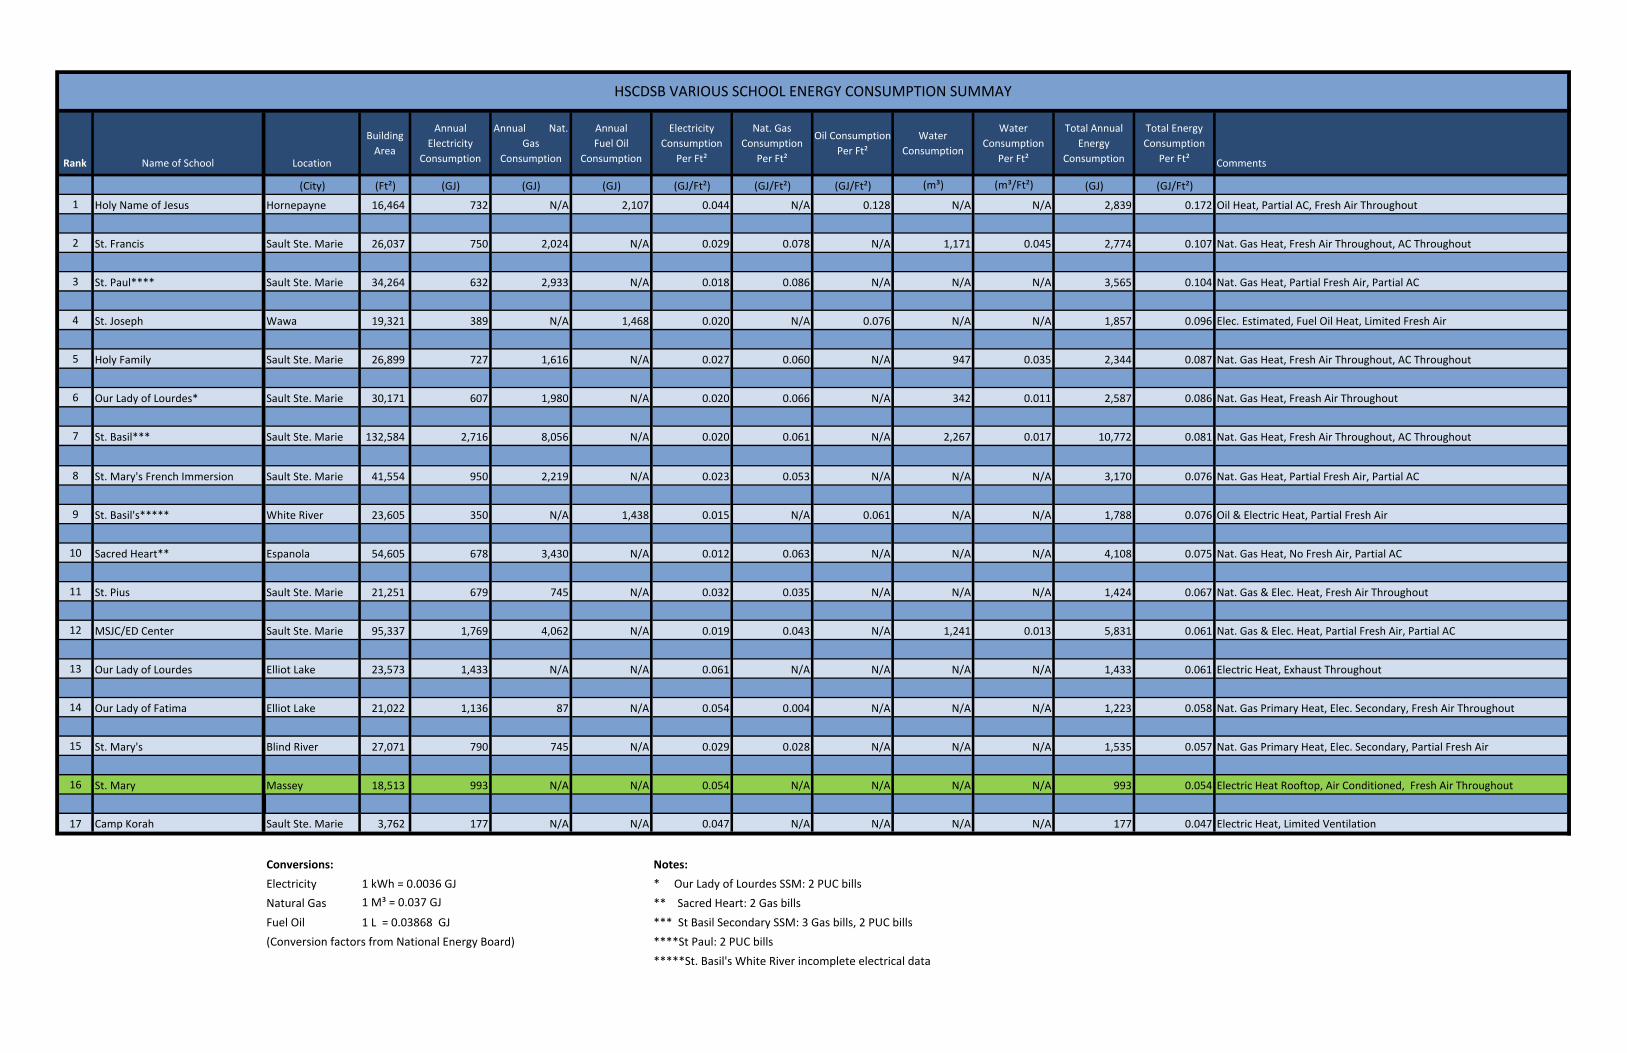
Using the consumption data above it was determined that the total yearly energy consumption of the school is 0.054 GJ per sq. ft. Based on the utility costs at the time of the data collection the yearly energy operating cost for the school is $ 2.22 per sq. ft. Compared to other HSCDSB schools from the same area St. Mary school has the lowest per square foot energy consumption of all the full time schools. (Refer to Appendix III for a summary of HSCDSB school energy consumptions.) The electrical consumption is among the largest per square foot only because the school is heated/cooled exclusively with electricity.
3.4 Energy Types & Their Costs
The following is a summary of various energy sources and their comparative costs. Energy costs are constantly fluctuating; costs shown below are based on utility costs as of April 2014. Efficiency values used in the comparison are based on typical equipment specifications. Oil fired equipment has advanced significantly in the past ten years and as such operating costs are shown using the most common efficiency of 83% as well as with high efficiency (97%) equipment. However, oil is still the most expensive form of energy today. With current time of use billing for electricity costs for electricity usage are shown for on-peak, mid-peak, and off-peak rates. Although it is important to reduce the high peak cost of electricity this is not possible to do at a school that is primarily used during peak electricity times.
Document No.: 13M86-13/R001 17 of 27
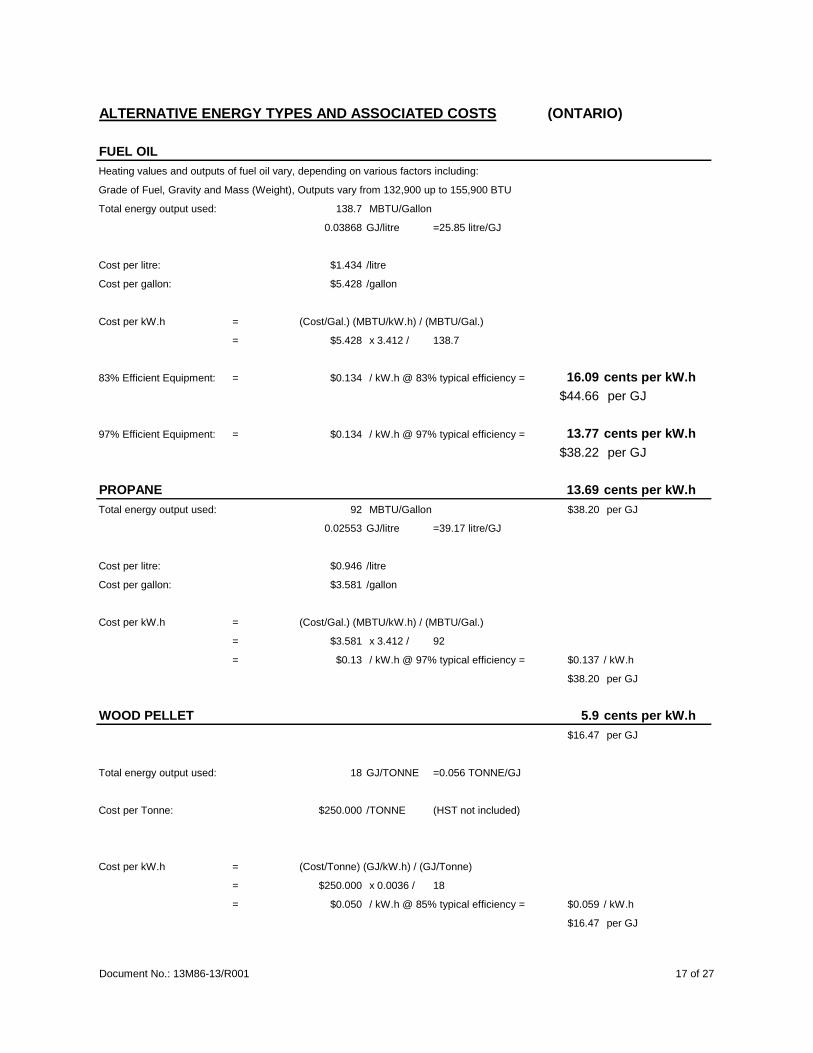
ALTERNATIVE ENERGY TYPES AND ASSOCIATED COSTS (ONTARIO)
FUEL OIL Heating values and outputs of fuel oil vary, depending on various factors including:
Grade of Fuel, Gravity and Mass (Weight), Outputs vary from 132,900 up to 155,900 BTU
Total energy output used: 138.7 MBTU/Gallon
0.03868 GJ/litre =25.85 litre/GJ
Cost per litre: $1.434 /litre
Cost per gallon: $5.428 /gallon
Cost per kW.h = (Cost/Gal.) (MBTU/kW.h) / (MBTU/Gal.)
= $5.428 x 3.412 / 138.7
83% Efficient Equipment: = $0.134 / kW.h @ 83% typical efficiency = 16.09 cents per kW.h$44.66 per GJ
97% Efficient Equipment: = $0.134 / kW.h @ 97% typical efficiency = 13.77 cents per kW.h$38.22 per GJ
PROPANE 13.69 cents per kW.hTotal energy output used: 92 MBTU/Gallon $38.20 per GJ
0.02553 GJ/litre =39.17 litre/GJ
Cost per litre: $0.946 /litre
Cost per gallon: $3.581 /gallon
Cost per kW.h = (Cost/Gal.) (MBTU/kW.h) / (MBTU/Gal.)
= $3.581 x 3.412 / 92
= $0.13 / kW.h @ 97% typical efficiency = $0.137 / kW.h
$38.20 per GJ
WOOD PELLET 5.9 cents per kW.h$16.47 per GJ
Total energy output used: 18 GJ/TONNE =0.056 TONNE/GJ
Cost per Tonne: $250.000 /TONNE (HST not included)
Cost per kW.h = (Cost/Tonne) (GJ/kW.h) / (GJ/Tonne)
= $250.000 x 0.0036 / 18
= $0.050 / kW.h @ 85% typical efficiency = $0.059 / kW.h
$16.47 per GJ
Document No.: 13M86-13/R001 18 of 27
NATURAL GAS (not including monthly charge) 3.24 cents per kW.hConversion Factor: 37.5 MJ/m3 $9.00 per GJ
0.0375 GJ/m3 = 26.67 m3/GJ
Basic cost of gas = $0.17817 /m3
Price Adjustment = $0.02015 /m3
Transportation to Union Gas = $0.05094 /m3
Storage $0.02276
Delivery to you = $0.05535 /m3 (based on next 20,000 m3)
Total cost of gas to you $0.32738 /m3
Cost per kW.h = (Cost/m3) (MJ/kW.h) / (MJ/m3)
= $0.33 x 3.6 / 37.5
= $0.031 / kW.h @ 97% typical efficiency = $0.032 / kW.h
$9.00 per GJ
ELECTRICITY (SSM PUC) (plus demand charges.) Avg: 13.72 cents per kW.hGENERAL SERVICE (UNDER 50 Kw) $38.11 per GJ
Distribution Charge (per kW/h):= $0.01510 /kWh .0036 GJ/kWh
Transmission Network charge $0.00550 /kWh 277.78 kWh/GJ
Wholesale Market Service Charge= $0.00560 /kWh $38.11 per GJ
Debt Retirement Charge $0.00200 /kWh
Total Fixed Cost per kW.h = $0.02820
Off-Peak Cost ($0.072 per kWh) = $0.10020 /kWh
Mid-Peak Cost ($0.109 per kWh) = $0.13720 /kWh
On-Peak Cost ($0.0129 per kWh) = $0.15720 /kWh

Document No.: 13M86-13/R001 19 of 27
3.5 Alternate Energy
There are a few different types of alternate energy sources that are available. Most of the presented items have a high initial capital cost causing an extended payback. Preliminary investigations of most of these items do not justify the capital expenditure required. If changes were made to incentive programs some of the following energy sources may be re-visited.
3.5.1 Solar Energy
Although Solar Electric Energy is making resurgence, it is still difficult to make it result in a reasonable payback. As of January 2014 the current provincial subsidy through the microFIT program was significantly reduced. For a typically 10kW solar system the program involves selling power back to the grid for a rate of 39.6 cents/kWh. The current structure entails signing a twenty year contract. With the capital cost involved in the installation payback on a typical solar electric system is 12-15 years. Alternately, solar panels (heat collectors) placed on the roof each building or somewhere else on a southern exposure and interacting with a heat exchanger, can be used to pre-heat looped hot water piping, heating the water before it circulates back to the storage type hot water tank. Although the payback would be long term due to high initial construction costs, energy will be reduced due to less energy required to initially heat 40 degree Fahrenheit entering cold water. Instead of the initial cold water entering the storage tank to be heated, pre-heated water now enters the solar tank after passing through a heat exchanger. Pre-heating domestic hot water can provide saving of up to forty (40%) percent of your hot water heating bill. However due to the relatively low volume of hot water used in the school this does not represent a viable amount of savings.
3.5.2 Ground Source Heat Pumps (GSHP)
Ground Source Heat Pumps are a method of reclaiming energy from the earth through use of Wells drilled into the ground to exchange energy. These systems can be either open or closed loop. Heat pumps incorporate a heat exchanger, which allows the absorption or rejection of heat energy into the fluid passing through the piping system. With the capital cost of ground source heat pump systems and the required realty for installing ground loops, it is not feasible to install one of these systems at this site. Also, a GSHP system requires additional maintenance and technical knowledge to operate. For these reasons, ground source heat pumps have not become popular.
3.5.3 Wind Energy Although the capital cost of Wind Energy has decreased in the past 10 years, it is still not feasible to provide power from a wind turbine without a very large incentive. It is much more economical and convenient to utilize power off the grid. Additionally, there is maintenance required that would increase the cost of utilizing this equipment. A 3000 Watt Wind Turbine is currently in excess of $20,000 installed cost. Also, being located in a central urban location, building zone restrictions eliminate the possibility of erecting a windmill.
Document No.: 13M86-13/R001 20 of 27
3.6 Daylight Harvesting
Daylight harvesting is the use of natural sunlight to reduce the need for artificial lighting in buildings. With a daylight harvesting system, electric lighting is increased or decreased in correlation to the amount of natural light present. Photosensors are installed to constantly assess the level of sunlight present within the space and dimmable light fixtures are controlled based on the readings provided. The key challenge of daylight harvesting is to provide stable indoor lighting levels even though natural sunlight is not a stable light source. Under the right conditions a properly designed and executed daylight harvesting system can reduce electrical lighting use by 35-50%. One of the major barriers to effective implementation in retrofit applications is that daylight penetration is limited by the existing windows due to the window-to-wall ratio. Orientation of windows also greatly affects the amount of usable daylight, causing only a portion of a building to be able to fully benefit. Additionally, optimal daylighting design is much more than creating window openings to allow daylight into a building. The energy balance alone often creates conflict between reduced electric lighting and the need to cool the building to compensate for the additional solar heat. Furthermore, truly sustainable design needs to go beyond energy savings to include the human elements of the workplace, including glare, views and distractions. The complexity and constantly changing nature of daylight requires dynamic solutions to simultaneously optimize these factors. Based on the aspects discussed above, implementation of a beneficial and cost effective daylight harvesting system is difficult in retrofit situation for schools like that reviewed by this audit.
Document No.: 13M86-13/R001 21 of 27
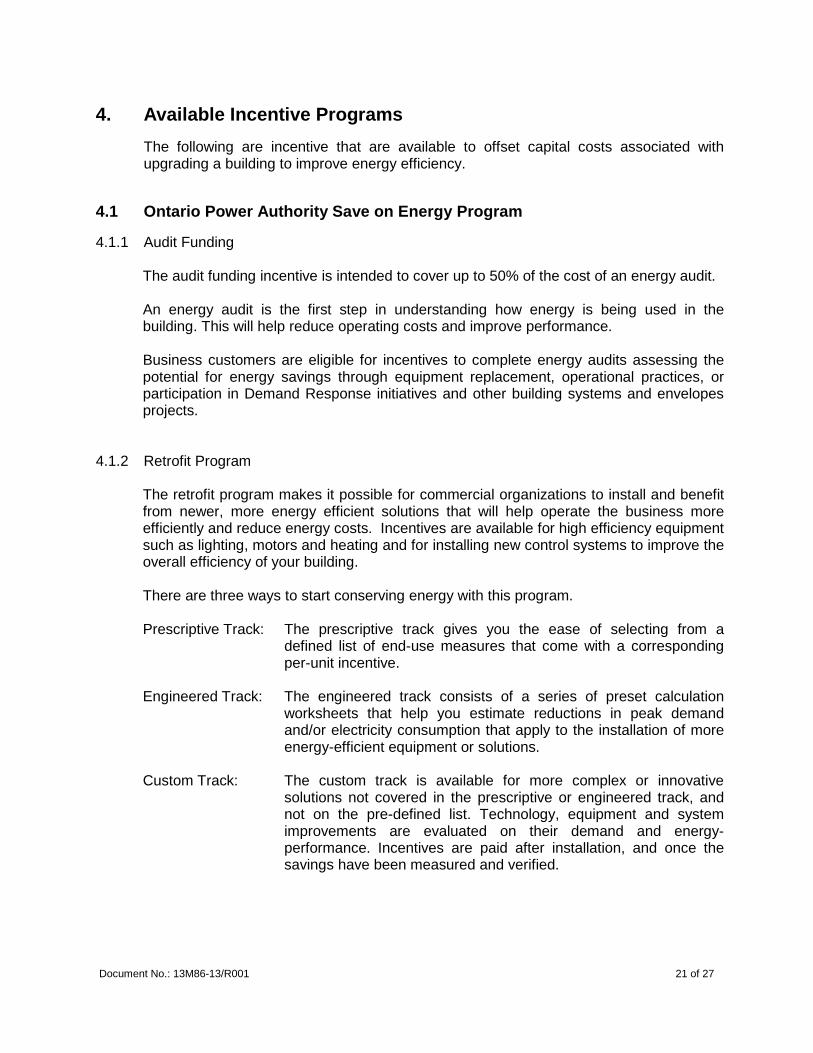
4. Available Incentive Programs
The following are incentive that are available to offset capital costs associated with upgrading a building to improve energy efficiency.
4.1 Ontario Power Authority Save on Energy Program
4.1.1 Audit Funding
The audit funding incentive is intended to cover up to 50% of the cost of an energy audit. An energy audit is the first step in understanding how energy is being used in the building. This will help reduce operating costs and improve performance. Business customers are eligible for incentives to complete energy audits assessing the potential for energy savings through equipment replacement, operational practices, or participation in Demand Response initiatives and other building systems and envelopes projects.
4.1.2 Retrofit Program
The retrofit program makes it possible for commercial organizations to install and benefit from newer, more energy efficient solutions that will help operate the business more efficiently and reduce energy costs. Incentives are available for high efficiency equipment such as lighting, motors and heating and for installing new control systems to improve the overall efficiency of your building. There are three ways to start conserving energy with this program. Prescriptive Track: The prescriptive track gives you the ease of selecting from a
defined list of end-use measures that come with a corresponding per-unit incentive.
Engineered Track: The engineered track consists of a series of preset calculation
worksheets that help you estimate reductions in peak demand and/or electricity consumption that apply to the installation of more energy-efficient equipment or solutions.
Custom Track: The custom track is available for more complex or innovative
solutions not covered in the prescriptive or engineered track, and not on the pre-defined list. Technology, equipment and system improvements are evaluated on their demand and energy-performance. Incentives are paid after installation, and once the savings have been measured and verified.
Document No.: 13M86-13/R001 22 of 27
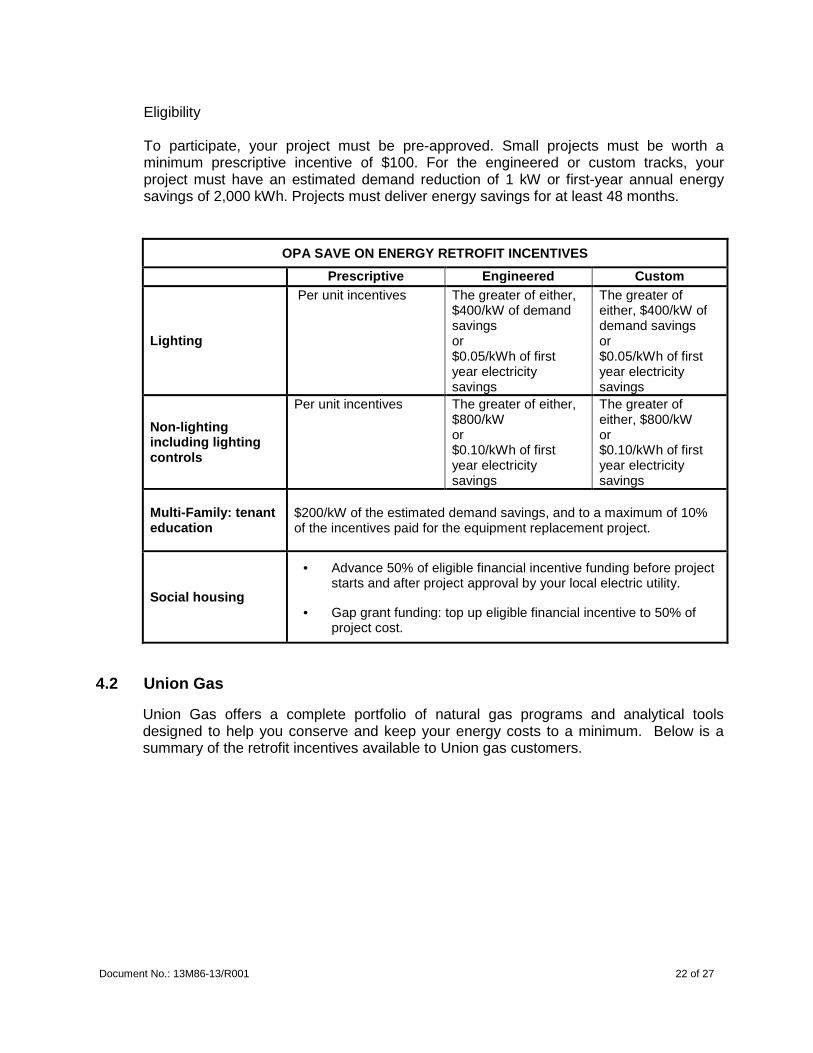
Eligibility To participate, your project must be pre-approved. Small projects must be worth a minimum prescriptive incentive of $100. For the engineered or custom tracks, your project must have an estimated demand reduction of 1 kW or first-year annual energy savings of 2,000 kWh. Projects must deliver energy savings for at least 48 months.
OPA SAVE ON ENERGY RETROFIT INCENTIVES
Prescriptive Engineered Custom
Lighting
Per unit incentives The greater of either, $400/kW of demand savings or $0.05/kWh of first year electricity savings
The greater of either, $400/kW of demand savings or $0.05/kWh of first year electricity savings
Non-lighting including lighting controls
Per unit incentives The greater of either, $800/kW or $0.10/kWh of first year electricity savings
The greater of either, $800/kW or $0.10/kWh of first year electricity savings
Multi-Family: tenant education
$200/kW of the estimated demand savings, and to a maximum of 10% of the incentives paid for the equipment replacement project.
Social housing
• Advance 50% of eligible financial incentive funding before project starts and after project approval by your local electric utility.
• Gap grant funding: top up eligible financial incentive to 50% of project cost.
4.2 Union Gas
Union Gas offers a complete portfolio of natural gas programs and analytical tools designed to help you conserve and keep your energy costs to a minimum. Below is a summary of the retrofit incentives available to Union gas customers.

New
Demand Control Ventilation (DCV) System
Office
• $100 per RTU/MUA <2500 sq. ft. ventilated w/CO2 Sensor
• $200 per RTU/MUA ≥ 2500 sq. ft. ventilated w/CO2 Sensor
• $50 per unit to service provider
- Building used for office & retail purposes only
- Does not include newly built common areas in malls, office
breakrooms & telephone/data entry areas with zones > 500 sq.ft.
- Buildings using ERV/HRV are not eligible
- Customers are not eligible if CO2 sensors replace existing
occupancy-based ventilation controls.(i.e. occupant counting/
detecting systems/hourly daytime scheduling)
- Newly installed condensing MUAs with VFD / 2 speeds eligible
for MUA incentive only. Existing MUAs with VFD, 2 speeds
or economizers that add CO2 sensors without above restriction
are eligible for DCV incentive.
- Include CO2 Sensor manufacturer & model on application
- See Account Manager for eligibility requirements.
Heat Recovery Ventilator (HRV)
documentation from the engineer stating it's not
Healthcare & Multi-Unit Residential Facilities
• $400 per unit - 500 to 1999 cfm
• $700 per unit - ≥ 2000 cfm
• $100 per unit to service provider
- For all eligible new construction HRVs ≥ 5000 cfm,
• $400 per unit
All Other Commerical/Industrial Facilities
• $100 per unit to service provider
- Space, water or combination heating.
• $100 per unit to service provider
with CO2 Sensor
Retail
• $2,600 per unit - ≥ 5000 cfm
Improved Efficiency
• $4,500 per unit - ≥ 1000 MBtu/hr
Condensing Make-up Air (MUA)
• $1,400 per unit - 1000 - 4999 cfm
• $100 per unit to service provider
- Single zone system only
required by Ontario Building Code must be provided
Efficiency + 2 Speed • $1,000 per unit - 1000 - 4999 cfm
• $1,800 per unit - ≥ 5000 cfm
• $1,200 per unit - ≥ 5000 cfm
• $500 per unit - 1000 - 4999 cfm
• $100 per unit to service provider
required by Ontario Building Code must be provided.
2014 Commercial / Industrial Energy EfficiencyIncentive Programs
Efficiency + Variable Frequency Drive (VFD)
Incentives are available to Commercial & Industrial customers that have a valid Union Gas account(s) a nd Service providers (Architectural Consultant, Com mercial Builder, Commercial HVAC, Engineering Consultant, ESCO's).
Enersmart Customer & Service Provider Incentives
Condensing Boiler
• $600 per unit - up to 299 MBtu/hr
• $1,500 per unit - 300 to 999 MBtu/hr
Energy Recovery Ventilator (ERV)
• $600 per unit - < 2000 cfm
• $1,500 per unit - ≥ 2000 cfm
• $150 per RTU/MUA <5000 sq. ft. ventilated w/CO2 Sensor
• $350 per RTU/MUA ≥ 5000 sq. ft. ventilated w/CO2 Sensor
- For all eligible new construction ERVs ≥ 5,000 cfm,
documentation from the engineer stating it's not
Please note this program has been discontinued for 2014.
Effective January 24th, 2014, we will no longer accept
installations completed after January 24th, 2014.
For more information or to discuss this program • $300 per unit 20 - 300 Mbtu/hr
• $100 per unit to HVAC Contractors only
Approval of payments is at the sole discretion of U nion Gas. Applications are subject to verification and audit and must meet Ontario Building Code requi rements.
www.uniongas.com/accountmanagerFor more details contact the Account Manager in you r area at :
Incentives apply to new construction and replacemen t.
Multi-unit Residential buildings must be more than 5 units, unless otherwise stated by Union Gas.Union Gas reserves the right to alter or discontinu e the program without notice.
cancellation, please send us a message using our online
email form. • $50 per unit to service provider
• $200 per unit
• $350 per unit
Infrared Heater
unit additional incentive until December 1, 2014.
• $1,500 per unit Shipping Door ≥ 100 sq. ft.
Special Hotel & Laundromat Incentive - Up to $800 per
applications for Non-Condensing High Efficiency Boiler
• $100 per unit to service provider
- Tankless water heaters not eligible
• $100 per unit to service provider
• $6,000 per unit WE > 120 lbs cap & ≥ 260K lbs/yr
Non-Condensing High Efficiency Boiler
Demand Control Kitchen Ventilation
- Washer Extractor = WE, Capacity = Cap
- Purchase & rental/leased (min 10 yr) units are eligible
100 - 1000 gal/day/tank • $100 per unit - Undercounter Type (HT & LT)
Condensing Gas Water Heater
• $1,000 per unit Shipping Door 64 to 99 sq. ft.
• $100 per unit to service provider
buildings only
Energy Star Dishwasher
Air Curtains
Laundry Equipment with Ozone
• $1,500 per unit WE ≤ 120 lbs cap & ≥ 200K lbs/yr
• $1,000 per unit WE ≤ 120 lbs cap & 100-199K lbs/yr • $250 per unit Pedestrian Door 48 to 95 sq. ft.
Destratification Fan
-High Temperature = HT, Low Temperature = LT
• $400 per unit - Rack Conveyor - Single Tank (HT)
• $400 per unit - Rack Conveyor - Multi Tank (HT)
• $50 per unit to service provider
-Purchases & rental units are eligible
- 20' or 24' fans
- Minimum of 25' ceiling and forced air space heating
- Warehouse, Manufacturing, Industrial or Retail
Energy Star Fryer
• $500 per unit Pedestrian Door ≥ 96 sq. ft.
• $1,200 per unit - < 5,000 cfm • $3,000 per unit - 5000 - 9999 cfm
• $4,000 per unit - 10000 - 15000 cfm
• $100 per unit to service provider
• $100 per unit - Stationary Rack, Door Type (HT & LT)
• $100 per unit - Stationary Rack, Single Rack (HT & LT)
• $1,300 per unit
• $100 per unit to service provider
012014tb

Document No.: 13M86-13/R001 24 of 27
5. General Rules For Energy Saving
The following are general recommendations for reduction of energy that involve very little capital cost or time to accomplish. Some have been outlined in more detail throughout the report.
5.1 Reduce Lighting Use
Energy costs can be reduced by the elimination of unnecessary lighting through better control and proper task lighting to meet your present requirements. Turning switches off and carefully monitoring use of outside lighting can provide significant savings.
5.2 Lower Heating Temperature
Keeping the daytime temperature at the lower edge of the comfort range will prove an economical measure. This is often difficult with tenants as they do not pay for the cost of utilities directly.
5.3 Temperature Setback
Lowering the temperature when the areas are vacant will produce substantial energy and dollar savings. Even programmable thermostats on some of the electric heat will reduce utility costs.
5.4 Reduce Ventilation Hours
Operating the ventilation system to match the time and occupancy requirements of a particular area will result in energy and dollar savings. Programming of the make-up air units will result in both oil/natural gas and electric energy savings.
5.5 Shutdown of Computers
Turning all computers off after hours and especially during the summer months will help to reduce unnecessary electrical consumption.
5.6 Staff and Tenant Training
Training Staff on the use of thermostats and turning off lights is all important in reducing energy consumption. It is also critical that the workers understand what each of the thermostats control, and only designated personnel be assigned to change settings.

Document No.: 13M86-13/R001 25 of 27
5.7 Lighting Maintenance Program
All lighting systems experience a decrease in light output and efficiency over time due to lamp lumen depreciation, dirt accumulation, lamp burn out, and luminaire surface depreciation. Overtime, these factors can degrade a system’s efficiency by up to 60%. Thus a properly designed system that maximizes energy savings will eventually fail to perform properly without a solid maintenance program. While most maintenance managers are hesitant to replace lamps that are still operating, group relamping and cleaning can be less expensive than sporadic spot maintenance. A group relamping program performed at 70% of the rated life saves on labor costs over spot relamping and offers and ideal opportunity to clean the fixture. This is especially true of High Intensity Discharge (HID) Fixtures. These fixtures have the tendency tend to burn well beyond their life expectancy consuming the same amount of energy with very little output.
Document No.: 13M86-13/R001 26 of 27
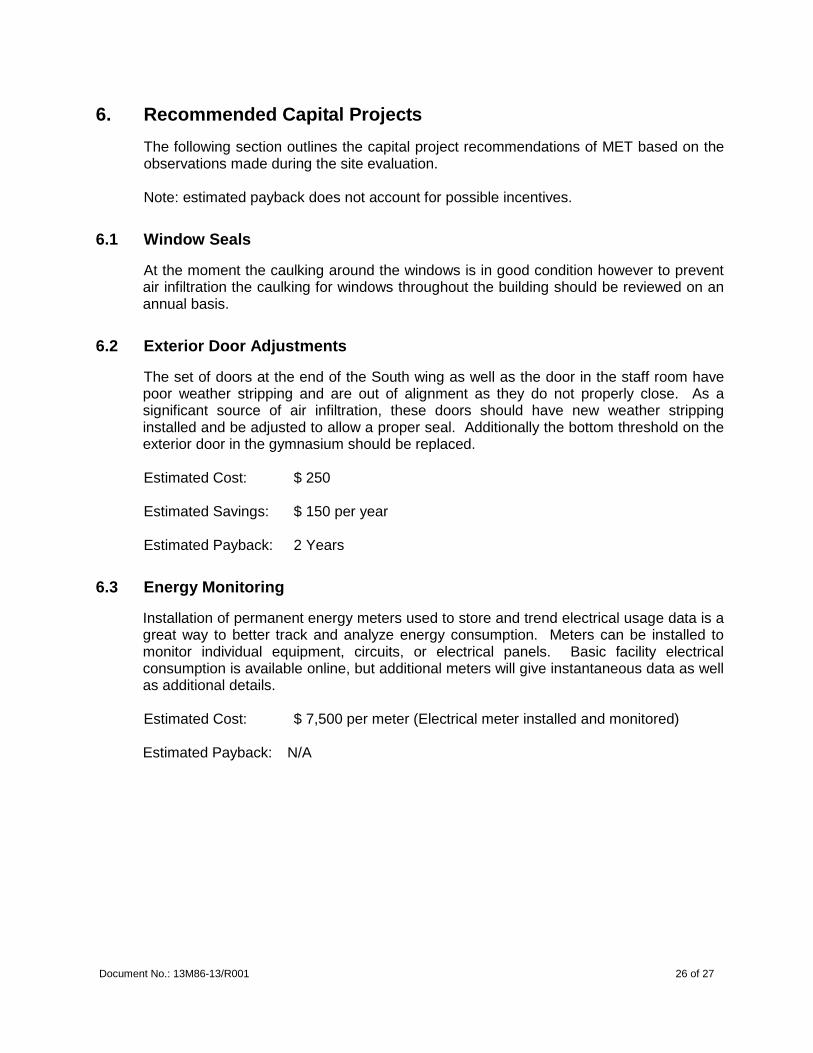
6. Recommended Capital Projects
The following section outlines the capital project recommendations of MET based on the observations made during the site evaluation.
Note: estimated payback does not account for possible incentives.
6.1 Window Seals
At the moment the caulking around the windows is in good condition however to prevent air infiltration the caulking for windows throughout the building should be reviewed on an annual basis.
6.2 Exterior Door Adjustments
The set of doors at the end of the South wing as well as the door in the staff room have poor weather stripping and are out of alignment as they do not properly close. As a significant source of air infiltration, these doors should have new weather stripping installed and be adjusted to allow a proper seal. Additionally the bottom threshold on the exterior door in the gymnasium should be replaced. Estimated Cost: $ 250 Estimated Savings: $ 150 per year Estimated Payback: 2 Years
6.3 Energy Monitoring
Installation of permanent energy meters used to store and trend electrical usage data is a great way to better track and analyze energy consumption. Meters can be installed to monitor individual equipment, circuits, or electrical panels. Basic facility electrical consumption is available online, but additional meters will give instantaneous data as well as additional details. Estimated Cost: $ 7,500 per meter (Electrical meter installed and monitored) Estimated Payback: N/A

Document No.: 13M86-13/R001 27 of 27
6.4 Interior Lighting Retrofit
A common method of reducing energy consumption is the replacement of interior light fixtures with new more efficient models. With all existing lighting being T8 fixtures the best value upgrade is to replace all existing 32W lamps with new lower consumption 28W lamps. This retrofit does not require additional modification of the fixtures. Estimated Cost: $ 3,500 Estimated Savings: $ 2,500 per year Estimated Payback: 1-2 Years
6.5 Redesign of Exterior Lighting
Redesigning and replacing the exterior lighting will provide proper lighting levels as well as allow for use of more efficient light fixtures. LED fixtures are available that provide excellent lighting quality with reduced energy consumption. Additionally, a new standard exterior lighting control should be implemented. An astronomical time clock, photocell and ON/OFF/AUTO switch will enable minimal use of outdoor lighting. An astronomical time clock will automatically adjust when the lights are turned on during different seasons and lengths of day. A GR1400 ‘Blue Box’ manufactured by lighting control and design would cost approximately $2,500 installed and would provide all of these features plus remote control capabilities. Note: proper light levels will require additional fixtures which will increase payback duration. Estimated Cost: $ 8,500 Estimated Savings: $ 800 per year Estimated Payback: 8-12 Years
6.6 Summary
If all the above recommendations are implemented the reduced energy consumption will result in an approximate savings of up to 8%.

Document No.: 13M86-13/R001 Appendix
APPENDIX `I’
Photos

P01 – Building Main Entrance Lighting P02 – Typical Side Entrance
P03 – Electrical Service Equipment P04 – Typical Corridor
P05 – Typical Classroom Ceiling P06 – Library

P07 – Gymnasium Exterior Door Threshold P08 – Gymnasium
P09 – Typical Entrance Heater P10 – Typical AAON Rooftop Unit
P11 – South Wing Hot Water Tank P12 – West Wing Hot Water Tank
Document No.: 13M86-13/R001 Appendix
APPENDIX `II’
Floor Plan

Document No.: 13M86-13/R001 Appendix
APPENDIX `III’
HSCDSB School Energy Consumption Summary
Rank Name of School Location
Building
Area
Annual
Electricity
Consumption
Annual Nat.
Gas
Consumption
Annual
Fuel Oil
Consumption
Electricity
Consumption
Per Ft²
Nat. Gas
Consumption
Per Ft²
Oil Consumption
Per Ft²
Water
Consumption
Water
Consumption
Per Ft²
Total Annual
Energy
Consumption
Total Energy
Consumption
Per Ft² Comments
(City) (Ft²) (GJ) (GJ) (GJ) (GJ/Ft²) (GJ/Ft²) (GJ/Ft²) (m³) (m³/Ft²) (GJ) (GJ/Ft²)
1 Holy Name of Jesus Hornepayne 16,464 732 N/A 2,107 0.044 N/A 0.128 N/A N/A 2,839 0.172 Oil Heat, Partial AC, Fresh Air Throughout
2 St. Francis Sault Ste. Marie 26,037 750 2,024 N/A 0.029 0.078 N/A 1,171 0.045 2,774 0.107 Nat. Gas Heat, Fresh Air Throughout, AC Throughout
3 St. Paul**** Sault Ste. Marie 34,264 632 2,933 N/A 0.018 0.086 N/A N/A N/A 3,565 0.104 Nat. Gas Heat, Partial Fresh Air, Partial AC
4 St. Joseph Wawa 19,321 389 N/A 1,468 0.020 N/A 0.076 N/A N/A 1,857 0.096 Elec. Estimated, Fuel Oil Heat, Limited Fresh Air
5 Holy Family Sault Ste. Marie 26,899 727 1,616 N/A 0.027 0.060 N/A 947 0.035 2,344 0.087 Nat. Gas Heat, Fresh Air Throughout, AC Throughout
6 Our Lady of Lourdes* Sault Ste. Marie 30,171 607 1,980 N/A 0.020 0.066 N/A 342 0.011 2,587 0.086 Nat. Gas Heat, Freash Air Throughout
7 St. Basil*** Sault Ste. Marie 132,584 2,716 8,056 N/A 0.020 0.061 N/A 2,267 0.017 10,772 0.081 Nat. Gas Heat, Fresh Air Throughout, AC Throughout
8 St. Mary's French Immersion Sault Ste. Marie 41,554 950 2,219 N/A 0.023 0.053 N/A N/A N/A 3,170 0.076 Nat. Gas Heat, Partial Fresh Air, Partial AC
9 St. Basil's***** White River 23,605 350 N/A 1,438 0.015 N/A 0.061 N/A N/A 1,788 0.076 Oil & Electric Heat, Partial Fresh Air
10 Sacred Heart** Espanola 54,605 678 3,430 N/A 0.012 0.063 N/A N/A N/A 4,108 0.075 Nat. Gas Heat, No Fresh Air, Partial AC
11 St. Pius Sault Ste. Marie 21,251 679 745 N/A 0.032 0.035 N/A N/A N/A 1,424 0.067 Nat. Gas & Elec. Heat, Fresh Air Throughout
12 MSJC/ED Center Sault Ste. Marie 95,337 1,769 4,062 N/A 0.019 0.043 N/A 1,241 0.013 5,831 0.061 Nat. Gas & Elec. Heat, Partial Fresh Air, Partial AC
13 Our Lady of Lourdes Elliot Lake 23,573 1,433 N/A N/A 0.061 N/A N/A N/A N/A 1,433 0.061 Electric Heat, Exhaust Throughout
14 Our Lady of Fatima Elliot Lake 21,022 1,136 87 N/A 0.054 0.004 N/A N/A N/A 1,223 0.058 Nat. Gas Primary Heat, Elec. Secondary, Fresh Air Throughout
15 St. Mary's Blind River 27,071 790 745 N/A 0.029 0.028 N/A N/A N/A 1,535 0.057 Nat. Gas Primary Heat, Elec. Secondary, Partial Fresh Air
16 St. Mary Massey 18,513 993 N/A N/A 0.054 N/A N/A N/A N/A 993 0.054 Electric Heat Rooftop, Air Conditioned, Fresh Air Throughout
17 Camp Korah Sault Ste. Marie 3,762 177 N/A N/A 0.047 N/A N/A N/A N/A 177 0.047 Electric Heat, Limited Ventilation
Conversions: Notes:
Electricity 1 kWh = 0.0036 GJ * Our Lady of Lourdes SSM: 2 PUC bills
Natural Gas 1 M³ = 0.037 GJ ** Sacred Heart: 2 Gas bills
Fuel Oil 1 L = 0.03868 GJ *** St Basil Secondary SSM: 3 Gas bills, 2 PUC bills
(Conversion factors from National Energy Board) ****St Paul: 2 PUC bills
*****St. Basil's White River incomplete electrical data
HSCDSB VARIOUS SCHOOL ENERGY CONSUMPTION SUMMAY

Rank Name of School Location
Building
Area
Annual
Electricity
Consumption
Annual Nat.
Gas
Consumption
Annual
Fuel Oil
Consumption
Electricity
Consumption
Per Ft²
Nat. Gas
Consumption
Per Ft²
Oil Consumption
Per Ft²
Water
Consumption
Water
Consumption
Per Ft²
Total Annual
Energy
Consumption
Total Energy
Consumption
Per Ft² Comments
(City) (Ft²) (GJ) (GJ) (GJ) (GJ/Ft²) (GJ/Ft²) (GJ/Ft²) (m³) (m³/Ft²) (GJ) (GJ/Ft²)
1 Our Lady of Lourdes Elliot Lake 23,573 1,433 N/A N/A 0.061 N/A N/A N/A N/A 1,433 0.061 Electric Heat, Exhaust Throughout
2 Our Lady of Fatima Elliot Lake 21,022 1,136 87 N/A 0.054 0.004 N/A N/A N/A 1,223 0.058 Nat. Gas Primary Heat, Elec. Secondary, Fresh Air Throughout
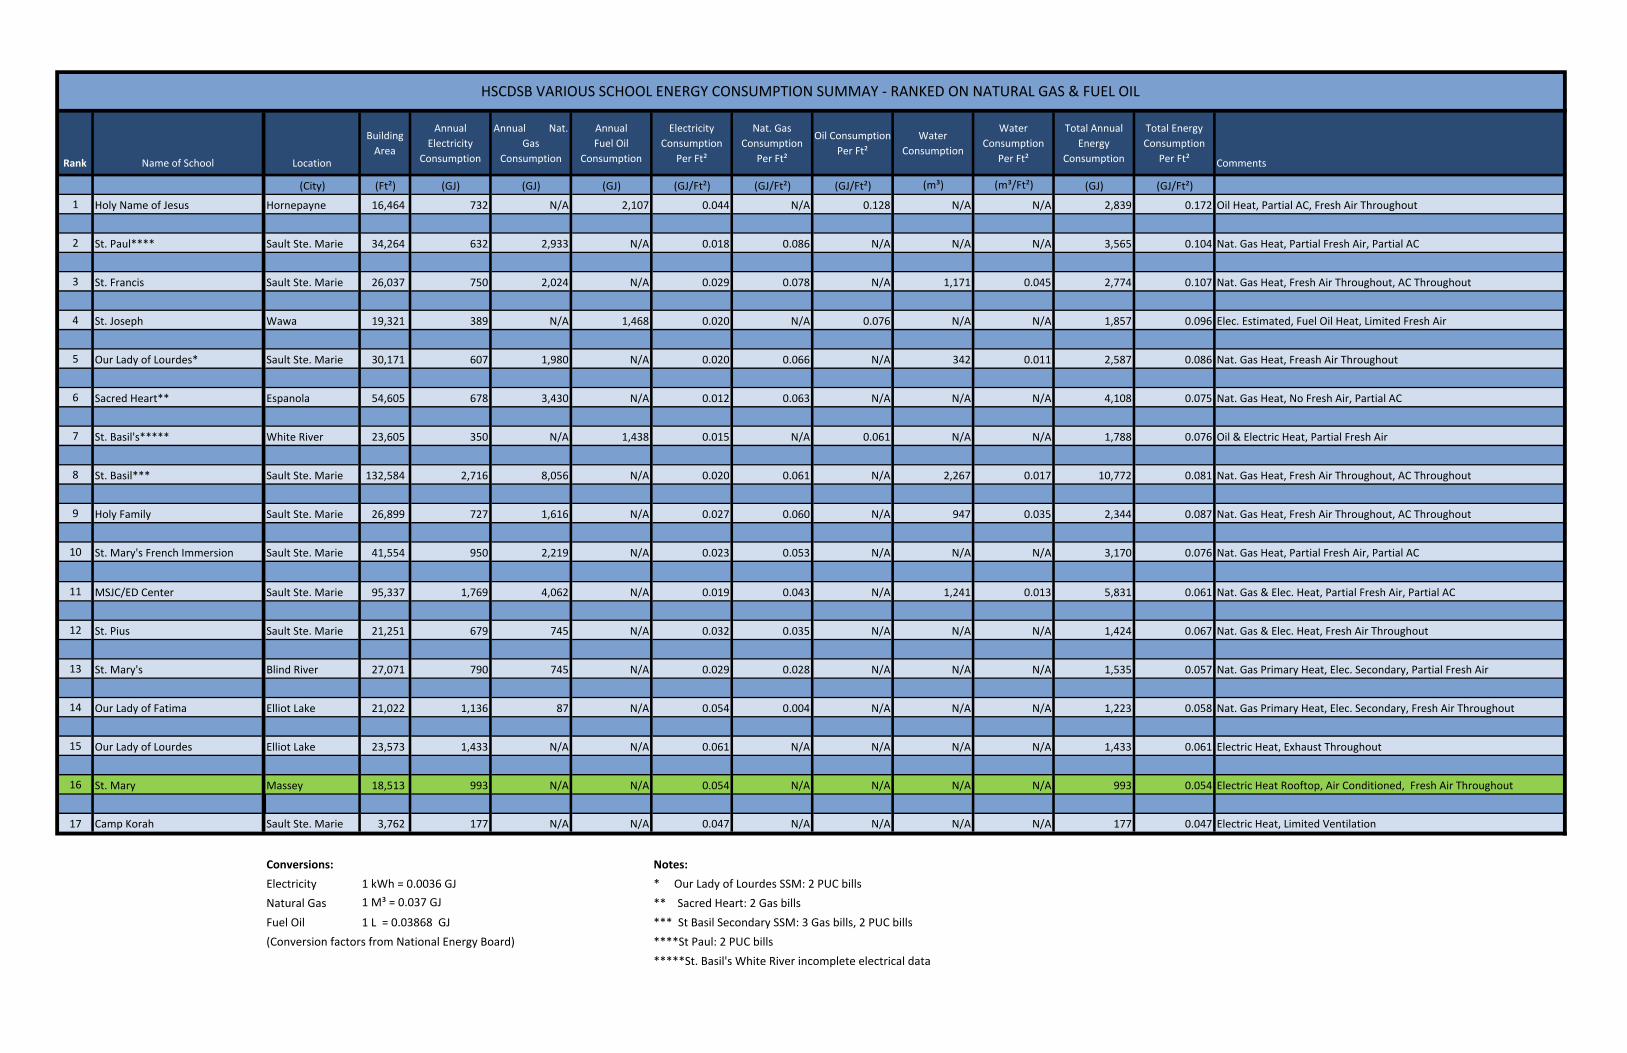
3 St. Mary Massey 18,513 993 N/A N/A 0.054 N/A N/A N/A N/A 993 0.054 Electric Heat Rooftop, Air Conditioned, Fresh Air Throughout
4 Camp Korah Sault Ste. Marie 3,762 177 N/A N/A 0.047 N/A N/A N/A N/A 177 0.047 Electric Heat, Limited Ventilation
HSCDSB VARIOUS SCHOOL ENERGY CONSUMPTION SUMMAY - RANKED ON ELECTRICY
4 Camp Korah Sault Ste. Marie 3,762 177 N/A N/A 0.047 N/A N/A N/A N/A 177 0.047 Electric Heat, Limited Ventilation
5 Holy Name of Jesus Hornepayne 16,464 732 N/A 2,107 0.044 N/A 0.128 N/A N/A 2,839 0.172 Oil Heat, Partial AC, Fresh Air Throughout
6 St. Pius Sault Ste. Marie 21,251 679 745 N/A 0.032 0.035 N/A N/A N/A 1,424 0.067 Nat. Gas & Elec. Heat, Fresh Air Throughout
7 St. Mary's Blind River 27,071 790 745 N/A 0.029 0.028 N/A N/A N/A 1,535 0.057 Nat. Gas Primary Heat, Elec. Secondary, Partial Fresh Air
8 St. Francis Sault Ste. Marie 26,037 750 2,024 N/A 0.029 0.078 N/A 1,171 0.045 2,774 0.107 Nat. Gas Heat, Fresh Air Throughout, AC Throughout
9 Holy Family Sault Ste. Marie 26,899 727 1,616 N/A 0.027 0.060 N/A 947 0.035 2,344 0.087 Nat. Gas Heat, Fresh Air Throughout, AC Throughout
10 St. Mary's French Immersion Sault Ste. Marie 41,554 950 2,219 N/A 0.023 0.053 N/A N/A N/A 3,170 0.076 Nat. Gas Heat, Partial Fresh Air, Partial AC
11 St. Basil*** Sault Ste. Marie 132,584 2,716 8,056 N/A 0.020 0.061 N/A 2,267 0.017 10,772 0.081 Nat. Gas Heat, Fresh Air Throughout, AC Throughout
12 Our Lady of Lourdes* Sault Ste. Marie 30,171 607 1,980 N/A 0.020 0.066 N/A 342 0.011 2,587 0.086 Nat. Gas Heat, Freash Air Throughout
13 St. Joseph Wawa 19,321 389 N/A 1,468 0.020 N/A 0.076 N/A N/A 1,857 0.096 Elec. Estimated, Fuel Oil Heat, Limited Fresh Air
14 MSJC/ED Center Sault Ste. Marie 95,337 1,769 4,062 N/A 0.019 0.043 N/A 1,241 0.013 5,831 0.061 Nat. Gas & Elec. Heat, Partial Fresh Air, Partial AC
15 St. Paul**** Sault Ste. Marie 34,264 632 2,933 N/A 0.018 0.086 N/A N/A N/A 3,565 0.104 Nat. Gas Heat, Partial Fresh Air, Partial AC
16 St. Basil's***** White River 23,605 350 N/A 1,438 0.015 N/A 0.061 N/A N/A 1,788 0.076 Oil & Electric Heat, Partial Fresh Air
17 Sacred Heart** Espanola 54,605 678 3,430 N/A 0.012 0.063 N/A N/A N/A 4,108 0.075 Nat. Gas Heat, No Fresh Air, Partial AC
Conversions: Notes:
Electricity 1 kWh = 0.0036 GJ * Our Lady of Lourdes SSM: 2 PUC bills
Natural Gas 1 M³ = 0.037 GJ ** Sacred Heart: 2 Gas bills
Fuel Oil 1 L = 0.03868 GJ *** St Basil Secondary SSM: 3 Gas bills, 2 PUC bills
(Conversion factors from National Energy Board) ****St Paul: 2 PUC bills
*****St. Basil's White River incomplete electrical data
Rank Name of School Location
Building
Area
Annual
Electricity
Consumption
Annual Nat.
Gas
Consumption
Annual
Fuel Oil
Consumption
Electricity
Consumption
Per Ft²
Nat. Gas
Consumption
Per Ft²
Oil Consumption
Per Ft²
Water
Consumption
Water
Consumption
Per Ft²
Total Annual
Energy
Consumption
Total Energy
Consumption
Per Ft² Comments
(City) (Ft²) (GJ) (GJ) (GJ) (GJ/Ft²) (GJ/Ft²) (GJ/Ft²) (m³) (m³/Ft²) (GJ) (GJ/Ft²)
1 Holy Name of Jesus Hornepayne 16,464 732 N/A 2,107 0.044 N/A 0.128 N/A N/A 2,839 0.172 Oil Heat, Partial AC, Fresh Air Throughout
2 St. Paul**** Sault Ste. Marie 34,264 632 2,933 N/A 0.018 0.086 N/A N/A N/A 3,565 0.104 Nat. Gas Heat, Partial Fresh Air, Partial AC
3 St. Francis Sault Ste. Marie 26,037 750 2,024 N/A 0.029 0.078 N/A 1,171 0.045 2,774 0.107 Nat. Gas Heat, Fresh Air Throughout, AC Throughout
4 St. Joseph Wawa 19,321 389 N/A 1,468 0.020 N/A 0.076 N/A N/A 1,857 0.096 Elec. Estimated, Fuel Oil Heat, Limited Fresh Air
5 Our Lady of Lourdes* Sault Ste. Marie 30,171 607 1,980 N/A 0.020 0.066 N/A 342 0.011 2,587 0.086 Nat. Gas Heat, Freash Air Throughout
6 Sacred Heart** Espanola 54,605 678 3,430 N/A 0.012 0.063 N/A N/A N/A 4,108 0.075 Nat. Gas Heat, No Fresh Air, Partial AC
7 St. Basil's***** White River 23,605 350 N/A 1,438 0.015 N/A 0.061 N/A N/A 1,788 0.076 Oil & Electric Heat, Partial Fresh Air
8 St. Basil*** Sault Ste. Marie 132,584 2,716 8,056 N/A 0.020 0.061 N/A 2,267 0.017 10,772 0.081 Nat. Gas Heat, Fresh Air Throughout, AC Throughout
9 Holy Family Sault Ste. Marie 26,899 727 1,616 N/A 0.027 0.060 N/A 947 0.035 2,344 0.087 Nat. Gas Heat, Fresh Air Throughout, AC Throughout
10 St. Mary's French Immersion Sault Ste. Marie 41,554 950 2,219 N/A 0.023 0.053 N/A N/A N/A 3,170 0.076 Nat. Gas Heat, Partial Fresh Air, Partial AC
11 MSJC/ED Center Sault Ste. Marie 95,337 1,769 4,062 N/A 0.019 0.043 N/A 1,241 0.013 5,831 0.061 Nat. Gas & Elec. Heat, Partial Fresh Air, Partial AC
12 St. Pius Sault Ste. Marie 21,251 679 745 N/A 0.032 0.035 N/A N/A N/A 1,424 0.067 Nat. Gas & Elec. Heat, Fresh Air Throughout
13 St. Mary's Blind River 27,071 790 745 N/A 0.029 0.028 N/A N/A N/A 1,535 0.057 Nat. Gas Primary Heat, Elec. Secondary, Partial Fresh Air
14 Our Lady of Fatima Elliot Lake 21,022 1,136 87 N/A 0.054 0.004 N/A N/A N/A 1,223 0.058 Nat. Gas Primary Heat, Elec. Secondary, Fresh Air Throughout
15 Our Lady of Lourdes Elliot Lake 23,573 1,433 N/A N/A 0.061 N/A N/A N/A N/A 1,433 0.061 Electric Heat, Exhaust Throughout
16 St. Mary Massey 18,513 993 N/A N/A 0.054 N/A N/A N/A N/A 993 0.054 Electric Heat Rooftop, Air Conditioned, Fresh Air Throughout
17 Camp Korah Sault Ste. Marie 3,762 177 N/A N/A 0.047 N/A N/A N/A N/A 177 0.047 Electric Heat, Limited Ventilation
Conversions: Notes:
Electricity 1 kWh = 0.0036 GJ * Our Lady of Lourdes SSM: 2 PUC bills
Natural Gas 1 M³ = 0.037 GJ ** Sacred Heart: 2 Gas bills
Fuel Oil 1 L = 0.03868 GJ *** St Basil Secondary SSM: 3 Gas bills, 2 PUC bills
(Conversion factors from National Energy Board) ****St Paul: 2 PUC bills
*****St. Basil's White River incomplete electrical data
HSCDSB VARIOUS SCHOOL ENERGY CONSUMPTION SUMMAY - RANKED ON NATURAL GAS & FUEL OIL