st. george campus - facilities & services · part i: context o the university of toronto o...
TRANSCRIPT

University of Toronto
St. George Campus
Energy Conservation &
Demand Management Plan
Revised: July 1, 2014

PART I: CONTEXT
o The University of Toronto
o Where We are Going and its Effect to the Built Environment
o St. George Campus - Overview
Profile of Campus Operations
History of Conservation at the St. George Campus
PART II: SUMMARY OF UTILITIES USE
PART III: CONSERVATION & DEMAND PLAN (CDM)
o Qualitative and quantitative goals
Five-year electricity CDM Plan
o Strategic Planning
o Renewables
o Implementation of Plan
o Monitoring & Evaluation
Table of Contents
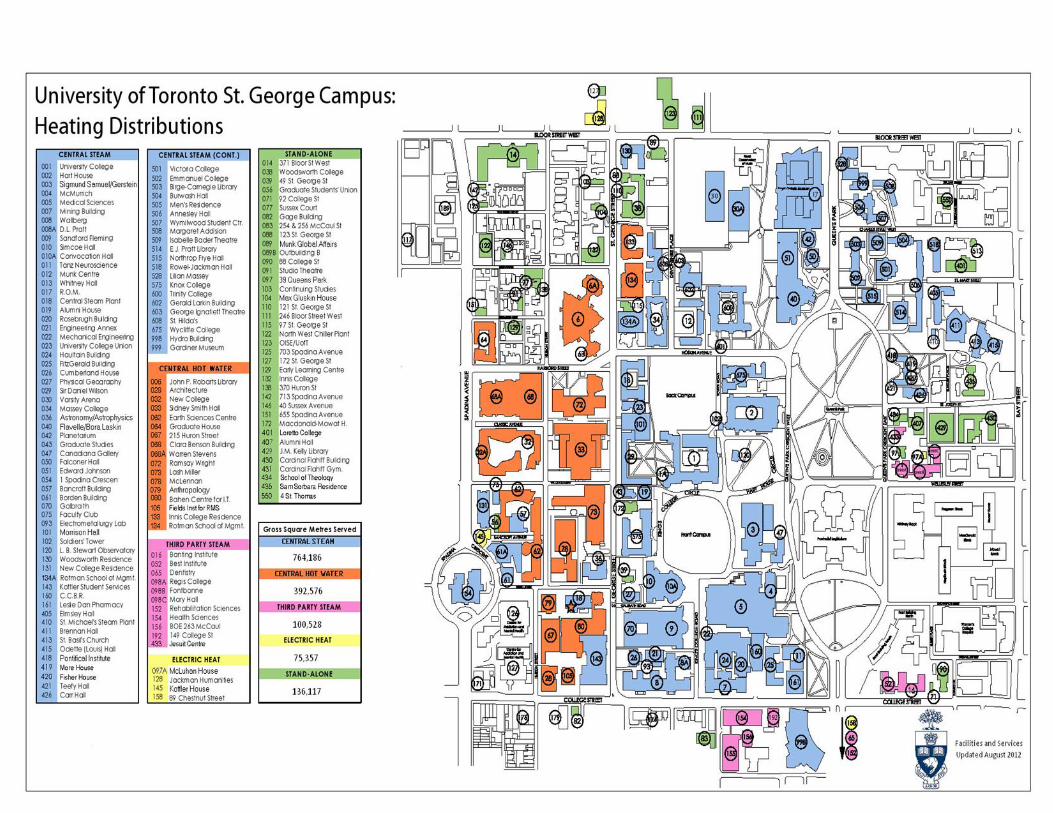
Appendix A:
Campus maps showing District Energy System: Electricity, Heat and
Cooling Source of Supply
Appendix B:
Sustainability Milestones
Appendices
The following report is posted as required by the Green Energy Act, 2009, O. Reg. 397/11.
PART I: CONTEXT The University of Toronto Approaching its second centennial, the University of Toronto is one of the largest Universities in North America and respected as one of the foremost research-intensive universities in the world (http://www.utoronto.ca/). The University has educated hundreds of thousands of outstanding individuals who have gone on to leadership roles around the world and in every walk of life. As well, the University of Toronto enjoys a global reputation in multiple fields of scholarship. This in turn is a credit to the excellence of past and present faculty and staff across all three campuses and in partner institutions, including the great academic hospitals affiliated with the University.
Where we are going as an institution and how will that affect the built environment? Guiding the University’s activities going forward is our academic plan “Towards 2030” (http://www.towards2030.utoronto.ca/). The 2030 document sets out strategic priorities in enrolment, the student experience, the three campuses, funding, and how the university is governed. In this plan, each of the University’s three campuses will be fundamentally altered moving forward. The plan sees the Mississauga and Scarborough campuses significantly growing in undergraduate student population while the St. George campus will grow in terms of graduate students which will be offset, in total population, by a reduction in undergraduate students. Realizing the 2030 plan will result in significant change to the built environment on all three campuses. All campuses will see new buildings being built and old buildings being modified to meet new demands. Notwithstanding the ambitions noted in Towards 2030, it is important to note that all three University of Toronto campuses’ built environments are well below the space standards established by the Council on Ontario Universities (COU). Moving towards the recommended space standards for the University will require the acquisition of more buildings or increased density on the buildings already within the campuses.
Introduction
Page 1

Overview of the University of Toronto’s St. George Campus College and University campuses are unique in terms of the variety and complexity of their facilities operations. Perhaps no other type of organization under one management has a more diverse facility infrastructure. At the St. George campus, in the heart of downtown Toronto, we serve a student population of over 58,000 – one of the largest single campus student populations in North America. Daily occupancy can exceed 75,000 people placing St. George in line with the 75th largest municipality in Canada by population. Due to the sheer size, extensive district energy system, diversity and complexity of the built environment, the St. George Campus is often described as a “city within a city”. We manage over 120 buildings that are widely diverse in age, size, design and function. Building functions include: residences, athletic facilities, lecture halls and classroom buildings, office buildings, high tech research facilities, laboratory facilities, and art galleries. Ages of the buildings range from new facilities to buildings that are 155 years old. Many of our campus buildings have heritage designations with 36 being over one‐hundred years old. Campus buildings vary broadly in scale as well, ranging from a few thousand to over one million gross square feet. Beyond the significant diversity of the portfolio, the St. George campus has an extensive district energy system which supplies heat, electricity, and chilled water to most of the campus buildings through kilometres of underground tunnels. The St. George District Energy System (DES) allows the University at St. George to maximize the efficiencies that are inherent in a centralized district energy system as well as take advantage of bulk energy purchasing to save money. The campus is a dynamic place with growing research and academic activities that will translate into new buildings and major renovations. Correspondingly, overall energy and water use will grow too. Our challenge is to make that growth as efficient as possible by reducing the energy and water use per square metre ratio as low as possible. Over the past 10 years, we have been very successful in reducing the overall energy intensity of our buildings through innovative new building designs and major retrofits, and by undertaking dozens of energy reduction projects. Please see figure 1 in the following page for a graphical representation of the St. George Campus’ Historical eCO2/GSM and Carbon Emissions.
St. George Campus
Page 2
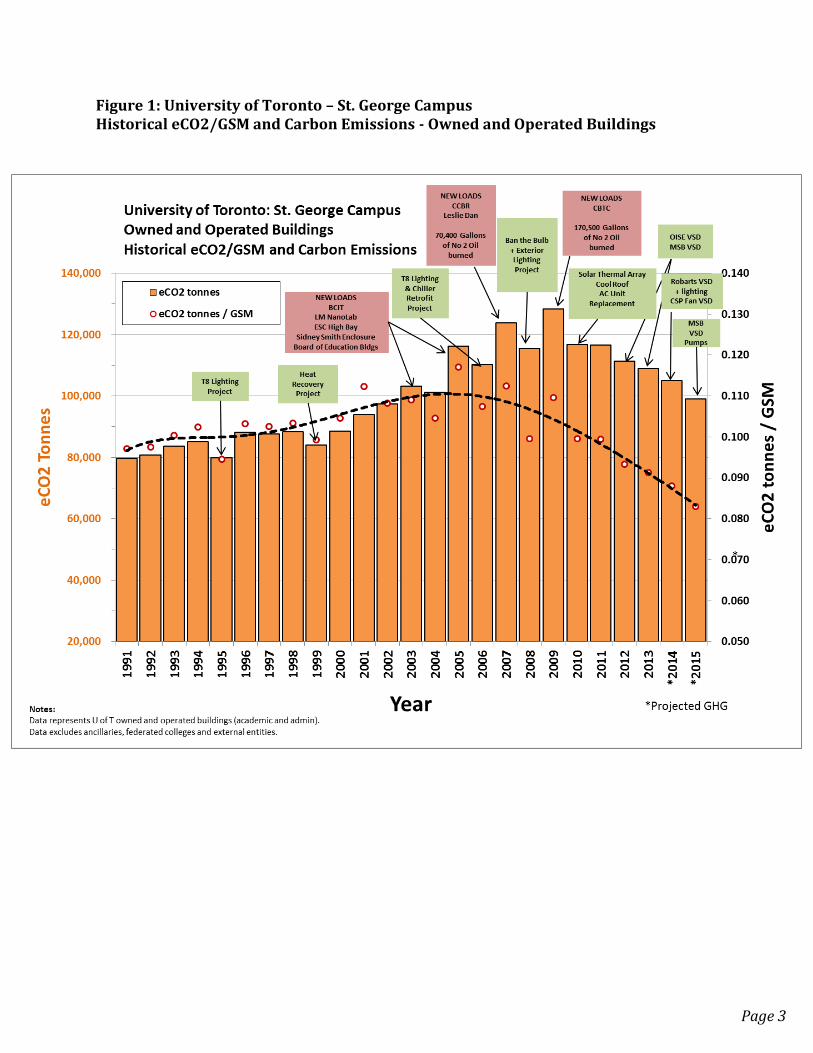
Figure 1: University of Toronto – St. George Campus Historical eCO2/GSM and Carbon Emissions - Owned and Operated Buildings
Page 3

Profile of Campus Operations – St. George Campus The means by which energy is procured, produced and distributed to the end users on the St. George Campus has evolved over many decades as the portfolio of buildings, their technologies and their functions have grown and evolved. One could expect that a campus located deep within the downtown core of a major city would depend heavily on available public services such as Toronto Hydro and Enbridge Gas with each building as an individual customer. While this is true for buildings purchased from other owners or where geography does not allow, the majority of the campus is served by a district energy system that pre-dates much of the public infrastructure, producing and distributing heat, cooling and electricity. This century-old strategy has provided the University with opportunities for operating efficiencies and bulk commodity purchases of gas and power that would not exist for other owners. District Energy System (DES): Central energy and heat generation has many advantages, including:
The same level of reliability can be achieved with less equipment, staff time, and costs. For instance, if a campus had 10 isolated buildings, they would have to each have one operating boiler and one standby in case of failure for a total of 20 boilers or twice the required capacity. If, alternatively, they were connected to a district energy plant, that plant could have perhaps three boilers of which one was a standby in case one of the others failed. The total capacity of the plant would be significantly less, with fewer pieces of equipment to maintain, but with the same reliability. Fewer boilers and chillers = less staffing required = less operating expenses.
A larger plant allows for the purchase of gas at cheaper rates than smaller plants.
A centralized plant allows technologies such as combined heat and power (i.e.
cogeneration), steam absorption chilling or condensing heat recovery to be more easily incorporated into the system for improved overall efficiency.
This centralized approach to energy administration has facilitated continuing efforts over the years to conserve these commodities, originally after the OPEC oil embargo in the 1970s when there was a perceived scarcity of fuel, and again, now, to counter climate change from greenhouse gases. However, alongside our efforts to reduce usage is also the reality that the St. George campus is a growing and dynamic place. New facilities are under construction or existing ones are under renovation – the University being one of the most active research institutions in North America.
Page 4
History of Conservation at the St. George Campus The University of Toronto has been a pioneer in energy conservation and green activities for decades. Originally triggered by the 1973 OPEC oil embargo but continuing because of concern for global climate change, the concept of sustainability through energy and water conservation and effective waste management has been written into University policy. Please visit the following link to see a copy of the University Environmental Protection Policy: http://www.governingcouncil.utoronto.ca/Assets/Governing+Council+Digital+Assets/Policies/PDF/ppmar071994iii.pdf Moreover, these good intentions have been turned into actions and results.
In 1912, the University commissioned one of the first district energy systems in Canada.
Conservation efforts on all fronts, triggered by the OPEC oil embargo, have resulted
in the avoidance of over 1 million tonnes of greenhouse gas, saved over 79 billion litres of water and over 200 million dollars in utility expenses since 1973.
Named as one of Canada’s Greenest Employers 2012 in recognition for its
commitment to creating a sustainable environment on campus.
For other notable U of T sustainability milestones, please see Appendix B
PART II: SUMMARY OF UTILITIES USE
This data is presented on the Facilities and Services website
http://www.sustain.fs.utoronto.ca/campus-footprint/ (click on detailed maps) as required for O. Reg. 397/11.
Page 5

PART III: CONSERVATION & DEMAND PLAN (CDM)
Qualitative and quantitative goals Five-year electricity CDM plan The University is always planning projects to reduce its energy and power footprint metrics. Over the last three years, we have been driving our energy footprint down through improved metering, operational refining, energy use profiling and assessment. Many of these will be implemented over the next one to three years and will result in improved building stock as well as improved energy performance. In order to understand how the energy and power is being used on our St. George campus, for both new and retrofit projects, we utilize the recognized International Performance Measurement and Verification Protocols (IPMVP) to gather the necessary data for consistent evaluation as well as better track savings as a result of our energy conservation measures. An important aspect of the IPMVP process is to establish a baseline of energy use, usually as energy/gross square metres of floor area (kWh or MJ/GSM) then track on-going energy use over time against this value. If changes to the operations, floor area, building use, etc. are made after the baseline has been determined, a “baseline adjustment” is completed and a new baseline will be created from which future assessment is done. We will use the energy use in 2012 as our baseline year against which we will compare future use. The goal is to continue to reduce the baseline energy use, which we have achieved over the past decade, each year as we grow the operations and size of the campus. We plan to continue to reduce energy usage of our buildings through innovative building designs and major retrofits, and by undertaking projects which promote reduction in energy use based on sound engineering and positive paybacks of funds expended. This technique will be used to determine the savings potential for the projects we are planning to implement as shown in the following table (please see figures 3, 4 and 5) over the next 5 years. It must be recognized that the scope for each project on this list may vary according to funding availability or changes to activities in any given project site. The savings are estimated on the scope of work at the time of this document release.
Page 6

Figure 3: New Buildings and Planned Major Renovations and Additions to existing buildings over the next 5 years. (The estimated capital costs and energy savings are shown. The capital costs do not include incentive funding where applicable)
Building Description Details Fiscal Years in Five Year Plan 2014-15 2015-16 2016-17 2017-18 2018-19
Lash Miller Chemical Labs
Two new research floors will include 60-100 new fume hoods. All new lab facilities and infrastructure will be designed to use state of the art fume hood technology as standard while ensuring appropriate levels of environmental health and safety.
Capital Cost New New Savings (kWh) 250,000 250,000 250,000
1 Spadina Crescent The historic portion of the building is being renovated and a new wing will be added. CDM measures include DOAS ventilation systems, new BAS controls, radiant heating and cooling. Low wattage lighting and occupancy controls with daylight harvesting where appropriate.
Capital Cost
Incl. in proj. New Bldg.
Savings (kWh) 50,000 60,000 160,000 160,000
Faculty of Law The existing Law Library will be renovated and a new wing added. CDM measures include low wattage lighting and controls, occupancy controls, daylight harvesting where appropriate and BAS tied to the enterprise management system.
Capital Cost Incl. in project
Incl. in project
Savings (kWh) 150,000 250,000 250,000 250,000
Ramsay Wright Zoological Labs
Progressive renovations are planned including the undergraduate labs, fume hoods, HVAC , lighting and new controls
Capital Cost $6,000,000 $3,000,000 Savings (kWh) 200,000 340,000 340,000 340,000
Jackman Institute for Child Studies
Three properties are being combined with linking of two existing buildings and connected new construction. CDM measures include high efficiency windows, lighting, controls and HVAC
Capital Cost New Bldg. Savings (kWh) 100,000 150,000 150,000 150,000 150,000
Student Commons – 230 College St.
Renovations to the old Architecture Building which will introduce air conditioning and food services where there was none before. This will add to the electrical and thermal footprint. The designs will follow high efficiency standards with new BAS controls.
Capital Cost Renovation Savings (kWh) Net energy
will likely go up but with high energy efficiency
Library facility at Downsview
A second module will be added adjacent to the existing module. CDM measures include new BAS integrated with the HVAC and the enterprise management system.
Capital Cost $575,000 Savings (kWh) 75,000 155,000 155,000 165,000 165,000
Page 7

Figure 4: New Construction
Building Description Details Fiscal Years in Five Year Plan 2014-15 2015-16 2016-17 2017-18 2018-19
Goldring Centre for High Performance Sport
State of the art athletic facility that includes CDM measures such as efficient fluorescent lamps, LED, distributed DDC, sub-metering for M&V plan and high efficiency air conditioning equipment, BAS integrated to the enterprise management system.
Capital Cost New Bldg. New Bldg. Savings (kWh) 650,000 800,000 900,000 900,000 900,000
High-rise tower on Devonshire Place
Capital Cost
New Bldg. New Bldg.
Savings (kWh) 350,000 400,000 400,000 Centre for Engineering Innovation and Entrepreneurship
State of the art, LEED Gold design standards with Toronto Green Standards, tier 2, with high efficiency triple glazing, high R-value walls and roof, low wattage lights, occupancy controls, high efficiency air conditioning and integrated BAS with the enterprise management system.
Capital Cost New Bldg. New Bldg. Savings (kWh) 500,000 500,000 500,000 500,000
Major Renovations and ECM Projects
BAS Migration Install new or replace legacy BAS with state of the art BAS technologies in multiple buildings for refined control and scheduling. Following improved BAS migration strategy and Design Standards. Integrated with the enterprise management system.
Capital Cost $880,000 500,000 Savings (kWh) 500,000 750,000 1,000,000 1,800,000 1,800,000
Edward Johnson HVAC and BAS
Improve HVAC systems and install state of the art BAS for refined control and scheduling and will be integrated with the enterprise management system.
Capital Cost $375,000 Savings (kWh) 100,000 180,000 190,000 190,000 200,000
Expand pneumatic to DDC thermostat controls conversion
Expansion of the existing conversion program at OISE and MSB for pneumatic thermostats to state of the art direct digital controls and migrate to the enterprise BAS network for better space control and monitoring.
Capital Cost $250,000 $150,000 Savings (kWh) 190,000 275,000 350,000 350,000 350,000
High Bay lighting Replace old fluorescent and some incandescent lights with LED in lecture halls
Capital Cost $50,000 Savings (kWh) 125,000 130,000 140,000 140,000 140,000
High efficiency filter replacement
Remove old pre-filters and replace with high efficiency, low pressure drop, longer life cycle filters and reduce fan electricity.
Capital Cost $360,000 $180,000 Savings (kWh) 900,000 950,000 990,000 990,000 990,000
Sub-metering at 15 buildings
Install electrical and thermal sub-meters in 15 buildings for M&T energy saving program
Capital Cost $980,000 Savings (kWh) 1,250,000 2,500,000 2,800,000 2,800,000 2,800,000
Earth Sciences Centre
Install fan coil controls to turn the coils off as well as the lights when the rooms are not occupied and connect to the enterprise BAS network.
Capital Cost $285,000 Savings (kWh) 100,000 175,000 180,000 180,000 180,000
Page 8
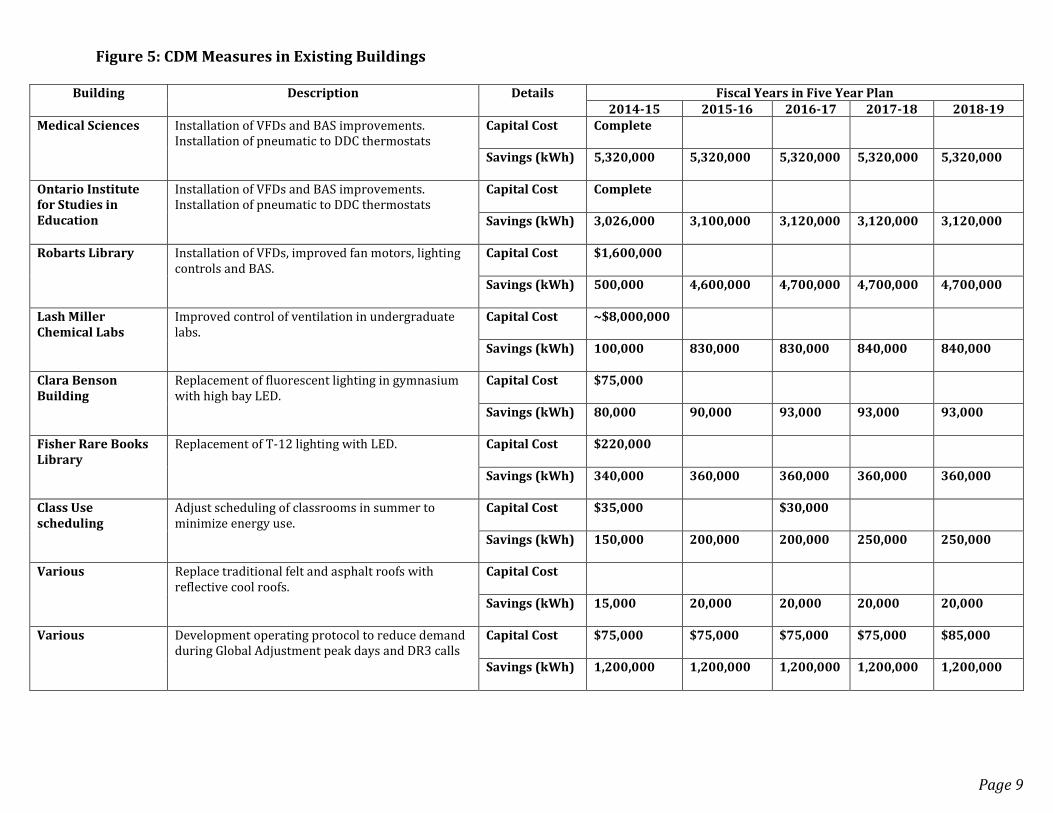
Figure 5: CDM Measures in Existing Buildings
Building Description Details Fiscal Years in Five Year Plan 2014-15 2015-16 2016-17 2017-18 2018-19
Medical Sciences Installation of VFDs and BAS improvements. Installation of pneumatic to DDC thermostats
Capital Cost
Complete
Savings (kWh)
5,320,000 5,320,000 5,320,000 5,320,000 5,320,000
Ontario Institute for Studies in Education
Installation of VFDs and BAS improvements. Installation of pneumatic to DDC thermostats
Capital Cost
Complete
Savings (kWh)
3,026,000 3,100,000 3,120,000 3,120,000 3,120,000
Robarts Library Installation of VFDs, improved fan motors, lighting controls and BAS.
Capital Cost
$1,600,000
Savings (kWh)
500,000 4,600,000 4,700,000 4,700,000 4,700,000
Lash Miller Chemical Labs
Improved control of ventilation in undergraduate labs.
Capital Cost
~$8,000,000
Savings (kWh)
100,000 830,000 830,000 840,000 840,000
Clara Benson Building
Replacement of fluorescent lighting in gymnasium with high bay LED.
Capital Cost
$75,000
Savings (kWh)
80,000 90,000 93,000 93,000 93,000
Fisher Rare Books Library
Replacement of T-12 lighting with LED. Capital Cost
$220,000
Savings (kWh)
340,000 360,000 360,000 360,000 360,000
Class Use scheduling
Adjust scheduling of classrooms in summer to minimize energy use.
Capital Cost
$35,000 $30,000
Savings (kWh)
150,000 200,000 200,000 250,000 250,000
Various Replace traditional felt and asphalt roofs with reflective cool roofs.
Capital Cost
Savings (kWh)
15,000 20,000 20,000 20,000 20,000
Various Development operating protocol to reduce demand during Global Adjustment peak days and DR3 calls
Capital Cost
$75,000 $75,000 $75,000 $75,000 $85,000
Savings (kWh)
1,200,000 1,200,000 1,200,000 1,200,000 1,200,000
Page 9
Strategic Planning
Several initiatives have contributed to recent success in reducing our environmental footprint over the past decade including:
All major renovation and new construction projects must have representation from Facilities and Services on project planning committees and design committees in order to provide input on sustainability opportunities and integration of energy conservation measures on Capital Projects.
Improved Design Standards that encompass building sectors such as mechanical, electrical, roofing
and controls that regulates products and methods used in construction projects and take advantage of new but tried technologies. This includes building automation systems, enterprise management and lighting systems.
The “new” budget model that has been in place for several years now pays for utilities from money
deducted from the revenues of academic divisions. These budgets are based on the measured volumes of utilities actually used in the building. Divisions are, therefore, encouraged to support energy conservation programs within their facilities, sometimes with funding contributions.
Funding for conservation projects is more readily available from a number of sources, both
internal and external:
o Energy Management Reduction Fund (EMRF) – this fund is intended to support small projects initiated by faculty, staff or student groups with a maximum contribution of $75,000 and the balance coming from the division. Projects are typically motion sensors on lighting, water saving measures, insulation audits, blower door tests, small lighting retrofits, occupancy controls and window film. The fund currently totals $500,000.
o Utilities Reduction Revolving Fund (URRF) – this fund started in 2013 with $4 million
dollars and is intended to support projects with a maximum 5 year payback. Examples include installation of variable frequency drives on fans and new Building Automation Systems in OISE and Robarts Library. Its objectives are:
To remove financial impediments to projects with savings potential over a multi-year payback timeline;
To significantly reduce greenhouse gas and utility resources used by the three campuses – specifically natural gas, electricity and water;
To educate and engage building occupants on the projects being undertaken and opportunities surrounding sustainable activities which will lead to reduce resource usage;
To address deferred maintenance within the scope of the project where possible.
o Deferred Maintenance funds and Utilities Infrastructure Renewal Funds (UIRF) are intended to replace and/or renew equipment and systems past its service life. Many times, this process will also result in improvements in the efficiency of the building.
Page 10
o Financial incentives from public agencies such as the Ontario Power Authority, administered through Toronto Hydro, or Enbridge Gas Distribution as well as the City of Toronto. These have so far totalled $1,390,000 over the last 5 years. They have not only provided financial support to individual projects but have also allowed the University to hire two embedded energy managers to locate further energy conservation measures, analyse project proposals and verify the savings.
Many outreach or behaviour modification programs have been initiated by the Sustainability
Office, designed to engage the faculty, staff and students at the St. George campus. These include:
o Green Ambassadors – a program with support modules to inspire administration and faculty staff to promote energy and resource saving measures in their offices. Such as double-sided printing set up as a default setting, lights turned off when the room is not occupied, use one side printed paper as “scratch paper”, recycling, and reduce the use of paper cups. This program will be maintained and is on-going.
o ReWire - this program provides support modules and training for students in residences on
how to reduce energy and resource waste. Modules include recycling, turning off lights, saving water, double-sided printing, re-use of scratch paper, etc. This program will be maintained and is on-going.
o Bike Chain: A Facilities & Services supported non-profit group on campus that provides
repair services for the campus community and a bike lending program for short use biking needs. They also prepare surveys on bike lock up and bike lane services on campus. The use of this group has been consistently growing for the last 5 years and is now in a larger F&S donated space with high efficiency lighting and programmable thermostats.
o “It’s Greener Here”: A campaign to promote the sustainability activities across campus in
the student, staff and faculty communities. A very successful Sustainability Yearbook was released in 2014 to highlight the efforts leading to a more sustainable mindset on campus.
o Green Ribbon Awards: An annual awards ceremony that rewards people or groups
recognized as having contributed to sustainable measures, programs and projects.
o Green Gala: In concert with the Green Ribbon Awards, this event promotes the success stories of sustainability efforts across the campus.
o Energy Usage Dashboards: Dashboards that illustrate energy performance in buildings has
been a part of our migration to a more informed campus population. Any new or large retrofit projects include an easily accessible dashboard that shows energy use in lay-person terms.
o Sustainability website: The F&S website has a link to the Sustainability Office which is the
hub for sustainability initiatives on campus. The Sustainability site is managed by the Sustainability Office staff and presents information, guidance and articles related to sustainability initiatives, “Faces of Sustainability” and success stories across the campus.
Page 11

Renewables The St. George campus is an urban collection of buildings. We installed an extensive solar hot water heating system for the Warren Stevens Athletic Building which contributes about 15% of the annual thermal load for over 3 years. As a large urban campus, there are more than 100 buildings here and not all are eligible for renewable energy application (other than more passive systems such as daylight harvesting). Realistically, only solar and possibly some small rooftop wind technologies can be applied here. We do not have the space for biomass and much of the land on campus is “busy” with infrastructure systems to consider ground source energy systems. We have installed two photovoltaic systems on the campus - one on the roof of the Lassonde Mining building and another on the roof of the Architecture Building which will be a test bed for an integrated green roof/PV system which will offset the electricity in that building (behind the meter). A small PV/wind system has been installed on the Galbraith Building to assess the issues around grid tie-in. Consideration is being given for a 50 kW roof mounted system on the pending new engineering building. Solar thermal (air) systems are being considered and evaluated for some of the buildings not on the St. George campus as well as a solar pool water heating system which are still in early development. The challenge with renewables on campus is that the age of many of the buildings makes rooftop PV difficult without major structural enhancements. It is also still difficult to connect small on-site generation to the grid due to hurdles with the local distribution company and related entity requirements along with grid capacity locally. We will follow the grid tie-in rules and programs to assess the opportunities for renewable energy generation on campus, in particular for “behind the meter” projects. At this time however, the financing is difficult to justify without more incentives or support when compared to reducing the energy use first.
Implementation of plan Consideration for any potential conservation projects are based on sound engineering and accounting principles. A baseline energy profile is established. Capital costs and energy savings are estimated, internally or with the assistance of external engineering firms. Any financial incentives for which the project may be eligible are identified. The simple payback and the ROI can be used as a gauge of the project’s priority however; pure financial return may be tempered or improved with consideration of other factors, such as:
Will there be other planned renovation work going on at the same time, which will make the implementation of the conservation measures easier or will provide an opportunity to implement them and eliminate the need to disrupt the occupants for a second time? An example of this would be the replacement of traditional felt and asphalt roofing with the University’s standard for cool roofs coordinated with a major renovation project, prior to the installation of new HVAC equipment on the roof.
Will the implementation of the CDM result in the elimination of some of the high priority deferred
renewal backlog by replacing old equipment or infrastructure? This could justify a contribution from either the Deferred Maintenance or Utilities Infrastructure Renewal funds. Bundling renewal projects with conservation projects having good ROIs can also result in a combination with reasonable overall financial returns. In this way, the project can then be looked upon as achieving
Page 12

unavoidable renewal but with an actual financial return. In this case, a longer than usual payback is quite acceptable. An example of this was the $20 million program to replace 18 CFC refrigerant chillers as required by legislation. The low ROI chiller replacement was bundled together with a large fluorescent lighting replacement project with a good ROI. Ordinarily, the chiller replacement would have been financed gradually over many years as funds became available. Combined with the financial return from the lighting work, a positive cash flow was estimated making financing feasible so that the project could be accomplished in a short period of time.
Will the implementation of the CDM affect the activities of the occupants of the building? What is
the current work load of the O&M staff carrying out the implementation? Careful planning is required to ensure successful implementation in a short period of time with minimal disruption to the academic mission of the building occupants. Dialogue with all parties involved is an essential aspect of that planning process.
Monitoring and evaluation The University of Toronto will reference and adopt the International Performance Measurement and Verification Protocols (IPMVP) as the methods to develop, define and assess energy and power performance metrics across the campus. Accurate determination of energy savings will allow the operations teams to adjust facilities management to deliver higher and reliable levels of energy savings, persistence of savings over time and reduced variability of savings. In order to fully comprehend our campus’ energy profile, we must first understand where and how the energy is being used in each building. Our plan includes the establishment of energy baselines from which we will develop performance metrics that can be evaluated on an ongoing basis. The data to generate these metrics (kWh/ GSM, mmBTU/HDD, etc) will be gathered from our network of sub-meters that measure electricity, steam, natural gas, water, chilled water and hot water across the campus. The IPMVP provides us with an industry standard framework for calculating energy reductions before (baseline) and after the implementation of projects. Energy or demand savings are determined by comparing measured energy use or demand using the following: Energy Savings = Base Year Energy Use – Post-retrofit Energy Use ± Adjustments (Adjustments being used to bring the energy use in the two periods to the same set of condition, such as weather, occupancy, equipment operations) For most of the projects on Campus – new, retrofit, upgrade and renovation, we will be using:
A. Partially Measured Retrofit Isolation B. Retrofit Isolation C. Whole Facility
With the IPMVP process, we will prepare annual performance metrics (after correcting for baseline adjustments) and compare them year over year. It is our intention to reduce the energy intensity each year through energy conservation measures and track such using the IPMVP process. Our goal is to have all our project designs follow sound engineering practices around high efficiency standards leading to long term positive financial and environmental results for quality spaces conducive to increased R&D and graduate student activity planned for the next 16 years.
Page 13
Appendix A: Campus maps showing electricity, heat and cooling source of
supply
Appendix B: Facilities and Services Sustainability Milestones
Appendices

Appendix A Campus Maps Showing Electricity, Heat and Cooling Source of Supply


Facilities and Services Sustainability Milestones
1912-2014
Appendix B

1912 Opening of the Central Steam Plant
The second university district energy
system in Canada
1964 Central Steam Plant
moved off coal to oil and natural gas
1973 First Lighting Retrofit
1977 Hired first full-time energy manager
1979 Pioneered an in-house building control system
1981 Installed 20,000 phantom fluorescent
tubes across campus
1989 Installed motion detectors to flush urinals across
campus saving large volumes of water
1990 U of T established an annual $250,000 energy
management fund to support energy
reduction initiatives. 1991 Started institution-wide recycling
program, one of the very first universities
in Canada to do so! 1993 Co-generation system installed
1994 U of T adopted its University Environmental
Protection Policy — one of the first institutions in
North America to develop one.
1995 Lighting retrofit
Replaced T12 light fixtures with
high efficiency lighting —
replaced a total of 190,000
lamps!
F&S Sustainability Milestones 1912-2014
1912-2014

(continued)
2000 Flue gas heat-recovery system is
installed to harvest heat from exhaust
gases going up the chimney at the Steam
Plant.
2002 Bahen Centre for Information Technology
Building (BCIT) connected to the flue gas heat-
recovery system becoming the first building to be
100% heated with energy that would otherwise
have gone up the chimney.
2003 Natural Resources Canada gave U of T its
prestigious Energy Efficiency Award for
energy innovators in recognition of our
commitment to energy efficiency and
reducing GHG emissions.
2004 Sustainability Office established with
academic and student representation.
2005 Washroom upgrades started on
St. George campus with cutting-
edge sustainable standards:
energy efficient lighting, durable
materials for long life and hands-
free devices to reduce water
consumption and improve
hygiene.
Green Cleaning and
Sustainable Roofing Standard
were introduced. Visit
http://www.fs.utoronto.ca/caretaking
/green.htm for more details regarding
the green cleaning program
2006 Campus Moving replaced three gasoline
vehicles with three natural gas vehicles.
Campus Police purchased their first hybrid car
making U of T the first Canadian university to own
a hybrid vehicle.
F&S Sustainability Milestones 1912-2014
(continued)
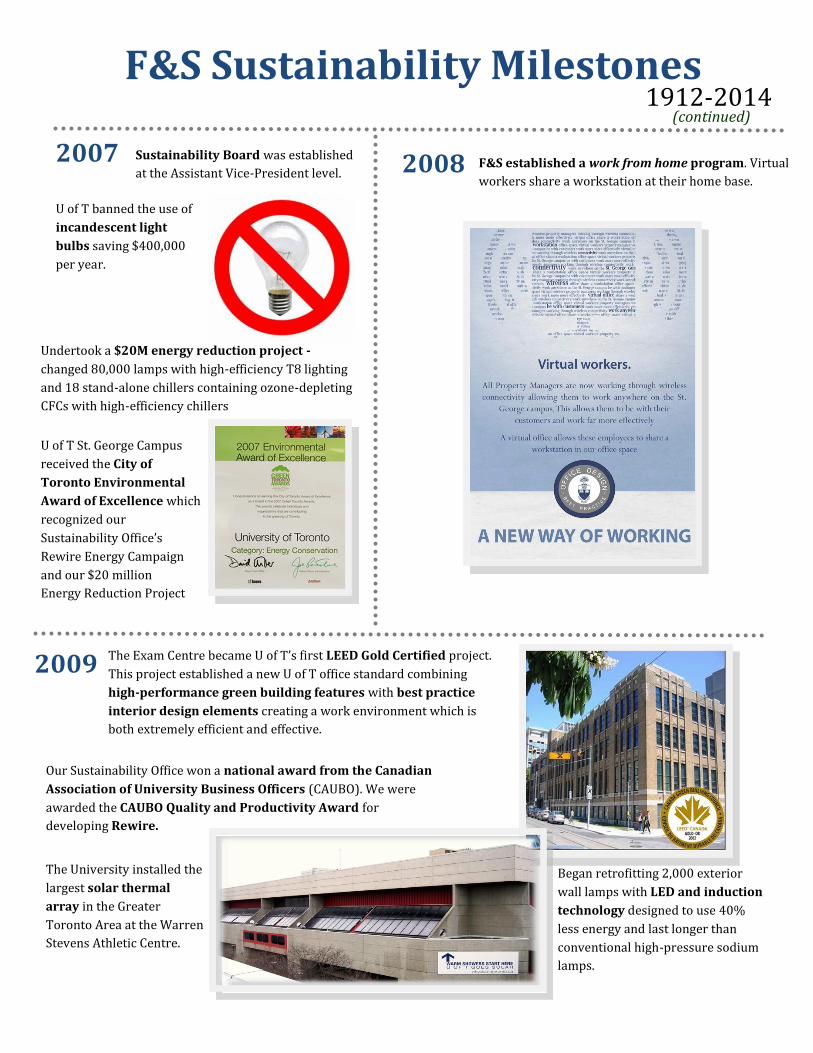
2007 2008 Sustainability Board was established
at the Assistant Vice-President level.
U of T banned the use of
incandescent light
bulbs saving $400,000
per year.
Undertook a $20M energy reduction project -
changed 80,000 lamps with high-efficiency T8 lighting
and 18 stand-alone chillers containing ozone-depleting
CFCs with high-efficiency chillers
U of T St. George Campus
received the City of
Toronto Environmental
Award of Excellence which
recognized our
Sustainability Office’s
Rewire Energy Campaign
and our $20 million
Energy Reduction Project
F&S established a work from home program. Virtual
workers share a workstation at their home base.
2009 The Exam Centre became U of T’s first LEED Gold Certified project.
This project established a new U of T office standard combining
high-performance green building features with best practice
interior design elements creating a work environment which is
both extremely efficient and effective.
Our Sustainability Office won a national award from the Canadian
Association of University Business Officers (CAUBO). We were
awarded the CAUBO Quality and Productivity Award for
developing Rewire.
Began retrofitting 2,000 exterior
wall lamps with LED and induction
technology designed to use 40%
less energy and last longer than
conventional high-pressure sodium
lamps.
The University installed the
largest solar thermal
array in the Greater
Toronto Area at the Warren
Stevens Athletic Centre.
F&S Sustainability Milestones 1912-2014
(continued)
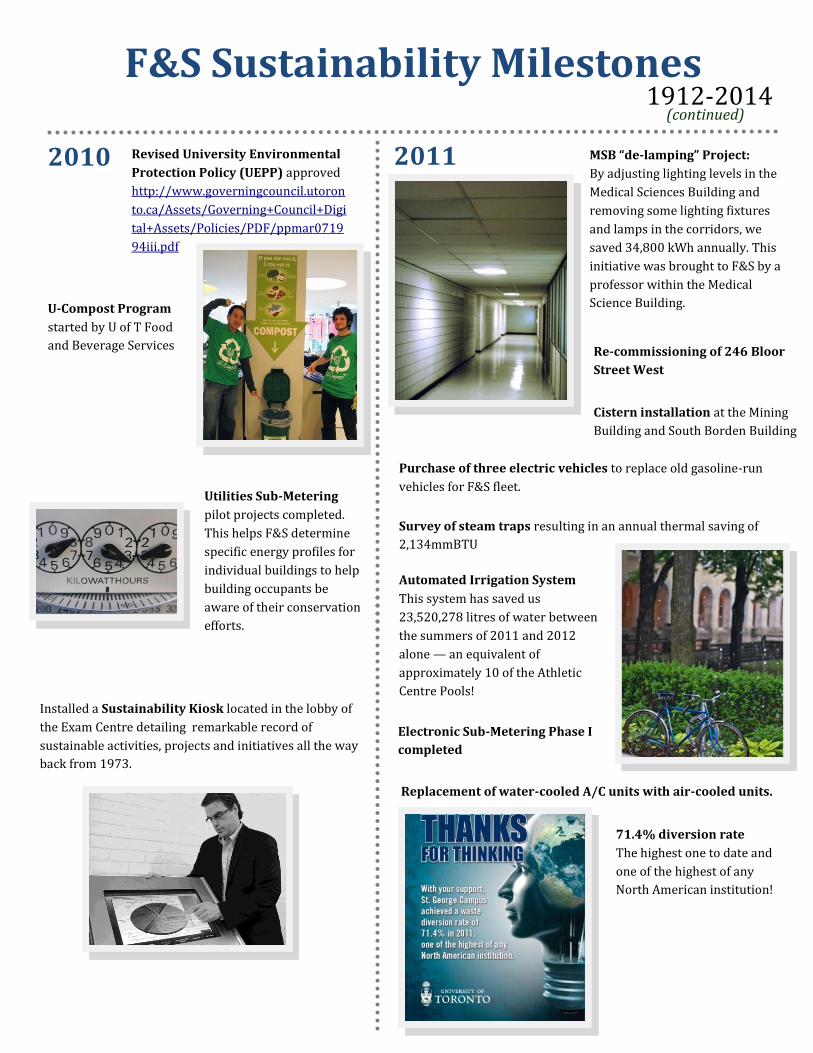
2010 2011 Revised University Environmental
Protection Policy (UEPP) approved
http://www.governingcouncil.utoron
to.ca/Assets/Governing+Council+Digi
tal+Assets/Policies/PDF/ppmar0719
94iii.pdf
U-Compost Program
started by U of T Food
and Beverage Services
Utilities Sub-Metering
pilot projects completed.
This helps F&S determine
specific energy profiles for
individual buildings to help
building occupants be
aware of their conservation
efforts.
Installed a Sustainability Kiosk located in the lobby of
the Exam Centre detailing remarkable record of
sustainable activities, projects and initiatives all the way
back from 1973.
MSB “de-lamping” Project:
By adjusting lighting levels in the
Medical Sciences Building and
removing some lighting fixtures
and lamps in the corridors, we
saved 34,800 kWh annually. This
initiative was brought to F&S by a
professor within the Medical
Science Building.
Re-commissioning of 246 Bloor
Street West
Cistern installation at the Mining
Building and South Borden Building
Purchase of three electric vehicles to replace old gasoline-run
vehicles for F&S fleet.
Survey of steam traps resulting in an annual thermal saving of
2,134mmBTU
Automated Irrigation System
This system has saved us
23,520,278 litres of water between
the summers of 2011 and 2012
alone — an equivalent of
approximately 10 of the Athletic
Centre Pools!
Electronic Sub-Metering Phase I
completed
Replacement of water-cooled A/C units with air-cooled units.
71.4% diversion rate
The highest one to date and
one of the highest of any
North American institution!
F&S Sustainability Milestones 1912-2014

(continued)
2012 2013 Launched the Utility Reduction
Revolving Fund (URRF) — a green
revolving fund for the built environment.
The main intent of the fund is to provide
comprehensive funding to support and
stimulate projects that will result in
reducing the University’s environmental
footprint and provide utilities savings with
a maximum 5 year payback.
Pilot Project for URRF -
Chemistry Undergrad
Scheduling Project
completed
Named as one of Canada’s Greenest Employers
Hired an Embedded
Energy Manager in
partnership with
Toronto Hydro
Another cistern installation at the Swap Shop
Completed LED/Induction Exterior Lighting
Retrofit Project
100th anniversary of U of T’s District Energy System
In 2012, the University of
Toronto St. George Campus
celebrated the centennial of one
of Canada’s first institutional
district energy systems
Medical Science Building Major HVAC retrofit
Installation of cutting-edge variable speed drive fan
technology, improved building automation, and wireless
room level thermostatic controls in the Medical Science
Building (MSB) will drastically reduce the building’s annual
energy consumption and will save more than $1 million
annually
First URRF project: OISE Building Automation System
This project will provide
more consistent indoor air
quality for the number of
people in OISE (Ontario
Institute for Studies in
Education) and at a reduced
energy cost. Estimated
savings are $361,250/year
with a 2.4 year simple
payback.
Move of Bike Chain
The North Borden Building
at 563 Spadina Avenue
(Room 109/109A) became
Bikechain’s new home –
renovated and provided by
Facilities & Services
F&S Sustainability Milestones 1912-2014

For a comprehensive list of our sustainability milestones, visit: http://www.sustain.fs.utoronto.ca/sustainability-timeline/
(continued)
2014 First year anniversary celebration of the
MSB Energy Reduction Project
So far the most successful energy reduction project
ever undertaken at the U of T St. George campus to
date, the $1.5 million initiative included $587,000 in
incentives from Toronto Hydro and Enbridge Gas
bringing the net cost of the project to $913,000.
Project annual savings is more than $1 million as
verified by M&V program and sub-meters.
http://www.sustain.fs.utoronto.ca/news/2014-03-
27_FuelingResearchSavingEnergy.html
http://www.sustain.fs.utoronto.ca/news/pdfs/MSBpo
ster24x30.pdf
First Sustainability Yearbook Launch
The first Sustainability Yearbook was launched at the
2014 Green Ribbon Awards ceremony. The
Sustainability Yearbook features an opening message
from President Meric Gertler and sustainability
highlights from the St. George campus.
Please visit the following link to view a full copy:
http://www.sustain.fs.utoronto.ca/news/pdfs/2013-
2014Sustainability_Yearbook.pdf
F&S Sustainability Milestones 1912-2014