st. croix east end marine park use assessment
TRANSCRIPT

ST. CROIX EAST END MARINE PARK USE
ASSESSMENT
All previous STXEEMP data sets and literature were reviewed and
summarized. Anecdotal information and qualitative data on public use of
the park ‘s resources were found and it was concluded that direct sampling
was required in the field. A rigorous sampling protocol was developed and
data was collected 12 times between 28 October 2010 and 15 December
2010. This data establishes a baseline for use on weekdays, weekends and
nights for 2010 levels. Various other data sets are also included in this final
report, including previous activity surveys and a phone survey of tour
operators. Several recommendations are provided, primary among them is
that this protocol be employed again periodically, especially after the
marker buoys are installed.

1
Table of Contents 1. Introduction ............................................................................................................................. 3
2. Existing Data ........................................................................................................................... 4
A. Literature Review .............................................................................................................................. 4
B. St. Croix EEMP Activity Survey .......................................................................................................... 7
3. Methods ................................................................................................................................... 9
A. EEMP Use Assessment Survey ........................................................................................................ 10
B. Vendor/Tour Operator Phone Survey ............................................................................................. 11
4. Results ................................................................................................................................... 12
5. Discussion and Conclusions .................................................................................................. 17
A. Shoreline Activities.......................................................................................................................... 17
B. Boating Activities ............................................................................................................................ 19
C. Tour Operator Survey ..................................................................................................................... 21
D. Potential Future Impacts................................................................................................................. 21
6. Literature Cited ...................................................................................................................... 23
Appendices .................................................................................................................................... 24
Appendix 1. Literature Reviewed to Determine Gaps in Data ................................................................ 24
Appendix 2. St Croix EEMP Activity Survey Data Sheet .......................................................................... 29
Appendix 3. Summary of Results for Activity Survey .............................................................................. 30
Appendix 4. Data Collection Protocol for St. Croix EEMP Use Assessment ............................................ 31
Appendix 5. Example Field Data Collection Sheets for Use Assessment Study ...................................... 32
Appendix 6. Tour Operator Phone Interview Results ............................................................................. 33
Appendix 7. Locations of shipwrecks as indicated by DPNR ................................................................... 34

2
Table of Figures.
Figure 1. Data sampling points relative to their bay location and the proposed STXEEMP
resource use zones......................................................................................................................... 11
Figure 2. The spatial distribution of all activity types in each of the 18 bays and the time of the
day/week when activity occurs. .................................................................................................... 13
Figure 3. Summary of all land and sea activity from the 12 sampling dates, subtotaled by bay and
time of the observation.................................................................................................................. 14
Figure 4. Total shoreline and sea activity observed in the 15 less frequently used bays.............. 15
Figure 5. All observations of cars and trailers at 36 sampling sites in 18 bays ............................ 16
Figure 6. Summary of three types of fishing metrics; shoreline fishing, fishing from a boat and
the presence of fishing boats (fishing or unattended). .................................................................. 16
Figure 7. (A) Vehicle access across sensitive, flooded coastal habitat and (B) an eroded dirt road
used to access the beach ................................................................................................................ 21

3
1. Introduction The St. Croix East End Marine Park (STXEEMP) was established in 2002 making it a relatively
new protected area. The STXEEMP boundaries were defined and the mission described in Act
No. 6572, Bill No. 24-0308 (USVI 2002) and a management plan for the STXEEMP was also
adopted in the same year. A significant aspect of the management involves the establishment of
use zones. These areas were developed to protect areas of significant natural resources, but also
to establish areas for recreation and fishing. The boundaries for these areas were chosen based
on numerous stakeholder meetings and input forma natural resource professionals. Enforcement
of the STXEEMP regulations will only go into effect once marker buoys are installed to
delineate the boundaries of the park and the use zones therein, and a 30-day public notice period
has passed upon completion of the installation of marker buoys. From a management
perspective it is highly desirable to know if installation of marker buoys will have an effect on
the behavior of park users. In order to quantitatively measure such a change in behavior,
baseline data must be established using a regimented, repeatable method. After installation of
the buoy, park use can be re- measured using the same methodology and the results compared.
The goal of the project is to collect and analyze all available data sources pertaining to St. Croix
East End Marine Park user activity and to collect additional data to address identified gaps in
knowledge. Results and analysis are intended to assist STXEEMP managers with the
implementation of the 2002 STXEEMP Management Plan while considering current user
activity.
Geographic Consulting was contracted to complete five distinct tasks during the allotted time
period.
1. Review and collation of existing data
2. Identification of data gaps and recommendations of ways to fill gaps
o discussion of recommendations with STXEEMP resulting in decision on if and
how to move forward in addressing gaps under the scope of this project
o if pursuing new data collection activities might include development of schedules
for observational data collection, assistance/facilitation with focus groups, etc.
3. Collection of new data as appropriate (see item #2)
4. Data analysis
5. Reporting including production of maps depicting various uses and areas within park
The results of these tasks are described in order throughout the remainder of this document.
4
2. Existing Data
A. Literature Review
Our first step in reviewing existing data and identifying gaps in information was an extensive
literature review. As other studies have found, there is plenty of general information on the
interaction of the public and marine resources in protected marine areas, but little information
specific to the STXEEMP. Several reports provided information relevant to this study, including
the following four primary documents that guided the process:
“Resource Description Report,” prepared by Island Resources Foundation (2002);
“Socio-economic Assessment,” prepared by Hinds, Unlimited (2003);
“Management Framework for a System of Marine Protected Areas,” prepared by
Lloyd Gardner of Environmental Support Services, LLC;
“Management Plan: East End of St. Croix Marine Park,” prepared by The Nature
Conservancy
These four documents were the primary planning tools in creating the STXEEMP and together,
provide the most comprehensive review of available data relating to the STXEEMP. A more
recent review of biophysical data in and around the STXEEMP (Mayor 2006) is also an
important resource for interpreting the potential effects of recreational use on natural resources.
The following is a review of these documents including information from each that is relevant to
this study. A list of the other documents reviewed is included in Appendix 1.
The Resource Description Report (2002) prepared by the Island Resources Foundation begins
with an extensive review of the history of the establishment of Marine Protected Areas in the
Virgin Islands. The report then developed a set of criteria to rate potential areas in the Virgin
Islands for designation as a Marine Protected Areas. The primary features identified by IRF as
important factors in evaluating potential sites include:
The known presence of endangered, threatened or commercially important species
for some significant life stages or functions (breeding, feeding, nursery areas, etc.)
Significant habitat, especially reefs, sea grass beds and algal plains, and
mangroves judged to be superior quality by experts or local users
Habitats which supply special services such as coastal buffering and amelioration
of impacts on both land (e.g., reefs that act as breakwaters) and in coastal and
nearshore waters (e.g., filtering effects of salt ponds and mangroves).

5
Based on these criteria, several areas of the STXEEMP including Chenay Bay/Southgate, Great
Pond Bay, Jack Bay/Isaac Bay, East Point/Point Udall and Coakley Bay were all identified as
priority areas for protection. Of these, Great Pond Bay and Chenay Bay were identified as
uniquely filling most of these criteria at a higher level than the other areas. However, all areas
but East Point/Point Udall were rated as having high ecological significance. This report also
identified gaps in information such as the lack of long term biological monitoring and mapping
products.
The Socio-Economic Assessment of Marine Use in the Virgin Islands (2003) prepared by Hinds
Unlimited also includes an analysis of all three major Virgin Islands. The authors‟ initial review
of existing literature for the socio-economic survey came to much the same conclusion that we
did: There is little quantitative data on public use of STXEEMP resources, and existing data is
not spatially explicit enough to be used for targeted management. Given the time and resource
constraints of their study, the authors chose to fill this gap with extensive stakeholder input.
Stakeholders were invited to multiple meetings and asked to fill out surveys on a variety of
marine resource uses. Stakeholders identified common activities at specific areas throughout the
territory and the perceived impact of these activities on the resources. The following is a list of
areas and the activities that occur at each location as identified by stakeholders:
Chenay Bay – bird watching, swimming, kayaking, camping. snorkelling
Green Cay- recreational swimming, diving, sailing
Between Chenay and Teague Bays – fishing, swimming, hiking, ecotourism
Teague Bay- yachting, hiking
Pelican Rock – needs protection; barely hanging on
Cottongarden Bay- swimming, personal watercrafts, camping
Point Udall- to Great Pond Bay- hiking, ecotourism
Jack and Isaac bay- snorkelling, swimming, lobstering
Turner Hole- small boat-recreational, camping, hotel
Rod Bay – possible hotels/golf course
Great Pond Bay- camping, kayaking, launch
This provides a good overview of all of the perceived uses of each the major bays within the
STXEEMP, but the authors acknowledge they were not able to make direct field measurements
or collect data on the extent of each activity.
The Management Plan for the East End Marine Park (2002), prepared by The Nature
Conservancy gives a comprehensive overview of the background of the STXEEMP, the
resources being protected and managed, the potential threats to these resources and a plan for
managing the park within this context. Six primary management targets were identified: Sea
Turtles, Parrot Fish, Aggregating Fish Predators, Seagrass Communities, Mangroves/Salt Ponds,

6
and Coral Reefs. Complete reviews of the status, threats and management suggestions for each
of the targets are described.
The authors identified a number of recreational
activities that could negatively affect the marine
ecosystem including boating, snorkeling, diving
and swimming. The authors also briefly mention
fishing as a potentially damaging activity, however
they acknowledge this is an extremely complex
issue, the scope of which is beyond a document
intended as an overview of issues. A number of
activities were listed as currently occurring in the
park (in 2002, at the time the report was submitted).
There was no indication as to how this list was
generated:
Commercial Fishing: Netting, trapping,
hook and line, spear fishing, diving for
conch and lobster
Recreational Fishing: Hook and line, spear fishing, diving for conch and lobster
Diving: Both tour operators and private boats
Snorkeling: Both tour operators and private boats
Jet Skiing: Privately owned
Wind Surfing: Both rented and privately owned
Kayaking: Both rented and privately owned
Sailing: Both rented and privately owned
Motor Boating: Both rented and privately owned
Anchoring: All boat types
Beach Camping: Primarily local residents
Of particular relevance, is the authors‟ comment that the details of these activities “need to be
quantified and synthesized”. In fact, at several points throughout the document, the need for
resource use/user monitoring is cited as a necessary component of park management and a
priority for implementation.
The document produced by Lloyd Gardner: “Management Framework for a System of Marine
Protected Ares” (2002) was not directly relevant to our analysis of public use of the EMMP. The
Small anchored boat off the south shore of the
STXEEMP

7
document primarily provides a theoretical framework for creating and running a marine
protected area, but has little site-specific information that is required for a use assessment
project.
A 2006 report on the biophysical properties of the STXEEMP provides an extremely useful and
comprehensive analysis of existing data and ongoing data collection methods used by a variety
of agencies as they can be applied to the STXEEMP (Mayor 2006). As with each other
document, Mayor points out the need for monitoring and data collection specifically geared to
the STXEEMP and its needs. In this analysis, fishing data and distribution in the park was
pulled from commercial catch reports submitted to DPNR –DFW and from a NOAA
Biogeography Project. Drawing conclusions from the catch reports is difficult because catch
locations are not limited to STXEEMP boundaries. Based on his analysis, Mayor identified
queen conch and red hind groupers as biological indicators to be monitored for management
effectiveness of the STXEEMP.
In an analysis of water quality standards found in the same report, Mayor found that minimum
water quality standards were not always met within the park. This conclusion was based on
monitoring conducted by DPNR-DEP‟s. Reasons for the occasional poor water quality were not
clear and Mayor points to the need to connect water quality monitoring to the public‟s use and
activities within the STXEEMP.
After our literature and resource review, the essential gap in the data that was clear to us and was
also expressed by the other reports was a quantitative, repeatable, spatially explicit study of the
public‟s use of the resources within the STXEEMP.
B. St. Croix EEMP Activity Survey An earlier project began the process of describing the type and frequency of stakeholder activity
within the St. Croix East End Marine Park borders in 2008. The project was performed with
funding from NOAA, by STXEEMP staff, The Nature Conservancy (TNC) staff and local
volunteers. The goal of the project was twofold, to engage motivated volunteers in a meaningful
activity that would benefit the park managers and also to obtain observational data on an on-
going basis.
Data sheets were developed for recording observations and volunteers were trained in data
collection methods. A copy of the Activity Survey Data Sheet appears in Appendix 2 of this

8
document. Emphasis was placed on recording observations; any interaction/confrontation
between observers and subjects was discouraged. Volunteers recorded various activities
observed within the park between the dates 9 January 2009 – 28 April 2010. Seven volunteers
made a total of 262 unique observations in 12 general locations. Geographic Consulting was not
involved in the process, but has summarized the data sheets here as a preliminary step in
describing park user activity and identifying data gaps.
Before analyzing the Activity Survey data, it is important to make a statement about some of the
limitations resulting from the data collection method and the qualitative nature of the data. The
Activity Surveys are useful in describing what type of activity was observed at certain locations
and may have also been effective in motivating the volunteers to get involved in STXEEMP
activities. However, the information was not gathered using a repeatable method and sampling
was uneven in both space and across time. In general, the observations recorded tended to be
qualitative and varied between data collector. Some examples of the unquantifiable data are
statements such as “lots of jet skis” and fishing activity “mostly on weekends”. The ad hoc
nature of the data collection means that there were uneven numbers of observations, some areas
were not sampled and the sampling was conducted by multiple individuals at varying times. For
example, some bays received no observations, while Coakley Bay has many observations and
Hugh‟s Point has almost daily observations, but only for a three week period. This means there
was no unique sampling method for each area, therefore, the data may not be used to compare
which bays have more or less activity, nor may it be used to extrapolate monthly/annual totals
for any one area or for the park as a whole. As a result, no baseline numbers could be
established. Perhaps more importantly, the method was not repeatable. This means that the data
cannot be used to indicate levels of activity before and after the installation of the marker buoys.
Despite the drawback of the data set, we derived some meaningful information based on actual
field-recorded observations. In this analysis an observation is defined as a recorded observation
by an individual of an activity in a unique location on a unique date. An observer may record
several activities (such as walking, swimming and fishing) in a single observation. All activities
are described here as either Land Activity or Sea Activity, depending on how the people arrived
at the STXEEMP. Observation data sheets varied greatly in their level of detail, so we created
general categories of activities into which observations could be grouped.
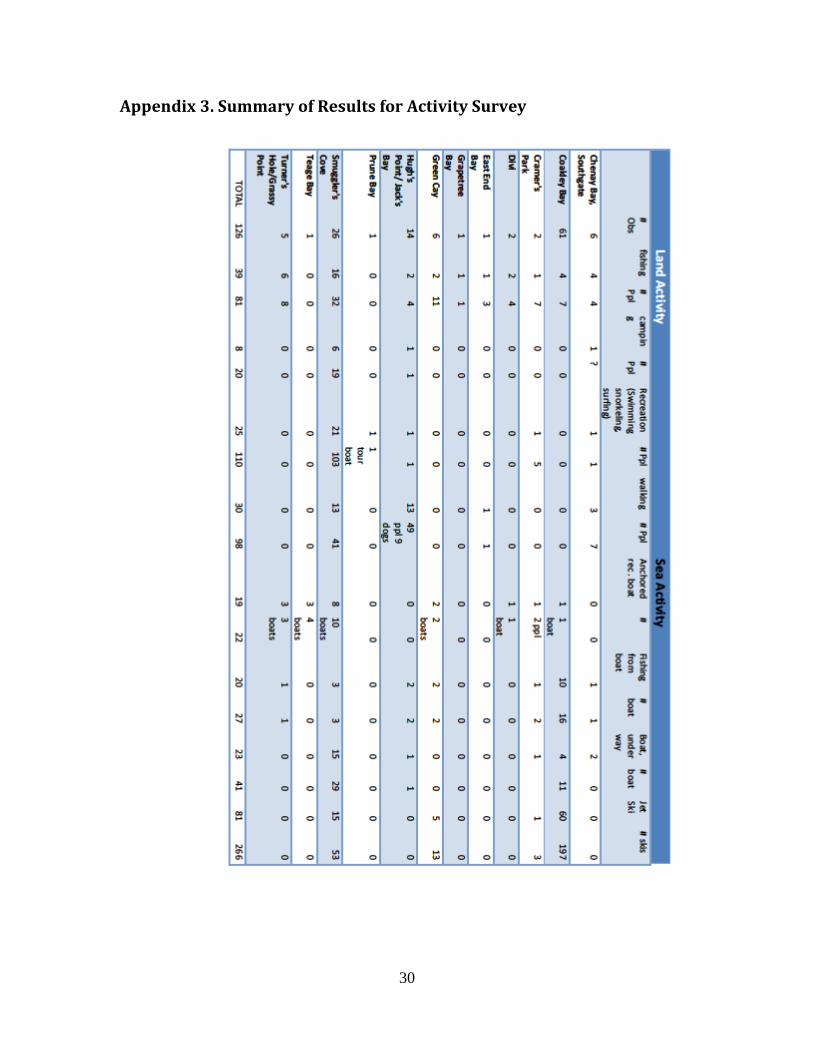
In Appendix 3, data is divided by location and the “Observation Number” indicates the unique
dates at each location where activity was recorded. The four land activities are: 1- Fishing: by
line, cast netting, spear fishing, and diving for lobster and conch, 2- Camping: by groups or
individuals, usually with tents, with or without bonfires, 3- Recreation: including swimming,

9
soaking, snorkeling, sunbathing and surfing, 4-Walking: individuals, couples and groups of
mostly adults taking walks, frequently accompanied by dogs. For the majority of these
observations the number of individuals was reported while in other cases the data sheets simply
note “2 families”, “large group” or other non-numeric measures. Sea Activities include people
arriving by boat. The four Sea Activities are: 1- Anchored Recreational Boats: with people
swimming, snorkeling, surfing or socializing, 2- Fishing: by line, cast netting, or drift diving for
lobster, conch or an unknown purpose, 3- Boats underway: includes fishing boats, sailboats, and
motorboats that do not stop within view of the observer, 4- Jet Skis: all personal watercraft
underway, anchored or otherwise. Individual people were generally not counted in these
observations, but number of boats frequently was. Observing boat activity from shore is
notoriously difficult to discern, with or without binoculars. In this study the activity type was
sometimes recorded as „transitional‟ or „fishing‟ but frequently no activity was specified. The
number of boats was often recorded, but usually not the number of people. Where the observer
recorded an activity, but not a number of people/boats, a minimum number was entered (one
person per boat).
Observations in Coakley Bay, Jack‟s Bay and Smuggler‟s Cove account for the vast majority
(101 of 126) of observations. The “totals” line in the table in Appendix 3 indicates that from
land, fishing was the most frequently observed activity, but done by relatively few people,
whereas the three forms of recreation were seen slightly less frequently, but in larger groups
accounting for roughly triple the amount of people observed to be engaged in fishing activity.
Sea Activities data was more general, but observations appeared equally distributed between
fishing and recreation. The 266 Jet Skis observed on 81 dates indicate this activity is likely
ubiquitous in the bays where it occurs. Additional interpretation of the data is not recommended.
3. Methods An initial assessment of the existing data describing resource use at the STXEEMP was
conducted to identify gaps in information (See 2A. Literature Review for details). It was
determined that the primary information gap in park user activities was the lack of regular,
systematic direct sampling of the public‟s use of the park‟s resources. Several reports described
recreational hotspots based on anecdotal accounts or stakeholder meetings, but did not include
quantitative data, including the St. Croix East End Activity Survey discussed above. Survey
questions also tended to be open- ended making it difficult to quantitatively describe activities.
To address this information gap, a new use-assessment survey was developed with a regimented
protocol for regular data collection. The goal of the assessment was to accurately gauge the type
of activities being conducted within the STXEEMP, the time (day/night, weekday/weekend,
summer/winter) and frequency of the activity as well as its spatial distribution. The use-
assessment was supplemented with phone surveys to businesses that use the park‟s resources for
tours.

10
A. EEMP Use Assessment Survey In order to accurately characterize the use of the park‟s resources by the public and to document
any changes in use patterns after installation of marker buoys, a use-assessment survey was
developed by Geographic Consulting. The goal of the use-assessment survey was to
systematically collect spatially explicit data in a uniform, repeatable, unbiased fashion. The
STXEEMP Management Plan calls for the development of a “resource use/user monitoring
protocol…specific to the Marine Park that will ensure regular data collection intervals and
consistent methodologies.” The protocol developed for this project directly addresses this need
(Appendix 4). It was developed to be straight forward and repeatable so that STXEEMP staff
could continue conducting the surveys with minimal interruption to other regular duties and so
data collection could continue after the installation of the marker buoys. This activity is
identified in the management plan as a “high priority activity” that “will establish baseline data”
and “determine the direction of management practices”.
The overall structure of the use-assessment survey involved collecting resource usage data at 36
survey points along the shorelines of the STXEEMP. These points are the traditional access
points for park users to the shoreline by motor vehicle. During an initial drive-around with
STXEEMP staff, all access points were identified, mapped and relevant information describing
each spot was recorded. Based on this information, a driving route was established in which
observers would visit each of the designated 36 access points and collect data on a predetermined
set of variables both on-shore and off-shore. A total of 34 survey points were established within
the park. Two boat launches outside the park were identified as likely launch points for boats
entering the park for both fishing and recreation (Figure 1). At these two boat launch sites (1-
Altona Lagoon boat launch and 2-Castle Nugent boat launch) the only metric recorded was the
number of boat trailers. Once observers became familiar with the route, the entire route could be
surveyed in approximately 4 hours.

11
Figure 1. Data sampling points relative to their bay location and the proposed STXEEMP resource use zones.
At each survey point, the observer recorded the number of cars and boat trailers, the number of
people participating in various shoreline activities, and the number of boats observed. A
standardized protocol for data collection was developed and a comprehensive set of data sheets
was created to aid observers in recording the correct information at each of the 36 sites. An
example of one of these data sheets appears in Appendix 5, and the entire digital set of 36 unique
pages of data sheets was submitted along with this report. Digital and paper copies of the blank
sheets are also available from Geographic Consulting.
Although surveys are intended to be ongoing, at the time of this report‟s submission, the driving
route survey had been conducted a total of 12 times: four daytime weekdays, four at nighttime
weekdays and four weekend days, between the dates of 28 October 2010 and 15 December 2010.
B. Vendor/Tour Operator Phone Survey The Socio-Economic Assessment of Marine Resource Utilization in the U.S. Virgin Islands
(Hinds Unlimited 2003) listed one of its key findings as the presence of significant gaps critical
to social or economic assessments of MPAs. Specifically, the report cites an “absence of
complete data on boating expenditures and numbers and types of boats…” and a “lack of
detailed information on local industry/activity purchase patterns…”. To begin to address this

12
gap within the limited time-frame available, we created a list of natural resource/tourism
businesses that may utilize portions of the STXEEMP. A number of these businesses use the
park‟s resources on a regular basis for recreational activities and tours. Many of these businesses
may not have been captured in the use-assessment survey but have the potential to significantly
impact the park‟s resources, particularly as tourism grows on St. Croix with increased visitation
by cruise ships.
A list of the businesses that potentially use the park‟s resources was generated from tourism
websites, the phone book and word of mouth. Each of these businesses was contacted and a short
phone interview was conducted to determine their frequency and scale of use of the park‟s
resources, and locations within the park that activities occurred. Business activities included jet-
ski rentals, kayak tours, kite surfing, SCUBA and snorkeling tours, sunset sails and fishing tours.
4. Results Results of this study identify several trends in park user activity, both spatial and temporal. First
and foremost, when all of the activities are combined within each bay and compared with other
bays, there is an obvious uneven distribution in data, indicating several spots with peaks in the
number of users. Chenay Bay, Coakley Bay and Cramers Park are popular sites on the north
shore that receive far more park visitors than all other bays (Error! Reference source not
found.). The infrastructure associated with these three bays is predictably far more developed
than most other sample sites. Cramers Park has a large paved parking lot and covered picnic
areas that attract large numbers of people on the weekends. Likewise, the Chenay Bay Hotel
parking and facilities also attract visitors and the Green Cay Marina creates a high degree of boat
traffic coming in and out of Chenay Bay. The table at the bottom of Figure 2 also provides a
detailed description of the total area of various benthic habitat types present inside the
boundaries of the STXEEMP.

13
Figure 2. The spatial distribution of all activity types in each of the 18 bays and the time of the day/week when activity
occurs.
14
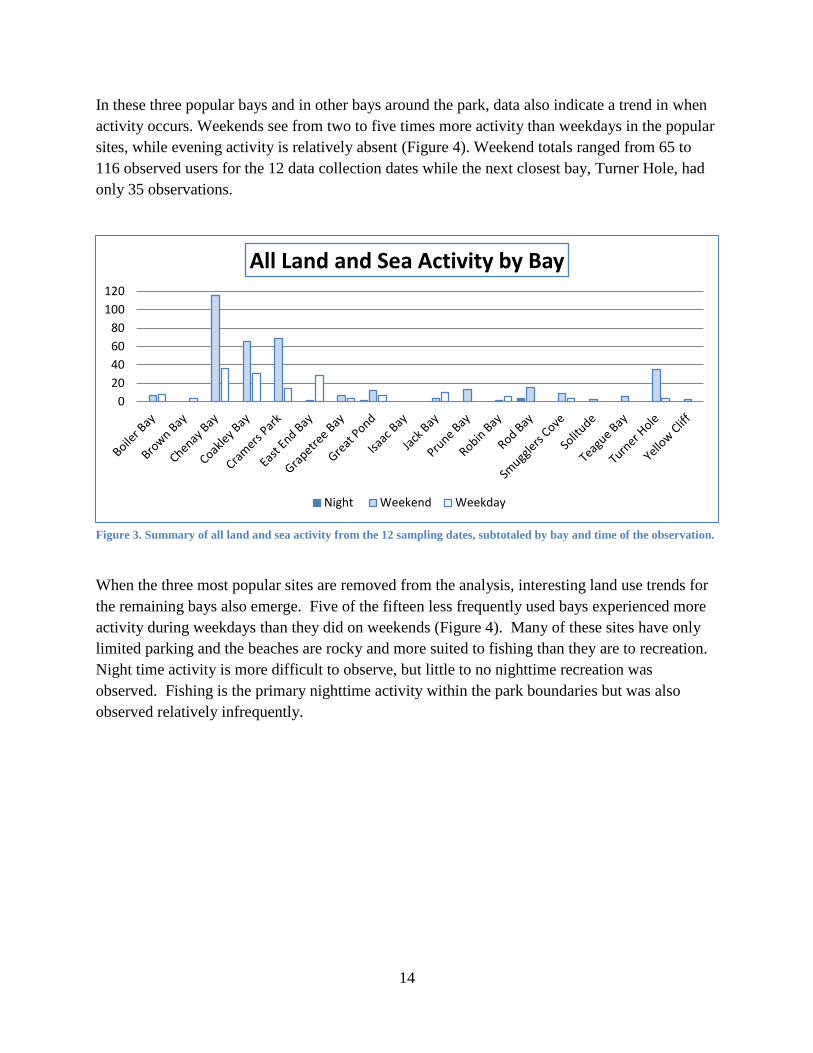
In these three popular bays and in other bays around the park, data also indicate a trend in when
activity occurs. Weekends see from two to five times more activity than weekdays in the popular
sites, while evening activity is relatively absent (Figure 4). Weekend totals ranged from 65 to
116 observed users for the 12 data collection dates while the next closest bay, Turner Hole, had
only 35 observations.
Figure 3. Summary of all land and sea activity from the 12 sampling dates, subtotaled by bay and time of the observation.
When the three most popular sites are removed from the analysis, interesting land use trends for
the remaining bays also emerge. Five of the fifteen less frequently used bays experienced more
activity during weekdays than they did on weekends (Figure 4). Many of these sites have only
limited parking and the beaches are rocky and more suited to fishing than they are to recreation.
Night time activity is more difficult to observe, but little to no nighttime recreation was
observed. Fishing is the primary nighttime activity within the park boundaries but was also
observed relatively infrequently.
0
20
40
60
80
100
120
All Land and Sea Activity by Bay
Night Weekend Weekday

15
Figure 4. Total shoreline and sea activity observed in the 15 less frequently used bays
Due to the logistical challenges of observing nighttime activity and specific activities occurring
far from the observation point, we developed a proxy measure to indirectly observe activity.
After consultation with STXEEMP staff it was determined that park users were only arriving at
sites in vehicles, not by foot. Therefore, counting unattended cars and boat trailers is an
indication of the level of activity at the site. Figure 5 demonstrates the distribution of observed
cars and boat trailers at the 18 bays within the STXEEMP boundaries and two additional boat
launch sites outside of the park. Not surprisingly, Chenay Bay, Coakley Bay and Cramers Park
again have the three highest numbers of observed cars. The number of boat trailer observations
at boat launch sites was naturally higher than all other sites, but an interesting trend can be seen
on the south shore. Great Pond, Robin Bay, Rod Bay and Turner Hole are four consecutive bays
on the south shore with rugged dirt road access and are utilized by fishers and as long-term,
multi-generational family camp sites. These four sites and Teague Bay/Smugglers Cove were
observed to occasionally have boat trailers and vehicles (both during the day and at night)
presumed to be associated with fishing.
05
10152025303540
Activity at Less Used Bays
Night Weekend Weekday

16
Figure 5. All observations of cars and trailers at 36 sampling sites in 18 bays
All forms of resource extraction are referred to here as fishing, including; line/nets/traps from
shore and from boats, diving for lobster, conch and spear fishing. Figure 6 shows that
observations of people actively fishing were relatively infrequent and tended to be concentrated
in a few bays. Shoreline fishing activity was observed in only six of the 18 bays, with no more
than five observations per bay. Figure 6 also shows the total number of observations of fishing
from boats.
Figure 6. Summary of three types of fishing metrics; shoreline fishing, fishing from a boat and the presence of fishing
boats (fishing or unattended).
In addition, a third variable “all fishing boats” includes unattended fishing boats (moored,
anchored or docked) and can also be considered a proxy measure of potential fishing in the area.
0
10
20
30
40
50
Sum of Car and Boat Trailer Observations by Bay
Sum Of Cars Sum Of BoatTrailers
0
2
4
6
8
10
Total Fishing Activity by Bay
Shoreline Fishing Boat Fishing All Fishing Boats

17
The boat trailer data from Figure 5 corroborate the results depicted in Figure 6 and show fisher
activity to be concentrated on the four consecutive bays along the south shore. Outside of these
four bays fishing activity was observed only occasionally, even at well-know, long-established
fishing spots. The high number of unattended fishing boats in Smugglers Cove is due to the
presence of the Yacht Club.
5. Discussion and Conclusions Given the large amount of data collected and the number of variables involved, there are many
ways to examine the results of the use-assessment survey. We have summarized the most
relevant conclusions and the potential effects on natural resources and associated management
implications.
A. Shoreline Activities Not surprisingly, areas with easy access to the shoreline, such as Chenay Bay, Coakley Bay and
Cramer‟s Park all had high usage based on both the numbers of user activity (Error! Reference
source not found.) and number of cars recorded (Figure 5). Turner Hole, the site of the Divi
Resort, is also a weekend hotspot for recreational users. These areas are potential candidates for
over-use and high impact on natural resources and may be good focal points for ongoing
biological and recreational-use impact monitoring. Recommendations for biological monitoring
can be found in Mayor 2006.
Chenay Bay‟s proximity to the Green Cay
Marina, its many easy beach access points
and the presence of a resort make it one of
the most visited areas in the STXEEMP.
As mentioned earlier in this document, it is
also one of the most important areas in
terms of natural resources, with an
important sea turtle nesting beach, seagrass
beds, patch reef, mangroves and a large
salt pond providing diverse habitat for all
life stages of many marine organisms. This
is a potential area of conflict between
recreational users and natural resources
and is a good target for more intense
monitoring and management.
Typical shoreline recreation activity on the north
shore of the STXEEMP

18
At all other locations around the STXEEMP, shoreline activity was generally at a low level with
few people seen at each location, both weekdays and weekends (Error! Reference source not
found.). Though often at low levels, we found that shoreline activity occurred at all but two
survey points. Further breakdown of recreational activity indicated the majority of shoreline
activity occurred on land including activities such as walking, sunbathing or picnicking, rather
than activities in the water such as swimming or snorkeling.
We did not observe any camping, but the survey period did not encompass any of the major
holidays that are traditional camping and beach-going days. It would be useful to conduct the
use-assessment survey during these holidays. The sheer volume of people on the beach and in
the water during these holidays has the potential to have a large impact on the natural resources.
Damage from improper trash disposal, noise pollution, waste oil from generators, and increased
water turbidity are all potential threats to marine resources from camping.
Most fishing activity that we observed
occurred on the south shore, although there
were no areas that could be considered
“hotspots” (Error! Reference source not
found.). Fishing involved little take,
although take was not quantitatively
assessed. In contrast, a 2006 review of the
biophysical characteristics of the STXEEMP
found that 1/3 of all finfish and ¼ of all
lobster and conch caught by commercial
fishers in St. Croix came from the
STXEEMP (Mayor 2006). Our surveys did
not capture this. All observations from our
use-assessment survey occurred from vantage
points on land and even with binoculars, it is
impossible to tell the volume of fish caught on a boat or in fish traps from a distance. To
monitor the volume of take from the STXEEMP, staff can work with DPNR-DFW to mine the
commercial catch report data.
We observed a high degree of stewardship at south shore access points. At one location in Rod
Bay, a group was observed picking up trash, caring for landscaped trees, cutting grass and
maintaining a small shelter (shanty). Many of the beaches along the southshore are cared for
year-round by multi-generational families that have been camping in the same location for
Truck and trailer at a typical beach access
along the south shore of STXEEMP

19
decades. This could be a useful opportunity for the STXEEMP to increase stakeholder
involvement in the park by encouraging the maintenance of shorelines and access points. It also
provides a great opportunity for outreach and education as family members of all ages were
observed assisting in stewardship activities.
A socio-economic survey conducted in 2003 found that SCUBA was not a common activity in
the STXEEMP; most SCUBA diving occurs in western St. Croix (Hinds Unlimited 2003).
During the use-assessment surveys, no SCUBA activity was recorded and interviews with Tour
Operators confirmed there is still little commercial SCUBA in the STXEEMP. We observed a
few snorkelers, but only rarely. According to tour operators, snorkel tours that once regularly
visited the STXEEMP have shifted to other locations outside of the park. Generally, SCUBA
and snorkeling does not appear to be a significant activity within the STXEEMP. However, with
increased tourism and the desire for new and different dive sites, this could change. There are
several shipwrecks within the STXEEMP that could become more popular dive sites under those
conditions (Appendix 7).
B. Boating Activities Our results show two areas that have high
levels of boat traffic: Chenay Bay (near the
Green Cay Marina) and the St. Croix Yacht
Club. Although both of these areas have
coral and seagrass, Chenay Bay has been
singled out as having especially high
ecological significance for both Biological
Services and Coastal Protection Services
(IRF 2002). Coral reefs and seagrass beds
are vulnerable to damage caused by
anchors and boat groundings. In other
areas of the Virgin Islands, damage to reefs
from boat groundings and anchors has been
severe (Rogers and Beets 2001) and coral
has not recovered from the damage (Rogers
and Garrison 2001 as cited in Rogers and Beets 2001). Even small boats anchored in seagrass
and coral can cause damage. Chenay Bay contains priority habitat for adult marine organisms
and important nursery, nesting and spawning habitat. In addition, Chenay Bay plays an
important role in supporting priority endangered species and commercially important species
(IRF 2002). This is an especially important area to maintain safe and functional mooring buoys
to prevent anchor damage.
The dock at the St. Croix Yacht Club
consistently had the highest average number of
boats per site

20
There were two sites at which multiple stationary boats were observed: The St. Croix Yacht Club
(at Smugglers Cove) and Chenay Bay. The number of stationary boats at Chenay Bay was
relatively low, averaging only two per survey. The Yacht club, on the other hand, averaged 45
stationary boats per survey. This large number of boats can have negative effects on water
quality through water contamination from fluid leakage and improper disposal of sewage.
Additionally, regular boat maintenance activities (repair, painting, etc.) can add additional
harmful pollutants to the marine ecosystem (Hinds Unlimited 2003). There is seagrass and coral
reef in the waters surrounding the Yacht Club that are vulnerable to damage caused by these
pollutants. DPNR – DEP collects water quality information at eight sites in the STXEEMP,
including a site at the Yacht Club. The results can be accessed online through STORET, an EPA
maintained database. This is a good resource for STXEEMP managers to use to monitor long
term changes in water quality. It will not necessarily capture any changes in water quality due to
finite events unless sampling happens to occur immediately after the event.
The two major boat launches: Altona Lagoon on the north shore and Castle Nugent on the south
shore were, not surprisingly, the points with the most boat trailers (Error! Reference source not
found.). Neither of these boat launches is actually within the STXEEMP but each is viewed as
an indicator of boat traffic within the park. It is likely that boats launched from these points
either travel to the park, or travel through the park to reach Lang Bank, a major fishing area off
of eastern St. Croix. There were triple the amount of boat trailers at Altona Lagoon than there
were at Castle Nugent. A few boat trailers were observed at small access points (undeveloped
points with no facilities), primarily on the south shore. Access to the water along the south shore
beaches is exclusively by rugged, unimproved dirt roads. Several of these roads are deeply
rutted as a result of erosion and others traverse sensitive coastal habitat. From the fishers‟
perspective access can be difficult, especially during periods of high rain and the road take a toll
on vehicles and trailers. Error! Reference source not found. shows some of the field
conditions encountered on the south shore during this project. While accessing the water at these
spots, vehicles and boats can potentially cause resource damage by driving on the beach,
contributing to shoreline erosion, and launching into seagrass beds.

21
Figure 7. (A) Vehicle access across sensitive, flooded coastal habitat and (B) an eroded dirt road used to access the beach
Many of the south shore access points involved a dangerous re-entry to the South Shore Road.
During the course of the survey, we observed a traffic accident in which a vehicle with a boat on
a trailer could not see oncoming traffic and was hit by another vehicle. The creation of a well
maintained, south shore boat launch at a spot of STXEEMP‟s staff‟s choosing (i.e. not in an
ecologically sensitive area) with safe access to the road might reduce accidents, reduce beach
and shoreline driving (thus reducing shoreline erosion) and allow STXEEMP staff to better
monitor boat traffic and impacts on natural resources.
C. Tour Operator Survey The tour operator phone survey showed that most of the commercial tour group activity occurs
on the north shore of the STXEEMP (Appendix 6). These activities include sunset sails, jet ski
tours and rental, kayak tours, kite surfing and occasional snorkeling tours. All of these activities
occur regularly on the north shore of the STXEEMP, but only kayak tours and kite surfing occur
regularly on the south shore. These two activities are relatively low impact and do not pose the
same threat of anchor damage, boat strikes and introduction of pollutants that motorized
activities do. Several of the tour operators were not knowledgeable about the STXEEMP rules
and regulations. Once the marker buoys are in place, it is recommended that the STXEEMP staff
provide tour operators with maps of the use zones and sensitive areas to avoid. Included with this
should be a fact sheet with “Best Use Practices” for operating within the STXEEMP.
D. Potential Future Impacts There are a few projects on the horizon that may cause major changes in recreational use of the
STXEEMP. The projects with the most potential impact include two proposed resorts that have
received CZM approval. One at Great Pond Bay has been in the works for many years and is

22
currently stalled due to litigation. The other, larger resort project has been proposed for
construction at Robin Bay. Both of these will greatly increase the number of recreational users
and the activities conducted on the south shore.

23
6. Literature Cited
Gardner. Lloyd. 2002. Management framework for a system of marine protected areas for the
U.S. Virgin Islands. University of the Virgin Islands and Department of Planning and Natural
Resources. USVI, September, 2002.
Hinds Unlimited, Socio-economic assessment of marine resource utilization in the U.S. Virgin
Islands. 2003. University of the Virgin Islands and the V.I. Department of Planning and
Natural Resources, United States Virgin Islands, February, 2003
Island Resources Foundation (IRF). 2002. Resource Description Report. University of the Virgin
Islands and Department of Planning and Natural Resources. USVI, August, 2002.
Mayor, P.A. 2006. A summary of biophysical data relevant to the management of the East End
Marine Park, St. Croix, US Virgin Islands. The Ocean Conservancy, US Virgin Islands
Regional Office, St. Croix, USVI, pp. 131.
Rogers, C.S. and J. Beets. 2001. Degradation of marine ecosystems and decline of fishery
resources in marine protected areas in the US Virgin Islands. Unpublished paper.
Rogers, C.S. & V. Garrison. 2001. Ten years after the crime: lasting effects of damage from a
cruise ship anchor on a coral reef in St John, US Virgin Islands. Bulletin of Marine Science
69:793–803.
The Nature Conservancy. 2002. St. Croix East End Marine Park management plan. University of
the Virgin Islands and Department of Planning and Natural Resources .U.S.V.I., July, 2002.
USVI 2002. Act No. 6572 Bill No. 24-038. To Amend Title 12 Chapter 1 of the Virgin Islands
Code to establish the St. Croix East End Marine Park and authorize the establishment of
other marine parks. U.S. Virgin Islands.

24
Appendices
Appendix 1. Literature Reviewed to Determine Gaps in Data
1. Acropora-Biological-Review-Team, Atlantic Acropora Status Review Document. Report
to National Marine Fisheries Service, Southeast Regional Office, 2005. March 3, 2005:
p. 153.
2. Adey, W.H. and R.S. Steneck, Highly Productive Eastern Caribbean Reefs: Synergistic
Effects of Biological, Chemical, Physical, and Geological Factors, in The Ecology of
Coral Reefs, Symposia Series for Undersea Research, M.L. Reaka, Editor. 1985, NOAA,
National Undersea Research Program: Rockville, MD. p. 163-187.
3. Allison, G.W., J. Lubchenco, and M.H. Carr, Marine Reserves are Necessary but Not
Sufficient for Marine Conservation Ecological Applications, 1998. 8(1 Suppliment): p.
S79-S92.
4. Bacle, J. and IRF, Utilization of Aerial Photography to Assess Changes in the
Distribution of Elkhorn Coral in the U.S. Virgin Islands U.S. Geological Survey
Biological Resources Division Caribbean Field Station, St. John U.S. Virgin Islands,
2002. June 2002.
5. Bartholomew, A. and J.A. Bohnsack, A review of catch-and-release angling mortality
with implications for no-take reserves. Reviews in Fish Biology and Fisheries, 2005. 15:
p. 129–154.
6. Batish, S., Demonstration of the Impact of Land Use on the Benthic Habitats of the U.
S.Virgin Islands with LandSat Satellite Imagery. Littoral 2002, The Changing Coast,
2002: p. 203-204.
7. Bellwood, D.R., et al., Confronting the coral reef crisis. Nature, 2004. 429(June 2004): p.
827-833.
8. Brandeis, T.J., et al., Development of equations for predicting Puerto Rican subtropical
dry forest biomass and volume. Forest Ecology and Management, 2006. 233(1): p. 133-
142.
9. Bruckner, A.W. and R.J. Bruckner, Condition of Restored Acropora palmata fragments
off Monda Island, Puerto Rico, Two Years after the Fortuna Reefer ship grounding. Coral
Reefs, 2001. 20: p. 235-243.

25
10. Gardner, L., Management Framework for a System of Marine Protected Areas for the
U.S. Virgin Islands. University of the Virgin Islands and Department of Natural
Resources, Division of Coastal Zone Management, 2002: p. 106.
11. Gardner, T.A., et al., Long-Term Region-Wide Declines in Caribbean Corals. Science,
2003. 301(15 AUGUST 2003): p. 958-960.
12. Garrison, V.H., et al., The habitats exploited and the species trapped in a Caribbean
island trap fishery. Environmental Biology of Fishes, 2004. 71: p. 247-260.
13. Gordon, S. and K.R. Uwate, 2002 Opinion Survey of U.S. Virgin Island Commercial
Fishers and the Marine Recreational Industry. 2003, Bureau of Fisheries Division of Fish
and Wildlife Department of Planning and Natural Resources U.S. Virgin Islands
Frederiksted. p. 33.
14. Gould, W.A., L. Vierling, and S. Martinuzzi, Integrating Lidar in Modeling GAP
Habitats Gap Analysis Bulletin, 2010. 17: p. 2.
15. Halpern, B.S., The Impact of Marine Reserves: Do Reserves Work and Does Reserve Size
Matter? Ecological Applications, 2003. 13(1 Suppliment): p. S117-S137.
16. Halpern, B.S., Are mangroves a limiting resource for two coral reef fishes? Marine
Ecology, Progress Series, 2004. 272: p. 93-98.
17. Hinds, U. and UVI, Socio-Economic Assessment of Marine Resource Utilization in the
U.S. Virgin Islands University of the Virgin Islands and Virgin Islands Department of
Planning and Natural Resources, 2003. Februrary 2007: p. 152.
18. Hinkey, L.M., et al., Identifying sources and distributions of sediment contaminants at
two US Virgin Islands marinas. Marine Pollution Bulletin, 2005. 50(11): p. 1244-1250.
19. Hughes, T.P., et al., Climate Change, Human Impacts, and the Resilience of Coral Reefs.
Science, 2003. 301(August 15, 2003): p. 929-933.
20. Hughes, T.P. and J.H. Connell, Multiple Stressors on Coral Reefs: A Long Term
Perspective. Limnology and Oceanography, 1999. 44(3, Part 2): p. 932-940.
21. IRF, The East End Area of Particular Concern (APC) and Area of Preservation and
Restoration (APR) Draft Management Plan. Contract PC P7NR-414-91 Virgin Islands
Department of Planning and Natural Resources Division of Coastal Zone Management
program 1992: p. 45.
22. IRF, The Great Pond Bay Area of Particular Concern (APC) and Area of Preservation
and Restoration (APR) Draft Management Plan. Contract P7NR-414-91 Virgin Islands

26
Department of Planning and Natural Resources Division of Coastal Zone Management
program, 1992: p. 45.
23. IRF, St. Croix Coral Reef System Area of Particular Concern (APC) and Area of
Preservation and Restoration (APR) Draft Management Plan. Contract PC PNR-330-92
Virgin Islands Department of Planning and Natural Resources Division of Coastal Zone
Management program 1993: p. 63.
24. IRF, Resource Description Report, East End Marine Park. University of the Virgin
Islands and the Department of Natural Resources, 2002(USVI, 14 August, 2002): p. 175.
25. L. Bunce, P.T., R. Pomeroy, R. Pollnac, Socioeconomic Manual for Coral Reef
Management, G.C.R.M. Network, Editor. 2000, Australian Institute of Marine Science:
Townsville Q 4810.
26. Lutchman, I., Marine Protected Areas: Benefits and Costs for the Islands. 2005. p. 64.
27. Mateo, I., Nearshore Habitats as Nursery Grounds for Recreational Important Fishes:
Final Report. 2001, USVI Division of Fish and Wildlife: St. Croix. p. 76.
28. Mateo, I., Nearshore Habitats as Nursery Grounds for Recreational Important Fishes:
Final Report F-7 October 1, 2000 to September 30, 2001 2002, USVI Divirion of Fish
and Wildlife: St. Croix. p. 76.
29. Mateo, I. and W.J. Tobias, Distribution of Shallow Water Coral Reef Fishes on the
Northeast Coast of St. Croix, USVI. Caribbean Journal of Science, 2001. 37(3-4): p. 210-
226.
30. Mateo, I. and W.J. Tobias, Survey of Nearshore Fish Communities on Tropical Backreef
Lagoons on the Southeastern Coast of St. Croix. Caribbean Journal of Science, 2004.
40(3): p. 327-342.
31. Mayor, P.A., C.S. Rogers, and Z.M. Hillis-Starr, Distribution and abundance of elkhorn
coral, Acropora palmata,and prevalence of white-band disease at Buck Island Reef
National Monument, St. Croix, US Virgin Islands. Coral Reefs, 2006. 25: p. 239-242.
32. Menza, C., J. Ault, J. Beets, J. Bohnsack, C. Caldow, J. Christensen, A. Friedlander, C.
Jeffrey, M., Kendall, J. Luo, M. Monaco, S. Smith and K. Woody, A Guide to Monitoring
Reef Fish inthe National Park Service’s South Florida / Caribbean Network, in NOAA
Technical Memorandum NOS NCCOS 39, NOAA, Editor. 2006, NOAA. p. 166.
33. Moberg, F. and C. Folke, Ecological goods and services of coral reef ecosystems.
Ecological Economics, 1999. 29: p. 215-233.

27
34. Nemeth, R., Population characteristics of a recovering US Virgin Islands red hind
spawning aggregation following protection. Marine Ecology Progress Series, 2006. 286:
p. 81-97.
35. Nemeth, R.S., L.D. Whaylen, and C.V. Pattengill-Semmens, A Rapid Assessment of
Coral Reefs in the U.S. Virgin Islands (Part 2: Fishes), in Status of Coral Reefs in the
western Atlantic: Results of Initial Surveys, Atlantic and Gulf Rapid Reef Assessment
(AGRRA) Program:Atoll Research Bulletin 496, J.C. Lang, Editor. 2003.
36. NOAA, Stock Assessment and Fishery Evaluation report for the Snapper Grouper
Fishery of the South Atlantic, November 18, 2005 NOAA, Editor. 2005.
37. Pearce, J.B., Biological survey of submerged refuse. Marine Pollution Bulletin, 1972.
3(10): p. 157-159.
38. Pomeroy, R.S., Parks, J.E. and Watson, L.M, How is your MPA doing? A Guidebook of
Natural and Social Indicators for Evaluating Marine Protected Area Management
Effectiveness, ed. IUCN. 2004, Gland, Switzerland and Cambridge, UK: IUCN. xvi +
216.
39. Rioja-Nieto, R. and C. Sheppard, Effects of management strategies on the landscape
ecology of a Marine Protected Area. Ocean & Coastal Management, 2008. 51(5): p. 397-
404.
40. Rogers, C., V. Garrison, and R. Grober-Dunsmore, A fishy story about hurricanes and
herbivory: seven years of research on a reef in St John, US Virgin Islands. Proceeding of
the International Coral Reef Symposium 1, ed. H. A. Lessios & I.G. Macintyre, 1997: p.
555-560.
41. Rogers, C.S., Hurricanes and Anchors: Preliminary Results from the National Park
Service Regional Reef Assessment Program. US National Park Service, Virgin Islands
National Park, St. John, 1994: p. 6.
42. Rogers, C.S. and J. Beets, Degradation of marine ecosystems and decline of fishery
resources in marine protected areas in the US Virgin Islands. Environmental
Conservation, 2001. 28(4): p. 312-322.
43. Rogers, C.S. and N.H. Salesky, Productivity of Acropora Palmata (Lamrck) Macroscopic
Algae, and Algal Turf from Tague Bay Reef, St. Croix, U.S. Virgin Islands. Journal of
Experimental Marine Biology and Ecology, 1981. 49: p. 179-187.
44. Smith, T.B., et al., Assessing coral reef health across onshore to offshore stress gradients
in the US Virgin Islands. Marine Pollution Bulletin, 2008. 56(12): p. 1983-1991.

28
45. Thomas, J., ed. Bulletin of Marine Science: 50th Anniversary. Proceedings of the
International Conference on Scientific Aspects of Coral Reef Assessment, Monitoring,
and Restoration, ed. J.D. Thomas. Vol. 69. 2001, Rosentiel School of Marine and
Atmospheric Science: Miami. 771.
46. Tobias, W., et al., The determination of mangrove habitat for nursery grounds of
recreational fisheries in St . Croix, Oct 1991 - September 30, 1995. Final Report Project
F-7 of the Recreational Fisheries Habitat Assessment: U.S . Fish and Wildlife Service
Sport Fish Restoration Program 1996: p. 82.
47. USVI-DPNR-DFW, Marine Resources and Fisheries Strategic and Comprehensive
Conservation Plan. 2005: p. 540.
48. USVI-Legislature, Act No. 6572 Bill No. 24-038 To Amend Title 12 Chapter 1 of the
Virgin Islands Code to Establish the St. Croix East End Marine Park and authorize the
establishment of other marine parks: 24th Legislature of the U.S. Virgin Islands,
t.L.o.t.U.S.V. Islands, Editor. 2002: Virgin Islands.
49. W. Adey, W.G., J. Ogden, R. Dill, Field Guide to the Reefs and the Reef Communities of
St. Croix, Virgin Islands. Third International Symposium on Coral Reefs, ed. U.o.M. The
Atlantic Reef Committee. 1977, Miami Beach, FL.

29
Appendix 2. St Croix EEMP Activity Survey Data Sheet
30
Appendix 3. Summary of Results for Activity Survey

31
Appendix 4. Data Collection Protocol for St. Croix EEMP Use Assessment

32
Appendix 5. Example Field Data Collection Sheets for Use Assessment Study

33
Appendix 6. Tour Operator Phone Interview Results

34
Appendix 7. Locations of shipwrecks as indicated by DPNR