ssue il ue the uganda business climate indexageconsearch.umn.edu/bitstream/198742/2/9 perceptions...
TRANSCRIPT
1The Uganda Business Climate Index
April – June 2014Issue 9
players are included in our sample. The rest of the businesses were selected using simple random sampling within each stratum. Sample weights were used in the computation of the results. The respondents are the business managers. We keep following the same businesses every quarter. The distribution of the sampled businesses is presented in Table 1.
Table 1: Distribution of the sampled business, %
BusinessSizea % Sub sector % Location %Micro 8.02 Agriculture and agro
processing17.11 Kampala 42.25
Small 36.36 Hotels, recreation and tourism
19.25 Central 24.60
Medium 33.69 Manufacturing and industry 14.97 West 12.83Large 21.93 Mechanical services 10.16 East 10.16
Retail and wholesale trade 21.93 North 10.16Finance, IT and other services 8.02Social Services 8.56
Total 100 100 100
Notes: a The classification of businesses by size was guided by the World Bank Enterprise Surveys that classify a business as Micro if it employs no greater than 4 people; Small if it employs 5-19; Medium if it employs 20-99; and large if it employs more than 100 people.
Evaluation Methods
The business climate index is computed based on the following business evaluation indicators: level of business activity, turnover, profitability, incoming new business, capacity utilisation, average costs for inputs, price of produced goods, business optimism, number of employees, and average monthly salary. For each of the evaluation indicators, respondents are asked to express their perceptions on a Likert scale as follows:
“improved”, “did not change”, “declined” or “above normal for quarter”, “normal for quarter”, below normal for quarter” or “more favourable”, “unchanged”, “less favourable”. These responses are coded as 0, 1, and 2 respectively. In this case, if a respondent’s perception of the business environment is that it deteriorated, such a response would be coded 0, it would be coded 1 if business climate did not change and 2 if business climate improved.
Notice that the index does not consider the magnitude of change in the data but considers the general direction of movement in the key indicators. As such, the index is sensitive to the direction as opposed to the magnitude of the change in business conditions.
Perceptions indicate elevated risks in the business environment
April – June 2014Issue 9
The Uganda BusinessClimate Index
Corti Paul Lakuma and Joseph Mawejje
Executive Summary
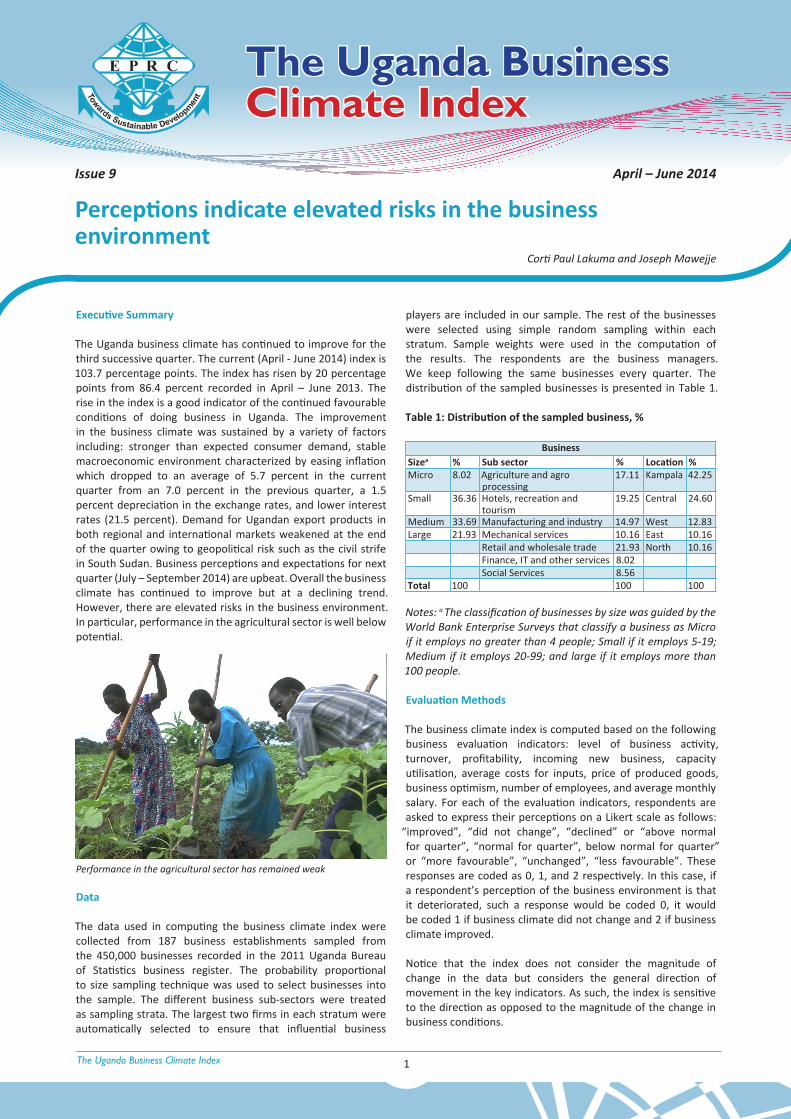
The Uganda business climate has continued to improve for the third successive quarter. The current (April - June 2014) index is 103.7 percentage points. The index has risen by 20 percentage points from 86.4 percent recorded in April – June 2013. The rise in the index is a good indicator of the continued favourable conditions of doing business in Uganda. The improvement in the business climate was sustained by a variety of factors including: stronger than expected consumer demand, stable macroeconomic environment characterized by easing inflation which dropped to an average of 5.7 percent in the current quarter from an 7.0 percent in the previous quarter, a 1.5 percent depreciation in the exchange rates, and lower interest rates (21.5 percent). Demand for Ugandan export products in both regional and international markets weakened at the end of the quarter owing to geopolitical risk such as the civil strife in South Sudan. Business perceptions and expectations for next quarter (July – September 2014) are upbeat. Overall the business climate has continued to improve but at a declining trend. However, there are elevated risks in the business environment. In particular, performance in the agricultural sector is well below potential.
Performance in the agricultural sector has remained weak
Data
The data used in computing the business climate index were collected from 187 business establishments sampled from the 450,000 businesses recorded in the 2011 Uganda Bureau of Statistics business register. The probability proportional to size sampling technique was used to select businesses into the sample. The different business sub-sectors were treated as sampling strata. The largest two firms in each stratum were automatically selected to ensure that influential business

2The Uganda Business Climate Index
April – June 2014Issue 9
During the data collection process, the business managers were asked to assess the general economic environment for the current (April – June 2014) quarter relative to the previous quarter (January - March 2014); and their expectations for the next quarter (July- September 2014). Based on the business evaluation indicators explained earlier, the business climate index is then computed as the weighted arithmetic and seasonally adjusted mean of indices of the individual business evaluation indicators. The indices range from 0 – 200. The interpretation of the business climate index is such that scores above 100 point to an improving business climate. Scores below 100 imply that the general business conditions are getting worse. And, a score of 100 points to unchanged business conditions.
Results
Business Climate Remains Favourable in the Current Quarter
Results indicate that the general perceptions about the business environment have remained favourable in the current quarter (April – June 2014), but overall sentiment is declining as shown by the reducing index. The business climate index is 103.7 and is 20.0 percentage points (20.0 index points) higher than that of the same quarter last year (April – June 2013) which was 86.4 points. However, the business climate index fell by 8.6 percentage points from (113.4) that was recorded in the last quarter (January - March 2013).
Figure 1 shows that the annual improvement in the business climate perceptions was sustained by improved consumer demand amid a stable macroeconomic environment characterized by low inflation and competitive interest rates. However, declining quarter-on-quarter index points to some risks in the current business environment. In particular, domestically, the loss of confidence in the profitability of businesses, capacity utilization, cost of inputs and employability of existing labour have contributed to overall weakening sentiment. Generally, businesses expect better conditions in the third quarter (July – September 2014). The expected increased capacity utilization, favourable output prices and low input cost are largely expected to drive the positive perceptions about the third quarter.
The Business Climate Index by Sector
Consistent to the previous quarter (January - March 2014), the service sector explains most of the sentiments for a favourable businesses environment reported in this quarter (April – June 2014) with a sector business climate index of 105.3. The confidence in the service sector was largely attributed to
favourable output prices, improved business activity and survival of existing clients and contracts.
As predicted in the first quarter, the perception on the business environment in the agricultural sector weakened in this quarter. As such, the agricultural sector business climate index dropped to 67.5 from 109.92 in the last quarter. The unfavourable sentiment in the agriculture sector in this quarter is consistent to that expressed in the second quarter last year (April – June 2013). Hence, the weak sentiment is likely to be due to cyclical changes common to the agricultural sector in Uganda in the second quarter. There is low supply of agricultural output during, March to May, the planting season. The data suggest that the weak sentiments are largely buoyed by a decline in profits, and a less than favourable input cost and output prices.
On the other hand, the business climate index for the manufacturing sector slipped by 7.6 percentage points from that of January – March 2014 (102.9). The slowdown in the manufacturing sector in this quarter is consistent to the contraction in business activity in the manufacturing sector in April – June 2013. The data suggest that the weak confidence in the manufacturing sector in this quarter is mainly exacerbated by a perception of less than favourable input cost, stagnation in profits and capacity under-utilization. The rise in input cost are likely to be linked to low supply in the agricultural sector. Nevertheless, the fall in the business climate index is countered by a general perception of an improved business environment in the manufacturing sector.
Figure 1: The Business Climate Assessment
Figure 2: Business Climate Index by Sector
Evaluation indicators such as profitability of businesses, capacity utilization, input cost, demand for labour, and availability of new business opportunities have all consistently scored below 100 across all sectors in this quarter. The low score suggests that business conditions are getting worse for those evaluation indicators across all sectors. The fall in evaluation indicators could explain the deteriorating business climate in the agricultural manufacturing and service sector. Moreover, the agriculture sector is the lowest ranked in all the evaluation indicators mentioned above. Any policy that seeks to cut the cost of doing business by promoting the use of the available cheap labour may drive profit margins and minimize wastage not only in the agricultural sector, but also in manufacturing and service sector. Given the limited opportunity for business expansion, businesses across sectors need to promote value addition to minimise market share losses and improve competiveness in the regional and international markets.
3The Uganda Business Climate Index
April – June 2014Issue 9
What explains the favourable business climate assessment?The Uganda business climate has maintained a favourable business sentiment in the current quarter (April – June 2014) despite posting a weaker quarterly performance in comparison to the previous quarter (January – March 2014). The favourable business sentiment was driven by a strong consumer demand (29.6 percent), stable macroeconomic environment (14.8 percent), favourable regional export demand (13 percent), favourable international export demand (6.5 percent), improvement in business processes (5.6 percent), more favourable product prices (3.7 percent), and better access to financing (2.8 percent) among others. In the discussion that follows, we explain the three most important reasons for an improving business environment.
i) Improved demandAs indicated in Figure 3, improved consumer demand (29.6 percent) continues to be the major driver of business climate improvement. Our results show that the indices for sales turnover (104), business activity (109.4), and incoming new business (109.5) are all above the 100 mark implying that there were improvements in relation to the previous quarter. These results suggest favourable sentiment with regards to business activities and consumer demand.
ii) Macroeconomic StabilityAt least 14.8 percent of the businesses attribute the favourable sentiments to stable macroeconomic environment characterised a low inflation (5.7 percent) and lower interest rates (21. 5 percent). This environment has maintained the momentum in the positive outlook of the business environment in Uganda in this quarter. Headline inflation fell by to 5.7 percent in the current quarter from 7.0 percent in the previous quarter. However, the 1.5 percent depreciation in the exchange rate, in this quarter, explains much of the uncertainty in the markets. Consequently, the quarterly lending rate responded by increasing from 21.40 percent in January – March 2014 to 21.5 in April – June 2014.
iii) Regional and international market dynamicsDespite a slowdown in the global economy, business opportunities in the regional and international market remained robust in this quarter due to a strong demand for Ugandan goods. However, the elevated geopolitical risks presented by instability in South Sudan and the Middle East and North Africa (MENA) region may have partially slowed down the momentum of investments in Uganda’s agriculture, manufacturing and service sector. For illustration, the instability in the MENA region largely explains the reduction in the demand for Uganda’s tea. Consequently, tea prices have fallen by more than 50 percent
since 2010.
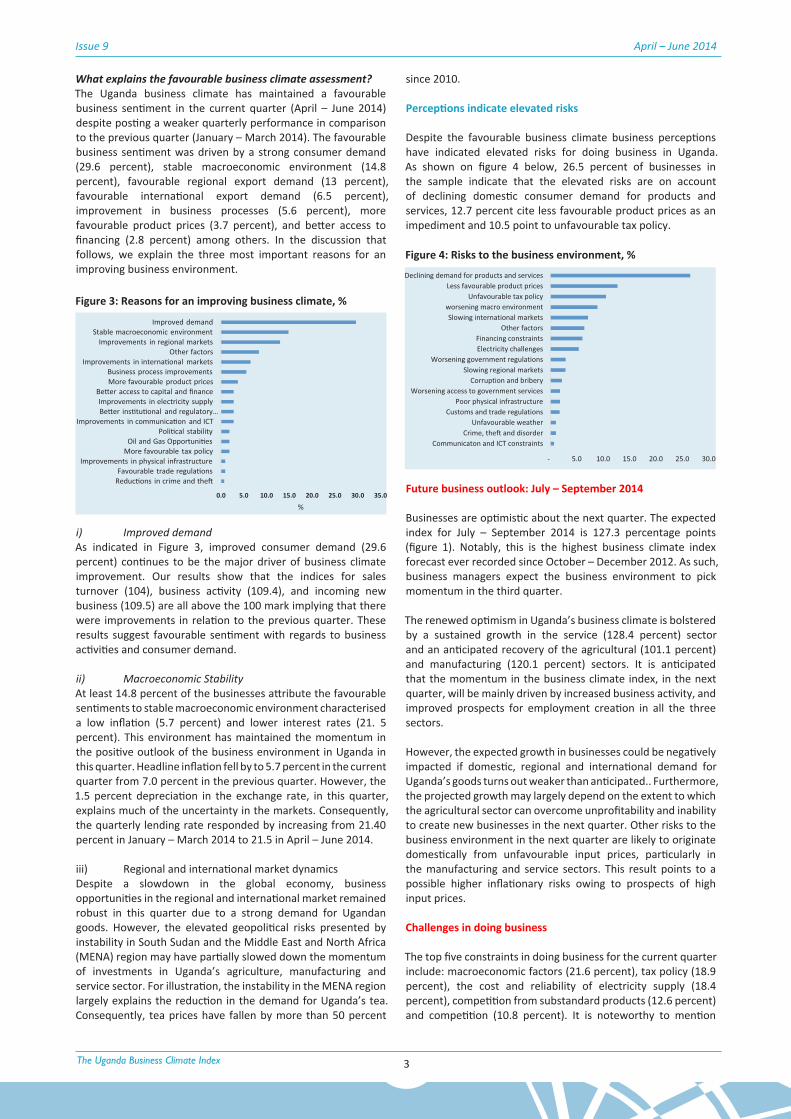
Perceptions indicate elevated risks
Despite the favourable business climate business perceptions have indicated elevated risks for doing business in Uganda. As shown on figure 4 below, 26.5 percent of businesses in the sample indicate that the elevated risks are on account of declining domestic consumer demand for products and services, 12.7 percent cite less favourable product prices as an impediment and 10.5 point to unfavourable tax policy.
Future business outlook: July – September 2014
Businesses are optimistic about the next quarter. The expected index for July – September 2014 is 127.3 percentage points (figure 1). Notably, this is the highest business climate index forecast ever recorded since October – December 2012. As such, business managers expect the business environment to pick momentum in the third quarter.
The renewed optimism in Uganda’s business climate is bolstered by a sustained growth in the service (128.4 percent) sector and an anticipated recovery of the agricultural (101.1 percent) and manufacturing (120.1 percent) sectors. It is anticipated that the momentum in the business climate index, in the next quarter, will be mainly driven by increased business activity, and improved prospects for employment creation in all the three sectors.
However, the expected growth in businesses could be negatively impacted if domestic, regional and international demand for Uganda’s goods turns out weaker than anticipated.. Furthermore, the projected growth may largely depend on the extent to which the agricultural sector can overcome unprofitability and inability to create new businesses in the next quarter. Other risks to the business environment in the next quarter are likely to originate domestically from unfavourable input prices, particularly in the manufacturing and service sectors. This result points to a possible higher inflationary risks owing to prospects of high input prices.
Challenges in doing business
The top five constraints in doing business for the current quarter include: macroeconomic factors (21.6 percent), tax policy (18.9 percent), the cost and reliability of electricity supply (18.4 percent), competition from substandard products (12.6 percent) and competition (10.8 percent). It is noteworthy to mention
Figure 3: Reasons for an improving business climate, %
Figure 4: Risks to the business environment, %
4The Uganda Business Climate Index
April – June 2014Issue 9
The views expressed in this publication are those of the authors and do not necessarily represent the views of the Economic Policy Research Centre or its management.Copyright © 2011 Economic Policy Research Centre
About EPRCThe Economic Policy Research Centre (EPRC) is an autonomous not-for-profit organization established in 1993 with a mission to foster sustainable growth and development in Uganda through advancement of research –based knowledge and policy analysis.
AddressEconomic Policy Research CentrePlot 51, Pool Road, Makerere University CampusP.O. Box 7841, Kampala, UgandaTel: +256-414-541023/4Fax: +256-414-541022Email: [email protected]
AcknowledgementThe Business Climate Survey was conducted by a team of EPRC Researchers led by Joseph Mawejje (Research Analyst). The team appreciates the support received from all participating business establishments across the country, our partners at the Uganda National Chamber of Commerce and Industry, Kampala City Traders Association and all persons who reviewed and edited this publication. Special thanks goes to Deogratius Katongole for the data management.
Learn more at www. eprc.or.ug
that the interpretation of business constraints results should be done with caution. The quarterly ranking of “challenges in doing business” does not imply that a specific element is improving or deteriorating. Such ranking only reflect the elements that are currently deemed more relevant to firms.
Compared to the last quarter (Jan – March 2014), there have been changes in the top obstacles to doing business in Uganda indicating a shift in business perception about the most pressing challenges in the current quarter. Specifically, tax policy that ranked number 3 in the previous quarter has emerged as the number 2 challenge in the current quarter. This is not surprising considering the proposed tax bill on agricultural inputs and essential consumer commodities such as salt, milk, sugar and paraffin. It is widely viewed that the proposed tax-bill may have a considerable impact on consumer welfare and the anticipated recovery of the agricultural and manufacturing sector.
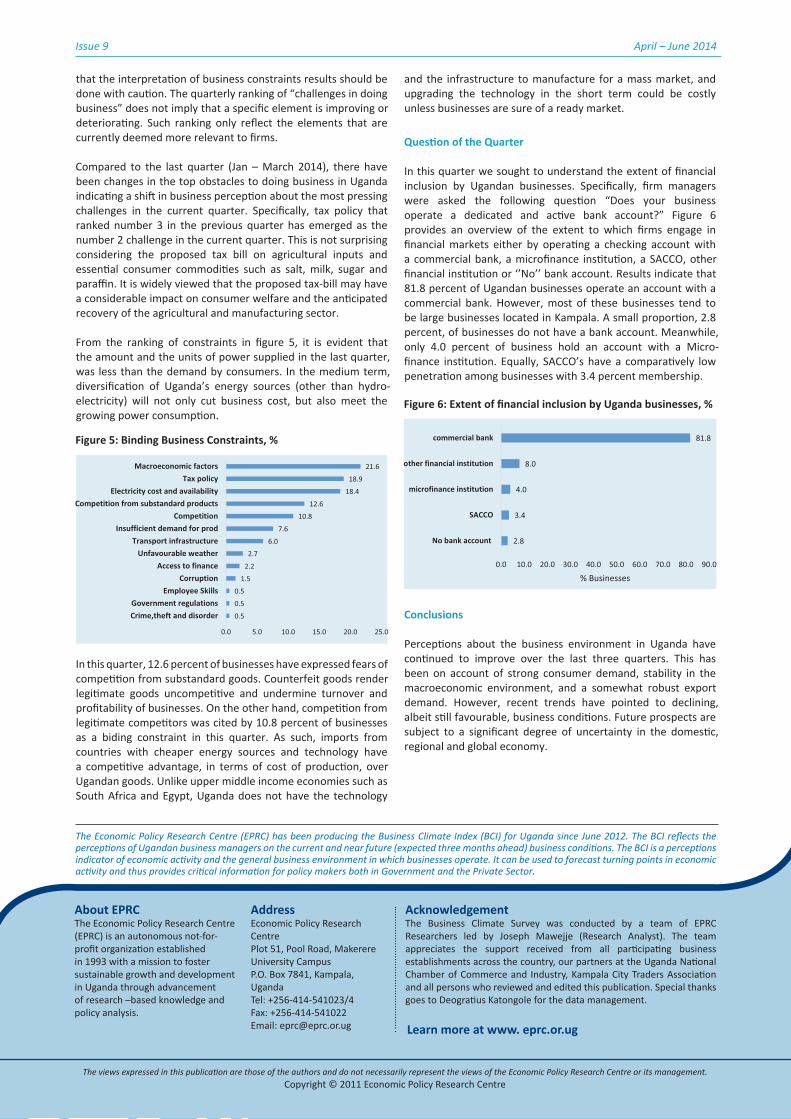
From the ranking of constraints in figure 5, it is evident that the amount and the units of power supplied in the last quarter, was less than the demand by consumers. In the medium term, diversification of Uganda’s energy sources (other than hydro-electricity) will not only cut business cost, but also meet the growing power consumption.
In this quarter, 12.6 percent of businesses have expressed fears of competition from substandard goods. Counterfeit goods render legitimate goods uncompetitive and undermine turnover and profitability of businesses. On the other hand, competition from legitimate competitors was cited by 10.8 percent of businesses as a biding constraint in this quarter. As such, imports from countries with cheaper energy sources and technology have a competitive advantage, in terms of cost of production, over Ugandan goods. Unlike upper middle income economies such as South Africa and Egypt, Uganda does not have the technology
and the infrastructure to manufacture for a mass market, and upgrading the technology in the short term could be costly unless businesses are sure of a ready market.
Question of the Quarter
In this quarter we sought to understand the extent of financial inclusion by Ugandan businesses. Specifically, firm managers were asked the following question “Does your business operate a dedicated and active bank account?” Figure 6 provides an overview of the extent to which firms engage in financial markets either by operating a checking account with a commercial bank, a microfinance institution, a SACCO, other financial institution or ‘’No’’ bank account. Results indicate that 81.8 percent of Ugandan businesses operate an account with a commercial bank. However, most of these businesses tend to be large businesses located in Kampala. A small proportion, 2.8 percent, of businesses do not have a bank account. Meanwhile, only 4.0 percent of business hold an account with a Micro- finance institution. Equally, SACCO’s have a comparatively low penetration among businesses with 3.4 percent membership.
Conclusions
Perceptions about the business environment in Uganda have continued to improve over the last three quarters. This has been on account of strong consumer demand, stability in the macroeconomic environment, and a somewhat robust export demand. However, recent trends have pointed to declining, albeit still favourable, business conditions. Future prospects are subject to a significant degree of uncertainty in the domestic, regional and global economy.
The Economic Policy Research Centre (EPRC) has been producing the Business Climate Index (BCI) for Uganda since June 2012. The BCI reflects the perceptions of Ugandan business managers on the current and near future (expected three months ahead) business conditions. The BCI is a perceptions indicator of economic activity and the general business environment in which businesses operate. It can be used to forecast turning points in economic activity and thus provides critical information for policy makers both in Government and the Private Sector.
Figure 5: Binding Business Constraints, %
Figure 6: Extent of financial inclusion by Uganda businesses, %