ssttaatt –– 332244 - fac.ksu.edu.sa · department of statistics and operations research college...
TRANSCRIPT

Department of Statistics and Operations Research
College of Science, King Saud University
SSTTAATT –– 332244
PPrroobbaabbiilliittyy aanndd SSttaattiissttiiccss ffoorr EEnnggiinneeeerrss
EEXXEERRCCIISSEESS
A Collection of Questions Selected from
Midterm and Final Examinations' Papers
for the Years from 1422 to 1427
PREPARED BY:
Dr. Abdullah Al-Shiha
STAT-324 EXERCISES Dr. Abdullah Al-Shiha
- 1 -
1. COMBINATIONS
Q1. A man wants to paint his house in 3 colors. If he can choose 3 colors out of 6 colors,
how many different color settings can he make?
(A) 216 (B) 20 (C) 18 (D) 120 (E) 110
Q2. The number of ways in which we can select two students among a group of 5 students is
(A) 120 (B) 10 (C) 60 (D) 20 (E) 110
Q3. The number of ways in which we can select a president and a secretary among a group of
5 students is
(A) 120 (B) 10 (C) 60 (D) 20 (E) 110
-----------------------------------------------------------------------------------------------
From Book: (Pages 42-43)
2.4 An experiment involves tossing a pair of dice, one green and one red, and recording the
numbers that come up.
If x equals the outcome on the green die and y the outcome on the red die, describe the sample
space S
(a) by listing the elements (x, y).
2.8 For the sample space of Exercise 2.4,
(a) list the elements corresponding to the event A that the sum is greater than 8.
(b) list the elements corresponding to the event B that a 2 occurs on either die.
(c) list the elements corresponding to the event C that a number greater than 4 comes up on the
green die.
(d) list the elements corresponding to the event A∩C.
(e) list the elements corresponding to the event A∩B.
(f) list the elements corresponding to the event B∩C.
STAT-324 EXERCISES Dr. Abdullah Al-Shiha
- 2 -
2.15 Consider the sample space S = {copper, sodium, nitrogen, potassium, uranium, oxygen,
zinc} and the events
A = {copper, sodium, zinc},
B = {sodium, nitrogen, potassium},
C = {oxygen}.
List the elements of the sets corresponding to the following events:
(a) A' ;
(b) A ∪ C ;
(c) (A ∩ B')∪ C' ;
(d) B' ∩ C' ;
(e) A ∩ B ∩ C;
(f) (A'∪ B') ∩ (A' ∩ C).
2.16 If S = {x | 0 < x < 12}, M = {x | 1 < x < 9}, and N = {x | 0 < x < 5}, find
(a) M ∪ N;
(b) M ∩ N;
(c) M '∩ N '.
2.23 If an experiment consists of throwing a die and then drawing a letter at random from
the English alphabet, how many points are there in the sample
space?
2.33 If a multiple-choice test consists of 5 questions, each with 4 possible answers of which
only 1 is correct,
(a) in how many different ways can a student check off one answer to each question?
(b) in how many ways can a student check off one answer to each question and get all
the answers wrong?
2.36
(a) How many three-digit numbers can be formed from the digits 0, 1, 2, 3, 4, 5, and 6 if each
digit can be used only once?
(b) How many of these are odd numbers?
2.45 : How many distinct permutations can be made from the letters of the word INFINITY ?
Homework: 2.1 – 2.5 – 2.9 – 2.11 – 2.14 pages(42,43)
Homework: 2.22 , 2.24 , 2.30, 2.34 (a)

STAT-324 EXERCISES Dr. Abdullah Al-Shiha
- 3 -
2. PROBABILITY, CONDITIONAL PROBABILITY, AND INDEPENDENCE
Q1. Let A, B, and C be three events such that: P(A)=0.5, P(B)=0.4, P(CAc)=0.6, P(CA)=0.2, and
P(AB)=0.9. Then
(a) P(C) =
(A) 0.1 (B) 0.6 (C) 0.8 (D) 0.2 (E) 0.5
(b) P(BA) =
(A) 0.0 (B) 0.9 (C) 0.1 (D) 1.0 (E) 0.3
(c) P (C|A) =
(A) 0.4 (B) 0.8 (C) 0.1 (D) 1.0 (E) 0.7
(d) P (BcA
c) =
(A) 0.3 (B) 0.1 (C) 0.2 (D) 1.1 (E) 0.8
Q2. Consider the experiment of flipping a balanced coin three times independently.
(a) The number of points in the sample space is
(A) 2 (B) 6 (C) 8 (D) 3 (E) 9
(b) The probability of getting exactly two heads is
(A) 0.125 (B) 0.375 (C) 0.667 (D) 0.333 (E) 0.451
(c) The events ‘exactly two heads’ and ‘exactly three heads’ are
(A) Independent (B) disjoint (C) equally
likely
(D) identical (E) None
(d) The events ‘the first coin is head’ and ‘the second and the third coins are tails’ are
(A) Independent (B) disjoint (C) equally
likely
(D) identical (E) None
Q3. Suppose that a fair die is thrown twice independently, then
1. the probability that the sum of numbers of the two dice is less than or equal to 4 is;
(A) 0.1667 (B) 0.6667 (C) 0.8333 (D) 0.1389
2. the probability that at least one of the die shows 4 is;
(A) 0.6667 (B) 0.3056 (C) 0.8333 (D) 0.1389
3. the probability that one die shows one and the sum of the two dice is four is;
(A) 0.0556 (B) 0.6667 (C) 0.3056 (D) 0.1389
4. the event A={the sum of two dice is 4} and the event B={exactly one die shows two} are,
(A) Independent (B) Dependent (C) Joint (D) None of these.
Q4. Assume that 3.0)( AP , 4.0)( BP , 03.0)( CBAP , and 88.0)( BAP , then
1. the events A and B are,
(A) Independent (B) Dependent (C) Disjoint (D) None of these.
2. )( BACP is equal to,
(A) 0.65 (B) 0.25 (C) 0. 35 (D) 0.14
Q5. If the probability that it will rain tomorrow is 0.23, then the probability that it will not rain tomorrow is:
(A) 0.23 (B) 0.77 (C) 0.77 (D) 0.23
Q6. The probability that a factory will open a branch in Riyadh is 0.7, the probability that it will open a branch
in Jeddah is 0.4, and the probability that it will open a branch in either Riyadh or Jeddah or both is 0.8. Then,
the probability that it will open a branch:

STAT-324 EXERCISES Dr. Abdullah Al-Shiha
- 4 -
1) in both cities is:
(A) 0.1 (B) 0.9 (C) 0.3 (D) 0.8
2) in neither city is:
(A) 0.4 (B) 0.7 (C) 0.3 (D) 0.2
Q7. The probability that a lab specimen is contaminated is 0.10. Three independent specimen are checked.
1) the probability that none is contaminated is:
(A) 0.0475 (B) 0.001 (C) 0.729 (D) 0. 3
2) the probability that exactly one sample is contaminated is:
(A) 0.243 (B) 0.081 (C) 0.757 (D) 0. 3
Q8. 200 adults are classified according to sex and their level of education in the following table:
Sex
Education
Male (M) Female (F)
Elementary (E) 28 50
Secondary (S) 38 45
College (C) 22 17
If a person is selected at random from this group, then:
1) the probability that he is a male is:
(A) 0.3182 (B) 0.44 (C) 0.28 (D) 78
2) The probability that the person is male given that the person has a secondary
education is:
(A) 0.4318 (B) 0.4578 (C) 0.19 (D) 0.44
3) The probability that the person does not have a college degree given that the
person is a female is:
(A) 0.8482 (B) 0.1518 (C) 0.475 (D) 0.085
4) Are the events M and E independent? Why? [P(M)=0.44 P(M|E)=0.359 dependent]
Q9. 1000 individuals are classified below by sex and smoking habit.
SEX
Male (M) Female (F)
SMOKING
HABIT
Daily (D) 300 50
Occasionally (O) 200 50
Not at all (N) 100 300
A person is selected randomly from this group.
1. Find the probability that the person is female. [P(F)=0.4]
2. Find the probability that the person is female and smokes daily. [P(FD)=0.05]
3. Find the probability that the person is female, given that the person smokes daily. [P(F|D)=0.1429]
4. Are the events F and D independent? Why? [P(F)=0.4 P(F|D)=0.1429 dependent]
Q10. Two engines operate independently, if the probability that an engine will start is 0.4, and the probability
that the other engine will start is 0.6, then the probability that both will start is:
(A) 1 (B) 0.24 (C) 0.2 (D) 0.5
Q11. If 3.0)( BP and 4.0)( BAP , then )( BAP equals to;
(A) 0.67 (B) 0.12 (C) 0.75 (D) 0.3
STAT-324 EXERCISES Dr. Abdullah Al-Shiha
- 5 -
Q12. The probability that a computer system has an electrical failure is 0.15, and the probability that it has a
virus is 0.25, and the probability that it has both problems is 0.10, then the probability that the computer system
has the electrical failure or the virus is:
(A) 1.15 (B) 0.2 (C) 0.15 (D) 0.30
Q13. From a box containing 4 black balls and 2 green balls, 3 balls are drawn independently in succession, each
ball being replaced in the box before the next draw is made. The probability of drawing 2 green balls and 1
black ball is:
(A) 6/27 (B) 2/27 (C) 12/27 (D) 4/27
Q14. 80 students are enrolled in STAT-324 class. 60 students are from engineering college and the rest are from
computer science college. 10% of the engineering college students have taken this course before, and 5% of the
computer science college students have taken this course before. If one student from this class is randomly
selected, then:
1) the probability that he has taken this course before is:
(A) 0.25 (B) 0.0875 (C) 0.8021 (D) 0. 75
2) If the selected student has taken this course before then the probability that he is from the
computer science college is:
(A) 0.1429 (B) 0.375 (C) 0.80 (D) 0. 25
Q15. Two machines A and B make 80% and 20%, respectively, of the products in a certain factory. It is known
that 5% and 10% of the products made by each machine, respectively, are defective. A finished product is
randomly selected.
1. Find the probability that the product is defective. [P(D)=0.06]
2. If the product were found to be defective, what is the probability that it was made by machine B.
[P(B|D)=0.3333]
Q16. If P(A1)=0.4, P(A1A2)=0.2, and P(A3|A1A2)=0.75, then
(1) P(A2|A1) equals to
(A) 0.00 (B) 0.20 (C) 0.08 (D) 0.50
(2) P(A1A2A3) equals to
(A) 0.06 (B) 0.35 (C) 0.15 (D) 0.08
Q17. If P(A)=0.9, P(B)=0.6, and P(AB)=0.5, then:
(1) P(ABC) equals to
(A) 0.4 (B) 0.1 (C) 0.5 (D) 0.3
(2) P(ACB
C) equals to
(A) 0.2 (B) 0.6 (C) 0.0 (D) 0.5
(3) P(B|A) equals to
(A) 0.5556 (B) 0.8333 (C) 0.6000 (D) 0.0
(4) The events A and B are
(A) independent (B) disjoint (C) joint (D) none
(5) The events A and B are
(A) disjoint (B) dependent (C) independent (D) none
Q18. Suppose that the experiment is to randomly select with replacement 2 children and register their gender
(B=boy, G=girl) from a family having 2 boys and 6 girls.
(1) The number of outcomes (elements of the sample space) of this experiment equals to
(A) 4 (B) 6 (C) 5 (D) 125

STAT-324 EXERCISES Dr. Abdullah Al-Shiha
- 6 -
(2) The event that represents registering at most one boy is
(A) {GG, GB, BG} (B) {GB, BG} (C) C{GB} (D) {GB, BG, BB}
(3) The probability of registering no girls equals to
(A) 0.2500 (B) 0.0625 (C) 0.4219 (D) 0.1780
(4) The probability of registering exactly one boy equals to
(A) 0.1406 (B) 0.3750 (C) 0.0141 (D) 0.0423
(5) The probability of registering at most one boy equals to
(A) 0.0156 (B) 0.5000 (C) 0.4219 (D) 0.9375
----------------------------------------------------------------------------------------------------------
From book: Page 59
2.49
Find the errors in each of the following statements:
(a)The probabilities that an automobile salesperson will sell 0, 1, 2, or 3 cars on any given day
in February are, respectively, 0.19, 0.38, 0.29, and 0.15.
(b) The probability that it will rain tomorrow is 0.40, and the probability that it will not rain
tomorrow is 0.52.
(c) The probabilities that a printer will make 0, 1, 2,3, or 4 or more mistakes in setting a
document are, respectively, 0.19, 0.34,−0.25, 0.43, and 0.29.
(d) On a single draw from a deck of playing cards, the probability of selecting a heart is 1/4, the
probability of selecting a black card is 1/2, and the probability of selecting both a heart and a
black card is 1/8.
------------------------------------------------------------------------------------------------
2.90 Page71: Pollution of the rivers in the United States has been a problem for many years.
: the river is polluted,AConsider the following events:
: fishing is permitted. Ca sample of water tested detects pollution, :B
Homework : 2.58, 2.63,2.66 , 2.94 تحويل القيم بالجدول إلى كسر عشري
P(A)=0.95
P(B)=0.7
P(C)=0.8 0.8
P(D)=0.
9
STAT-324 EXERCISES Dr. Abdullah Al-Shiha
- 7 -
3. BAYES RULE:
Q1. 80 students are enrolled in STAT-324 class. 60 students are from engineering college and the rest are from
computer science college. 10% of the engineering college students have taken this course before, and 5% of the
computer science college students have taken this course before. If one student from this class is randomly
selected, then:
1) the probability that he has taken this course before is:
(A) 0.25 (B) 0.0875 (C) 0.8021 (D) 0. 75
2) If the selected student has taken this course before then the probability that he
is from the computer science college is:
(A) 0.1429 (B) 0.375 (C) 0.80 (D) 0. 25
Q2. Two machines A and B make 80% and 20%, respectively, of the products in a certain factory. It is known
that 5% and 10% of the products made by each machine, respectively, are defective. A finished product is
randomly selected.
(a) Find the probability that the product is defective. [P(D)=0.06]
(b) If the product were found to be defective, what is the probability that it was made by machine B.
[P(B|D)=0.3333]
Q3. Dates' factory has three assembly lines, A, B, and C. Suppose that the assembly lines A, B, and C account
for 50%, 30%, and 20% of the total product of the factory. Quality control records show that 4% of the dates
packed by line A, 6% of the dates packed by line B, and 12% of the dates packed by line C are improperly
sealed. If a pack is randomly selected, then:
(a) the probability that the pack is from line B and it is improperly sealed is
(A) 0.018 (B) 0.30 (C) 0.06 (D) 0.36 (E) 0.53
(b) the probability that the pack is improperly sealed is
(A) 0.62 (B) 0.022 (C) 0.062 (D) 0.22 (E) 0.25
(c) if it is found that the pack is improperly sealed, what is the probability that it is from line B?
(A) 0.0623 (B) 0.0223 (C) 0.6203 (D) 0.2203 (E) 0.2903
Q4. Two brothers, Mohammad and Ahmad own and operate a small restaurant. Mohammad washes 50% of the
dishes and Ahmad washes 50% of the dishes. When Mohammad washes a dish, he might break it with
probability 0.40. On the other hand, when Ahmad washes a dish, he might break it with probability 0.10. Then,
(a) the probability that a dish will be broken during washing is:
(A) 0.667 (B) 0.25 (C) 0.8 (D) 0.5
(b) If a broken dish was found in the washing machine, the probability that it was washed by
Mohammad is:
(A) 0.667 (B) 0.25 (C) 0.8 (D) 0.5
Q5. A vocational institute offers two training programs (A) and (B). In the last semester, 100 and 300 trainees
were enrolled for programs (A) and (B), respectively. From the past experience it is known that the passing
probabilities are 0.9 for program (A) and 0.7 for program (B). Suppose that at the end of the last semester, we
selected a trainee at random from this institute.
(1) The probability that the selected trainee passed the program equals to
(A) 0.80 (B) 0.75 (C) 0.85 (D) 0.79
(2) If it is known that the selected trainee passed the program, then the probability that he has
been enrolled in program (A) equals to
(A) 0.8 (B) 0.9 (C) 0.3 (D) 0.7

STAT-324 EXERCISES Dr. Abdullah Al-Shiha
- 8 -
4. RANDOM VARIABLES, DISTRIBUTIONS, EXPECTATIONS
AND CHEBYSHEV's THEOREM:
4.1. DISCRETE DISTRIBUTIONS:
Q1. Consider the experiment of flipping a balanced coin three times independently.
Let X= Number of heads – Number of tails.
(a) List the elements of the sample space S.
(b) Assign a value x of X to each sample point.
(c) Find the probability distribution function of X.
(d) Find P( X 1 )
(e) Find P( X < 1 )
(f) Find =E(X)
(g) Find 2=Var(X)
Q2. It is known that 20% of the people in a certain human population are female. The experiment is to select a
committee consisting of two individuals at random. Let X be a random variable giving the number of females in
the committee.
1. List the elements of the sample space S.
2. Assign a value x of X to each sample point.
3. Find the probability distribution function of X.
4. Find the probability that there will be at least one female in the committee.
5. Find the probability that there will be at most one female in the committee.
6. Find =E(X)
7. Find 2=Var(X)
Q3. A box contains 100 cards; 40 of which are labeled with the number 5 and the other cards are labeled with
the number 10. Two cards were selected randomly with replacement and the number appeared on each card was
observed. Let X be a random variable giving the total sum of the two numbers.
(i) List the elements of the sample space S.
(ii) To each element of S assign a value x of X.
(iii) Find the probability mass function (probability distribution function) of X.
(iv) Find P(X=0).
(v) Find P(X>10).
(vi) Find =E(X)
(vii) Find 2=Var(X)
Q4. Let X be a random variable with the following probability distribution:
x 3 6 9
f(x) 0.1 0.5 0.
4
1) Find the mean (expected value) of X, =E(X).
2) Find E(X2).
3) Find the variance of X, Var (X) = 2X .
4) Find the mean of 2X+1, 12)12( XXE .
5) Find the variance of 2X+1, Var(2X+1)= 2
12 X .

STAT-324 EXERCISES Dr. Abdullah Al-Shiha
- 9 -
Q5. Which of the following is a probability distribution function:
(A) 10
1)(
xxf ; x=0,1,2,3,4 (B)
5
1)(
xxf ; x=0,1,2,3,4
(C) 5
1)( xf ; x=0,1,2,3,4 (D)
6
5)(
2xxf
; x=0,1,2,3
Q6. Let the random variable X have a discrete uniform with parameter k=3 and with values 0,1, and 2. The
probability distribution function is:
f(x)=P(X=x)=1/3 ; x=0, 1, 2.
(1) The mean of X is
(A) 1.0 (B) 2.0 (C) 1.5 (D) 0.0
(2) The variance of X is
(A) 0.0 (B) 1.0 (C) 0.67 (D) 1.33
Q7. Let X be a discrete random variable with the probability distribution function:
f(x) = kx for x=1, 2, and 3.
(i) Find the value of k.
(ii) Find the cumulative distribution function (CDF), F(x).
(iii) Using the CDF, F(x), find P (0.5 < X 2.5).
Q8. Let X be a random variable with cumulative distribution function (CDF) given by:
2 x , 1
2x1 , 0.6
10 ,25.0
0 , 0
)(x
x
xF
(a) Find the probability distribution function of X, f(x).
(b) Find P( 1≤X<2). (using both f(x) and F(x))
(c) Find P( X>2). (using both f(x) and F(x))
Q9. Consider the random variable X with the following probability distribution function:
X 0 1 2 3
f(x) 0.4 c 0.3 0.1
The value of c is
(A) 0.125 (B) 0.2 (C) 0.1 (D) 0.125 (E) 0.2
Q10. Consider the random variable X with the following probability distribution function:
X 1 0 1 2
f(x) 0.2 0.3 0.2 c
Find the following:
(a) The value of c.
(b) P( 0 < X ≤ 2 )
(c) = E(X)
(d) E(X2)
(e) 2 = Var(X)
STAT-324 EXERCISES Dr. Abdullah Al-Shiha
- 10 -
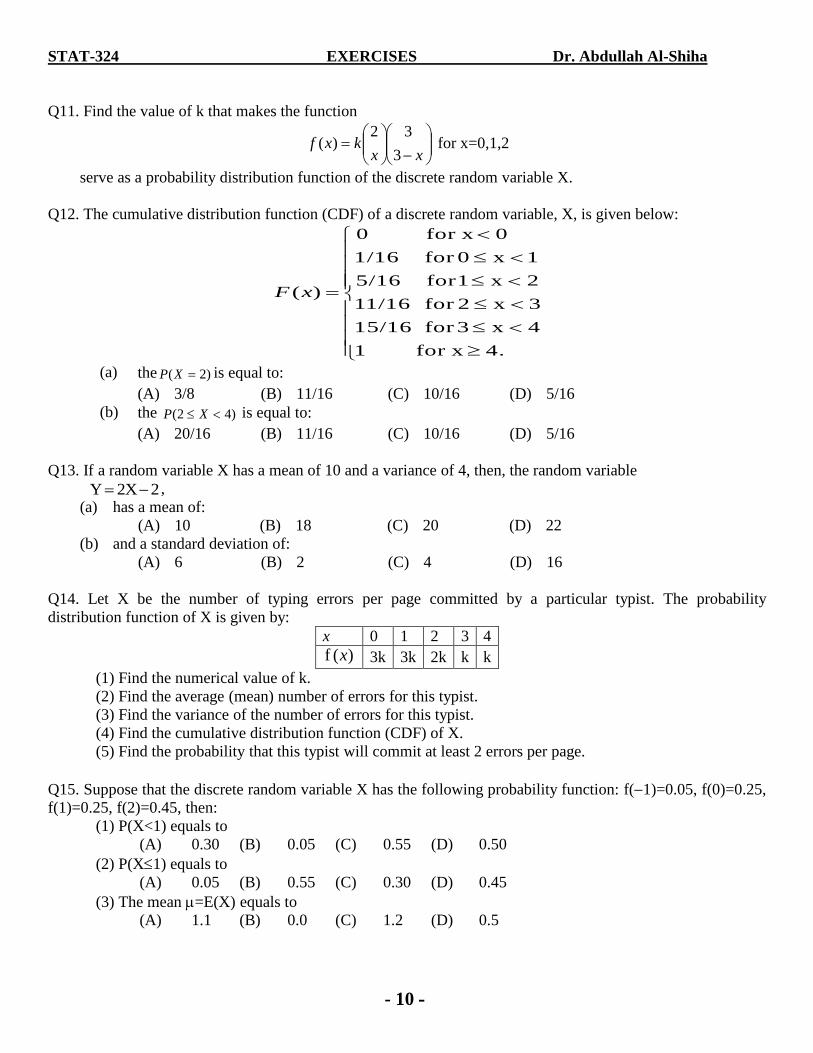
Q11. Find the value of k that makes the function
xxkxf
3
32)( for x=0,1,2
serve as a probability distribution function of the discrete random variable X.
Q12. The cumulative distribution function (CDF) of a discrete random variable, X, is given below:
4.for x 1
4x3for 15/16
3x2for 11/16
2x1for 5/16
1x0for 1/16
0for x 0
)(xF
(a) the )2( XP is equal to:
(A) 3/8 (B) 11/16 (C) 10/16 (D) 5/16
(b) the )42( XP is equal to:
(A) 20/16 (B) 11/16 (C) 10/16 (D) 5/16
Q13. If a random variable X has a mean of 10 and a variance of 4, then, the random variable
2X2Y ,
(a) has a mean of:
(A) 10 (B) 18 (C) 20 (D) 22
(b) and a standard deviation of:
(A) 6 (B) 2 (C) 4 (D) 16
Q14. Let X be the number of typing errors per page committed by a particular typist. The probability
distribution function of X is given by:
x 0 1 2 3 4
)(f x 3k 3k 2k k k
(1) Find the numerical value of k.
(2) Find the average (mean) number of errors for this typist.
(3) Find the variance of the number of errors for this typist.
(4) Find the cumulative distribution function (CDF) of X.
(5) Find the probability that this typist will commit at least 2 errors per page.
Q15. Suppose that the discrete random variable X has the following probability function: f(1)=0.05, f(0)=0.25,
f(1)=0.25, f(2)=0.45, then:
(1) P(X<1) equals to
(A) 0.30 (B) 0.05 (C) 0.55 (D) 0.50
(2) P(X1) equals to
(A) 0.05 (B) 0.55 (C) 0.30 (D) 0.45
(3) The mean =E(X) equals to
(A) 1.1 (B) 0.0 (C) 1.2 (D) 0.5

STAT-324 EXERCISES Dr. Abdullah Al-Shiha
- 11 -
(4) E(X2) equals to
(A) 2.00 (B) 2.10 (C) 1.50 (D) 0.75
(5) The variance 2=Var(X) equals to
(A) 1.00 (B) 3.31 (C) 0.89 (D) 2.10
(6) If F(x) is the cumulative distribution function (CDF) of X, then F(1) equals to
(A) 0.50 (B) 0.25 (C) 0.45 (D) 0.55
4.2. CONTINUOUS DISTRIBUTIONS:
Q1. If the continuous random variable X has mean μ=16 and variance σ2=5, then )16( XP is
(A) 0.0625 (B) 0.5 (C) 0.0 (D) None of these.
Q2. Consider the probability density function:
elsewhere. 0,
1x0 , )(
xkxf
1) The value of k is:
(A) 1 (B) 0.5 (C) 1.5 (D) 0.667
2) The probability )6.03.0( XP is,
(A) 0.4647 (B) 0.3004 (C) 0.1643 (D) 0.4500
3) The expected value of X, )(XE is,
(A) 0.6 (B) 1.5 (C) 1 (D) 0.667
[Hint: cx
dxx)2/3(
2/3
]
Q3. Let X be a continuous random variable with the probability density function f(x)=k(x+1) for 0<x<2.
(i) Find the value of k.
(ii) Find P(0 < X 1).
(iii) Find the cumulative distribution function (CDF) of X, F(x) .
(iv) Using F(x), find P(0 < X 1).
Q4. Let X be a continuous random variable with the probability density function f(x)=3x2/2 for 1<x<1.
1. P(0<X<1) = …………..
2. E(X) = …………………
3. Var(X) = …………….…
4. E(2X+3)= ………………
5. Var(2X+3)= ……………
Q5. Suppose that the random variable X has the probability density function:
.;0
20;)(
elsewhere
xxkxf
1. Evaluate k.
2. Find the cumulative distribution function (CDF) of X, F(x).
3. Find P(0 < X < 1).
4. Find P(X = 1) and P(2 < X < 3).
STAT-324 EXERCISES Dr. Abdullah Al-Shiha
- 12 -
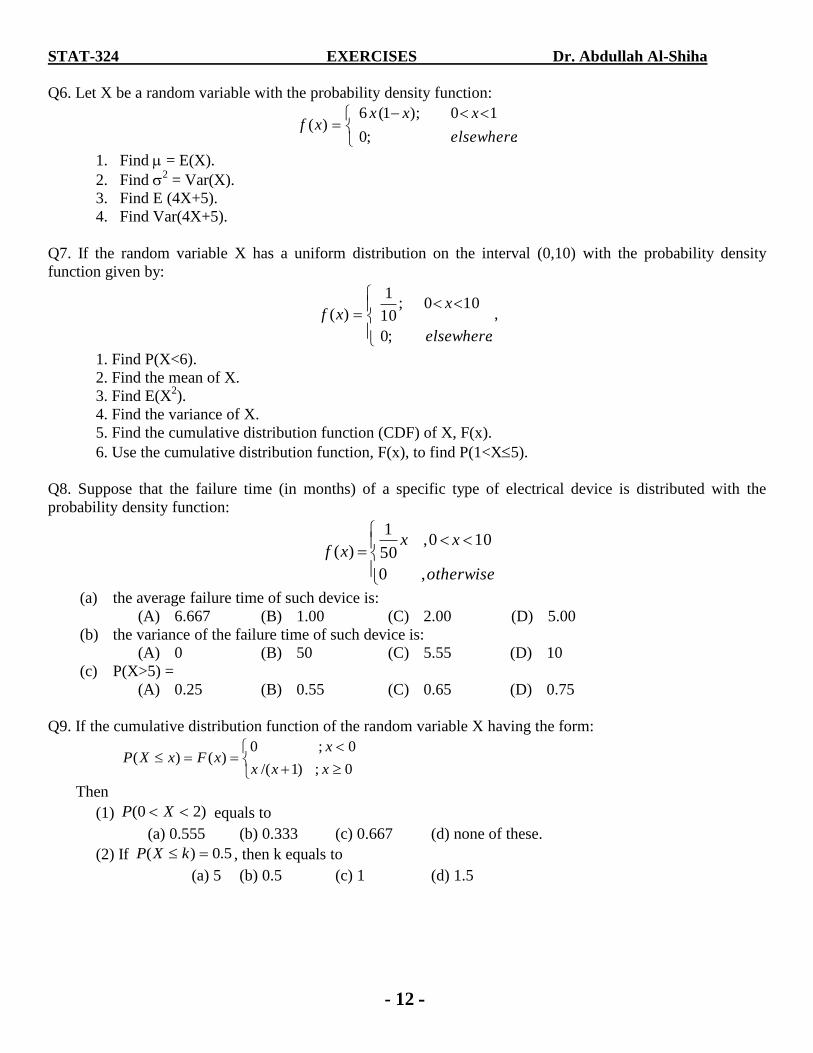
Q6. Let X be a random variable with the probability density function:
.;0
10);1(6)(
elsewhere
xxxxf
1. Find = E(X).
2. Find 2 = Var(X).
3. Find E (4X+5).
4. Find Var(4X+5).
Q7. If the random variable X has a uniform distribution on the interval (0,10) with the probability density
function given by:
.;0
100;10
1
)(
elsewhere
xxf ,
1. Find P(X<6).
2. Find the mean of X.
3. Find E(X2).
4. Find the variance of X.
5. Find the cumulative distribution function (CDF) of X, F(x).
6. Use the cumulative distribution function, F(x), to find P(1<X5).
Q8. Suppose that the failure time (in months) of a specific type of electrical device is distributed with the
probability density function:
otherwise
xxxf
,0
100,50
1
)(
(a) the average failure time of such device is:
(A) 6.667 (B) 1.00 (C) 2.00 (D) 5.00
(b) the variance of the failure time of such device is:
(A) 0 (B) 50 (C) 5.55 (D) 10
(c) P(X>5) =
(A) 0.25 (B) 0.55 (C) 0.65 (D) 0.75
Q9. If the cumulative distribution function of the random variable X having the form:
0;)1/(
0;0)()(
xxx
xxFxXP
Then
(1) )20( XP equals to
(a) 0.555 (b) 0.333 (c) 0.667 (d) none of these.
(2) If 5.0)( kXP , then k equals to
(a) 5 (b) 0.5 (c) 1 (d) 1.5
STAT-324 EXERCISES Dr. Abdullah Al-Shiha
- 13 -
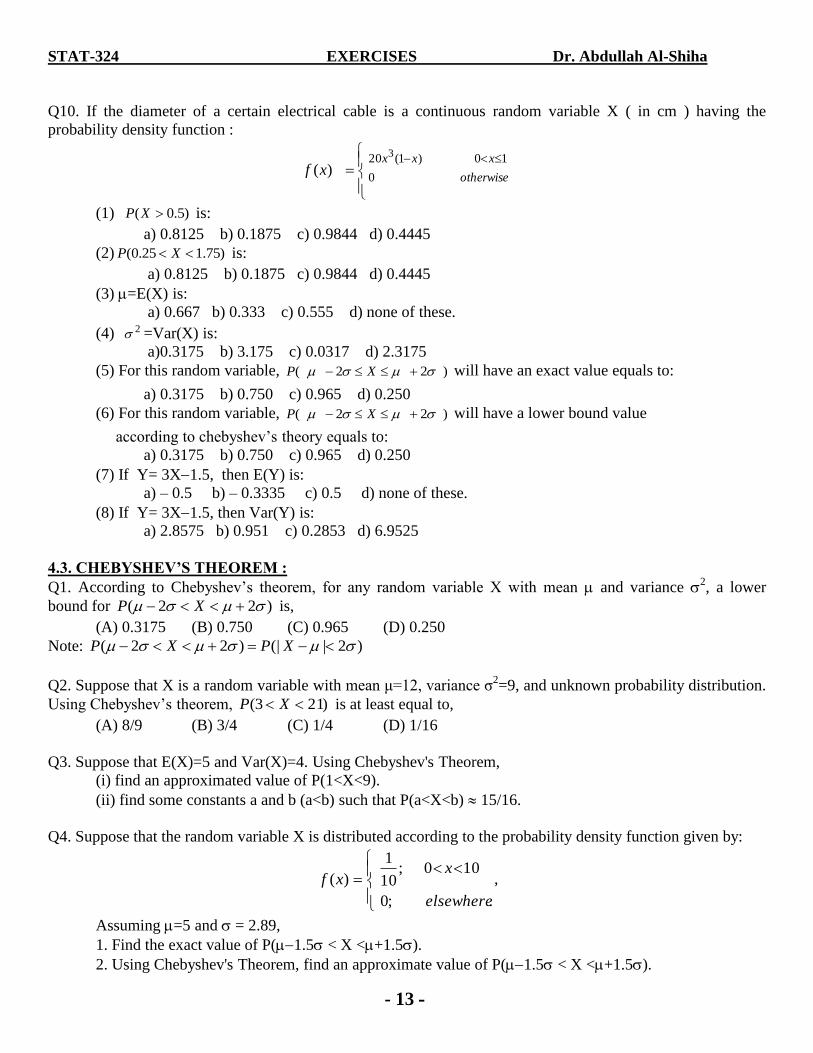
Q10. If the diameter of a certain electrical cable is a continuous random variable X ( in cm ) having the
probability density function :
10)1(20
0
3
)(xxx
otherwisexf
(1) )5.0( XP is:
a) 0.8125 b) 0.1875 c) 0.9844 d) 0.4445
(2) )75.125.0( XP is:
a) 0.8125 b) 0.1875 c) 0.9844 d) 0.4445
(3) =E(X) is:
a) 0.667 b) 0.333 c) 0.555 d) none of these.
(4) 2 =Var(X) is:
a)0.3175 b) 3.175 c) 0.0317 d) 2.3175
(5) For this random variable, )22( XP will have an exact value equals to:
a) 0.3175 b) 0.750 c) 0.965 d) 0.250
(6) For this random variable, )22( XP will have a lower bound value
according to chebyshev’s theory equals to:
a) 0.3175 b) 0.750 c) 0.965 d) 0.250
(7) If Y= 3X1.5, then E(Y) is:
a) – 0.5 b) – 0.3335 c) 0.5 d) none of these.
(8) If Y= 3X1.5, then Var(Y) is:
a) 2.8575 b) 0.951 c) 0.2853 d) 6.9525
4.3. CHEBYSHEV’S THEOREM :
Q1. According to Chebyshev’s theorem, for any random variable X with mean and variance 2, a lower
bound for )22( XP is,
(A) 0.3175 (B) 0.750 (C) 0.965 (D) 0.250
Note: )2|(|)22( XPXP
Q2. Suppose that X is a random variable with mean μ=12, variance σ2=9, and unknown probability distribution.
Using Chebyshev’s theorem, )213( XP is at least equal to,
(A) 8/9 (B) 3/4 (C) 1/4 (D) 1/16
Q3. Suppose that E(X)=5 and Var(X)=4. Using Chebyshev's Theorem,
(i) find an approximated value of P(1<X<9).
(ii) find some constants a and b (a<b) such that P(a<X<b) 15/16.
Q4. Suppose that the random variable X is distributed according to the probability density function given by:
.;0
100;10
1
)(
elsewhere
xxf ,
Assuming =5 and = 2.89,
1. Find the exact value of P(1.5 < X <+1.5).
2. Using Chebyshev's Theorem, find an approximate value of P(1.5 < X <+1.5).

STAT-324 EXERCISES Dr. Abdullah Al-Shiha
- 14 -
3. Compare the values in (1) and (2).
Q5. Suppose that X and Y are two independent random variables with E(X)=30, Var(X)=4, E(Y)=10, and
Var(Y)=2. Then:
(1) E(2X3Y10) equals to
(A) 40 (B) 20 (C) 30 (D) 90
(2) Var(2X3Y10) equals to
(A) 34 (B) 24 (C) 2.0 (D) 14
(3) Using Chebyshev's theorem, a lower bound of P(24<X<36) equals to
(A) 0.3333 (B) 0.6666 (C) 0.8888 (D) 0.1111
Page 91 : From book
3.2 An overseas shipment of 5 foreign automobiles contains 2 that have slight paint blemishes.
If an agency receives 3 of these automobiles at random, list the elements of the sample space S,
using the letters B and N for blemished and non- blemished, respectively; then to each sample
point assign a value x of the random variable X representing the number of automobiles with
paint blemishes purchased by the agency.
3.5 Determine the value c so that each of the following functions can serve as a probability
distribution of the discrete random variable X:
(a)
(b)
3.6 The shelf life, in days, for bottles of a certain prescribed medicine is a random variable
having the density function
Find the probability that a bottle of this medicine will have a shell life of
(a) at least 200 days;
(b) anywhere from 80 to 120 days.

STAT-324 EXERCISES Dr. Abdullah Al-Shiha
- 15 -
3.14 The waiting time, in hours, between successive speeders spotted by a radar unit is a
continuous random variable with cumulative distribution function
Find the probability of waiting less than 12 minutes between successive speeders
(a) using the cumulative distribution function of X;
(b) using the probability density function of X.
3.21 Consider the density function
(a) Evaluate k.
(b) Find F(x) and use it to evaluate P(0.3 < X < 0.6).
Homework : 3.9- 3.12- 3.26
4.12 If a dealer’s profit, in units of $5000, on a new automobile can be looked upon as a random
variable X having the density function
find the average profit per automobile.
4.17 Let X be a random variable with the following probability distribution:
x -3 6 9
f(x) 1/6 1/2 1/3
Find , where .
4.32 In Exercise 3.13 on page 92, the distribution of the number of imperfections per 10 meters
of synthetic fabric is given by
x 0 1 2 3 4
f(x) 0.41 0.37 0.16 0.05 0.01
(b) Find the expected number of imperfections, E(X) = μ.
(c) Find .
STAT-324 EXERCISES Dr. Abdullah Al-Shiha
- 16 -
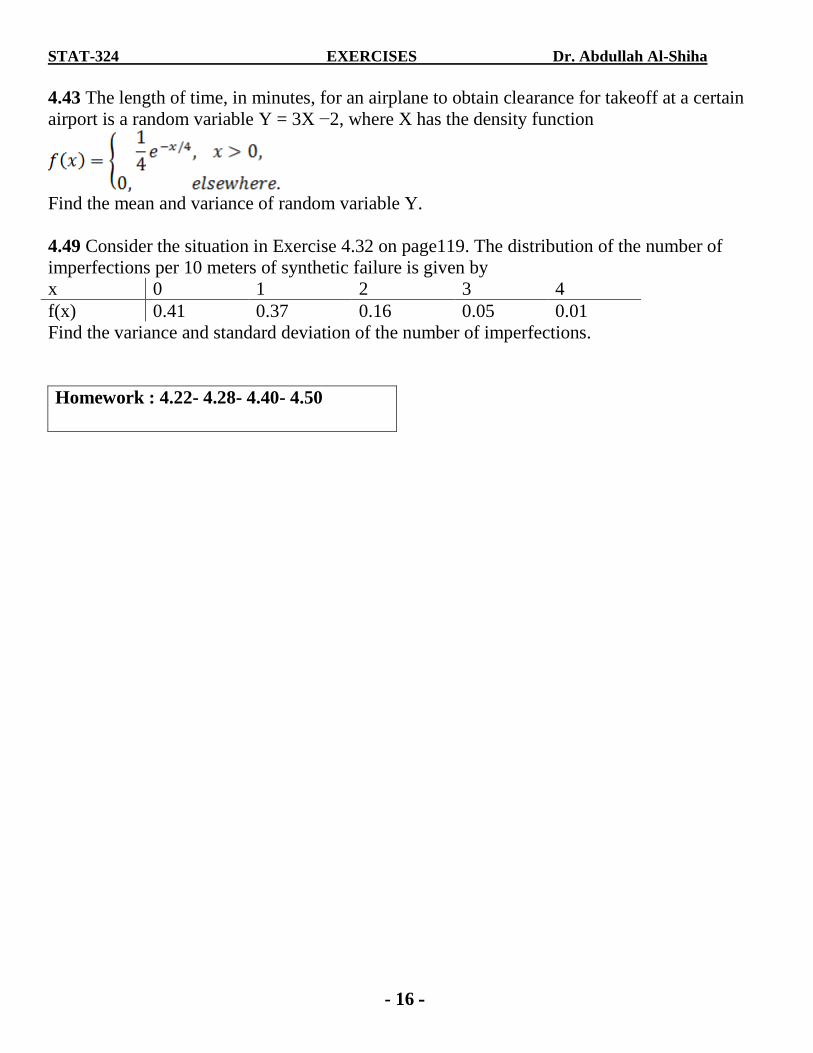
4.43 The length of time, in minutes, for an airplane to obtain clearance for takeoff at a certain
airport is a random variable Y = 3X −2, where X has the density function
Find the mean and variance of random variable Y.
4.49 Consider the situation in Exercise 4.32 on page119. The distribution of the number of
imperfections per 10 meters of synthetic failure is given by
x 0 1 2 3 4
f(x) 0.41 0.37 0.16 0.05 0.01
Find the variance and standard deviation of the number of imperfections.
Homework : 4.22- 4.28- 4.40- 4.50

STAT-324 EXERCISES Dr. Abdullah Al-Shiha
- 17 -
DISCRETE UNIFORM DISTRIBUTION:
Q1. Let the random variable X have a discrete uniform with parameter k=3 and with values 0,1, and 2. Then:
(a) P(X=1) is
(A) 1.0 (B) 1/3 (C) 0.3 (D) 0.1 (E) None
(b) The mean of X is:
(A) 1.0 (B) 2.0 (C) 1.5 (D) 0.0 (E) None
(c) The variance of X is:
(A) 0/3=0.0 (B) 3/3=1.0 (C) 2/3=0.67 (D) 4/3=1.33 (E) None
5. BINOMIAL DISTRIBUTION:
Q1. Suppose that 4 out of 12 buildings in a certain city violate the building code. A building engineer randomly
inspects a sample of 3 new buildings in the city.
(a) Find the probability distribution function of the random variable X representing the
number of buildings that violate the building code in the sample.
(b) Find the probability that:
(i) none of the buildings in the sample violating the building code.
(ii) one building in the sample violating the building code.
(iii) at lease one building in the sample violating the building code.
(c) Find the expected number of buildings in the sample that violate the building code (E(X)).
(d) Find 2=Var(X).
Q2. A missile detection system has a probability of 0.90 of detecting a missile attack. If 4 detection systems are
installed in the same area and operate independently, then
(a) The probability that at least two systems detect an attack is
(A) 0.9963 (B) 0.9477 (C) 0.0037 (D) 0.0523 (E) 0.5477
(b) The average (mean) number of systems detect an attack is
(A) 3.6 (B) 2.0 (C) 0.36 (D) 2.5 (E) 4.0
Q3. Suppose that the probability that a person dies when he or she contracts a certain disease is 0.4. A sample of
10 persons who contracted this disease is randomly chosen.
(1) What is the expected number of persons who will die in this sample?
(2) What is the variance of the number of persons who will die in this sample?
(3) What is the probability that exactly 4 persons will die among this sample?
(4) What is the probability that less than 3 persons will die among this sample?
(5) What is the probability that more than 8 persons will die among this sample?
Q4. Suppose that the percentage of females in a certain population is 50%. A sample of 3 people is selected
randomly from this population.
(a) The probability that no females are selected is
(A) 0.000 (B) 0.500 (C) 0.375 (D) 0.125
(b) The probability that at most two females are selected is
(A) 0.000 (B) 0.500 (C) 0.875 (D) 0.125
(c) The expected number of females in the sample is
(A) 3.0 (B) 1.5 (C) 0.0 (D) 0.50
(d) The variance of the number of females in the sample is

STAT-324 EXERCISES Dr. Abdullah Al-Shiha
- 18 -
(A) 3.75 (B) 2.75 (C) 1.75 (D) 0.75
Q5. 20% of the trainees in a certain program fail to complete the program. If 5 trainees of this program are
selected randomly,
(i) Find the probability distribution function of the random variable X, where:
X = number of the trainees who fail to complete the program.
(ii) Find the probability that all trainees fail to complete the program.
(iii) Find the probability that at least one trainee will fail to complete the program.
(iv) How many trainees are expected to fail completing the program?
(v) Find the variance of the number of trainees who fail completing the program.
Q6. In a certain industrial factory, there are 7 workers working independently. The probability of accruing
accidents for any worker on a given day is 0.2, and accidents are independent from worker to worker.
(a) The probability that at most two workers will have accidents during the day is
(A) 0.7865 (B) 0.4233 (C) 0.5767 (D) 0.6647
(b) The probability that at least three workers will have accidents during the day is:
(A) 0.7865 (B) 0.2135 (C) 0.5767 (D) 0.1039
(c) The expected number workers who will have accidents during the day is
(A) 1.4 (B) 0.2135 (C) 2.57 (D) 0. 59
Q7. From a box containing 4 black balls and 2 green balls, 3 balls are drawn independently in succession, each
ball being replaced in the box before the next draw is made. The probability of drawing 2 green balls and 1
black ball is:
(A) 6/27 (B) 2/27 (C) 12/27 (D) 4/27
Q8. The probability that a lab specimen is contaminated is 0.10. Three independent samples are checked.
1) the probability that none is contaminated is:
(A) 0.0475 (B) 0.001 (C) 0.729 (D) 0. 3
2) the probability that exactly one sample is contaminated is:
(A) 0.243 (B) 0.081 (C) 0.757 (D) 0. 3
Q9. If X~Binomial(n,p), E(X)=1, and Var(X)=0.75, find P(X=1).
Q10. Suppose that X~Binomial(3,0.2). Find the cumulative distribution function (CDF) of X.
Q11. A traffic control engineer reports that 75% of the cars passing through a checkpoint are from Riyadh city.
If at this checkpoint, five cars are selected at random.
(1) The probability that none of them is from Riyadh city equals to:
(A) 0.00098 (B) 0.9990 (C) 0.2373 (D) 0.7627
(2) The probability that four of them are from Riyadh city equals to:
(A) 0.3955 (B) 0.6045 (C) 0 (D) 0.1249
(3) The probability that at least four of them are from Riyadh city equals to:
(A) 0.3627 (B) 0.6328 (C) 0.3955 (D) 0.2763
(4) The expected number of cars that are from Riyadh city equals to:
(A) 1 (B) 3.75 (C) 3 (D) 0

STAT-324 EXERCISES Dr. Abdullah Al-Shiha
- 19 -
6. HYPERGEOMETRIC DISTRIBUTION:
Q1. A shipment of 7 television sets contains 2 defective sets. A hotel makes a random purchase of 3 of the sets.
(i) Find the probability distribution function of the random variable X representing the number
of defective sets purchased by the hotel.
(ii) Find the probability that the hotel purchased no defective television sets.
(iii) What is the expected number of defective television sets purchased by the hotel?
(iv) Find the variance of X.
Q2. Suppose that a family has 5 children, 3 of them are girls and the rest are boys. A sample of 2 children is
selected randomly and without replacement.
(a) The probability that no girls are selected is
(A) 0.0 (B) 0.3 (C) 0.6 (D) 0.1
(b) The probability that at most one girls are selected is
(A) 0.7 (B) 0.3 (C) 0.6 (D) 0.1
(c) The expected number of girls in the sample is
(A) 2.2 (B) 1.2 (C) 0.2 (D) 3.2
(d) The variance of the number of girls in the sample is
(A) 36.0 (B) 3.6 (C) 0.36 (D) 0.63
Q3. A random committee of size 4 is selected from 2 chemical engineers and 8 industrial engineers.
(i) Write a formula for the probability distribution function of the random variable X representing
the number of chemical engineers in the committee.
(ii) Find the probability that there will be no chemical engineers in the committee.
(iii) Find the probability that there will be at least one chemical engineer in the committee.
(iv) What is the expected number of chemical engineers in the committee?
(v) What is the variance of the number of chemical engineers in the committee?
Q4. A box contains 2 red balls and 4 black balls. Suppose that a sample of 3 balls were selected randomly and
without replacement. Find,
1. The probability that there will be 2 red balls in the sample.
2. The probability that there will be 3 red balls in the sample.
3. The expected number of the red balls in the sample.
Q5. From a lot of 8 missiles, 3 are selected at random and fired. The lot contains 2 defective missiles that will
not fire. Let X be a random variable giving the number of defective missiles selected.
1. Find the probability distribution function of X.
2. What is the probability that at most one missile will not fire?
3. Find = E(X) and 2 = Var(X).
Q6. A particular industrial product is shipped in lots of 20 items. Testing to determine whether an item is
defective is costly; hence, the manufacturer samples production rather than using 100% inspection plan. A
sampling plan constructed to minimize the number of defectives shipped to consumers calls for sampling 5
items from each lot and rejecting the lot if more than one defective is observed. (If the lot is rejected, each item
in the lot is then tested.) If a lot contains 4 defectives, what is the probability that it will be accepted.
Q7. Suppose that X~h(x;100,2,60); i.e., X has a hypergeometric distribution with parameters N=100, n=2, and
K=60. Calculate the probabilities P(X=0), P(X=1), and P(X=2) as follows:
(a) exact probabilities using hypergeometric distribution.

STAT-324 EXERCISES Dr. Abdullah Al-Shiha
- 20 -
(b) approximated probabilities using binomial distribution.
Q8. A particular industrial product is shipped in lots of 1000 items. Testing to determine whether an item is
defective is costly; hence, the manufacturer samples production rather than using 100% inspection plan. A
sampling plan constructed to minimize the number of defectives shipped to consumers calls for sampling 5
items from each lot and rejecting the lot if more than one defective is observed. (If the lot is rejected, each item
in the lot is then tested.) If a lot contains 100 defectives, calculate the probability that the lot will be accepted
using:
(a) hypergeometric distribution (exact probability.)
(b) binomial distribution (approximated probability.)
Q9. A shipment of 20 digital voice recorders contains 5 that are defective. If 10 of them are randomly chosen
(without replacement) for inspection, then:
(1) The probability that 2 will be defective is:
(A) 0.2140 (B) 0.9314 (C) 0.6517 (D) 0.3483
(2) The probability that at most 1 will be defective is:
(A) 0.9998 (B) 0.2614 (C) 0.8483 (D) 0.1517
(3) The expected number of defective recorders in the sample is:
(A) 1 (B) 2 (C) 3.5 (D) 2.5
(4) The variance of the number of defective recorders in the sample is:
(A) 0.9868 (B) 2.5 (C) 0.1875 (D) 1.875
Q10. A box contains 4 red balls and 6 green balls. The experiment is to select 3 balls at random. Find the
probability that all balls are red for the following cases:
(1) If selection is without replacement
(A) 0.216 (B) 0.1667 (C) 0.6671 (D) 0.0333
(2) If selection is with replacement
(A) 0.4600 (B) 0.2000 (C) 0.4000 (D) 0.0640

STAT-324 EXERCISES Dr. Abdullah Al-Shiha
- 21 -
7. POISSON DISTRIBUTION:
Q1. On average, a certain intersection results in 3 traffic accidents per day. Assuming Poisson distribution,
(i) what is the probability that at this intersection:
(1) no accidents will occur in a given day?
(2) More than 3 accidents will occur in a given day?
(3) Exactly 5 accidents will occur in a period of two days?
(ii) what is the average number of traffic accidents in a period of 4 days?
Q2. At a checkout counter, customers arrive at an average of 1.5 per minute. Assuming Poisson distribution,
then
(1) The probability of no arrival in two minutes is
(A) 0.0 (B) 0.2231 (C) 0.4463 (D) 0.0498 (E) 0.2498
(2) The variance of the number of arrivals in two minutes is
(A) 1.5 (B) 2.25 (C) 3.0 (D) 9.0 (E) 4.5
Q3. Suppose that the number of telephone calls received per day has a Poisson distribution with mean of 4 calls
per day.
(a) The probability that 2 calls will be received in a given day is
(A) 0.546525 (B) 0.646525 (C) 0.146525 (D) 0.746525
(b) The expected number of telephone calls received in a given week is
(A) 4 (B) 7 (C) 28 (D) 14
(c) The probability that at least 2 calls will be received in a period of 12 hours is
(A) 0.59399 (B) 0.19399 (C) 0.09399 (D) 0.29399
Q4. The average number of car accidents at a specific traffic signal is 2 per a week. Assuming Poisson
distribution, find the probability that:
(i) there will be no accident in a given week.
(ii) there will be at least two accidents in a period of two weeks.
Q5. The average number of airplane accidents at an airport is two per a year. Assuming Poisson distribution,
find
1. the probability that there will be no accident in a year.
2. the average number of airplane accidents at this airport in a period of two years.
3. the probability that there will be at least two accidents in a period of 18 months.
Q6. Suppose that X~Binomial(1000,0.002). By using Poisson approximation, P(X=3) is approximately equal to
(choose the nearest number to your answer):
(A) 0.62511 (B) 0.72511 (C) 0.82511 (D) 0.92511 (E) 0.18045
Q7. The probability that a person dies when he or she contracts a certain disease is 0.005. A sample of 1000
persons who contracted this disease is randomly chosen.
(1) What is the expected number of persons who will die in this sample?
(2) What is the probability that exactly 4 persons will die among this sample?
Q8. The number of faults in a fiber optic cable follows a Poisson distribution with an average of 0.6 per 100
feet.
(1) The probability of 2 faults per 100 feet of such cable is:
(A) 0.0988 (B) 0.9012 (C) 0.3210 (D) 0.5

STAT-324 EXERCISES Dr. Abdullah Al-Shiha
- 22 -
(2) The probability of less than 2 faults per 100 feet of such cable is:
(A) 0.2351 (B) 0.9769 (C) 0.8781 (D) 0.8601
(3) The probability of 4 faults per 200 feet of such cable is:
(A) 0.02602 (B) 0.1976 (C) 0.8024 (D) 0.9739
STAT-324 EXERCISES Dr. Abdullah Al-Shiha
- 23 -
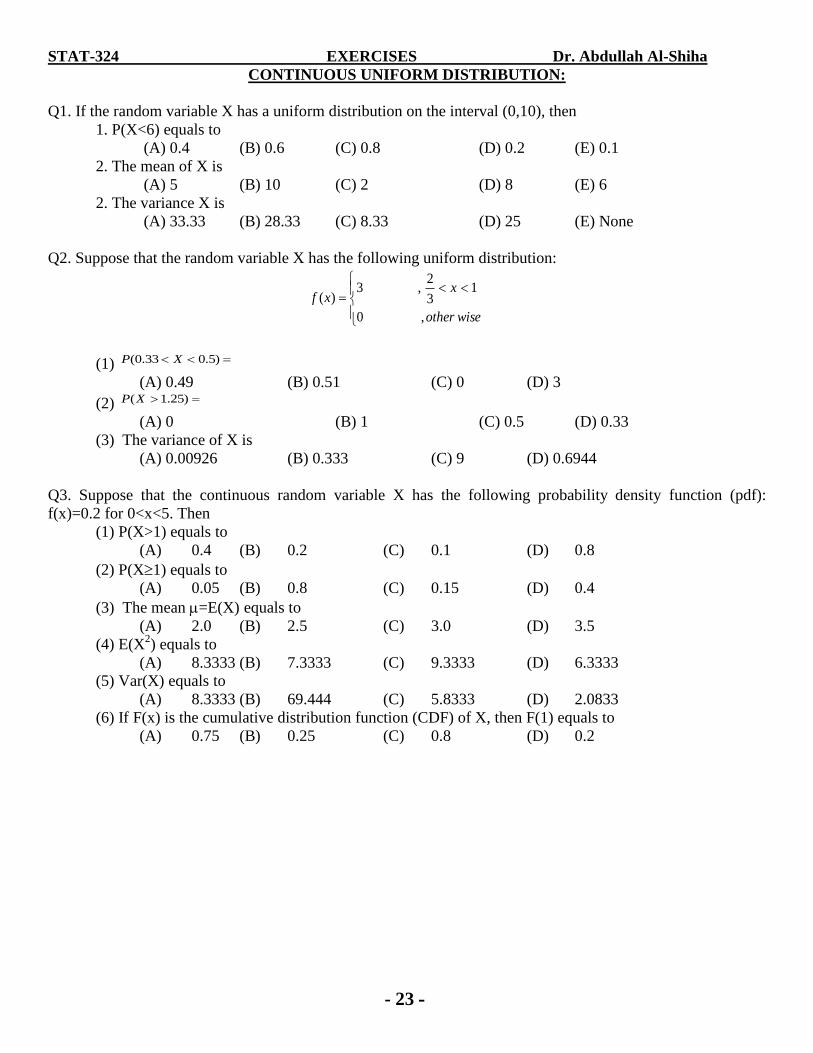
CONTINUOUS UNIFORM DISTRIBUTION:
Q1. If the random variable X has a uniform distribution on the interval (0,10), then
1. P(X<6) equals to
(A) 0.4 (B) 0.6 (C) 0.8 (D) 0.2 (E) 0.1
2. The mean of X is
(A) 5 (B) 10 (C) 2 (D) 8 (E) 6
2. The variance X is
(A) 33.33 (B) 28.33 (C) 8.33 (D) 25 (E) None
Q2. Suppose that the random variable X has the following uniform distribution:
wiseother
xxf
,0
13
2,3
)(
(1) )5.033.0( XP
(A) 0.49 (B) 0.51 (C) 0 (D) 3
(2) )25.1(XP
(A) 0 (B) 1 (C) 0.5 (D) 0.33
(3) The variance of X is
(A) 0.00926 (B) 0.333 (C) 9 (D) 0.6944
Q3. Suppose that the continuous random variable X has the following probability density function (pdf):
f(x)=0.2 for 0<x<5. Then
(1) P(X>1) equals to
(A) 0.4 (B) 0.2 (C) 0.1 (D) 0.8
(2) P(X1) equals to
(A) 0.05 (B) 0.8 (C) 0.15 (D) 0.4
(3) The mean =E(X) equals to
(A) 2.0 (B) 2.5 (C) 3.0 (D) 3.5
(4) E(X2) equals to
(A) 8.3333 (B) 7.3333 (C) 9.3333 (D) 6.3333
(5) Var(X) equals to
(A) 8.3333 (B) 69.444 (C) 5.8333 (D) 2.0833
(6) If F(x) is the cumulative distribution function (CDF) of X, then F(1) equals to
(A) 0.75 (B) 0.25 (C) 0.8 (D) 0.2

STAT-324 EXERCISES Dr. Abdullah Al-Shiha
- 24 -
8. NORMAL DISTRIBUTION:
Q1. (A) Suppose that Z is distributed according to the standard normal distribution.
1) the area under the curve to the left of 43.1z is:
(A) 0.0764 (B) 0.9236 (C) 0 (D) 0.8133
2) the area under the curve to the left of z = 1.39 is:
(A) 0.7268 (B) 0.9177 (C) .2732 (D) 0.0832
3) the area under the curve to the right of 89.0z is:
(A) 0. 7815 (B) 0.8133 (C) 0.1867 (D) 0.0154
4) the area under the curve between 16.2z and 65.0z is:
(A) 0.7576 (B) 0.8665 (C) 0.0154 (D) 0.2424
5) the value of k such that 0427.0)93.0( kZP is:
(A) 0.8665 (B) 1.11 (C) 1.11 (D) 1.00
(B) Suppose that Z is distributed according to the standard normal distribution. Find:
1) P(Z< 3.9)
2) P(Z> 4.5)
1) P(Z< 3.7)
2) P(Z> 4.1)
Q2. The finished inside diameter of a piston ring is normally distributed with a mean of 12 centimeters and a
standard deviation of 0.03 centimeter. Then,
1) the proportion of rings that will have inside diameter less than 12.05
centimeters is:
(A) 0.0475 (B) 0.9525 (C) 0.7257 (D) 0.8413
2) the proportion of rings that will have inside diameter exceeding 11.97
centimeters is:
(A) 0.0475 (B) 0.8413 (C) 0.1587 (D) 0.4514
3) the probability that a piston ring will have an inside diameter between 11.95
and 12.05 centimeters is:
(A) 0.905 (B) 0.905 (C) 0.4514 (D) 0.7257
Q3. The average life of a certain type of small motor is 10 years with a standard deviation of 2 years. Assume
the live of the motor is normally distributed. The manufacturer replaces free all motors that fail while under
guarantee. If he is willing to replace only 1.5% of the motors that fail, then he should give a guarantee of :
(A) 10.03 years (B) 8 years (C) 5.66 years (D) 3 years
Q4. A machine makes bolts (that are used in the construction of an electric transformer). It produces bolts with
diameters (X) following a normal distribution with a mean of 0.060 inches and a standard deviation of 0.001
inches. Any bolt with diameter less than 0.058 inches or greater than 0.062 inches must be scrapped. Then
(1) The proportion of bolts that must be scrapped is equal to
(A) 0.0456 (B) 0.0228 (C) 0.9772 (D) 0.3333 (E) 0.1667
(2) If P(X>a)= 0.1949, then a equals to:
(A) 0.0629 (B) 0.0659 (C) 0.0649 (D) 0.0669 (E) 0.0609
Q5. The diameters of ball bearings manufactured by an industrial process are normally distributed with a mean
= 3.0 cm and a standard deviation = 0.005 cm. All ball bearings with diameters not within the specifications
d cm (d > 0) will be scrapped.
(1) Determine the value of d such that 90% of ball bearings manufactured by this process will
not be scrapped.

STAT-324 EXERCISES Dr. Abdullah Al-Shiha
- 25 -
(2) If d = 0.005, what is the percentage of manufactured ball bearings that will be scraped?
Q6. The weight of a large number of fat persons is nicely modeled with a normal distribution with mean of 128
kg and a standard deviation of 9 kg.
(1) The percentage of fat persons with weights at most 110 kg is
(A) 0.09 % (B) 90.3 % (C) 99.82 % (D) 2.28 %
(2) The percentage of fat persons with weights more than 149 kg is
(A) 0.09 % (B) 0.99 % (C) 9.7 % (D) 99.82 %
(3) The weight x above which 86% of those persons will be
(A) 118.28 (B) 128.28 (C) 154.82 (D) 81.28
(4) The weight x below which 50% of those persons will be
(A) 101.18 (B) 128 (C) 154.82 (D) 81
Q7. The random variable X, representing the lifespan of a certain electronic device, is normally distributed with
a mean of 40 months and a standard deviation of 2 months. Find
1. P(X<38). (0.1587)
2. P(38<X<40). (0.3413)
3. P(X=38). (0.0000)
4. The value of x such that P(X<x)=0.7324. (41.24)
Q8. If the random variable X has a normal distribution with the mean and the variance 2, then P(X<+2)
equals to
(A) 0.8772 (B) 0.4772 (C) 0.5772 (D) 0.7772 (E) 0.9772
Q9. If the random variable X has a normal distribution with the mean and the variance 1, and if
P(X<3)=0.877, then equals to
(A) 3.84 (B) 2.84 (C) 1.84 (D) 4.84 (E) 8.84
Q10. Suppose that the marks of the students in a certain course are distributed according to a normal
distribution with the mean 70 and the variance 25. If it is known that 33% of the student failed the exam, then
the passing mark x is
(A) 67.8 (B) 60.8 (C) 57.8 (D) 50.8 (E) 70.8
Q11. If the random variable X has a normal distribution with the mean 10 and the variance 36, then
1. The value of X above which an area of 0.2296 lie is
(A) 14.44 (B) 16.44 (C) 10.44 (D) 18.44 (E) 11.44
2. The probability that the value of X is greater than 16 is
(A) 0.9587 (B) 0.1587 (C) 0.7587 (D) 0.0587 (E) 0.5587
Q12. Suppose that the marks of the students in a certain course are distributed according to a normal
distribution with the mean 65 and the variance 16. A student fails the exam if he obtains a mark less than 60.
Then the percentage of students who fail the exam is
(A) 20.56% (B) 90.56% (C) 50.56% (D) 10.56% (E)40.56%
Q13. The average rainfall in a certain city for the month of March is 9.22 centimeters. Assuming a normal
distribution with a standard deviation of 2.83 centimeters, then the probability that next March, this city will
receive:
(1) less than 11.84 centimeters of rain is:
(A) 0.8238 (B) 0.1762 (C) 0.5 (D) 0.2018
(2) more than 5 centimeters but less than 7 centimeters of rain is:

STAT-324 EXERCISES Dr. Abdullah Al-Shiha
- 26 -
(A) 0.8504 (B) 0.1496 (C) 0.6502 (D) 0.34221
(3) more than 13.8 centimeters of rain is:
(A) 0.0526 (B) 0.9474 (C) 0.3101 (D) 0.4053

STAT-324 EXERCISES Dr. Abdullah Al-Shiha
- 27 -
9. EXPONENTIAL DISTRIBUTION
Q1. If the random variable X has an exponential distribution with the mean 4, then:
1. P(X<8) equals to
(A) 0.2647 (B) 0.4647 (C) 0.8647 (D) 0.6647 (E) 0.0647
2. The variance of X is
(A) 4 (B) 16 (C) 2 (D) 1/4 (E) 1/2
Q2. Suppose that the failure time (in hours) of a certain electrical device is distributed with a probability density
function given by:
,0,70
1)( 70/ xexf x
1) the probability that a randomly selected device will fail within the first 50 hours is:
(A) 0.4995 (B) 0.7001 (C) 0.5105 (D) 0.2999
2) the probability that a randomly selected device will last more than 150 hours is:
(A) 0.8827 (B) 0.2788 (C) 0.1173 (D) 0.8827
3) the average failure time of the electrical device is:
(A) 1/70 (B) 70 (C) 140 (D) 35
4) the variance of the failure time of the electrical device is:
(A) 4900 (B) 1/49000 (C) 70 (D) 1225
[Hint: cea
dxe axax 1]
Q3. The lifetime of a specific battery is a random variable X with probability density function given by:
0 x,200
1)( 200/ xexf
(1) The mean life time of the battery equals to
(A) 200 (B) 1/200 (C) 100 (D) 1/100 (E) Non of these
(2) P(X>100) =
(A) 0.5 (B) 0.6065 (C) 0.3945 (D) 0.3679 (E) 0.6321
(3) P(X=200) =
(A) 0.5 (B) 0.0 (C) 0.3945 (D) 0.3679 (E) 1.0
Q4. Suppose that the lifetime of a certain electrical device is given by T. The random variable T is modeled
nicely by an exponential distribution with mean of 6 years. A random sample of four of these devices are
installed in different systems. Assuming that these devices work independently, then:
(1) the variance of the random variable T is
(A) 136 (B) (36)2 (C) 6 (D) 36
(2) the probability that at most one of the devices in the sample will be functioning more than
6 years is
(A) 0.4689 (B) 0.6321 (C) 0.5311 (D) 0.3679
(3) the probability that at least two of the devices in the sample will be functioning more than 6
years is
(A) 0.4689 (B) 0.6321 (C) 0.5311 (D) 0.3679
(4) the expected number of devices in the sample which will be functioning more than 6 years
is approximately equal to
(A) 3.47 (B) 1.47 (C) 4.47 (D) 1.47
STAT-324 EXERCISES Dr. Abdullah Al-Shiha
- 28 -
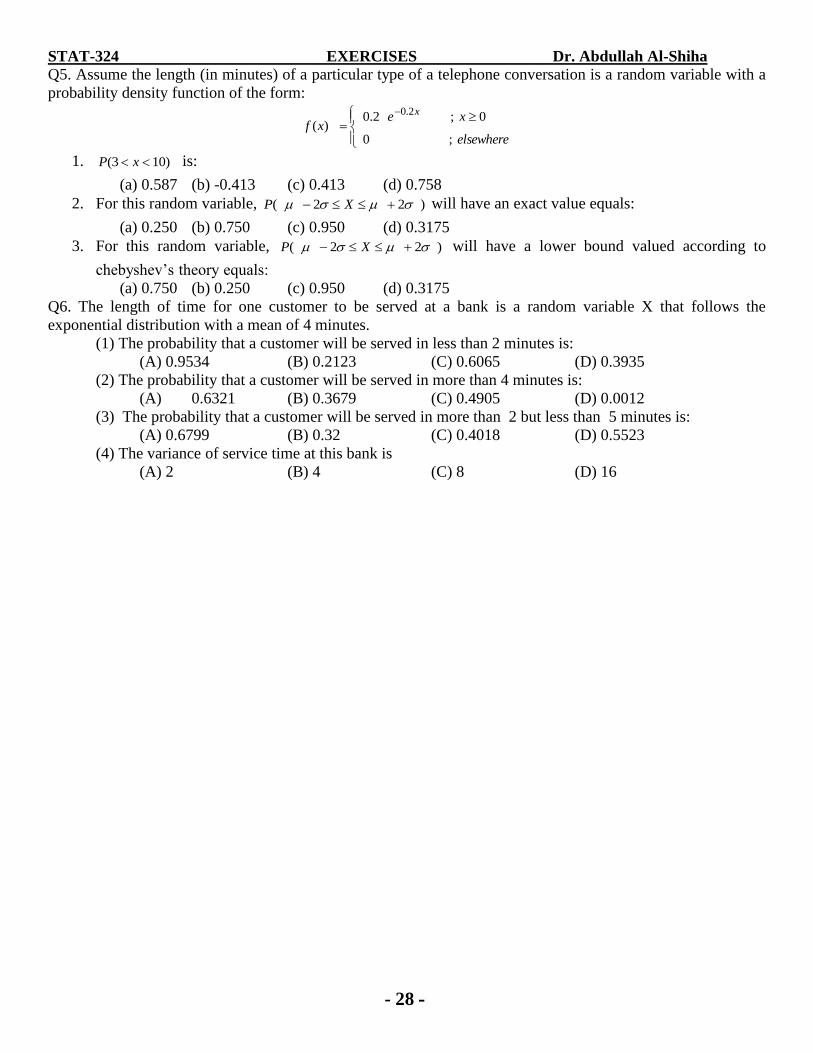
Q5. Assume the length (in minutes) of a particular type of a telephone conversation is a random variable with a
probability density function of the form:
elsewhere
xexf
x
;0
0;2.0)(
2.0
1. )103( xP is:
(a) 0.587 (b) -0.413 (c) 0.413 (d) 0.758
2. For this random variable, )22( XP will have an exact value equals:
(a) 0.250 (b) 0.750 (c) 0.950 (d) 0.3175
3. For this random variable, )22( XP will have a lower bound valued according to
chebyshev’s theory equals:
(a) 0.750 (b) 0.250 (c) 0.950 (d) 0.3175
Q6. The length of time for one customer to be served at a bank is a random variable X that follows the
exponential distribution with a mean of 4 minutes.
(1) The probability that a customer will be served in less than 2 minutes is:
(A) 0.9534 (B) 0.2123 (C) 0.6065 (D) 0.3935
(2) The probability that a customer will be served in more than 4 minutes is:
(A) 0.6321 (B) 0.3679 (C) 0.4905 (D) 0.0012
(3) The probability that a customer will be served in more than 2 but less than 5 minutes is:
(A) 0.6799 (B) 0.32 (C) 0.4018 (D) 0.5523
(4) The variance of service time at this bank is
(A) 2 (B) 4 (C) 8 (D) 16

STAT-324 EXERCISES Dr. Abdullah Al-Shiha
- 29 -
10. SAMPLING DISTRIBUTIONS
10.1. Single Mean:
Q1. A machine is producing metal pieces that are cylindrical in shape. A random sample of size 5 is taken and
the diameters are 1.70, 2.11, 2.20, 2.31 and 2.28 centimeters. Then,
1) The sample mean is:
(A) 2.12 (B) 2.32 (C) 2.90 (D) 2.20 (E) 2.22
2) The sample variance is:
(A) 0.59757 (B) 0.28555 (C) 0.35633 (D) 0.06115 (E) 0.53400
Q2. The average life of a certain battery is 5 years, with a standard deviation of 1 year. Assume that the live of
the battery approximately follows a normal distribution.
1) The sample mean X of a random sample of 5 batteries selected from this product has a mean
)(XE x equal to:
(A) 0.2 (B) 5 (C) 3 (D) None of these
2) The variance )(XVar 2x of the sample mean X of a random sample of 5 batteries
selected from this product is equal to:
(A) 0.2 (B) 5 (C) 3 (D) None of these
3) The probability that the average life of a random sample of size 16 of such batteries will be
between 4.5 and 5.4 years is:
(A) 0.1039 (B) 0.2135 (C) 0.7865 (D) 0.9224
4) The probability that the average life of a random sample of size 16 of such batteries will be
less than 5.5 years is:
(A) 0.9772 (B) 0.0228 (C) 0.9223 (D) None of these
5) The probability that the average life of a random sample of size 16 of such batteries will be
more than 4.75 years is:
(A) 0.8413 (B) 0.1587 (C) 0.9452 (D) None of these
6) If 1492.0)( aXP where X represents the sample mean for a random sample of size
9 of such batteries, then the numerical value of a is:
(A) 4.653 (B) 6.5 (C) 5.347 (D) None of these
Q3. The random variable X, representing the lifespan of a certain light bulb, is distributed normally with a mean
of 400 hours and a standard deviation of 10 hours.
1. What is the probability that a particular light bulb will last for more than 380 hours?
2. Light bulbs with lifespan less than 380 hours are rejected. Find the percentage of light bulbs that will be
rejected.
3. If 9 light bulbs are selected randomly, find the probability that their average lifespan will be less than
405.
Q4. Suppose that you take a random sample of size n=64 from a distribution with mean =55 and standard
deviation =10. Let
n
iiX
nX
1
1 be the sample mean.
(a) What is the approximated sampling distribution of X ?
(b) What is the mean of X ?
(c) What is the standard error (standard deviation) of X ?
(d) Find the probability that the sample mean X exceeds 52.
STAT-324 EXERCISES Dr. Abdullah Al-Shiha
- 30 -
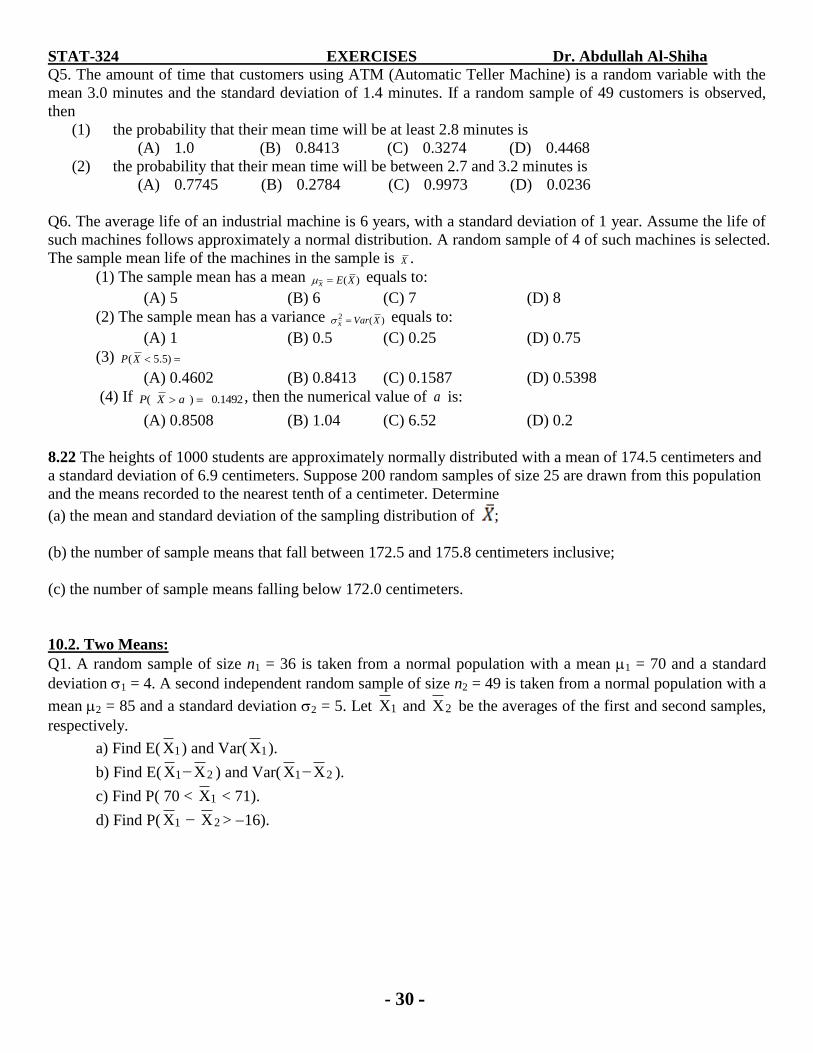
Q5. The amount of time that customers using ATM (Automatic Teller Machine) is a random variable with the
mean 3.0 minutes and the standard deviation of 1.4 minutes. If a random sample of 49 customers is observed,
then
(1) the probability that their mean time will be at least 2.8 minutes is
(A) 1.0 (B) 0.8413 (C) 0.3274 (D) 0.4468
(2) the probability that their mean time will be between 2.7 and 3.2 minutes is
(A) 0.7745 (B) 0.2784 (C) 0.9973 (D) 0.0236
Q6. The average life of an industrial machine is 6 years, with a standard deviation of 1 year. Assume the life of
such machines follows approximately a normal distribution. A random sample of 4 of such machines is selected.
The sample mean life of the machines in the sample is X .
(1) The sample mean has a mean )(XEx equals to:
(A) 5 (B) 6 (C) 7 (D) 8
(2) The sample mean has a variance )(2 XVarx equals to:
(A) 1 (B) 0.5 (C) 0.25 (D) 0.75
(3) )5.5(XP
(A) 0.4602 (B) 0.8413 (C) 0.1587 (D) 0.5398
(4) If 1492.0)( aXP , then the numerical value of a is:
(A) 0.8508 (B) 1.04 (C) 6.52 (D) 0.2
8.22 The heights of 1000 students are approximately normally distributed with a mean of 174.5 centimeters and
a standard deviation of 6.9 centimeters. Suppose 200 random samples of size 25 are drawn from this population
and the means recorded to the nearest tenth of a centimeter. Determine
(a) the mean and standard deviation of the sampling distribution of ;
(b) the number of sample means that fall between 172.5 and 175.8 centimeters inclusive;
(c) the number of sample means falling below 172.0 centimeters.
10.2. Two Means:
Q1. A random sample of size n1 = 36 is taken from a normal population with a mean 1 = 70 and a standard
deviation 1 = 4. A second independent random sample of size n2 = 49 is taken from a normal population with a
mean 2 = 85 and a standard deviation 2 = 5. Let 1X and 2X be the averages of the first and second samples,
respectively.
a) Find E( 1X ) and Var( 1X ).
b) Find E( 1X − 2X ) and Var( 1X − 2X ).
c) Find P( 70 < 1X < 71).
d) Find P( 1X − 2X > 16).

STAT-324 EXERCISES Dr. Abdullah Al-Shiha
- 31 -
Q2. A random sample of size 25 is taken from a normal population (first population) having a mean of 100 and
a standard deviation of 6. A second random sample of size 36 is taken from a different normal population
(second population) having a mean of 97 and a standard deviation of 5. Assume that these two samples are
independent.
(1) the probability that the sample mean of the first sample will exceed the sample mean of the
second sample by at least 6 is
(A) 0.0013 (B) 0.9147 (C) 0.0202 (D) 0.9832
(2) the probability that the difference between the two sample means will be less than 2 is
(A) 0.099 (B) 0.2480 (C) 0.8499 (D) 0.9499
8.28 A random sample of size 25 is taken from a normal population having a mean of 80 and a standard
deviation of 5. A second random sample of size 36 is taken from a different normal population having a mean
of 75 and a standard deviation of 3. Find the
probability that the sample mean computed from the 25 measurements will exceed the sample mean computed
from the 36 measurements by at least 3.4 but less than 5.9. Assume the difference of the means to be measured
to the nearest tenth.
8.29 The distribution of heights of a certain breed of terrier has a mean of 72 centimeters and a standard
deviation of 10 centimeters, whereas the distribution of
heights of a certain breed of poodle has a mean of 28 centimeters with a standard deviation of 5 centimeters.
Assuming that the sample means can be measured to any degree of accuracy, find the probability that the
sample mean for a random sample of heights of 64 terriers exceeds the sample mean for a random sample of
heights of 100 poodles by at most 44.2 centimeter
10.3. Single Proportion:
Q1. Suppose that 20% of the students in a certain university smoke cigarettes. A random sample of 5 students is
taken from this university. Let p̂ be the proportion of smokers in the sample.
(1) Find ppE ˆ)ˆ( , the mean p̂ .
(2) Find 2ˆ
)ˆ(p
pVar , the variance of p̂ .
(3) Find an approximate distribution of p̂ .
(4) Find P( p̂ >0.25).
Q2: Suppose that you take a random sample of size n=100 from a binomial population with parameter p=0.25
(proportion of successes). Let nXp /ˆ be the sample proportion of successes, where X is the number of
successes in the sample.
(a) What is the approximated sampling distribution of p̂ ?
(b) What is the mean of p̂ ?
(c) What is the standard error (standard deviation) of p̂ ?
(d) Find the probability that the sample proportion p̂ is less than 0.2.
Homework : 8.26 , 8.32

STAT-324 EXERCISES Dr. Abdullah Al-Shiha
- 32 -
10.4. Two Proportions:
Q1. Suppose that 25% of the male students and 20% of the female students in a certain university smoke
cigarettes. A random sample of 5 male students is taken. Another random sample of 10 female students is
independently taken from this university. Let 1p̂ and 2p̂ be the proportions of smokers in the two samples,
respectively.
(1) Find 21 ˆˆ21 )ˆˆ( ppppE , the mean of 21 ˆˆ pp .
(2) Find 2
ˆˆ2121
)ˆˆ(pp
ppVar
, the variance of 21 ˆˆ pp .
(3) Find an approximate distribution of 21 ˆˆ pp .
(4) Find P(0.10< 21 ˆˆ pp <0.20).
10.5 t-distribution:
Q1. Using t-table with degrees of freedom df=14, find 02.0t , 985.0t .
Q2. From the table of t-distribution with degrees of freedom 15 , the value of 025.0t equals to
(A) 2.131 (B) 1.753 (C) 3.268 (D) 0.0

STAT-324 EXERCISES Dr. Abdullah Al-Shiha
- 33 -
11. ESTIMATION AND CONFIDENCE INTERVALS:
11.1. Single Mean:
Q1. An electrical firm manufacturing light bulbs that have a length of life that is normally distributed with a
standard deviation of 30 hours. A sample of 50 bulbs were selected randomly and found to have an average of
750 hours. Let be the population mean of life lengths of all bulbs manufactured by this firm.
(1) Find a point estimate for .
(2) Construct a 94% confidence interval for .
Q2. Suppose that we are interested in making some statistical inferences about the mean, , of a normal
population with standard deviation =2.0. Suppose that a random sample of size n=49 from this population
gave a sample mean X =4.5.
(1) The distribution of X is
(A) N(0,1) (B) t(48) (C) N(, 0.2857) (D) N(, 2.0) (E) N(, 0.3333)
(2) A good point estimate of is
(A) 4.50 (B) 2.00 (C) 2.50 (D) 7.00 (E) 1.125
(3) The standard error of X is
(A) 0.0816 (B) 2.0 (C) 0.0408 (D) 0.5714 (E) 0.2857
(4) A 95% confidence interval for is
(A) (3.44,5.56) (B) (3.34,5.66) (C) (3.54,5.46) (D) (3.94,5.06) (E) (3.04,5.96)
(5) If the upper confidence limit of a confidence interval is 5.2, then the lower confidence limit is
(A) 3.6 (B) 3.8 (C) 4.0 (D) 3.5 (E) 4.1
(6) The confidence level of the confidence interval (3.88, 5.12) is
(A) 90.74% (B) 95.74% (C) 97.74% (D) 94.74% (E) 92.74%
(7) If we use X to estimate , then we are 95% confident that our estimation error will not exceed
(A) e=0.50 (B) E=0.59 (C) e=0.58 (D) e=0.56 (E) e=0.51
(8) If we want to be 95% confident that the estimation error will not exceed e=0.1 when we use X to
estimate , then the sample size n must be equal to
(A) 1529 (B) 1531 (C) 1537 (D) 1534 (E) 1530
Q3. The following measurements were recorded for lifetime, in years, of certain type of machine: 3.4, 4.8, 3.6,
3.3, 5.6, 3.7, 4.4, 5.2, and 4.8. Assuming that the measurements represent a random sample from a normal
population, then a 99% confidence interval for the mean life time of the machine is
(A) 25.337.5 (B) 1.972.4
(C) 99.501.4 (D) 25.537.3
Q4. A researcher wants to estimate the mean lifespan of a certain light bulbs. Suppose that the distribution is
normal with standard deviation of 5 hours.
1. Determine the sample size needed on order that the researcher will be 90% confident that the error
will not exceed 2 hours when he uses the sample mean as a point estimate for the true mean.
2. Suppose that the researcher selected a random sample of 49 bulbs and found that the sample mean is
390 hours.
(i) Find a good point estimate for the true mean .
(ii) Find a 95% confidence interval for the true mean .

STAT-324 EXERCISES Dr. Abdullah Al-Shiha
- 34 -
Q5. The amount of time that customers using ATM (Automatic Teller Machine) is a random variable with a
standard deviation of 1.4 minutes. If we wish to estimate the population mean by the sample mean X , and if
we want to be 96% confident that the sample mean will be within 0.3 minutes of the population mean, then the
sample size needed is
(A) 98 (B) 100 (C) 92 (D) 85
Q6: A random sample of size n=36 from a normal quantitative population produced a mean 2.15X and a
variance 92 S .
(a) Give a point estimate for the population mean .
(b) Find a 95% confidence interval for the population mean .
Q7. A group of 10 college students were asked to report the number of hours that they spent doing their
homework during the previous weekend and the following results were obtained:
7.25, 8.5, 5.0, 6.75, 8.0, 5.25, 10.5, 8.5, 6.75, 9.25
75.75X , 563.6002X }
It is assumed that this sample is a random sample from a normal distribution with unknown variance 2. Let
be the mean of the number of hours that the college student spend doing his/her homework during the weekend.
(a) Find the sample mean and the sample variance.
(b) Find a point estimate for .
(c) Construct a 80% confidence interval for .
Q8. An electronics company wanted to estimate its monthly operating expenses in thousands riyals (). It is
assumed that the monthly operating expenses (in thousands riyals) are distributed according to a normal
distribution with variance 2=0.584.
(I) Suppose that a random sample of 49 months produced a sample mean 5.47X .
(a) Find a point estimate for .
(b) Find the standard error of X .
(c) Find a 90% confidence interval for .
(II) Suppose that they want to estimate by X . Find the sample size (n) required if they want
their estimate to be within 0.15 of the actual mean with probability equals to 0.95.
Q9. The tensile strength of a certain type of thread is approximately normally distributed with standard
deviation of 6.8 kilograms. A sample of 20 pieces of the thread has an average tensile strength of 72.8
kilograms. Then,
(a) A point estimate of the population mean of the tensile strength () is:
(A) 72.8 (B) 20 (C) 6.8 (D) 46.24 (E) None of these
(b) Suppose that we want to estimate the population mean () by the sample mean )( X . To be
95% confident that the error of our estimate of the mean of tensile strength will be less than
3.4 kilograms, the minimum sample size should be at least:
(A) 4 (B) 16 (C) 20 (D) 18 (E) None of these
(c) For a 98% confidence interval for the mean of tensile strength, we have the lower bound
equal to:
(A) 68.45 (B) 69.26 (C) 71.44 (D) 69.68 (E) None of these
(d) For a 98% confidence interval for the mean of tensile strength, we have the upper bound
equal to:
(A) 74.16 (B) 77.15 (C) 75.92 (D) 76.34 (E) None of these

STAT-324 EXERCISES Dr. Abdullah Al-Shiha
- 35 -
9.2 An electrical firm manufactures light bulbs that have a length of life that is approximately normally
distributed with a standard deviation of 40 hours. If a sample
of 30 bulbs has an average life of 780 hours, find a 96% confidence interval for the population mean of all bulbs
produced by this firm.
9.6 How large a sample is needed in Exercise 9.2 if we wish to be 96% confident that our sample mean will be
within 10 hours of the true mean?
9.4 The heights of a random sample of 50 college students showed a mean of 174.5 centimeters and a standard
deviation of 6.9 centimeters.
(a) Construct a 95% confidence interval for the mean height of all college students.
(b) What can we assert with 95% confidence about the possible size of our error if we estimate the mean height
of all college students to be 174.5 centimeters?
H.W: 9.5 , 9.8
11.2. Two Means:
Q1.(I) The tensile strength of type I thread is approximately normally distributed with standard deviation of 6.8
kilograms. A sample of 20 pieces of the thread has an average tensile strength of 72.8 kilograms. Then,
1) To be 95% confident that the error of estimating the mean of tensile strength by the sample
mean will be less than 3.4 kilograms, the minimum sample size should be:
(A) 4 (B) 16 (C) 20 (D) 18 (E) None of these
2) The lower limit of a 98% confidence interval for the mean of tensile strength is
(A) 68.45 (B) 69.26 (C) 71.44 (D) 69.68 (E) None of these
3) The upper limit of a 98% confidence interval for the mean of tensile strength is
(A) 74.16 (B) 77.15 (C) 75.92 (D) 76.34 (E) None of these
Q1.(II). The tensile strength of type II thread is approximately normally distributed with standard deviation of
6.8 kilograms. A sample of 25 pieces of the thread has an average tensile strength of 64.4 kilograms. Then for
the 98% confidence interval of the difference in tensile strength means between type I and type II , we have:
1) the lower bound equals to:
(A) 2.90 (B) 4.21 (C) 3.65 (D) 6.58 (E) None of these
2) the upper bound equals to:
(A) 13.90 (B) 13.15 (C) 12.59 (D) 10.22 (E) None of these

STAT-324 EXERCISES Dr. Abdullah Al-Shiha
- 36 -
Q2. Two random samples were independently selected from two normal populations with equal variances. The
results are summarized as follows.
First Sample Second Sample
sample size (n)
sample mean ( X )
sample variance (S2)
12
10.5
4
14
10.0
5
Let 1 and 2 be the true means of the first and second populations, respectively.
1. Find a point estimate for 1 2..
2. Find 95% confidence interval for 1 2.
Q3. A researcher was interested in comparing the mean score of female students, f, with the mean score of
male students, m, in a certain test. Two independent samples gave the following results:
Sample Observations mean Variance
Scores of Females 89.2 81.6 79.6 80.0 82.8 82.63 15.05
Scores of Males 83.2 83.2 84.8 81.4 78.6 71.5 77.6 80.04 20.79
Assume the populations are normal with equal variances.
(1) The pooled estimate of the variance 2pS is
(A) 17.994 (B) 17.794 (C) 18.094 (D) 18.294 (E) 18.494
(2) A point estimate of f m is
(A) 2.63 (B) 2.59 (C) 2.59 (D) 0.00 (E) 0.59
(3) The lower limit of a 90% confidence interval for f m is
(A) 1.97 (B) 1.67 (C) 1.97 (D) 1.67 (E) 1.57
(4) The upper limit of a 90% confidence interval for f m is
(A) 6.95 (B) 7.45 (C) 7.55 (D) 7.15 (E) 7.55
Q4. A study was conducted to compare to brands of tires A and B. 10 tires of brand A and 12 tires of brand B
were selected randomly. The tires were run until they wear out. The results are:
Brand A: AX = 37000 kilometers SA = 5100
Brand B: BX = 38000 kilometers SB = 6000
Assuming the populations are normally distributed with equal variances,
(1) Find a point estimate for A − B.
(2) Construct a 90% confidence interval for A − B.
Q5. The following data show the number of defects of code of particular type of software program made in two
different countries (assuming normal populations with unknown equal variances)
Country observations mean standard dev.
A 48 39 42 52 40 48 54 46.143 5.900
B 50 40 43 45 50 38 36 43.143 5.551
(a) A point estimate of BA is
(A) 3.0 (B) 3.0 (C) 2.0 (D) 2.0 (E) None of these
(b) A 90% confidence interval for the difference between the two population means
BA is
(A) 46.846.2 BA (B) 42.642.1 BA
(C) 42.042.1 BA (D) 42.1042.2 BA

STAT-324 EXERCISES Dr. Abdullah Al-Shiha
- 37 -
Q6. A study was made by a taxi company to decide whether the use of new tires (A) instead of the present tires
(B) improves fuel economy. Six cars were equipped with tires (A) and driven over a prescribed test course.
Without changing drivers and cares, test course was made with tires (B). The gasoline consumption, in
kilometers per liter (km/L), was recorded as follows: (assume the populations are normal with equal unknown
variances)
Car 1 2 3 4 5 6
Type (A) 4.5 4.8 6.6 7.0 6.7 4.6
Type (B) 3.9 4.9 6.2 6.5 6.8 4.1
(a) A 95% confidence interval for the true mean gasoline consumption for brand A is:
(A) 938.6462.4 A (B) 930.4642.2 A
(C) 7.92.5 A (D) 938.6154.6 A
(b) A 99% confidence interval for the difference between the true means consumption of type
(A) and type (B) ( )BA is:
(A) 539.2939.1 BA (B) 539.1939.2 BA
(C) 539.1939.0 BA (D) 539.0939.1 BA
Q7. A geologist collected 20 different ore samples, all of the same weight, and randomly divided them into two
groups. The titanium contents of the samples, found using two different methods, are listed in the table:
Method (A) Method (B)
1.1 1.3 1.3 1.5 1.4
1.3 1.0 1.3 1.1 1.2
1509.0,25.1 11 SX
1.1 1.6 1.3 1.2 1.5
1.2 1.7 1.3 1.4 1.5
1932.0,38.1 22 SX
(a) Find a point estimate of BA is
(b) Find a 90% confidence interval for the difference between the two population means
BA . (Assume two normal populations with equal variances).
From book:
9.35 A random sample of size n1 = 25, taken from a normal population with a standard deviation σ1 = 5, has a
mean = 80. A second random sample of size n2 = 36, taken from a different normal population with a
standard deviation σ2 = 3, has a mean
= 75. Find a 95% confidence interval for μ1 − μ2.
________________________________________________________________

STAT-324 EXERCISES Dr. Abdullah Al-Shiha
- 38 -
9.41 The following data represent the length of time, in days, to recovery for patients randomly treated with one
of two medications to clear up severe bladder infections:
Medication1 Medication2
.n1= 14 .n2=16
Find a 99% confidence interval for the difference μ2−μ1 in the mean recovery times for the two medications,
assuming normal populations with equal variances.
H.W: 9.36 , 9.43
11.3. Single Proportion:
Q1. A random sample of 200 students from a certain school showed that 15 students smoke. Let p be the
proportion of smokers in the school.
1. Find a point Estimate for p.
2. Find 95% confidence interval for p.
Q2. A researcher was interested in making some statistical inferences about the proportion of females (p)
among the students of a certain university. A random sample of 500 students showed that 150 students are
female.
(1) A good point estimate for p is
(A) 0.31 (B) 0.30 (C) 0.29 (D) 0.25 (E) 0.27
(2) The lower limit of a 90% confidence interval for p is
(A) 0.2363 (B) 0.2463 (C) 0.2963 (D) 0.2063 (E) 0.2663
(3) The upper limit of a 90% confidence interval for p is
(A) 0.3337 (B) 0.3137 (C) 0.3637 (D) 0.2937 (E) 0.3537
Q3. In a random sample of 500 homes in a certain city, it is found that 114 are heated by oil. Let p be the
proportion of homes in this city that are heated by oil.
1) Find a point estimate for p.
2) Construct a 98% confidence interval for p.
Q4. In a study involved 1200 car drivers, it was found that 50 car drivers do not use seat belt.
(1) A point estimate for the proportion of car drivers who do not use seat belt is:
(A) 50 (B) 0.0417 (C) 0.9583 (D) 1150 (E) None of these
(2) The lower limit of a 95% confidence interval of the proportion of car drivers not using seat
belt is
(A) 0.0322 (B) 0.0416 (C) 0 .0304 (D) –0.3500 (E) None of these
(3) The upper limit of a 95% confidence interval of the proportion of car drivers not using seat
belt is

STAT-324 EXERCISES Dr. Abdullah Al-Shiha
- 39 -
(A) 0.0417 (B) 0.0530 (C) 0.0512 (D) 0.4333 (E) None of these
Q5. A study was conducted to make some inferences about the proportion of female employees (p) in a certain
hospital. A random sample gave the following data:
Sample size 250
Number of females 120
(a) Calculate a point estimate ( p̂ ) for the proportion of female employees (p).
(b) Construct a 90% confidence interval for p.
Q6. In a certain city, the traffic police was interested in knowing the proportion of car drivers who do not use
seat built. In a study involved 1200 car drivers it was found that 50 car drivers do not use seat belt.
(a) A point estimate for the proportion of car drivers who do not use seat built is:
(A) 50 (B) 0.0417 (C) 0.9583 (D) 1150 (E) None of these
(b) A 95% confidence interval of the proportion of car drivers who do not use
seat built has the lower bound equal to:
(A) 0.0322 (B) 0.0416 (C) 0 .0304 (D) –0.3500 (E) None of these
(c) A 95% confidence interval of the proportion of car drivers who do not use
seat built has the upper bound equal to:
(A) 0.0417 (B) 0.0530 (C) 0.0512 (D) 0.4333 (E) None of these
From book :
9.51 In a random sample of 1000 homes in a certain city, it is found that 228 are heated by oil. Find 99%
confidence intervals for the proportion of homes in this city that are heated by oil using both methods presented
on page 297.
9.56 A geneticist is interested in the proportion of African males who have a certain minor blood disorder. In a
random sample of 100 African males, 24 are found to be afflicted.
(a) Compute a 99% confidence interval for the proportion of African males who have this blood disorder.
(b) What can we assert with 99% confidence about the possible size of our error if we estimate the proportion of
African males with this blood disorder to be 0.24
H.W: 9.58 , 9.59

STAT-324 EXERCISES Dr. Abdullah Al-Shiha
- 40 -
11.4. Two Proportions:
Q1. A survey of 500 students from a college of science shows that 275 students own computers. In another
independent survey of 400 students from a college of engineering shows that 240 students own computers.
(a) a 99% confidence interval for the true proportion of college of science's student who own
computers is
(A) 71.059.0 1 p (B) 61.049.0 1 p
(C) 61.649.2 1 p (D) 7.03.0 1 p
(29) a 95% confidence interval for the difference between the proportions of students owning
computers in the two colleges is
(A) 215.0015.0 21 pp (B) 215.0515.0 21 pp
(C) 015.0450.0 21 pp (D) 015.0115.0 21 pp
Q2. A food company distributes "smiley cow" brand of milk. A random sample of 200 consumers in the city
(A) showed that 80 consumers prefer the "smiley cow" brand of milk. Another independent random sample of
300 consumers in the city (B) showed that 90 consumers prefer "smiley cow" brand of milk. Define:
pA = the true proportion of consumers in the city (A) preferring "smiley cow" brand.
pB = the true proportion of consumers in the city (B) preferring "smiley cow" brand.
(a) A 96% confidence interval for the true proportion of consumers preferring brand (A) is:
(A) 375.0328.0 Ap (B) 675.0228.0 Ap
(C) 475.0328.0 Ap (D) 875.0518.0 Ap
(b) A 99% confidence interval for the difference between proportions of consumers
preferring brand (A) and (B) is:
(A) 212.00123.0 BA pp (B) 3612.02313.0 BA pp
(C) 012.00023.0 BA pp (D) 212.00123.0 BA pp
Q3. A random sample of 100 students from school "A" showed that 15 students smoke. Another independent
random sample of 200 students from school "B" showed that 20 students smoke. Let p1 be the proportion of
smokers in school "A" and p2 is the proportion of smokers in school "B".
(1) Find a point Estimate for p1p2.
(2) Find 95% confidence interval for p1p2.
From book:
9.66 Ten engineering schools in the United States were surveyed. The sample contained 250 electrical
engineers, 80 being women; 175 chemical engineers, 40 being women. Compute a 90% confidence interval for
the difference between the proportions of women in these two fields of engineering. Is there a significant
difference between the two proportions?
Homework : 9.67

STAT-324 EXERCISES Dr. Abdullah Al-Shiha
- 41 -
12. HYPOTHESES TESTING:
12.1. Single Mean:
Q1. Suppose that we are interested in making some statistical inferences about the mean, , of a normal
population with standard deviation =2.0. Suppose that a random sample of size n=49 from this population
gave a sample mean 5.4X .
(1) If we want to test Ho:=5.0 against H1:5.0, then the test statistic equals to
(A) Z= 1.75 (B) Z=1.75 (C) T= 1.70 (D) T= 1.70 (E) Z= 1.65
(2) If we want to test Ho: =5.0 against H1: >5.0 at =0.05, then the Rejection Region of Ho is
(A) (1.96,) (B) (2.325,) (C) (,1.645) (D) (,1.96 ) (E) (1.645, )
(3) If we want to test Ho: =5.0 against H1: >5.0 at =0.05, then we
(A) Accept Ho (B) Reject Ho (C) (D) (E)
Q2. An electrical firm manufactures light bulbs that have a length of life that is normally distributed with a
standard deviation of 30 hours. A sample of 50 bulbs were selected randomly and found to have an average of
750 hours. Let be the population mean of life lengths of all bulbs manufactured by this firm. Test Ho: = 740
against H1: < 740? Use a 0.05 level of significance.
Q3. An electrical firm manufactures light bulbs that have a length of life that is normally distributed. A sample
of 20 bulbs were selected randomly and found to have an average of 655 hours and a standard deviation of 27
hours. Let be the population mean of life lengths of all bulbs manufactured by this firm. Test Ho: = 660
against H1: 660? Use a 0.02 level of significance.
Q4: A random sample of size n=36 from a normal quantitative population produced a mean 2.15X and a
variance 92 S . Test Ho: = 15 against Ha: 15, use =0.05.
Q5. A group of 10 college students were asked to report the number of hours that they spent doing their
homework during the previous weekend and the following results were obtained:
7.25, 8.5, 5.0, 6.75, 8.0, 5.25, 10.5, 8.5, 6.75, 9.25
75.75X , 563.6002X }
It is assumed that this sample is a random sample from a normal distribution with unknown variance 2. Let
be the mean of the number of hours that the college student spend doing his/her homework during the weekend.
Test Ho: = 7.5 against Ha: > 7.5, use =0.2.
Q6. An electronics company wanted to estimate its monthly operating expenses in thousands riyals (). It is
assumed that the monthly operating expenses (in thousands riyals) are distributed according to a normal
distribution with variance 2=0.584. Suppose that a random sample of 49 months produced a sample mean
5.47X . Test Ho: =5.5 against and Ha: 5.5. Use =0.01.
Q7. The tensile strength of a certain type of thread is approximately normally distributed with standard
deviation of 6.8 kilograms. The manufacturer claims that the mean of the tensile strength of this type of thread
equals to 70.0 kilogram. Do you agree with this claim if a sample of 20 pieces of the thread had an average
tensile strength of 72.8 kilograms? Use =0.05.

STAT-324 EXERCISES Dr. Abdullah Al-Shiha
- 42 -
Q1) Suppose that we are interested in making some statistical inferences about the mean, μ, of a normal
population with standard deviation . Suppose that a random sample of size n=49 from this population
gave a sample mean .
(1) If we want to test against , then the test statistic equals to
(A) Z=-1.75 (B) Z=1.75 (C) T=-1.70 (D) T=1.70 (E) Z=-1.65
(2) If we want to test against : at , then the Rejection Region of is
(A) (B) (C) (D) (E)
(3) If we want to test against at , then we
(A) Accept (B) Reject
Q3) An electrical firm manufactures light bulbs that have a length of life that is normally distributed. A sample
of 20 bulbs were selected randomly and found to have an average of 655 hours and a standard deviation of 27
hours. Let be the population mean of life lengths of all bulbs manufactured by this firm. Test
against ? Use a 0.02 level of significance.
Q 10.20 Page 356
A random sample of 64 bags of white cheddar popcorn weighed, on average, 5.23 ounces with a standard
deviation of 0.24 ounce. Test the hypothesis that ounces against the alternative hypothesis,
ounces, at the 0.05 level of significance.
Q 10.23 Page 356
Test the hypothesis that the average content of containers of a particular lubricant is 10 liters if the contents of a
random sample of 10 containers are 10.2, 9.7, 10.1, 10.3, 10.1, 9.8, 9.9, 10.4, 10.3, and 9.8 liters. Use a 0.01
level of significance and assume that the distribution of contents is normal.
H.W: 10.24, 10.25
12.2. Two Means:
Q1. Two random samples were independently selected from two normal populations with equal variances. The
results are summarized as follows.
First Sample Second Sample
sample size (n)
sample mean ( X )
sample variance (S2)
12
10.5
4
14
10.0
5
Let 1 and 2 be the true means of the first and second populations, respectively. Test Ho: 1= 2 against H1:
1 2 . (use =0.05)
Q2. A researcher was interested in comparing the mean score of female students, f, with the mean score of
male students, m, in a certain test. Two independent samples gave the following results:
Sample Observations mean variance
Scores of Females 89.2 81.6 79.6 80.0 82.8 82.63 15.05
Scores of Males 83.2 83.2 84.8 81.4 78.6 71.5 77.6 80.04 20.79
Assume that the populations are normal with equal variances.
(1) The pooled estimate of the variance 2pS is

STAT-324 EXERCISES Dr. Abdullah Al-Shiha
- 43 -
(A) 17.994 (B) 17.794 (C) 18.094 (D) 18.294 (E) 18.494
(2) If we want to test Ho: f = m against H1: f m then the test statistic equals to
(A) Z= 1.129 (B) T= 1.029 (C) T=1.029 (D) T=1.329 (E) T= 1.329
(3) If we want to test Ho: f = m against H1: f m at =0.1, then the Acceptance Region of Ho is
(A) (,1.812) (B) (1.812,1.812) (C) (1.372,) (D) (1.372,1.372) (E) (1.812,)
(4) If we want to test Ho: f = m against H1: f m at =0.1, then we
(A) Reject Ho (B) Accept Ho (C) (D) (E)
Q3. A study was conducted to compare to brands of tires A and B. 10 tires of brand A and 12 tires of brand B
were selected randomly. The tires were run until they wear out. The results are:
Brand A: AX = 37000 kilometers SA = 5100
Brand B: BX = 38000 kilometers SB = 6000
Assuming the populations are normally distributed with equal variances. Test Ho: A = B against H1: A < B.
Use a 0.1 level of significance.
Q4. A study was made by a taxi company to decide whether the use of new tires (A) instead of the present tires
(B) improves fuel economy. Six cars were equipped with tires (A) and driven over a prescribed test course.
Without changing drivers and cares, test course was made with tires (B). The gasoline consumption, in
kilometers per liter (km/L), was recorded as follows: (assume the populations are normal with equal unknown
variances)
Car 1 2 3 4 5 6
Type (A) 4.5 4.8 6.6 7.0 6.7 4.6
Type (B) 3.9 4.9 6.2 6.5 6.8 4.1
(a) Test Ho: A 5.6 against H1: A > 5.6. Use a 0.1 level of significance.
(b) Test Ho: A B against H1: A < B. Use a 0.1 level of significance.
Q5. To determine whether car ownership affects a student's academic achievement, two independent random
samples of 100 male students were each drawn from the students' body. The first sample is for non-owners of
cars and the second sample is for owners of cars. The grade point average for the 100 non-owners of cars had an
average equals to 2.70, while the grade point average for the 100 owners of cars had an average equals to 2.54.
Do data present sufficient evidence to indicate a difference in the mean achievement between car owners and
nonowners of cars? Test using =0.05. Assume that the two populations have variances 36.02 ownernon and
40.02 owner
Q6. A geologist collected 20 different ore samples, all of the same weight, and randomly divided them into two
groups. The titanium contents of the samples, found using two different methods, are listed in the table:
Method 1 Method 2
1.1 1.3 1.3 1.5 1.4
1.3 1.0 1.3 1.1 1.2
1509.0,25.1 11 SX
1.1 1.6 1.3 1.2 1.5
1.2 1.7 1.3 1.4 1.5
1932.0,38.1 22 SX
Does this data provide sufficient statistical evidence to indicate that there is a difference between the mean
titanium contents using the two different methods? Test using =0.05. (Assume two normal populations with
equal variances).

STAT-324 EXERCISES Dr. Abdullah Al-Shiha
- 44 -
Q1) Two random samples were independently selected from two normal populations with equal variances. The
results are summarized as follows.
First Sample Second Sample
sample size (n)
sample mean ( )
sample variance
12
10.5
4
14
10.0
5
Let and be the true means of the first and second populations, respectively. Test
against
. (use )
Q5) To determine whether car ownership affects a student's academic achievement, two independent random
samples of 100 male students were each drawn from the students' body. The first sample is for non-owners of
cars and the second sample is for owners of cars. The grade point average for the 100 non-owners of cars had an
average equals to 2.70, while the grade point average for the 100 owners of cars had an average equals to 2.54.
Do data present sufficient evidence to indicate a difference in the mean achievement between car owners and
non -owners of cars? Test using . Assume that the two populations have variances
and .
Q 10.30 Page 357
Random sample of size , taken from a normal population with a standard deviation , has a
mean . A second random sample of size , taken from a different normal population with a
standard deviation , has a mean . Test the hypothesis that against the alternative,
.
Q 10.33 Page 357
A study was conducted to see if increasing the substrate concentration has an appreciable effect on the velocity
of a chemical reaction. With a substrate concentration of 1.5 moles per liter, the reaction was run 15 times, with
an average velocity of 7.5 micromoles per 30 minutes and a standard deviation of 1.5. With a substrate
concentration of 2.0 moles per liter, 12 runs were made, yielding an average velocity of 8.8 micromoles per 30
minutes and a sample standard deviation of 1.2. Is there any reason to believe that this increase in substrate
concentration causes an increase in the mean velocity of the reaction of more than 0.5 micromole per 30
minutes? Use a 0.01 level of significance and assume the populations to be approximately normally distributed
with equal variances.
H.W: 10.29, 10.35
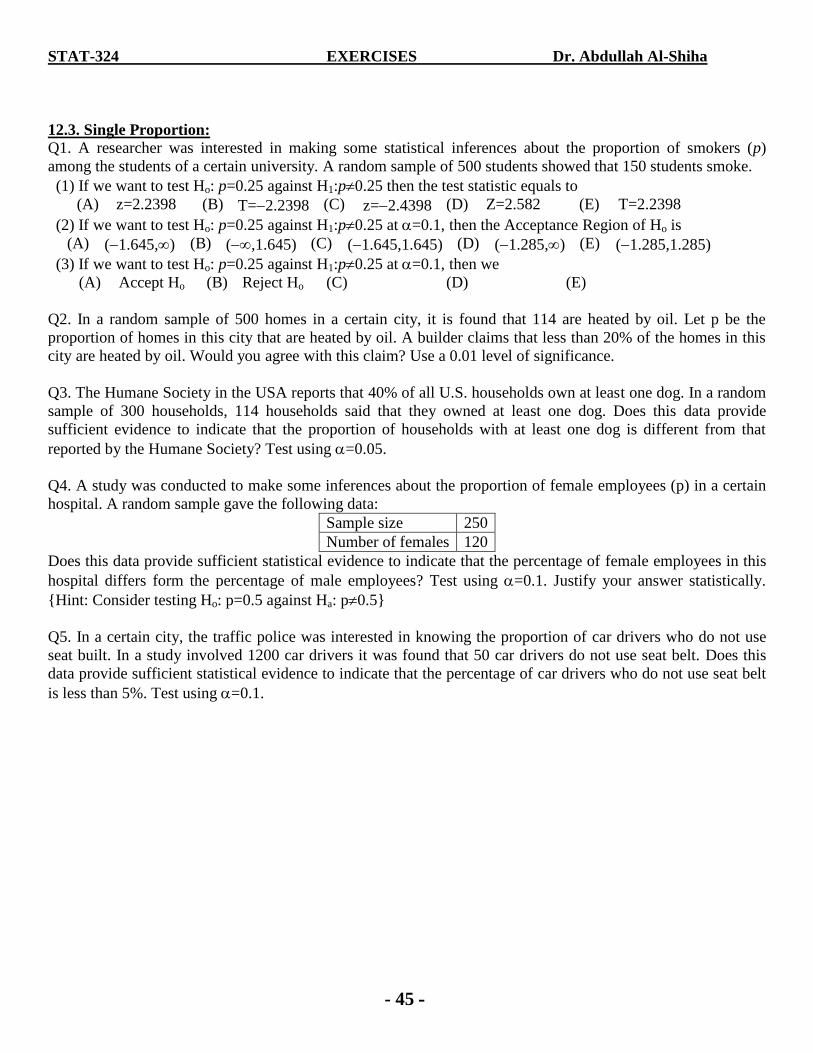
STAT-324 EXERCISES Dr. Abdullah Al-Shiha
- 45 -
12.3. Single Proportion:
Q1. A researcher was interested in making some statistical inferences about the proportion of smokers (p)
among the students of a certain university. A random sample of 500 students showed that 150 students smoke.
(1) If we want to test Ho: p=0.25 against H1:p0.25 then the test statistic equals to
(A) z=2.2398 (B) T=2.2398 (C) z=2.4398 (D) Z=2.582 (E) T=2.2398
(2) If we want to test Ho: p=0.25 against H1:p0.25 at =0.1, then the Acceptance Region of Ho is
(A) (1.645,) (B) (,1.645) (C) (1.645,1.645) (D) (1.285,) (E) (1.285,1.285)
(3) If we want to test Ho: p=0.25 against H1:p0.25 at =0.1, then we
(A) Accept Ho (B) Reject Ho (C) (D) (E)
Q2. In a random sample of 500 homes in a certain city, it is found that 114 are heated by oil. Let p be the
proportion of homes in this city that are heated by oil. A builder claims that less than 20% of the homes in this
city are heated by oil. Would you agree with this claim? Use a 0.01 level of significance.
Q3. The Humane Society in the USA reports that 40% of all U.S. households own at least one dog. In a random
sample of 300 households, 114 households said that they owned at least one dog. Does this data provide
sufficient evidence to indicate that the proportion of households with at least one dog is different from that
reported by the Humane Society? Test using =0.05.
Q4. A study was conducted to make some inferences about the proportion of female employees (p) in a certain
hospital. A random sample gave the following data:
Sample size 250
Number of females 120
Does this data provide sufficient statistical evidence to indicate that the percentage of female employees in this
hospital differs form the percentage of male employees? Test using =0.1. Justify your answer statistically.
{Hint: Consider testing Ho: p=0.5 against Ha: p0.5}
Q5. In a certain city, the traffic police was interested in knowing the proportion of car drivers who do not use
seat built. In a study involved 1200 car drivers it was found that 50 car drivers do not use seat belt. Does this
data provide sufficient statistical evidence to indicate that the percentage of car drivers who do not use seat belt
is less than 5%. Test using =0.1.

STAT-324 EXERCISES Dr. Abdullah Al-Shiha
- 46 -
From book :
Q1) A researcher was interested in making some statistical inferences about the proportion of smokers (p)
among the students of a certain university. A random sample of 500 students showed that 150 students smoke.
(1) If we want to test against then the test statistic equals to
(A) Z=2.2398 (B) T=-2.2398 (C) Z=-2.4398 (D) Z=2.582 (E) T=2.2398
(2) If we want to test against at , then the Acceptance Region of
is
(A) (B) (C) (D) (E)
(3) If we want to test against at , then we
(A) Accept (B) Reject
Q10.58 Page 365
It is believed that at least 60% of the residents in a certain area favor an annexation suit by a neighboring city.
What conclusion would you draw if only 110 in a sample of 200 voters favored the suit? Use a 0.05 level of
significance.
Q10.59 Page 365
A fuel oil company claims that one-fifth of the homes in a certain city are heated by oil. Do we have reason to
believe that fewer than one-fifth are heated by oil if, in a random sample of 1000 homes in this city, 136 are
heated by oil? Use a P-value in your conclusion.
H.W: 10.57, 10.60
12.4. Two Proportions:
Q1. A random sample of 100 students from school "A" showed that 15 students smoke. Another independent
random sample of 200 students from school "B" showed that 20 students smoke. Let p1 be the proportion of
smokers in school "A" and p2 is the proportion of smokers in school "B". Test Ho: p1= p2 against H1: p1 > p2 .
(use =0.05)
Q2. A food company distributes "smiley cow" brand of milk. A random sample of 200 consumers in the city
(A) showed that 80 consumers prefer the "smiley cow" brand of milk. Another independent random sample of
300 consumers in the city (B) showed that 90 consumers prefer "smiley cow" brand of milk. Define:
pA = the true proportion of consumers in the city (A) preferring "smiley cow" brand.
pB = the true proportion of consumers in the city (B) preferring "smiley cow" brand.
(a) Test Ho: pA = 0.33 against H1: pA 0.33. Use a 0.05 level of significance.
(b) Test Ho: pA pB against H1: pA < pB. Use a 0.05 level of significance.
Q3: Independent random samples of 15001 n and 10002 n observations were selected from binomial
populations 1 and 2, and 12001 X and 7002 X successes were observed. Let 1
p and 2p be the population
proportions.
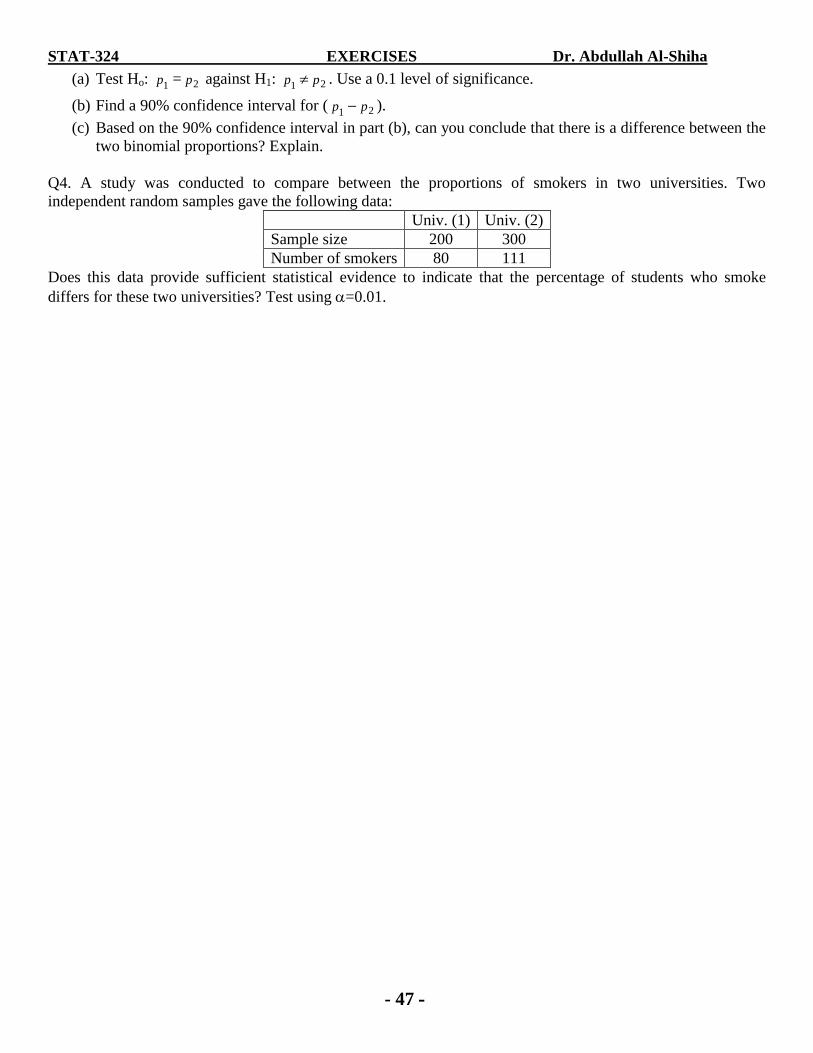
STAT-324 EXERCISES Dr. Abdullah Al-Shiha
- 47 -
(a) Test Ho: 1p = 2p against H1: 1
p 2p . Use a 0.1 level of significance.
(b) Find a 90% confidence interval for (1
p 2p ).
(c) Based on the 90% confidence interval in part (b), can you conclude that there is a difference between the
two binomial proportions? Explain.
Q4. A study was conducted to compare between the proportions of smokers in two universities. Two
independent random samples gave the following data:
Univ. (1) Univ. (2)
Sample size 200 300
Number of smokers 80 111
Does this data provide sufficient statistical evidence to indicate that the percentage of students who smoke
differs for these two universities? Test using =0.01.
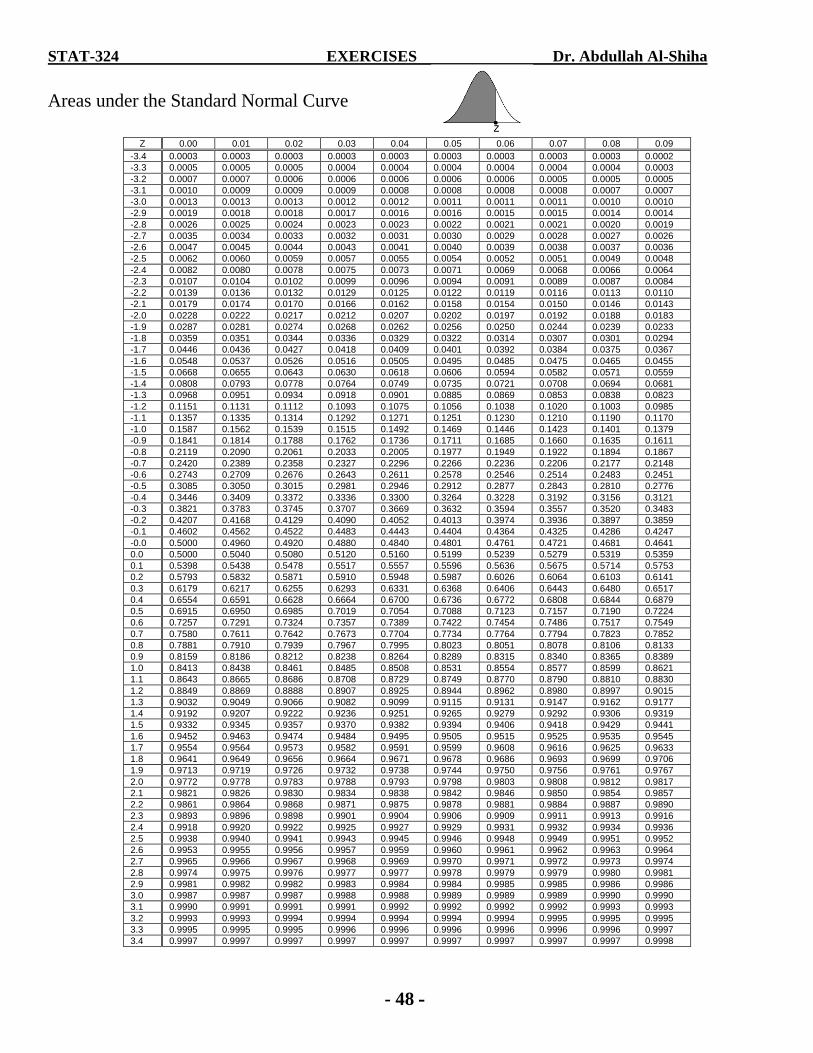
STAT-324 EXERCISES Dr. Abdullah Al-Shiha
- 48 -
Areas under the Standard Normal Curve
Z 0.00 0.01 0.02 0.03 0.04 0.05 0.06 0.07 0.08 0.09
-3.4 0.0003 0.0003 0.0003 0.0003 0.0003 0.0003 0.0003 0.0003 0.0003 0.0002
-3.3 0.0005 0.0005 0.0005 0.0004 0.0004 0.0004 0.0004 0.0004 0.0004 0.0003
-3.2 0.0007 0.0007 0.0006 0.0006 0.0006 0.0006 0.0006 0.0005 0.0005 0.0005
-3.1 0.0010 0.0009 0.0009 0.0009 0.0008 0.0008 0.0008 0.0008 0.0007 0.0007
-3.0 0.0013 0.0013 0.0013 0.0012 0.0012 0.0011 0.0011 0.0011 0.0010 0.0010
-2.9 0.0019 0.0018 0.0018 0.0017 0.0016 0.0016 0.0015 0.0015 0.0014 0.0014
-2.8 0.0026 0.0025 0.0024 0.0023 0.0023 0.0022 0.0021 0.0021 0.0020 0.0019
-2.7 0.0035 0.0034 0.0033 0.0032 0.0031 0.0030 0.0029 0.0028 0.0027 0.0026
-2.6 0.0047 0.0045 0.0044 0.0043 0.0041 0.0040 0.0039 0.0038 0.0037 0.0036
-2.5 0.0062 0.0060 0.0059 0.0057 0.0055 0.0054 0.0052 0.0051 0.0049 0.0048
-2.4 0.0082 0.0080 0.0078 0.0075 0.0073 0.0071 0.0069 0.0068 0.0066 0.0064
-2.3 0.0107 0.0104 0.0102 0.0099 0.0096 0.0094 0.0091 0.0089 0.0087 0.0084
-2.2 0.0139 0.0136 0.0132 0.0129 0.0125 0.0122 0.0119 0.0116 0.0113 0.0110
-2.1 0.0179 0.0174 0.0170 0.0166 0.0162 0.0158 0.0154 0.0150 0.0146 0.0143
-2.0 0.0228 0.0222 0.0217 0.0212 0.0207 0.0202 0.0197 0.0192 0.0188 0.0183
-1.9 0.0287 0.0281 0.0274 0.0268 0.0262 0.0256 0.0250 0.0244 0.0239 0.0233
-1.8 0.0359 0.0351 0.0344 0.0336 0.0329 0.0322 0.0314 0.0307 0.0301 0.0294
-1.7 0.0446 0.0436 0.0427 0.0418 0.0409 0.0401 0.0392 0.0384 0.0375 0.0367
-1.6 0.0548 0.0537 0.0526 0.0516 0.0505 0.0495 0.0485 0.0475 0.0465 0.0455
-1.5 0.0668 0.0655 0.0643 0.0630 0.0618 0.0606 0.0594 0.0582 0.0571 0.0559
-1.4 0.0808 0.0793 0.0778 0.0764 0.0749 0.0735 0.0721 0.0708 0.0694 0.0681
-1.3 0.0968 0.0951 0.0934 0.0918 0.0901 0.0885 0.0869 0.0853 0.0838 0.0823
-1.2 0.1151 0.1131 0.1112 0.1093 0.1075 0.1056 0.1038 0.1020 0.1003 0.0985
-1.1 0.1357 0.1335 0.1314 0.1292 0.1271 0.1251 0.1230 0.1210 0.1190 0.1170
-1.0 0.1587 0.1562 0.1539 0.1515 0.1492 0.1469 0.1446 0.1423 0.1401 0.1379
-0.9 0.1841 0.1814 0.1788 0.1762 0.1736 0.1711 0.1685 0.1660 0.1635 0.1611
-0.8 0.2119 0.2090 0.2061 0.2033 0.2005 0.1977 0.1949 0.1922 0.1894 0.1867
-0.7 0.2420 0.2389 0.2358 0.2327 0.2296 0.2266 0.2236 0.2206 0.2177 0.2148
-0.6 0.2743 0.2709 0.2676 0.2643 0.2611 0.2578 0.2546 0.2514 0.2483 0.2451
-0.5 0.3085 0.3050 0.3015 0.2981 0.2946 0.2912 0.2877 0.2843 0.2810 0.2776
-0.4 0.3446 0.3409 0.3372 0.3336 0.3300 0.3264 0.3228 0.3192 0.3156 0.3121
-0.3 0.3821 0.3783 0.3745 0.3707 0.3669 0.3632 0.3594 0.3557 0.3520 0.3483
-0.2 0.4207 0.4168 0.4129 0.4090 0.4052 0.4013 0.3974 0.3936 0.3897 0.3859
-0.1 0.4602 0.4562 0.4522 0.4483 0.4443 0.4404 0.4364 0.4325 0.4286 0.4247
-0.0 0.5000 0.4960 0.4920 0.4880 0.4840 0.4801 0.4761 0.4721 0.4681 0.4641
0.0 0.5000 0.5040 0.5080 0.5120 0.5160 0.5199 0.5239 0.5279 0.5319 0.5359
0.1 0.5398 0.5438 0.5478 0.5517 0.5557 0.5596 0.5636 0.5675 0.5714 0.5753
0.2 0.5793 0.5832 0.5871 0.5910 0.5948 0.5987 0.6026 0.6064 0.6103 0.6141
0.3 0.6179 0.6217 0.6255 0.6293 0.6331 0.6368 0.6406 0.6443 0.6480 0.6517
0.4 0.6554 0.6591 0.6628 0.6664 0.6700 0.6736 0.6772 0.6808 0.6844 0.6879
0.5 0.6915 0.6950 0.6985 0.7019 0.7054 0.7088 0.7123 0.7157 0.7190 0.7224
0.6 0.7257 0.7291 0.7324 0.7357 0.7389 0.7422 0.7454 0.7486 0.7517 0.7549
0.7 0.7580 0.7611 0.7642 0.7673 0.7704 0.7734 0.7764 0.7794 0.7823 0.7852
0.8 0.7881 0.7910 0.7939 0.7967 0.7995 0.8023 0.8051 0.8078 0.8106 0.8133
0.9 0.8159 0.8186 0.8212 0.8238 0.8264 0.8289 0.8315 0.8340 0.8365 0.8389
1.0 0.8413 0.8438 0.8461 0.8485 0.8508 0.8531 0.8554 0.8577 0.8599 0.8621
1.1 0.8643 0.8665 0.8686 0.8708 0.8729 0.8749 0.8770 0.8790 0.8810 0.8830
1.2 0.8849 0.8869 0.8888 0.8907 0.8925 0.8944 0.8962 0.8980 0.8997 0.9015
1.3 0.9032 0.9049 0.9066 0.9082 0.9099 0.9115 0.9131 0.9147 0.9162 0.9177
1.4 0.9192 0.9207 0.9222 0.9236 0.9251 0.9265 0.9279 0.9292 0.9306 0.9319
1.5 0.9332 0.9345 0.9357 0.9370 0.9382 0.9394 0.9406 0.9418 0.9429 0.9441
1.6 0.9452 0.9463 0.9474 0.9484 0.9495 0.9505 0.9515 0.9525 0.9535 0.9545
1.7 0.9554 0.9564 0.9573 0.9582 0.9591 0.9599 0.9608 0.9616 0.9625 0.9633
1.8 0.9641 0.9649 0.9656 0.9664 0.9671 0.9678 0.9686 0.9693 0.9699 0.9706
1.9 0.9713 0.9719 0.9726 0.9732 0.9738 0.9744 0.9750 0.9756 0.9761 0.9767
2.0 0.9772 0.9778 0.9783 0.9788 0.9793 0.9798 0.9803 0.9808 0.9812 0.9817
2.1 0.9821 0.9826 0.9830 0.9834 0.9838 0.9842 0.9846 0.9850 0.9854 0.9857
2.2 0.9861 0.9864 0.9868 0.9871 0.9875 0.9878 0.9881 0.9884 0.9887 0.9890
2.3 0.9893 0.9896 0.9898 0.9901 0.9904 0.9906 0.9909 0.9911 0.9913 0.9916
2.4 0.9918 0.9920 0.9922 0.9925 0.9927 0.9929 0.9931 0.9932 0.9934 0.9936
2.5 0.9938 0.9940 0.9941 0.9943 0.9945 0.9946 0.9948 0.9949 0.9951 0.9952
2.6 0.9953 0.9955 0.9956 0.9957 0.9959 0.9960 0.9961 0.9962 0.9963 0.9964
2.7 0.9965 0.9966 0.9967 0.9968 0.9969 0.9970 0.9971 0.9972 0.9973 0.9974
2.8 0.9974 0.9975 0.9976 0.9977 0.9977 0.9978 0.9979 0.9979 0.9980 0.9981
2.9 0.9981 0.9982 0.9982 0.9983 0.9984 0.9984 0.9985 0.9985 0.9986 0.9986
3.0 0.9987 0.9987 0.9987 0.9988 0.9988 0.9989 0.9989 0.9989 0.9990 0.9990
3.1 0.9990 0.9991 0.9991 0.9991 0.9992 0.9992 0.9992 0.9992 0.9993 0.9993
3.2 0.9993 0.9993 0.9994 0.9994 0.9994 0.9994 0.9994 0.9995 0.9995 0.9995
3.3 0.9995 0.9995 0.9995 0.9996 0.9996 0.9996 0.9996 0.9996 0.9996 0.9997
3.4 0.9997 0.9997 0.9997 0.9997 0.9997 0.9997 0.9997 0.9997 0.9997 0.9998

STAT-324 EXERCISES Dr. Abdullah Al-Shiha
- 49 -
Percentage Points of the t Distribution; t , {P(T> t , ) = }
0.40 0.30 0.20 0.15 0.10 0.05 0.025 0.02 0.015 0.01 0.0075 0.005 0.0025 0.0005 1 0.325 0.727 1.376 1.963 3.078 6.314 12.706 15.895 21.205 31.821 42.434 63.657 127.322 636.590
2 0.289 0.617 1.061 1.386 1.886 2.920 4.303 4.849 5.643 6.965 8.073 9.925 14.089 31.598
3 0.277 0.584 0.978 1.250 1.638 2.353 3.182 3.482 3.896 4.541 5.047 5.841 7.453 12.924
4 0.271 0.569 0.941 1.190 1.533 2.132 2.776 2.999 3.298 3.747 4.088 4.604 5.598 8.610
5 0.267 0.559 0.920 1.156 1.476 2.015 2.571 2.757 3.003 3.365 3.634 4.032 4.773 6.869
6 0.265 0.553 0.906 1.134 1.440 1.943 2.447 2.612 2.829 3.143 3.372 3.707 4.317 5.959
7 0.263 0.549 0.896 1.119 1.415 1.895 2.365 2.517 2.715 2.998 3.203 3.499 4.029 5.408
8 0.262 0.546 0.889 1.108 1.397 1.860 2.306 2.449 2.634 2.896 3.085 3.355 3.833 5.041
9 0.261 0.543 0.883 1.100 1.383 1.833 2.262 2.398 2.574 2.821 2.998 3.250 3.690 4.781
10 0.260 0.542 0.879 1.093 1.372 1.812 2.228 2.359 2.527 2.764 2.932 3.169 3.581 4.587
11 0.260 0.540 0.876 1.088 1.363 1.796 2.201 2.328 2.491 2.718 2.879 3.106 3.497 4.437
12 0.259 0.539 0.873 1.083 1.356 1.782 2.179 2.303 2.461 2.681 2.836 3.055 3.428 4.318
13 0.259 0.538 0.870 1.079 1.350 1.771 2.160 2.282 2.436 2.650 2.801 3.012 3.372 4.221
14 0.258 0.537 0.868 1.076 1.345 1.761 2.145 2.264 2.415 2.624 2.771 2.977 3.326 4.140
15 0.258 0.536 0.866 1.074 1.341 1.753 2.131 2.249 2.397 2.602 2.746 2.947 3.286 4.073
16 0.258 0.535 0.865 1.071 1.337 1.746 2.120 2.235 2.382 2.583 2.724 2.921 3.252 4.015
17 0.257 0.534 0.863 1.069 1.333 1.740 2.110 2.224 2.368 2.567 2.706 2.898 3.222 3.965
18 0.257 0.534 0.862 1.067 1.330 1.734 2.101 2.214 2.356 2.552 2.689 2.878 3.197 3.922
19 0.257 0.533 0.861 1.066 1.328 1.729 2.093 2.205 2.346 2.539 2.674 2.861 3.174 3.883
20 0.257 0.533 0.860 1.064 1.325 1.725 2.086 2.197 2.336 2.528 2.661 2.845 3.153 3.850
21 0.257 0.532 0.859 1.063 1.323 1.721 2.080 2.189 2.328 2.518 2.649 2.831 3.135 3.819
22 0.256 0.532 0.858 1.061 1.321 1.717 2.074 2.183 2.320 2.508 2.639 2.819 3.119 3.792
23 0.256 0.532 0.858 1.060 1.319 1.714 2.069 2.177 2.313 2.500 2.629 2.807 3.104 3.768
24 0.256 0.531 0.857 1.059 1.318 1.711 2.064 2.172 2.307 2.492 2.620 2.797 3.091 3.745
25 0.256 0.531 0.856 1.058 1.316 1.708 2.060 2.167 2.301 2.485 2.612 2.787 3.078 3.725
26 0.256 0.531 0.856 1.058 1.315 1.706 2.056 2.162 2.296 2.479 2.605 2.779 3.067 3.707
27 0.256 0.531 0.855 1.057 1.314 1.703 2.052 2.158 2.291 2.473 2.598 2.771 3.057 3.690
28 0.256 0.530 0.855 1.056 1.313 1.701 2.048 2.154 2.286 2.467 2.592 2.763 3.047 3.674
29 0.256 0.530 0.854 1.055 1.311 1.699 2.045 2.150 2.282 2.462 2.586 2.756 3.038 3.659
30 0.256 0.530 0.854 1.055 1.310 1.697 2.042 2.147 2.278 2.457 2.581 2.750 3.030 3.646
40 0.255 0.529 0.851 1.050 1.303 1.684 2.021 2.123 2.250 2.423 2.542 2.704 2.971 3.551
60 0.254 0.527 0.848 1.045 1.296 1.671 2.000 2.099 2.223 2.390 2.504 2.660 2.915 3.460
120 0.254 0.526 0.845 1.041 1.289 1.658 1.980 2.076 2.196 2.358 2.468 2.617 2.860 3.373
0.253 0.524 0.842 1.036 1.282 1.645 1.960 2.054 2.170 2.326 2.432 2.576 2.807 3.291

STAT-324 EXERCISES Dr. Abdullah Al-Shiha
- 50 -
Summary of Confidence Interval Procedures
Problem Type Point Estimate Two-Sided 100(1-)% Confidence Interval
Mean
variance 2 known,
normal distribution, or any
distribution with n>30
X
nZX
nZX
22
or n
ZX
2
Mean
normal distribution, variance 2
unknown
X
n
StX
n
StX
22
or n
StX
2
(df: =n1)
Difference in two means 1 and 2
variances 12 and 2
2 are known,
normal distributions, or any
distributions with n1, n2 >30
21 XX
2
22
1
21
2
21212
22
1
21
2
21 )()(nn
ZXXnn
ZXX
or 2
22
1
21
2
21 )(nn
ZXX
Difference in means 1 and 2
normal distributions,
variances 12 = 2
2 and unknown
21 XX
212
212121
2
2111
)(11
)(nn
StXXnn
StXX pp
or 21
2
2111
)(nn
StXX p
2
)1()1(
21
222
2112
nn
SnSnS p ; (df: =n1+n22)
Proportion p
(or parameter of a binomial
distribution)
p̂
n
qpZpp
n
qpZp
ˆˆˆ
ˆˆˆ
22
or pqn
qpZp ˆ1ˆ;
ˆˆˆ
2
Difference in two proportions
p1 p2
(or difference in two binomial
parameters)
21 ˆˆ pp
2
22
1
11
2
21212
22
1
11
2
21
ˆˆˆˆ)ˆˆ(
ˆˆˆˆ)ˆˆ(
n
qp
n
qpZpppp
n
qp
n
qpZpp
or 2
22
1
11
2
21
ˆˆˆˆ)ˆˆ(
n
qp
n
qpZpp
.
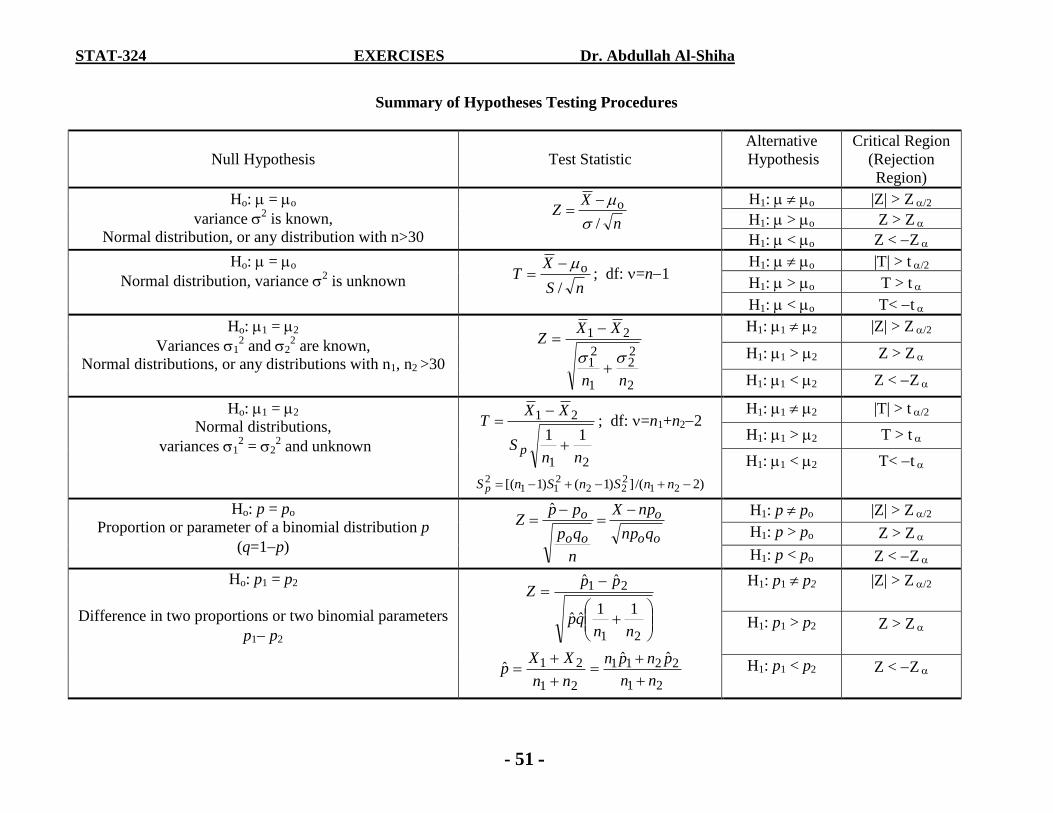
STAT-324 EXERCISES Dr. Abdullah Al-Shiha
- 51 -
Summary of Hypotheses Testing Procedures
Null Hypothesis
Test Statistic
Alternative
Hypothesis
Critical Region
(Rejection
Region)
Ho: = o
variance 2 is known,
Normal distribution, or any distribution with n>30 n
XZ
/
o
H1: o |Z| > Z /2
H1: > o Z > Z
H1: < o Z < Z
Ho: = o
Normal distribution, variance 2 is unknown nS
XT
/
o ; df: =n1 H1: o |T| > t /2
H1: > o T > t
H1: < o T< t
Ho: 1 = 2
Variances 12 and 2
2 are known,
Normal distributions, or any distributions with n1, n2 >30
2
22
1
21
21
nn
XXZ
H1: 1 2 |Z| > Z /2
H1: 1 > 2 Z > Z
H1: 1 < 2 Z < Z
Ho: 1 = 2
Normal distributions,
variances 12 = 2
2 and unknown
21
21
11
nnS
XXT
p
; df: =n1+n22
)2/(])1()1[( 21222
211
2 nnSnSnS p
H1: 1 2 |T| > t /2
H1: 1 > 2 T > t
H1: 1 < 2 T< t
Ho: p = po
Proportion or parameter of a binomial distribution p
(q=1p) oo
o
oo
o
qnp
npX
n
qp
ppZ
ˆ
H1: p po |Z| > Z /2
H1: p > po Z > Z
H1: p < po Z < Z
Ho: p1 = p2
Difference in two proportions or two binomial parameters
p1 p2
21
21
11ˆˆ
ˆˆ
nnqp
ppZ
21
21ˆnn
XXp
21
2211 ˆˆ
nn
pnpn
H1: p1 p2 |Z| > Z /2
H1: p1 > p2 Z > Z
H1: p1 < p2 Z < Z