ssp group limited
TRANSCRIPT

SSP Group Limited
Annual Report and Financial Statements
Registered number 05735966
30 September 2013

SSP Group Limited
Annual Report and Financial Statements (Registered number: 05735966)
30 September 2013
Contents
Company information 1
Strategic report 2
Directors’ report 8
Statement of directors’ responsibilities in respect of the directors’ report and the financial statements 10
Independent auditor’s report to the members of SSP Group Limited 11
Consolidated income statement 12
Consolidated statement of other comprehensive income 13
Consolidated balance sheet 14
Consolidated statement of changes in equity 15
Consolidated cash flow statement 16
Notes to consolidated financial statements 17
Company balance sheet 53
Reconciliations of movements in company shareholders’ funds 54
Notes to the company financial statements 55

SSP Group Limited
Annual Report and Financial Statements (Registered number: 05735966)
30 September 2013
1
Company information
Directors
V Soerensen
P Franzen
J M B Gibson
S Marinker
Company secretary
J Davies
Registered office
169 Euston Road
London
NW1 2AE
United Kingdom
Auditor
KPMG LLP
15 Canada Square
Canary Wharf
London
E14 5GL
United Kingdom

SSP Group Limited
Annual Report and Financial Statements (Registered number: 05735966)
30 September 2013
2
Strategic report
Principal activities
The Company acts as the holding company for the SSP group, which comprises subsidiaries and associates
operating a range of catering and retail concession businesses principally in the UK, Continental Europe, Asia and
North America (“SSP Group” or “SSP” or “Group”).
The following describes the main trends and factors underlying the performance of the Group during the year ended
30 September 2013, as well as those likely to affect its future development.
Principal operations, businesses and segments
SSP is one of the leading food and beverage travel concession businesses in Europe and Asia, with a growing
presence in North America. It operates in excess of 2,100 catering and retail units at over 400 locations across
airports, railway stations and motorway service areas in the main. It holds market leading positions in the majority
of the 30 countries in which it operates, including in the UK, France, Germany, the Nordic countries, and the Asia
Pacific region. In many of these countries, SSP’s trading is seasonal, peaking during the summer holiday season in
the final quarter of the financial year.
SSP operates well-known, company-owned brands, such as Caffe Ritazza, Upper Crust, Bonne Journée and Millie’s
Cookies, and a number of key franchised brands, including M&S Simply Food, Burger King, Caviar House &
Prunier and Starbucks. The business is managed and reported on a geographical basis, rather than by distribution
channel or by brand, due to the importance of the local culture on customer behaviour and therefore the operations
of the business. Equally, there are benefits in the management team and clients sharing the same language and
culture, of sharing one local supply chain, and in the practicalities of having only one operational management team
per region.
Objectives and strategic priorities
Our objective is to be the first choice operator of food and beverage brands in travel locations worldwide, and to be
recognised internationally as the Food Travel Experts. Our strategy remains:
To consistently deliver the best offer for our customers;
To be the preferred partner for our clients;
To run an efficient and effective business;
To grow in those locations where we already do business, and to develop in new locations and channels;
To develop high performance teams that best meet the needs of clients and customers.
Customer focus is paramount to our strategy and to our day to day operations. Meeting the needs of customers is an
essential element of SSP’s business model, and is a key driver of client satisfaction. We do this by providing the best
portfolio of food and drink brands for customers in the travel environment, many of which are tailored to meet the
specific needs of travelling passengers. Our insight into the travel sector comes from our extensive customer
research programmes and our 60 years’ experience as the leading operator in the sector. We are passionate about
food quality and innovation, whether this is in a fast food or high-end dining environment. We are continuously
adapting our product range for major shifts in consumer tastes and trends, and seeking new ways to present and
package food for travellers. Our success is built on our on-going delivery of high quality food and drink in great
environments, combining exceptional service with the highest standards of operational excellence.
The depth and breadth of our brand portfolio means that we can meet the precise needs of our clients, whether their
requirement is for an international or a national brand, or for a bespoke offer, reflecting local tastes. Successfully
bringing these elements together, time after time, is what sets SSP apart and is the foundation of the trust of our
client partners. SSP aspires to deliver great food and drink offers on behalf of our clients in the travel environment,
and we guarantee that we achieve this through continuously monitoring, and responding to, customer and client
feedback.
We aim to manage the business efficiently and effectively, maintaining the highest standards of operational
execution and cost-effectiveness. Our ability to deliver fast, efficient and friendly customer service in very high
volume travel locations is also a critical component of our business model, and we are able to do this through our
investments in training, labour scheduling systems and technology.
We actively look for growth opportunities in travel locations where we already do business, thereby further
leveraging our existing infrastructure and support functions, and providing further commercial opportunities for our
clients. We are continuously seeking opportunities for further expansion into new travel locations, extending our
presence in both existing and new markets.
SSP Group Limited
Annual Report and Financial Statements (Registered number: 05735966)
30 September 2013
3
Strategic report (continued)
Objectives and strategic priorities (continued)
We strive to attract and retain the best people, creating high quality teams that can satisfy the requirements of our
clients and our customers. We are recognised as the Food Travel Experts because of the accumulated knowledge,
experience and skills within SSP to operate food and drink brands to the highest standards within travel locations.
We put in place incentive programmes to ensure that all of our teams are measured and rewarded for delivering to
the highest standards. Ensuring that our people deliver the very best service to our customers and clients will
continue to underpin the delivery of our financial targets and our objectives for the business over the coming years.
Market overview and future outlook
As in previous years, the economic backdrop in 2012/13 continued to be challenging. Nevertheless, like-for-like
sales growth of 4.3% for the year was very pleasing, highlighting once again the resilience of the core airport and
railway station markets in which SSP operates. In the airport sector, like-for-like sales grew by 6.6% in the year,
driven in broadly equal measure by increasing passenger numbers and improving average spend per passenger. The
difficult environment for consumer spending continued to have a greater impact in our principal rail markets of the
UK, France and Germany, and same-store sales growth was softer in the rail sector at 2.5% as a result. For the
Group overall, this encouraging sales performance, allied to efficiency gains in our operations, has enabled us to
deliver another year of excellent profit growth and strong cash flow generation.
Looking ahead, we remain optimistic that we can deliver further strong profit growth during the next twelve months.
Although economic conditions in several areas of our business appear to be improving, we are still likely to face
challenging trading conditions and weak levels of consumer confidence in several of our major markets, most
notably in the Eurozone economies. In the Asia Pacific and Middle East markets, we continue to see good growth in
airport passenger numbers, albeit not at the levels of recent years, which have been very buoyant. In Egypt, we are
currently seeing quite significant declines in passenger numbers as a result of the current political unrest and its
impact on tourism, which we do not expect to recover in the near term.
In the longer term, we expect to see continuing growth in passenger numbers in both the air and rail sectors. This
trend will be fuelled by the growth in disposable income in developing markets. Against this backdrop we will
continue to invest in the business and in new growth opportunities, whilst managing the business efficiently and
effectively.
Group performance
In the current economic climate, our financial performance continues to be pleasing, with the business achieving
double-digit growth in operating profit for a third successive year, and delivering a strong set of results in line with
our targets for the year.
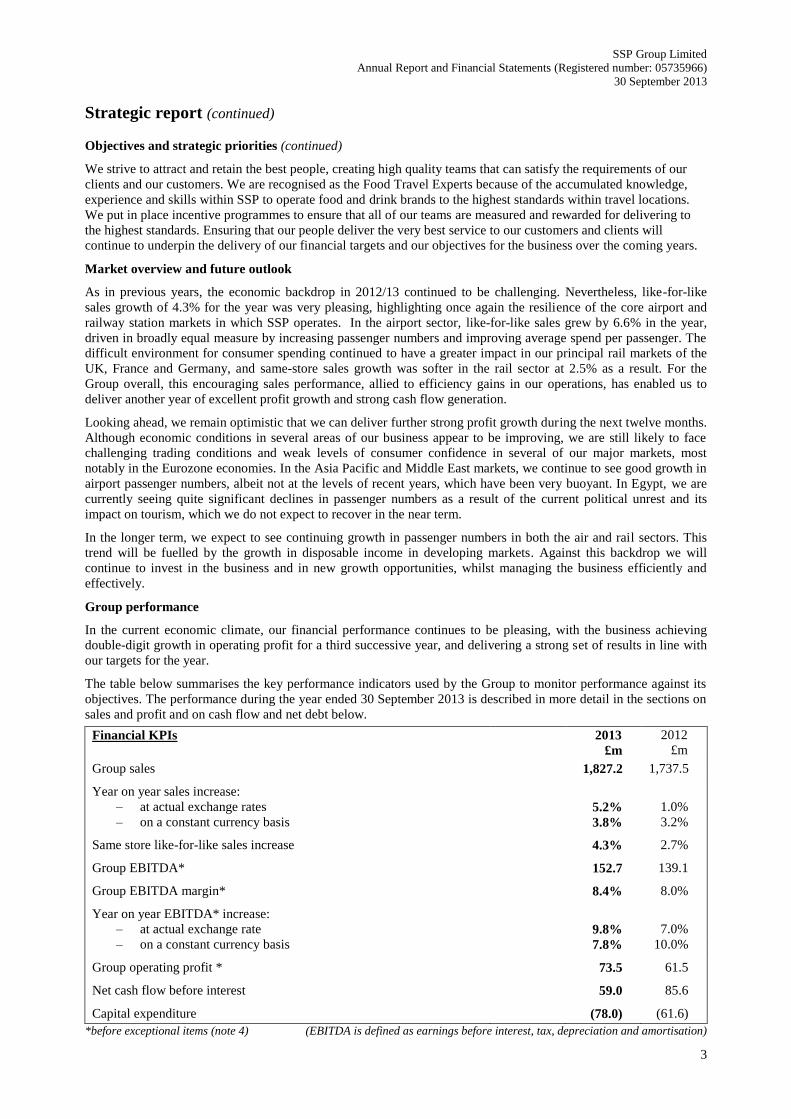
The table below summarises the key performance indicators used by the Group to monitor performance against its
objectives. The performance during the year ended 30 September 2013 is described in more detail in the sections on
sales and profit and on cash flow and net debt below.
Financial KPIs 2013 2012
£m £m
Group sales 1,827.2 1,737.5
Year on year sales increase:
– at actual exchange rates 5.2% 1.0%
– on a constant currency basis 3.8% 3.2%
Same store like-for-like sales increase 4.3% 2.7%
Group EBITDA* 152.7 139.1
Group EBITDA margin* 8.4% 8.0%
Year on year EBITDA* increase:
– at actual exchange rate 9.8% 7.0%
– on a constant currency basis 7.8% 10.0%
Group operating profit * 73.5 61.5
Net cash flow before interest 59.0 85.6
Capital expenditure (78.0) (61.6)
*before exceptional items (note 4) (EBITDA is defined as earnings before interest, tax, depreciation and amortisation)

SSP Group Limited
Annual Report and Financial Statements (Registered number: 05735966)
30 September 2013
4
Strategic report (continued)
Sales and profit
Total sales grew to £1,827.2m (2012: £1,737.5m), an increase of 5.2% year on year. On a constant currency basis,
sales grew by 3.8%, with same-store like-for-like sales growing by 4.3%, offset by approximately 0.5% of net
contract losses.
The table below further analyses the growth in year-on-year sales:
Growth in year-on-year sales H1 H2 Full Year
Same-store like-for-like 3.9% 4.7% 4.3%
Net contract losses (0.8)% (0.3)% (0.5)%
Sales increase (constant currency) – 2013 3.1% 4.4% 3.8%
Same-store like-for-like – 2012 2.3% 3.0% 2.7%
After an encouraging first half, when same-store sales grew by 3.9%, like-for-like sales growth accelerated during
the second half, and particularly in the third quarter, helped by higher airport passenger numbers, notably in the UK,
Scandinavia, Spain and in Asia Pacific. Same-store sales growth softened a little in the final quarter, principally due
to the impact of challenging comparatives in the UK Rail business due to last summer’s London Olympics, together
with the effect of the developing political crisis in Egypt.
The notable contract losses in the year principally comprised a number of loss-making or marginally profitable
locations which we chose to exit during the year in America, Germany, France and the UK. They also included the
impact of closures during major station redevelopments in both the UK (principally at London Bridge, Waterloo and
Birmingham New Street stations) and at Gare de Lyon in Paris. New contracts mobilised during the year included
those at Phoenix and San Diego airports in North America, and at Hangzhou airport in China. We also saw a major
extension to Terminal 4 in JFK airport, New York. In addition, we benefited from the full year impact of new airport
contracts which commenced during the second half of 2012, including Nantes and Vienna airports in Continental
Europe and Xi’an airport in China.
Group EBITDA, adjusted to exclude exceptional items, was £152.7m at actual exchange rates (2012: £139.1m), an
increase of 10% over the previous year. EBITDA margin increased by 0.4% during the year to 8.4%, driven by
significant year-on-year improvements in our labour efficiency, mainly as a result of the strong like-for-like sales
growth and SSP’s operational gearing, and helped by the closure of several loss-making locations with high labour
costs. This labour cost saving was partially offset by the impact of higher concession fees following recent contract
renewals at Oslo, Copenhagen and Tenerife South airports. Although we have seen a steady increase in food cost
inflation during the year (which ran ahead of retail price increases passed on to the consumer), we have been
successful in avoiding any year-on-year erosion of our gross profit margin, helped by improved purchasing terms
and further efficiency gains in our operations.
Underlying operating profit (before exceptional items) was £73.5m (2012: £61.5m), an increase of 20%. During the
year, the Group incurred redundancy and other restructuring costs of £6.3m, and these costs have been classified as
an exceptional item within operating profit. Net of this exceptional charge, operating profit was £67.2m (2012:
£52.1m).
Net finance costs of £42.9m (2012: £46.7m) fell during the year, principally due to reduced average levels of net
debt and lower average interest costs as interest rate swaps unwound. Non-operating exceptional items comprised a
goodwill write-off as a result of our exit from a number of smaller contracts around the Group.
Underlying profit before tax of £33.0m for the year ended 30 September 2013 showed an increase of 95% compared
to the prior year (2012: £16.9m). Statutory profit before tax of £16.2m (2012: £14.4m) was 13% higher than the
previous year.

SSP Group Limited
Annual Report and Financial Statements (Registered number: 05735966)
30 September 2013
5
Strategic report (continued)
Cash flow and net debt
The Group generated net cash flow before interest and financing of £59.0m (2012: £85.6m) as set out in the
summary cash flow statement below:
2013 2012
£m £m
EBITDA 152.7 139.1
Working capital 5.7 16.4
Net cash flow from operations 158.4 155.5
Exceptional costs (8.0) (6.7)
Tax paid (12.3) (11.8)
Capital expenditure (78.0) (61.6)
Net disposal proceeds - 9.8
Purchase of minority share (0.8) -
Net dividends (to)/from minorities and associates (0.3) 0.4
Cash inflow before interest and financing 59.0 85.6
Net interest paid (34.2) (44.2)
Repayment of loans (4.4) (49.2)
Net increase/(decrease) in cash 20.4 (7.8)
Net debt at the start of the year (875.1) (953.3)
Net increase / (decrease) in cash (above) 20.4 (7.8)
Repayment of loans 4.4 49.2
Other non-cash movements (20.1) 36.8
Net debt at the end of the year (870.4) (875.1)
Net cash flow from operations increased year-on-year by £2.9m to £158.4m. This funded £78.0m of capital
expenditure, an increase of £16.4m compared to the prior year, principally as result of the mobilisation of a number
of significant new contracts in North America. Taxes paid in the year amounted to £12.3m, and exceptional
redundancy and restructuring payments totalled £8.0m. Cash out-flows to minorities, net of dividends received from
associates, amounted to £1.1m.
Net interest paid of £34.2m (2012: £44.2m) was significantly lower than in the previous year, mainly as a result of
maturing interest rate swaps. During the year the Group made loan repayments amounting to £4.4m (2012: £49.2m),
lower than the prior year when the Group made a voluntary repayment of the Facility A debt of £47.3m in July
2012.
At the end of the financial year, net debt was £870.4m, a £4.7m reduction from the prior year end.
Financing and capital structure
The Company is principally financed by a combination of sponsor equity (provided by funds advised by EQT
Partners AB) and syndicated bank debt. Following a successful refinancing in 2009, the Group’s loan facilities
currently provide a stable and competitively-priced financing platform from which to develop the business and
further strengthen its financial position over the coming year. The Group’s senior loan facility (Facility A, with
£678.3m outstanding at 30 September 2013) runs to June 2016 and will accrue cash pay interest at LIBOR or
EURIBOR plus an average margin of 2.5% over the next twelve months. The junior loan facility (Tranche B1, with
£376.3m outstanding at 30 September 2013) matures in June 2017 and will accrue cash pay interest capped at 2.25%
over the next twelve months. These loan facilities include financial covenants which are tested quarterly by
reference to the Group’s published results. During the year just ended we were able to report substantial headroom
against each of these key financial covenants, and expect to be in a similar position for the foreseeable future.
The Group maintains a high average cash balance in order to provide a very strong liquidity buffer to counter any
further prolonged downturn in the global economy. During the year to September 2013, the Group maintained an
average cash balance of approximately £144.5m, and closed the year with balance sheet cash of £182.1m. We
expect to maintain strong liquidity headroom going forward.

SSP Group Limited
Annual Report and Financial Statements (Registered number: 05735966)
30 September 2013
6
Strategic report (continued)
Principal risks and uncertainties
The directors recognise that the degree of exposure to certain risks, and the Group’s ability to manage those risks
effectively, will influence the future success of the business. The Board therefore reviews the risks associated with
the key parts of the business, and has established internal control systems that are designed to identify those risks
that may restrict or seriously impact the ability of the Group to carry on its operations or may prevent it from taking
advantage of opportunities for growth, or which may lead to negative sentiment or damage to its reputation. In
addition, the Group Risk Committee (including the Group CFO and the Internal Audit function) meets quarterly to
consider all business and financial control risks. The key risks and mitigating factors are set out below:
Business strategy risk
The successful delivery of SSP’s business strategy relies on meeting the needs of both customers and clients. The
Group operates in highly competitive markets and a failure to compete effectively with other retailers may affect
revenues generated through our outlets. Furthermore failure to keep abreast of market developments, including the
use of new technology, could threaten our competitive position. Factors such as the general economic climate, levels
of disposable income, weather, changing demographics and customer shopping patterns, tax and regulatory changes
and increasing raw material costs could all impact profit performance.
For this reason the directors pay close attention to ensuring that the Group meets its objectives by monitoring a
range of key performance indicators. The Group conducts extensive customer research to understand current levels
of customer satisfaction and gathers feedback on changing consumer requirements.
The executive management team reviews detailed weekly and monthly information covering a range of financial
and non-financial indicators, and monitors progress on key strategic projects and business development initiatives.
Performance against independent market share and passenger growth information is also reviewed wherever
available. Across the Group, similar KPIs are also monitored locally, with oversight from executive management.
A formal review of each operating division against its KPIs is held every month with the Group CEO together with
the Group CFO. In addition the executive management team meets to review Group performance on a monthly
basis.
The growth strategy and achievement of financial targets relies on the delivery of a combination of organic sales
growth, new business growth and efficiency savings. In order to monitor progress against each of these, the Board
has put in place a comprehensive planning system, with quarterly plans approved by the Board. Activities and
results against these plans are reported every month to allow the directors and senior management to monitor the
financial and non-financial KPIs, business activities, risks and progress towards objectives. The Group also has
clearly defined appraisal processes and authorisation procedures for all investment expenditure to ensure that it is
consistent with the objectives set by the Board.
Business interruption
An act of terrorism or war, or an outbreak of pandemic disease, or a major and extreme weather event or natural
disaster, could reduce the number of customers visiting SSP outlets, causing a decline in sales and profit. In the past,
our travel locations in various parts of the world have been impacted by major geopolitical events, such as terrorist
attacks or extreme political unrest, which have led to reductions in customer traffic. The volcanic ash cloud in 2010
resulted in the closure of many travel routes in Northern and Western Europe, which had a material effect on our
business, albeit for only a short period. The Group also relies on a number of important IT systems, where any
performance issues could seriously affect its ability to trade.
SSP has business continuity plans which are regularly reviewed, updated and tested. The Group also liaises with
authorities and landlords in key locations to ensure that contingency plans are in place. The Group’s IT systems
receive on-going investment to ensure that they are able to respond to the needs of the business. Back-up facilities
and contingency plans are in place and are tested regularly to ensure that business interruptions are minimised and
that data is protected from corruption or unauthorised use.
Key suppliers and supply chain management
SSP has agreements in place with key suppliers across the world. The interruption or loss of supply of core category
products from these suppliers to our units may affect our ability to trade, whilst quality of supply issues may also
impact SSP’s reputation and its ability to trade. As a result the Group conducts risk assessments of all of its key
suppliers to identify alternatives and develop contingency plans in the event that any of these key suppliers fail. SSP
has contractual and other relationships with numerous third parties in support of its business activities. None of these
arrangements are individually considered to be essential to the business continuity of the group.

SSP Group Limited
Annual Report and Financial Statements (Registered number: 05735966)
30 September 2013
7
Strategic report (continued)
Principal risks and uncertainties (continued)
Loss of key personnel
The performance of SSP depends on its ability to attract, motivate and retain key employees. The skills developed in
our business are highly attractive to other companies, who regularly target them for recruitment. The Group
Remuneration Committee monitors the levels of remuneration for senior management and seeks to ensure that they
are designed to attract, retain and motivate the key personnel to run the Group effectively.
Financial strategy and group treasury risk
The main financial risks for the Group relate to the availability of funds to meet business needs, the risk of default
by counterparties to financial transactions, and fluctuations in interest and foreign exchange rates. In this regard the
Treasury function is mandated by the Board to manage the financial risks that arise in relation to underlying
business needs. The Group’s treasury policy provides clear operating parameters for the Group Treasury, and its
activities are reviewed on a quarterly basis by the Treasury Committee, which in turn reports to the Board to ensure
compliance. The Group Treasury function does not operate as a profit centre and speculative transactions are not
permitted.
Financial instruments, including derivatives, are used on occasion to manage the main financial risks arising during
the course of business. These risks are foreign currency risk, interest rate risk, and liquidity risk and are discussed
further below:
a) Currency risk
Although the functional currency of the Group is Sterling, the Group’s operating cash flows are transacted in a
number of different currencies. The Group’s policy in managing this financial currency risk is to use foreign
currency denominated borrowings to ensure interest costs arise in currencies which reflect the operating cash flows,
thereby minimising net cash flows in foreign currencies. As the mix of foreign currency cash flows generated by the
business changes over time, there may be a requirement to restructure our borrowings (via financial instruments or
other treasury products) to maintain this hedge.
b) Interest rate risk
The policy of the Group is to maintain a balance of fixed and floating rate debt so that the risks associated with
increases in interest rates are mitigated. It is the Group’s policy to use interest rate swaps to help the Group to
maintain its target level of fixed interest debt. Details of the interest rate profile of the Group are provided in note 23
to the financial statements.
c) Liquidity risk
The Group’s objective in managing liquidity risk is to ensure that it can meet its financial obligations as and when
they fall due. In order to achieve this, the Treasury department maintain an appropriate level of funds and facilities
to meet each year’s planned funding requirement.
By order of the board
Jonathan Davies
Secretary
20 December 2013

SSP Group Limited
Annual Report and Financial Statements (Registered number: 05735966)
30 September 2013
8
Directors’ report
Directors
The directors who held office during the year and at the date of signing this report were as follows:
V Soerensen (Chairman)
P Franzen
J M B Gibson
D Malamatinas (resigned on 30 September 2013)
S Marinker (appointed on 4 September 2013)
C van Steenbergen (resigned on 4 September 2013)
Employees
The Group recognises that its principal asset is its employees and their commitment to the Group’s service,
standards and customers. Decisions are made wherever possible in consultation with divisional and regional
management. Communication methods to employees vary according to need and will include but are not limited to,
country and function updates, email bulletins, business briefings, podcasts, intranet, extranet, internal newsletters,
direct correspondence (where appropriate), information and consultation forums, team meetings and management
briefings.
The Group believes in creating a culture that is free from discrimination and harassment and will not permit or
tolerate discrimination in any form. SSP gives full and fair consideration to applications for employment when they
are received from disabled people and employs disabled people whenever suitable vacancies arise. Should an
employee become disabled when working for SSP, they will be retained in employment wherever possible and will
be given help with any necessary rehabilitation and retraining.
Corporate social responsibility (‘CSR’)
The Group CSR Steering Committee has made further good progress on the previously identified key business areas
of beverages, packaging, waste, utilities consumption, and employee wellbeing. Best practice has been collated and
communicated across all Group locations in respect of these activities. The Board has formally adopted a CSR
policy that is now being adhered to across the business. A number of initiatives have been recognised externally
with nominations or awards being gained. SSP recognises that CSR is a process of continuous improvement as we
continue to minimise the impact on the environment and look to positively affect the communities we work within.
Our CSR strategy is based on ensuring that we effectively manage the environmental and social issues which are
material to the Group and to each SSP business unit. We recognise that good environmental management also makes
good business sense, and are committed to reducing the environmental impact of our business. We are currently
trialling a number of potential new energy efficiency solutions, which if successful will be rolled out more widely in
the year ahead. We are also looking hard at the levels of waste within our business, and have recently put in place a
variety of new waste reduction initiatives across the Group.
As mentioned earlier in this report, customer service standards remain a key focus for our business. We review our
performance through our Mystery Customer programme, which gives us immediate, actionable feedback on areas
such as friendliness and helpfulness of staff, time spent queuing and store cleanliness and tidiness. We take seriously
the responsibility for the products we sell, and are committed to maintaining high standards of health and safety
across our business.
We are committed to good labour standards and respecting the environment in our supply chain. Although the
Group does not follow any code or standard on payment practice, it agrees payment terms with its suppliers as part
of its normal purchasing negotiations, and abides by these terms where the conditions of supply have been met.
Trade creditors
At 30 September 2013, the average number of days purchases outstanding between the Group and its trade creditors
was 48 days (2012: 46 days). The Company has no trade creditors (2012: nil).
Financial risk management
The financial risk management objectives and policies are discussed on page 7 in the Strategic report.
SSP Group Limited
Annual Report and Financial Statements (Registered number: 05735966)
30 September 2013
9
Directors’ report (continued)
Proposed dividend
The directors do not recommend the payment of an ordinary dividend (2012: £nil).
Going concern
As further detailed in Note 1, these financial statements have been prepared on a going concern basis, in support of
which the Board have reviewed the Group’s trading forecasts for the next twelve months. These forecasts, which
include detailed cash flow projections, comprise detailed assumptions as to sales and profit performance by division
and by month and take account of the normal seasonality profile of the business. As a result, the directors are
confident that the assumptions underlying their forecasts are reasonable and that the Group will be able to operate
within its banking covenants and available liquidity headroom.
Accordingly, the directors believe that it is appropriate to prepare these financial statements on a going concern
basis.
Market value of land and buildings
In the opinion of the directors, there is no material difference between the market value and the book value of land
and buildings at 30 September 2013.
Political and charitable contributions
The Group made no political contributions during the year. Donations to UK charities amounted to £20,531 (2012:
£21,290).
Disclosure of information to auditors
The directors who held office at the date of approval of this directors’ report confirm that, so far as they are each
aware, there is no relevant audit information of which the Company’s auditors are unaware; and each director has
taken all the steps that he ought to have taken as a director to make himself aware of any relevant audit information
and to establish that the Company’s auditors are aware of that information.
Auditors
Pursuant to Section 487 of the Companies Act 2006, the auditors will be deemed to be reappointed and KPMG LLP
will therefore continue in office.
By order of the board
Jonathan Davies
Secretary
20 December 2013

SSP Group Limited
Annual Report and Financial Statements (Registered number: 05735966)
30 September 2013
10
Statement of directors’ responsibilities in respect of the directors’ report and the
financial statements
The directors are responsible for preparing the directors’ report and the Group and parent company financial
statements in accordance with applicable law and regulations.
Company law requires the directors to prepare Group and parent company financial statements for each financial
year. Under that law they have elected to prepare the Group financial statements in accordance with IFRSs as
adopted by the EU and applicable law and have elected to prepare the parent company financial statements in
accordance with UK Accounting Standards and applicable law (UK Generally Accepted Accounting Practice).
Under company law the directors must not approve the financial statements unless they are satisfied that they give a
true and fair view of the state of affairs of the Group and parent company and of their profit or loss for that period.
In preparing each of the Group and parent company financial statements, the directors are required to:
select suitable accounting policies and then apply them consistently;
make judgements and estimates that are reasonable and prudent;
for the Group financial statements, state whether they have been prepared in accordance with IFRSs as
adopted by the EU;
for the parent company financial statements, state whether applicable UK Accounting Standards have been
followed, subject to any material departures disclosed and explained in the financial statements; and
prepare the financial statements on the going concern basis unless it is inappropriate to presume that the
Group and the parent company will continue in business.
The directors are responsible for keeping adequate accounting records that are sufficient to show and explain the
parent company’s transactions and disclose with reasonable accuracy at any time the financial position of the parent
company and enable them to ensure that its financial statements comply with the Companies Act 2006. They have
general responsibility for taking such steps as are reasonably open to them to safeguard the assets of the Group and
to prevent and detect fraud and other irregularities.

11
Independent auditor’s report to the members of SSP Group Limited We have audited the financial statements of SSP Group Limited for the year ended 30 September 2013 set out on
pages 12 to 57. The financial reporting framework that has been applied in the preparation of the Group financial
statements is applicable law and International Financial Reporting Standards (IFRSs) as adopted by the EU. The
financial reporting framework that has been applied in the preparation of the parent company financial statements
is applicable law and UK Accounting Standards (UK Generally Accepted Accounting Practice).
This report is made solely to the Company’s members, as a body, in accordance with Chapter 3 of Part 16 of the
Companies Act 2006. Our audit work has been undertaken so that we might state to the Company’s members
those matters we are required to state to them in an auditor’s report and for no other purpose. To the fullest
extent permitted by law, we do not accept or assume responsibility to anyone other than the Company and the
Company’s members, as a body, for our audit work, for this report, or for the opinions we have formed.
Respective responsibilities of directors and auditor
As explained more fully in the directors’ responsibilities statement set out on page 10, the directors are
responsible for the preparation of the financial statements and for being satisfied that they give a true and fair
view. Our responsibility is to audit, and express an opinion on, the financial statements in accordance with
applicable law and International Standards on Auditing (UK and Ireland). Those standards require us to comply
with the Auditing Practices Board’s Ethical Standards for Auditors.
Scope of the audit of the financial statements
A description of the scope of an audit of financial statements is provided on the Financial Reporting Council’s
website at www.frc.org.uk/auditscopeukprivate.
Opinion on financial statements
In our opinion:
the financial statements give a true and fair view of the state of the Group’s and of the parent company’s
affairs as at 30 September 2013 and of the Group’s profit for the year then ended;
the Group financial statements have been properly prepared in accordance with IFRSs as adopted by the EU;
the parent company financial statements have been properly prepared in accordance with UK Generally
Accepted Accounting Practice;
the financial statements have been prepared in accordance with the requirements of the Companies Act
2006.
Opinion on other matter prescribed by the Companies Act 2006
In our opinion the information given in the directors’ report for the financial year for which the financial
statements are prepared is consistent with the financial statements.
Matters on which we are required to report by exception
We have nothing to report in respect of the following matters where the Companies Act 2006 requires us to
report to you if, in our opinion:
adequate accounting records have not been kept by the parent company, or returns adequate for our audit
have not been received from branches not visited by us; or
the parent company financial statements are not in agreement with the accounting records and returns; or
certain disclosures of directors’ remuneration specified by law are not made; or
we have not received all the information and explanations we require for our audit.
Tudor Aw (Senior Statutory Auditor)
for and on behalf of KPMG LLP, Statutory Auditor
Chartered Accountants
15 Canada Square, Canary Wharf
London
E14 5GL
United Kingdom
20 December 2013
SSP Group Limited
Annual Report and Financial Statements (Registered number: 05735966)
30 September 2013
12
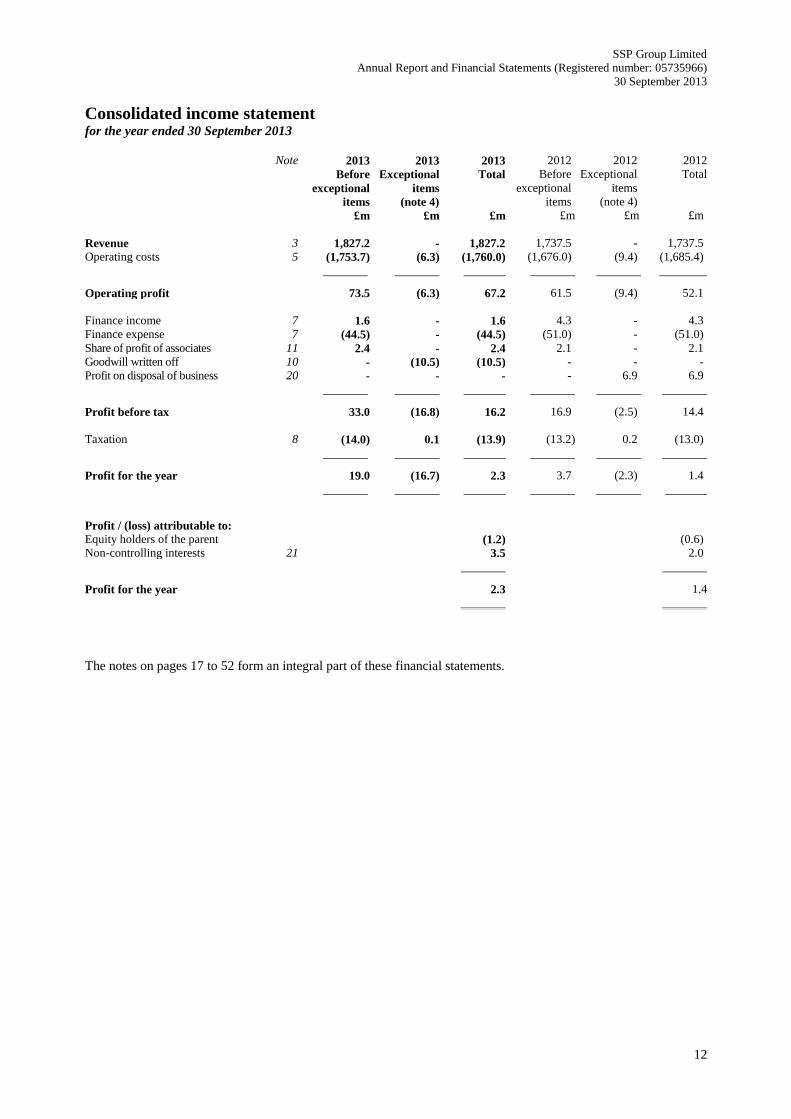
Consolidated income statement for the year ended 30 September 2013
Note 2013
Before
exceptional
items
2013
Exceptional
items
(note 4)
2013
Total
2012
Before
exceptional
items
2012
Exceptional
items
(note 4)
2012
Total
£m £m £m £m £m £m
Revenue 3 1,827.2 - 1,827.2 1,737.5 - 1,737.5
Operating costs 5 (1,753.7) (6.3) (1,760.0) (1,676.0) (9.4) (1,685.4)
Operating profit 73.5 (6.3) 67.2 61.5 (9.4) 52.1
Finance income 7 1.6 - 1.6 4.3 - 4.3
Finance expense 7 (44.5) - (44.5) (51.0) - (51.0)
Share of profit of associates 11 2.4 - 2.4 2.1 - 2.1
Goodwill written off 10 - (10.5) (10.5) - - -
Profit on disposal of business 20 - - - - 6.9 6.9
Profit before tax 33.0 (16.8) 16.2 16.9 (2.5) 14.4
Taxation 8 (14.0) 0.1 (13.9) (13.2) 0.2 (13.0)
Profit for the year 19.0 (16.7) 2.3 3.7 (2.3) 1.4
Profit / (loss) attributable to:
Equity holders of the parent (1.2) (0.6)
Non-controlling interests 21 3.5 2.0
Profit for the year 2.3 1.4
The notes on pages 17 to 52 form an integral part of these financial statements.

SSP Group Limited
Annual Report and Financial Statements (Registered number: 05735966)
30 September 2013
13
Consolidated statement of other comprehensive income for the year ended 30 September 2013
Note 2013 2012
£m £m
Other comprehensive income, net of tax
Items that will never be reclassified to the income statement
Actuarial losses on defined benefit pension schemes 18 (1.1) (4.3)
Items that are or may be reclassified subsequently to the income statement
Net (loss)/gain on hedge of net investment in foreign operations (9.0) 20.5
Other foreign exchange translation differences (6.8) (8.0)
Effective portion of changes in fair value of cash flow hedges 6.7 6.9
Other comprehensive income for the year (10.2) 15.1
Profit for the year 2.3 1.4
Total comprehensive income for the year (7.9) 16.5
Total comprehensive income attributable to:
Equity holders of the parent (11.4) 14.5
Non-controlling interests 21 3.5 2.0
Total comprehensive income for the year (7.9) 16.5

SSP Group Limited
Annual Report and Financial Statements (Registered number: 05735966)
30 September 2013
14
Consolidated balance sheet As at 30 September 2013
Note
2013
2012
£m £m
Non-current assets
Property, plant and equipment 9 210.0 194.3
Goodwill and intangible assets 10 694.8 705.5
Investments in associates 11 5.3 5.2
Deferred tax assets 12 3.0 2.2
Other receivables 14 24.2 19.3
937.3 926.5
Current assets
Inventories 13 24.8 24.7
Tax receivable 0.2 0.5
Trade and other receivables 14 86.7 89.7
Cash and cash equivalents 15 182.1 162.2
293.8 277.1
Total assets 1,231.1 1,203.6
Current liabilities
Short term borrowings 16 (1.4) (4.7)
Trade and other payables 17 (321.5) (303.6)
Tax payable (12.5) (9.7)
(335.4) (318.0)
Non-current liabilities
Long term borrowings 16 (1,051.1) (1,032.6)
Other payables 17 (0.4) (1.0)
Post employment benefit obligations 18 (15.0) (13.9)
Provisions 19 (12.8) (12.0)
Derivative financial liabilities 23 (5.4) (12.6)
Deferred tax liabilities 12 (6.1) (6.9)
(1,090.8) (1,079.0)
Total liabilities (1,426.2) (1,397.0)
Net liabilities (195.1) (193.4)
Equity
Share capital 21 5.4 5.4
Share premium 21 642.9 642.8
Translation reserves 21 (0.3) 15.5
Cash flow hedging reserves 21 (5.3) (12.0)
Retained earnings 21 (857.6) (855.3)
Total equity shareholders funds (214.9) (203.6)
Non-controlling interests 21 19.8 10.2
Total equity (195.1) (193.4)
The notes on pages 17 to 52 form an integral part of these financial statements.
These financial statements were approved by the board of directors on 20 December 2013 and were signed on its
behalf by:
Vagn Soerensen Date: 20 December 2013
Director

SSP Group Limited
Annual Report and Financial Statements (Registered number: 05735966)
30 September 2013
15
Consolidated statement of changes in equity for the year ended 30 September 2013
Share
capital
Share
premium
Translation
reserve
Cash flow
hedging
reserve
Retained
earnings
Total
parent
equity
Non-
controlling
interests
Total
equity
£m £m £m £m £m £m £m £m
At 1 October 2011 5.4 642.8 3.0 (18.9) (850.4) (218.1) 8.5 (209.6)
(Loss) / profit for the year - - - - (0.6) (0.6) 2.0 1.4
Net gain on hedge of net investment
in foreign operations
-
-
20.5
-
-
20.5
-
20.5
Other foreign exchange translation
differences
-
-
(8.0)
-
-
(8.0)
(0.6)
(8.6)
Effective portion of changes in
fair value of cash flow hedges
-
-
-
6.9
-
6.9
-
6.9
Dividends paid to minorities - - - - - - (1.9) (1.9)
Capital contribution from minorities - - - - - - 2.2 2.2
Actuarial gains on defined benefit
pension schemes
-
-
-
-
(4.3)
(4.3)
-
(4.3)
At 30 September 2012 5.4 642.8 15.5 (12.0) (855.3) (203.6) 10.2 (193.4)
(Loss) / profit for the year - - - - (1.2) (1.2) 3.5 2.3
Net loss on hedge of net investment
in foreign operations
-
-
(9.0)
-
-
(9.0)
-
(9.0)
Other foreign exchange translation
differences
-
-
(6.8)
-
-
(6.8)
(0.2)
(7.0)
Effective portion of changes in
fair value of cash flow hedges
-
-
-
6.7
-
6.7
-
6.7
Dividends paid to minorities - - - - - - (2.5) (2.5)
Capital contribution from minorities - - - - - - 8.8 8.8
Actuarial losses on defined benefit
pension schemes
-
-
-
-
(1.1)
(1.1)
-
(1.1)
Premium on shares issued in year - 0.1 - - - 0.1 - 0.1
At 30 September 2013 5.4 642.9 (0.3) (5.3) (857.6) (214.9) 19.8 (195.1)
SSP Group Limited
Annual Report and Financial Statements (Registered number: 05735966)
30 September 2013
16
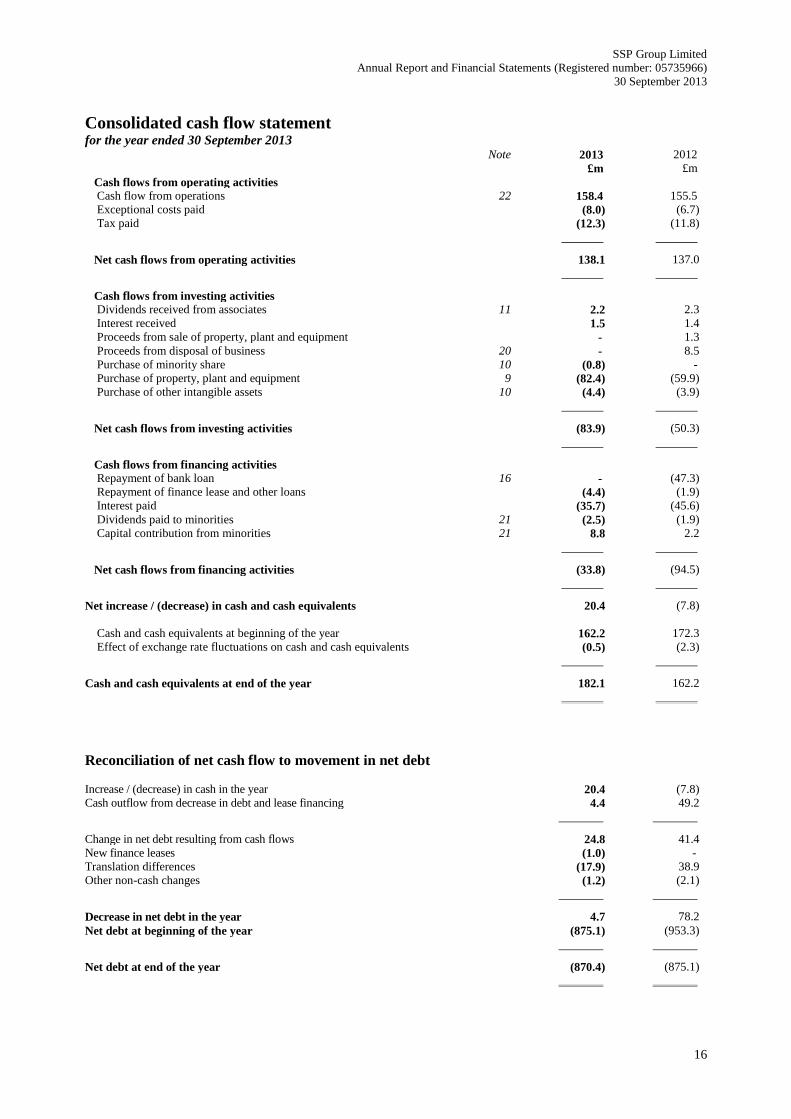
Consolidated cash flow statement for the year ended 30 September 2013
Note 2013 2012
£m £m
Cash flows from operating activities
Cash flow from operations 22 158.4 155.5
Exceptional costs paid (8.0) (6.7)
Tax paid (12.3) (11.8)
Net cash flows from operating activities 138.1 137.0
Cash flows from investing activities
Dividends received from associates 11 2.2 2.3
Interest received 1.5 1.4
Proceeds from sale of property, plant and equipment - 1.3
Proceeds from disposal of business 20 - 8.5
Purchase of minority share 10 (0.8) -
Purchase of property, plant and equipment 9 (82.4) (59.9)
Purchase of other intangible assets 10 (4.4) (3.9)
Net cash flows from investing activities (83.9) (50.3)
Cash flows from financing activities
Repayment of bank loan 16 - (47.3)
Repayment of finance lease and other loans (4.4) (1.9)
Interest paid (35.7) (45.6)
Dividends paid to minorities 21 (2.5) (1.9)
Capital contribution from minorities 21 8.8 2.2
Net cash flows from financing activities (33.8) (94.5)
Net increase / (decrease) in cash and cash equivalents 20.4 (7.8)
Cash and cash equivalents at beginning of the year 162.2 172.3
Effect of exchange rate fluctuations on cash and cash equivalents (0.5) (2.3)
Cash and cash equivalents at end of the year 182.1 162.2
Reconciliation of net cash flow to movement in net debt
Increase / (decrease) in cash in the year 20.4 (7.8)
Cash outflow from decrease in debt and lease financing 4.4 49.2
Change in net debt resulting from cash flows 24.8 41.4
New finance leases (1.0) -
Translation differences (17.9) 38.9
Other non-cash changes (1.2) (2.1)
Decrease in net debt in the year 4.7 78.2
Net debt at beginning of the year (875.1) (953.3)
Net debt at end of the year (870.4) (875.1)
SSP Group Limited
Annual Report and Financial Statements (Registered number: 05735966)
30 September 2013
17
Notes to consolidated financial statements
1 Accounting policies
SSP Group Limited (the “Company”) is a company incorporated in the UK. The Group financial statements
consolidate those of the Company and its subsidiaries (together referred to as the “Group”) and equity account the
Group’s interest in associates. The parent company financial statements present information about the Company as
a separate entity and not about the Group.
The Group financial statements have been prepared and approved by the directors in accordance with International
Financial Reporting Standards as adopted by the EU (“IFRS”). The Company has elected to prepare its parent
company financial statements in accordance with UK GAAP; these are presented on pages 53 to 57.
There financial statements are presented in Sterling which is the Company’s functional currency. All information is
given to the nearest million.
The financial statements are prepared on the historical cost basis except for the derivative financial instruments
which are stated at their fair value.
The accounting policies set out below have, unless otherwise stated, been applied consistently to all periods
presented in these Group financial statements.
1.1 Going concern
As highlighted in the directors’ report on page 9, these financial statements have been prepared on a going concern
basis, in support of which the Board have reviewed the Group’s trading forecasts for the next twelve months. These
forecasts, which include detailed cash flow projections, comprise assumptions as to sales and profit performance by
division and by month and take account of the normal seasonality profile of the business. As a result, the directors
are confident that the assumptions underlying their forecasts are reasonable and that the Group will be able to
operate within its banking covenants and available liquidity headroom.
Notwithstanding the above however, there remains a risk that a further downturn in the global economy could result
in passenger numbers and consumer spending in the travel market which are worse than the Board is currently
envisaging. As a result, the directors have also reviewed forecasts which include sensitivities that make allowance
for this risk. Should such a scenario arise the directors are confident they have adequate liquidity and covenant head
room to ensure that the Group can meet its liabilities as they fall due for the foreseeable future.
Accordingly, the directors believe that it is appropriate to prepare these financial statements on a going concern
basis.
1.2 Basis of consolidation
All intercompany balances and transactions, including unrealised profits and losses arising from intra-group
transactions have been eliminated in full.
Subsidiaries
Subsidiaries are entities controlled by the Group. Control exists when the Group has the power to govern the
financial and operating policies of an entity so as to obtain benefits from its activities. In assessing control, the
Group takes into consideration potential voting rights that are currently exercisable. The acquisition date is the date
on which control is transferred to the acquirer. The financial statements of subsidiaries are included in the
consolidated financial statements from the date that control commences until the date that control ceases. Losses
applicable to the non-controlling interests in a subsidiary are allocated to the non-controlling interests even if doing
so causes the non-controlling interests to have a deficit balance.
SSP Group Limited
Annual Report and Financial Statements (Registered number: 05735966)
30 September 2013
18
Notes to consolidated financial statements (continued)
1 Accounting policies (continued)
1.2 Basis of consolidation (continued)
Associates and jointly controlled entities
Associates are those entities in which the Group has significant influence, but not control, over the financial and
operating policies. Significant influence is presumed to exist when the Group holds between 20 and 50 percent of
the voting power of another entity. Jointly controlled entities are those entities over whose activities the Group has
joint control, established by contractual agreement and requiring the venturers’ unanimous consent for strategic
financial and operating decisions. Associates and jointly controlled entities are accounted for using the equity
method and are initially recognised at cost. The Group’s investment includes goodwill identified on acquisition, net
of any accumulated impairment losses. The consolidated financial statements include the Group’s share of the total
comprehensive income and equity movements of equity accounted investees, from the date that significant influence
or joint control commences until the date that significant influence or joint control ceases. When the Group’s share
of losses exceeds its interest in an equity accounted investee, the Group’s carrying amount is reduced to nil and
recognition of further losses is discontinued except to the extent that the Group has incurred legal or constructive
obligations or made payments on behalf of an investee.
1.3 Foreign currency
Transactions in foreign currencies are translated to the respective functional currencies of Group entities at the
foreign exchange rate ruling at the date of the transaction. Monetary assets and liabilities denominated in foreign
currencies at the balance sheet date are retranslated to the functional currency at the foreign exchange rate ruling at
that date. Foreign exchange differences arising on translation are recognised in the income statement except for
differences arising on the retranslation of a financial liability designated as a hedge of the net investment in a foreign
operation that is effective, or qualifying cash flow hedges, which are recognised directly in other comprehensive
income. Non-monetary assets and liabilities that are measured in terms of historical cost in a foreign currency are
translated using the exchange rate at the date of the transaction.
The assets and liabilities of foreign operations, including goodwill and fair value adjustments arising on
consolidation, are translated to the Group’s presentation currency, Sterling, at foreign exchange rates ruling at the
balance sheet date. The revenues and expenses of foreign operations are translated at an average rate for the year
where this rate approximates to the foreign exchange rates ruling at the dates of the transactions.
Exchange differences arising from this translation of foreign operations are reported as an item of other
comprehensive income and accumulated in the translation reserve or non-controlling interest, as the case may be.
When a foreign operation is disposed of, such that control, joint control or significant influence (as the case may be)
is lost, the entire accumulated amount in the foreign currency translation reserve, net of amounts previously
attributed to non-controlling interests, is recycled to profit or loss as part of the gain or loss on disposal. When the
Group disposes of only part of its interest in a subsidiary that includes a foreign operation while still retaining
control, the relevant proportion of the accumulated amount is reattributed to non-controlling interests. When the
Group disposes of only part of its investment in an associate or joint venture that includes a foreign operation while
still retaining significant influence or joint control, the relevant proportion of the cumulative amount is recycled to
profit or loss.
Exchange differences arising from a monetary item receivable from or payable to a foreign operation, the settlement
of which is neither planned nor likely in the foreseeable future, are considered to form part of a net investment in a
foreign operation and are recognised directly in equity in the translation reserve. Foreign currency differences
arising on the retranslation of a hedge of a net investment in a foreign operation are recognised directly in equity, in
the translation reserve, to the extent that the hedge is effective. When the hedged part of a net investment is disposed
of, the associated cumulative amount in equity is recycled to profit or loss as an adjustment to the profit or loss on
disposal.
SSP Group Limited
Annual Report and Financial Statements (Registered number: 05735966)
30 September 2013
19
Notes to consolidated financial statements (continued)
1 Accounting policies (continued)
1.4 Classification of financial instruments issued by the Group
Financial instruments issued by the Group are treated as equity only to the extent that they meet the following two
conditions:
(a) they include no contractual obligations upon the group to deliver cash or other financial assets or to
exchange financial assets or financial liabilities with another party under conditions that are potentially
unfavourable to the Group; and
(b) where the instrument will or may be settled in the company’s own equity instruments, it is either a non-
derivative that includes no obligation to deliver a variable number of the company’s own equity
instruments or is a derivative that will be settled by the company exchanging a fixed amount of cash or
other financial assets for a fixed number of its own equity instruments.
To the extent that this definition is not met, the proceeds of issue are classified as a financial liability.
1.5 Non-derivative financial instruments
Non-derivative financial instruments comprise investments in equity and debt securities, trade and other receivables,
cash and cash equivalents, loans and borrowings, and trade and other payables.
Trade and other receivables
Trade and other receivables are recognised initially at fair value. Subsequent to initial recognition they are
measured at amortised cost using the effective interest method, less any impairment losses.
Trade and other payables
Trade and other payables are recognised initially at fair value. Subsequent to initial recognition they are measured
at amortised cost using the effective interest method.
Cash and cash equivalents
Cash and cash equivalents comprise cash balances and call deposits. Bank overdrafts that are repayable on demand
and form an integral part of the Group’s cash management are included as a component of cash and cash
equivalents.
Interest-bearing borrowings
Interest-bearing borrowings are recognised initially at fair value less attributable transaction costs. Subsequent to
initial recognition, interest-bearing borrowings are stated at amortised cost using the effective interest method, less
any impairment losses.
SSP Group Limited
Annual Report and Financial Statements (Registered number: 05735966)
30 September 2013
20
Notes to consolidated financial statements (continued)
1 Accounting policies (continued)
1.6 Derivative financial instruments and hedging
Derivative financial instruments
Derivative financial instruments are recognised at fair value. The gain or loss on remeasurement to fair value is
recognised immediately in the income statement. However, where derivatives qualify for hedge accounting,
recognition of any resultant gain or loss depends on the nature of the item being hedged (see below).
Cash flow hedges
Where a derivative financial instrument is designated as a hedge of the variability in cash flows of a recognised asset
or liability, or a highly probable forecast transaction, the effective part of any gain or loss on the derivative financial
instrument is recognised directly in the hedging reserve. Any ineffective portion of the hedge is recognised
immediately in the income statement.
If a hedge of a forecast transaction subsequently results in the recognition of a financial asset or a financial liability,
the associated gains and losses that were recognised directly in equity are recycled into profit or loss in the same
period or periods during which the asset acquired or liability assumed affects profit or loss, i.e. when interest income
or expense is recognised.
For cash flow hedges, other than those covered by the preceding two policy statements, the associated cumulative
gain or loss is removed from equity and recognised in the income statement in the same period or periods during
which the hedged forecast transaction affects profit or loss.
Fair value hedges
Where a derivative financial instrument is designated as a hedge of the variability in fair value of a recognised asset
or liability or an unrecognised firm commitment, all changes in the fair value of the derivative are recognised
immediately in the income statement. The carrying value of the hedged item is adjusted by the change in fair value
that is attributable to the risk being hedged (even if it is normally carried at cost or amortised cost) and any gains or
losses on remeasurement are recognised immediately in the income statement (even if those gains would normally
be recognised directly in reserves).
1.7 Property, plant and equipment
Property, plant and equipment are stated at cost less accumulated depreciation and accumulated impairment losses.
Where parts of an item of property, plant and equipment have different useful lives, they are accounted for as
separate items of property, plant and equipment.
Leases in which the Group assumes substantially all the risks and rewards of ownership of the leased asset are
classified as finance leases. Leased assets acquired by way of finance lease are stated at an amount equal to the
lower of their fair value and the present value of the minimum lease payments at inception of the lease, less
accumulated depreciation and accumulated impairment losses.
Depreciation is charged to the income statement on a straight-line basis over the estimated useful lives of each part
of an item of property, plant and equipment. Land is not depreciated. The estimated useful lives are as follows:
● Freehold buildings 2% per annum
● Leasehold land and buildings the life of the lease
● Plant and machinery 8% to 33% per annum
● Fixtures, fittings, tools and equipment 8% to 33% per annum
SSP Group Limited
Annual Report and Financial Statements (Registered number: 05735966)
30 September 2013
21
Notes to consolidated financial statements (continued)
1 Accounting policies (continued)
1.8 Business combinations
Subject to the transitional relief in IFRS 1, all business combinations are accounted for by applying the acquisition
method. Business combinations are accounted for using the acquisition method as at the acquisition date, which is
the date at which control is transferred to the Group.
1.9 Acquisitions and disposals of non-controlling interests
Acquisitions and disposals of non-controlling interests that do not result in a change of control are accounted for as
transactions with owners in their capacity as owners and therefore no goodwill is recognised as a result of such
transactions. The adjustments to non-controlling interests are based on a proportionate amount of the net assets of
the subsidiary. Any difference between the price paid or received and the amount by which non-controlling interests
are adjusted is recognised directly in equity and attributed to the owners of the parent.
1.10 Goodwill and intangible assets
Goodwill
Goodwill is allocated to cash-generating units and is not amortised but is tested annually for impairment. Goodwill
is stated at cost less any accumulated impairment losses.
Other intangible assets
Expenditure on internally generated goodwill and brands is recognised in the income statement as an expense as
incurred.
Other intangible assets that are acquired by the Group are stated at cost less accumulated amortisation and
accumulated impairment losses.
Amortisation
Amortisation is charged to the income statement on a straight-line basis over the estimated useful lives of intangible
assets unless such lives are indefinite. Intangible assets with an indefinite useful life and goodwill are systematically
tested for impairment at each balance sheet date. Other intangible assets are amortised from the date they are
available for use.
1.11 Inventories
Inventories comprise goods purchased for resale and consumable stores and are stated at the lower of cost and net
realisable value.
1.12 Impairment excluding inventories and deferred tax assets
Financial assets (including receivables)
A financial asset not carried at fair value through profit or loss is assessed at each reporting date to determine
whether there is objective evidence that it is impaired. A financial asset is impaired if objective evidence indicates
that a loss event has occurred after the initial recognition of the asset, and that the loss event has had a negative
effect on the estimated future cash flows of that asset that can be estimated reliably.

SSP Group Limited
Annual Report and Financial Statements (Registered number: 05735966)
30 September 2013
22
Notes to consolidated financial statements (continued)
1 Accounting policies (continued)
1.12 Impairment excluding inventories and deferred tax assets (continued)
An impairment loss in respect of a financial asset measured at amortised cost is calculated as the difference between
its carrying amount and the present value of the estimated future cash flows discounted at the asset’s original
effective interest rate. Interest on the impaired asset continues to be recognised through the unwinding of the
discount. When a subsequent event causes the amount of impairment loss to decrease, the decrease in impairment
loss is reversed through the income statement.
Non-financial assets
The carrying amounts of the Group’s non-financial assets, other than inventories and deferred tax assets, are
reviewed at each reporting date to determine whether there is any indication of impairment. If any such indication
exists, then the asset’s recoverable amount is estimated. For goodwill, and intangible assets that have indefinite
useful lives or that are not yet available for use, the recoverable amount is estimated each year at the same time.
The recoverable amount of an asset or cash-generating unit is the greater of its value in use and its fair value less
costs to sell. For the purpose of impairment testing, assets that cannot be tested individually are grouped together
into the smallest group of assets that generates cash inflows from continuing use that are largely independent of the
cash inflows of other assets or groups of assets (or “CGU”). The goodwill acquired in a business combination, for
the purpose of impairment testing, is allocated to cash-generating units (or “CGUs”). Subject to an operating
segment ceiling test, for the purposes of goodwill impairment testing, CGUs to which goodwill has been allocated
are aggregated so that the level at which impairment is tested reflects the lowest level at which goodwill is
monitored for internal reporting purposes. Goodwill acquired in a business combination is allocated to groups of
CGUs that are expected to benefit from the synergies of the combination.
An impairment loss is recognised if the carrying amount of an asset or its CGU exceeds its estimated recoverable
amount. Impairment losses are recognised in the income statement. Impairment losses recognised in respect of
CGUs are allocated first to reduce the carrying amount of any goodwill allocated to the units, and then to reduce the
carrying amounts of the other assets in the unit (group of units) on a pro rata basis.
1.13 Employee benefits
Defined benefit plans
A defined benefit plan is a post employment benefit plan other than a defined contribution plan. The Group’s
liabilities in respect of defined benefit schemes are calculated for each scheme individually, by deducting the value
of the scheme’s assets from its obligations. Pension scheme assets are measured using market values. Pension
scheme liabilities are measured using a projected unit method and discounted at the current rate of return on a high
quality corporate bond of equivalent term and currency to the liability.
The pension scheme surplus (to the extent that it is recoverable) or deficit is recognised in full. The movement in
the scheme surplus/deficit is split between operating charges, finance items and, in other comprehensive income,
actuarial gains and losses.
Defined contribution plans
A defined contribution plan is a post employment benefit plan under which the company pays fixed contributions
into a separate entity and will have no legal or constructive obligation to pay further amounts. Obligations for
contributions to defined contribution pension plans are recognised as an expense in the income statement in the
periods during which services are rendered by employees.
Short term benefits
Short term employee benefit obligations are measured on an undiscounted basis and are expensed as the related
service is provided. A liability is recognised for the amount expected to be paid under short term cash bonus if the
Group has a present legal or constructive obligation to pay this amount as a result of past service provided by the
employee and the obligation can be estimated reliably.

SSP Group Limited
Annual Report and Financial Statements (Registered number: 05735966)
30 September 2013
23
Notes to consolidated financial statements (continued)
1 Accounting policies (continued)
1.14 Provisions
A provision is recognised in the balance sheet when the Group has a present legal or constructive obligation as a
result of a past event, that can be reliably measured and it is probable that an outflow of economic benefits will be
required to settle the obligation. Provisions are determined by discounting the expected future cash flows at a rate
that reflects risks specific to the liability.
1.15 Segment information
Segment information is provided based on the geographical segments which are reviewed by the chief operating
decision maker. These operating segments are aggregated if they meet certain criteria. Segment results include items
directly attributable to a segment as well as those that can be allocated on a reasonable basis. Unallocated items
comprise mainly head office expenses, finance income, finance charges and income tax. No disclosure is made for
net assets / liabilities as these are not reported by segment to the chief operating decision maker.
1.16 Revenue
Turnover represents amounts for retail goods and catering services supplied to third parties excluding value added
tax and similar sales taxes. Turnover is recognised at the time of sale of retail goods or in the period in which
services are provided.
1.17 Lease payments
Operating lease payments
Payments made under operating leases are recognised in the income statement on a straight-line basis over the term
of the lease. Lease incentives received are recognised in the income statement as an integral part of the total lease
expense.
Finance lease payments
Minimum lease payments are apportioned between the finance charge and the reduction of the outstanding liability.
The finance charge is allocated to each period during the lease term so as to produce a constant periodic rate of
interest on the remaining balance of the liability.
1.18 Finance income and expenses
Interest income and interest expenses are recognised in the income statement as they accrue, using the effective
interest method. Dividend income is recognised in the income statement on the date the entity’s right to receive
payment is established. Foreign currency gains and losses are reported on a net basis.
Financing expense comprises interest payable, finance charges on shares classified as liabilities, finance lease
charges recognised in the income statement using the effective interest method, the unwinding of the discount on
provisions, and net foreign exchange losses that are recognised in the income statement. Financing income
comprises interest receivable on funds invested, dividend income, and net foreign exchange gains.
1.19 Taxation
Tax on the profit or loss for the year comprises current and deferred tax. Tax is recognised in the income statement
except to the extent that it relates to items recognised directly in equity, in which case it is recognised in equity.
Current tax is the expected tax payable or receivable on the taxable income or loss for the year, using tax rates
enacted or substantively enacted at the balance sheet date, and any adjustment to tax payable in respect of previous
years.

SSP Group Limited
Annual Report and Financial Statements (Registered number: 05735966)
30 September 2013
24
Notes to consolidated financial statements (continued)
1 Accounting policies (continued)
1.19 Taxation (continued)
Deferred tax is provided on temporary differences between the carrying amounts of assets and liabilities for financial
reporting purposes and the amounts used for taxation purposes. No provision is made for the following temporary
differences: the initial recognition of goodwill; the initial recognition of assets or liabilities that affect neither
accounting nor taxable profit other than in a business combination; and differences relating to investments in
subsidiaries to the extent that they will probably not reverse in the foreseeable future. The amount of deferred tax
provided is based on the expected manner of realisation or settlement of the carrying amount of assets and liabilities,
using tax rates enacted or substantively enacted at the balance sheet date.
A deferred tax asset is recognised only to the extent that it is probable that future taxable profits will be available
against which the temporary difference can be utilised.
1.20 IFRS not yet applied
The following EU endorsed IFRS have been issued but have not been adopted early by the Group in these financial
statements. Their adoption is not expected to have a material effect on the financial statements unless otherwise
indicated:
● Amendments to IAS 19 – Defined benefit plans
● IFRS 13 – Fair value measurement
2 Accounting estimates and judgements
The preparation of the consolidated financial statements requires management to make estimates, judgments and
assumptions concerning the future. The resulting accounting estimates will, by definition, seldom equal the related
actual results. These estimates and assumptions are based on historical experience and other factors that are believed to
be reasonable under the circumstances. The estimates and assumptions that have a significant risk of causing a material
adjustment to the carrying value of assets and liabilities within the next financial year are discussed below.
Goodwill and intangible assets
The Group recognises goodwill and intangible assets which have arisen through acquisitions. These assets are subject
to impairment reviews to ensure that the assets are not carried above their recoverable amounts. For goodwill and
indefinite life intangible assets, reviews are performed annually. For other intangible assets, reviews are performed if
events or circumstances indicate that this is necessary.
The recoverable amounts of CGUs or group of CGUs have been determined based on value in use calculations. These
calculations require the use of estimates and assumptions consistent with the most up-to-date budgets and plans that
have been formally approved by the Board. The key assumptions used for the value in use calculations are set out in
note 10 to the financial statements.
Post employment benefit obligations
Defined benefit schemes are valued in accordance with IAS 19 and are updated annually by independent actuaries
based on actuarial assumptions. Significant judgment is required in determining these actuarial assumptions. The
major assumptions used are described in note 18 to these financial statements.

SSP Group Limited
Annual Report and Financial Statements (Registered number: 05735966)
30 September 2013
25
Notes to consolidated financial statements (continued)
3 Segmental reporting
SSP operates in the food and beverage travel concession sector, mainly at airports and railway stations.
The Group has determined its reportable operating segments based on the reports, reviewed by the executive
management, that are used to make strategic decisions. Management monitors the performance and strategic priorities
of the business from a geographic perspective, and in this regard has identified the following three key ‘reportable
segments’: UK, Continental Europe and Rest of the World (‘RoW’). UK includes operations in the United Kingdom
and the Republic of Ireland, RoW includes operations in Eastern Europe, Middle East, Asia Pacific and North America.
The executive management assesses the performance of the operating segments based on a measure of revenue,
EBITDA and operating profit. Interest income and expenditure are not allocated to segments, as this type of activity is
driven by a central treasury function, which manages the debt and liquidity position of the Group.
Revenue is measured in a manner consistent with that in the income statement.
2013
UK
Continental
Europe
RoW
Non-
attributable Total
£m £m £m £m £m
Total revenue 709.0 833.9 284.3 - 1,827.2
EBITDA 58.0 83.8 28.4 (17.5) 152.7
Depreciation and amortisation (28.6) (30.2) (16.2) (4.2) (79.2)
Exceptional costs (0.5) (1.5) (0.1) (4.2) (6.3)
Operating profit 28.9 52.1 12.1 (25.9) 67.2
Non-current assets (property, plant and equipment,
goodwill and intangible assets) 293.8 459.5 144.1 7.4 904.8
2012
UK
Continental
Europe
RoW
Non-
attributable Total
£m £m £m £m £m
Total revenue 681.8 794.4 261.3 - 1,737.5
EBITDA 54.1 74.2 26.0 (15.2) 139.1
Depreciation and amortisation (35.7) (24.8) (15.3) (1.8) (77.6)
Exceptional costs (3.9) (2.9) (0.8) (1.8) (9.4)
Operating profit 14.5 46.5 9.9 (18.8) 52.1
Non-current assets (property, plant and equipment,
goodwill and intangible assets)
310.1
451.2
132.8
5.7
899.8
Disclosure in relation to net assets and liabilities for each reportable segment is not provided as these are only
reported on and reviewed by the management in aggregate for the Group as a whole.

SSP Group Limited
Annual Report and Financial Statements (Registered number: 05735966)
30 September 2013
26
Notes to consolidated financial statements (continued)
3 Segmental reporting (continued)
Additional information
Although the Group’s operations are managed on a geographical basis, we provide additional information in relation
to revenue, based on the type of travel locations as follows:
Turnover
2013 2012
£m £m
Air 933.3 861.7
Rail 767.7 759.5
Other 126.2 116.3
1,827.2 1,737.5
A reconciliation of operating profit to profit before and after tax is provided as follows:
2013 2012
£m £m
Operating profit 67.2 52.1
Share of profit from associates 2.4 2.1
Profit on disposal of business - 6.9
Finance income 1.6 4.3
Finance expense
Goodwill written off
(44.5)
(10.5)
(51.0)
-
Profit / (loss) before tax 16.2 14.4
Income tax (13.9) (13.0)
Profit / (loss) after tax 2.3 1.4
‘Reportable segment’ assets are reconciled to total assets as follows:
2013 2012
£m £m
Segment assets for reportable segments 904.8 899.8
Unallocated:
Non-current assets 32.5 26.7
Current assets 293.8 277.1
Total assets per the balance sheet 1,231.1 1,203.6
The Group’s customer base primarily represents individuals or group of individuals travelling through airports and
railway stations. It does not rely on a single major customer therefore additional segmental information is not
provided.
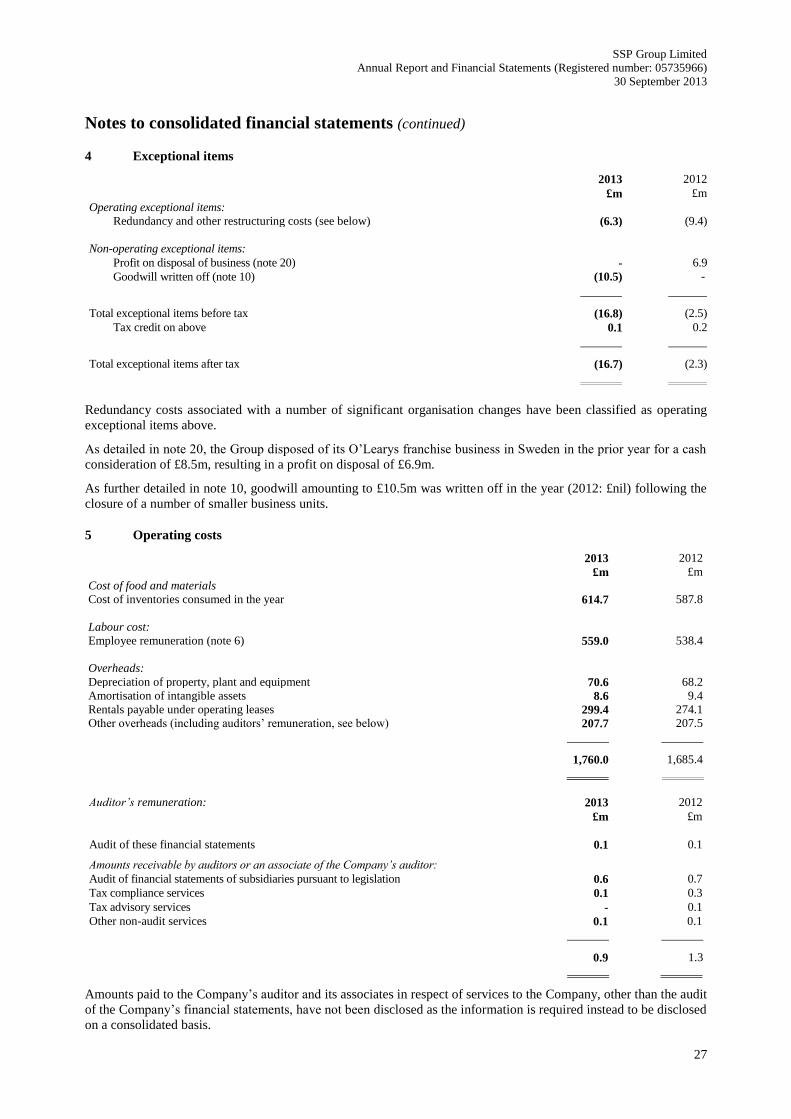
SSP Group Limited
Annual Report and Financial Statements (Registered number: 05735966)
30 September 2013
27
Notes to consolidated financial statements (continued)
4 Exceptional items
2013 2012
£m £m
Operating exceptional items:
Redundancy and other restructuring costs (see below) (6.3) (9.4)
Non-operating exceptional items:
Profit on disposal of business (note 20)
Goodwill written off (note 10)
-
(10.5)
6.9
-
Total exceptional items before tax (16.8) (2.5)
Tax credit on above 0.1 0.2
Total exceptional items after tax (16.7) (2.3)
Redundancy costs associated with a number of significant organisation changes have been classified as operating
exceptional items above.
As detailed in note 20, the Group disposed of its O’Learys franchise business in Sweden in the prior year for a cash
consideration of £8.5m, resulting in a profit on disposal of £6.9m.
As further detailed in note 10, goodwill amounting to £10.5m was written off in the year (2012: £nil) following the
closure of a number of smaller business units.
5 Operating costs
2013 2012
£m £m
Cost of food and materials
Cost of inventories consumed in the year 614.7 587.8
Labour cost:
Employee remuneration (note 6) 559.0 538.4
Overheads:
Depreciation of property, plant and equipment 70.6 68.2
Amortisation of intangible assets 8.6 9.4
Rentals payable under operating leases 299.4 274.1
Other overheads (including auditors’ remuneration, see below) 207.7 207.5
1,760.0 1,685.4
Auditor’s remuneration: 2013 2012
£m £m
Audit of these financial statements 0.1 0.1
Amounts receivable by auditors or an associate of the Company’s auditor:
Audit of financial statements of subsidiaries pursuant to legislation 0.6 0.7
Tax compliance services 0.1 0.3
Tax advisory services - 0.1
Other non-audit services 0.1 0.1
0.9 1.3
Amounts paid to the Company’s auditor and its associates in respect of services to the Company, other than the audit
of the Company’s financial statements, have not been disclosed as the information is required instead to be disclosed
on a consolidated basis.

SSP Group Limited
Annual Report and Financial Statements (Registered number: 05735966)
30 September 2013
28
Notes to consolidated financial statements (continued)
6 Staff numbers and costs
The average number of persons employed by the Group (including directors) during the year, analysed by category,
was as follows: Number of employees
2013 2012
Operations 27,836 28,086
Sales and Marketing 486 476
Administration 1,207 1,234
29,529 29,796
The aggregate payroll costs of the Group were as follows: 2013 2012
£m £m
Wages and salaries 492.0 472.1
Social security costs 58.4 57.7
Other pension costs 8.6 8.6
559.0 538.4
7 Finance income and expense
2013 2012
£m £m
Finance income
Interest income
Interest on defined benefit pension obligations 1.5
0.1
1.4
-
Net foreign exchange gains - 2.9
Total finance income 1.6 4.3
Finance expense
Total interest expense on financial liabilities measured at amortised cost (34.6) (31.3)
Net change in fair value of cash flow hedges utilised in the year (6.8) (15.9)
Unwind of discount on provisions (1.6) (2.6)
Net foreign exchange losses (0.5) -
Other (1.0) (1.2)
Total finance expense (44.5) (51.0)
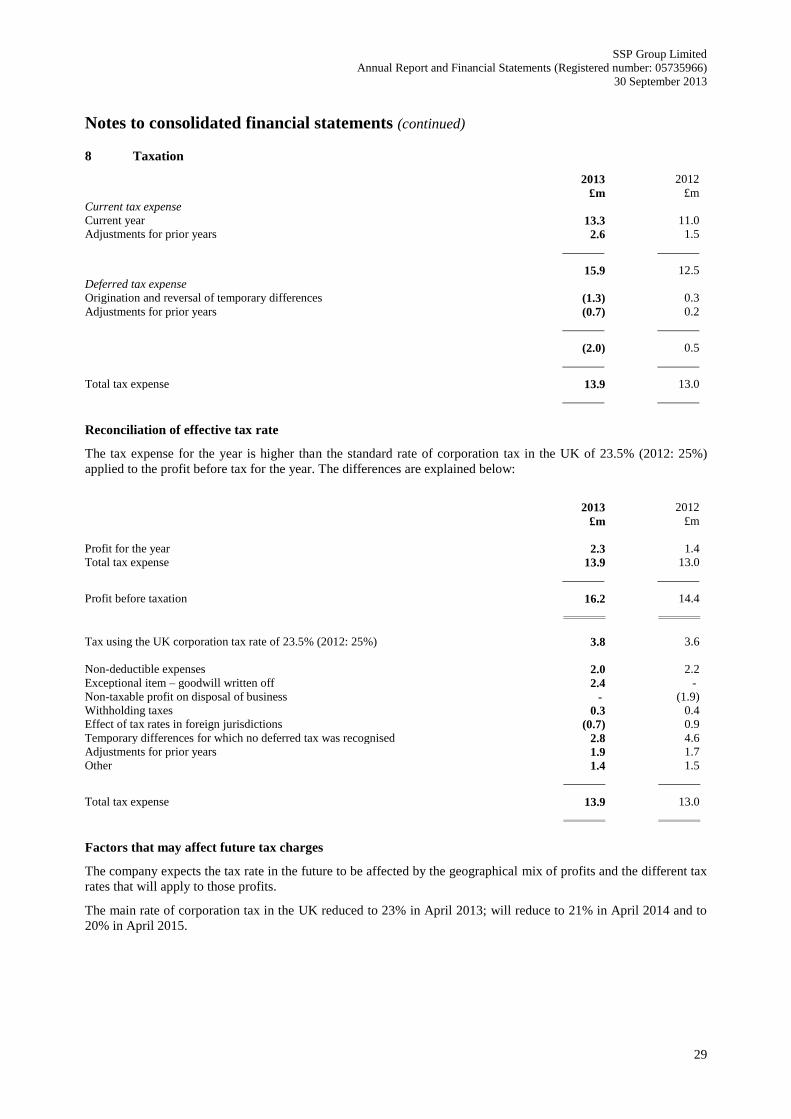
SSP Group Limited
Annual Report and Financial Statements (Registered number: 05735966)
30 September 2013
29
Notes to consolidated financial statements (continued)
8 Taxation
2013 2012
£m £m
Current tax expense
Current year 13.3 11.0
Adjustments for prior years 2.6 1.5
15.9 12.5
Deferred tax expense
Origination and reversal of temporary differences (1.3) 0.3
Adjustments for prior years (0.7) 0.2
(2.0) 0.5
Total tax expense 13.9 13.0
Reconciliation of effective tax rate
The tax expense for the year is higher than the standard rate of corporation tax in the UK of 23.5% (2012: 25%)
applied to the profit before tax for the year. The differences are explained below:
2013 2012
£m £m
Profit for the year 2.3 1.4
Total tax expense 13.9 13.0
Profit before taxation 16.2 14.4
Tax using the UK corporation tax rate of 23.5% (2012: 25%) 3.8 3.6
Non-deductible expenses 2.0 2.2
Exceptional item – goodwill written off 2.4 -
Non-taxable profit on disposal of business - (1.9)
Withholding taxes 0.3 0.4
Effect of tax rates in foreign jurisdictions (0.7) 0.9
Temporary differences for which no deferred tax was recognised 2.8 4.6
Adjustments for prior years 1.9 1.7
Other 1.4 1.5
Total tax expense 13.9 13.0
Factors that may affect future tax charges
The company expects the tax rate in the future to be affected by the geographical mix of profits and the different tax
rates that will apply to those profits.
The main rate of corporation tax in the UK reduced to 23% in April 2013; will reduce to 21% in April 2014 and to
20% in April 2015.

SSP Group Limited
Annual Report and Financial Statements (Registered number: 05735966)
30 September 2013
30
Notes to consolidated financial statements (continued)
9 Property, plant and equipment
Land and
buildings
Plant and
equipment
Fixtures and
fittings Total
£m £m £m £m
Cost
At 1 October 2012 97.8 175.0 412.9 685.7
Additions 13.2 29.4 39.8 82.4
Disposals (7.2) (11.3) (19.2) (37.7)
Effect of movements in foreign exchange (1.4) (1.2) 7.8 5.2
Other movements (0.2) 0.2 4.6 4.6
At 30 September 2013 102.2 192.1 445.9 740.2
Depreciation
At 1 October 2012 (68.2) (134.3) (288.9) (491.4)
Charge for the year (9.5) (13.1) (48.0) (70.6)
Disposals 7.2 11.3 19.2 37.7
Effect of movements in foreign exchange 0.7 0.3 (5.4) (4.4)
Other movements (0.1) (2.0) 0.6 (1.5)
At 30 September 2013 (69.9) (137.8) (322.5) (530.2)
Net book value
At 30 September 2012 29.6 40.7 124.0 194.3
At 30 September 2013 32.3 54.3 123.4 210.0
At 30 September 2013 the net carrying amount of plant and machinery held under finance leases was £3.0m (2012:
£3.3m). Depreciation for the year on these assets was £1.4m (2012: £1.2m). The leased equipment secures lease
obligations.
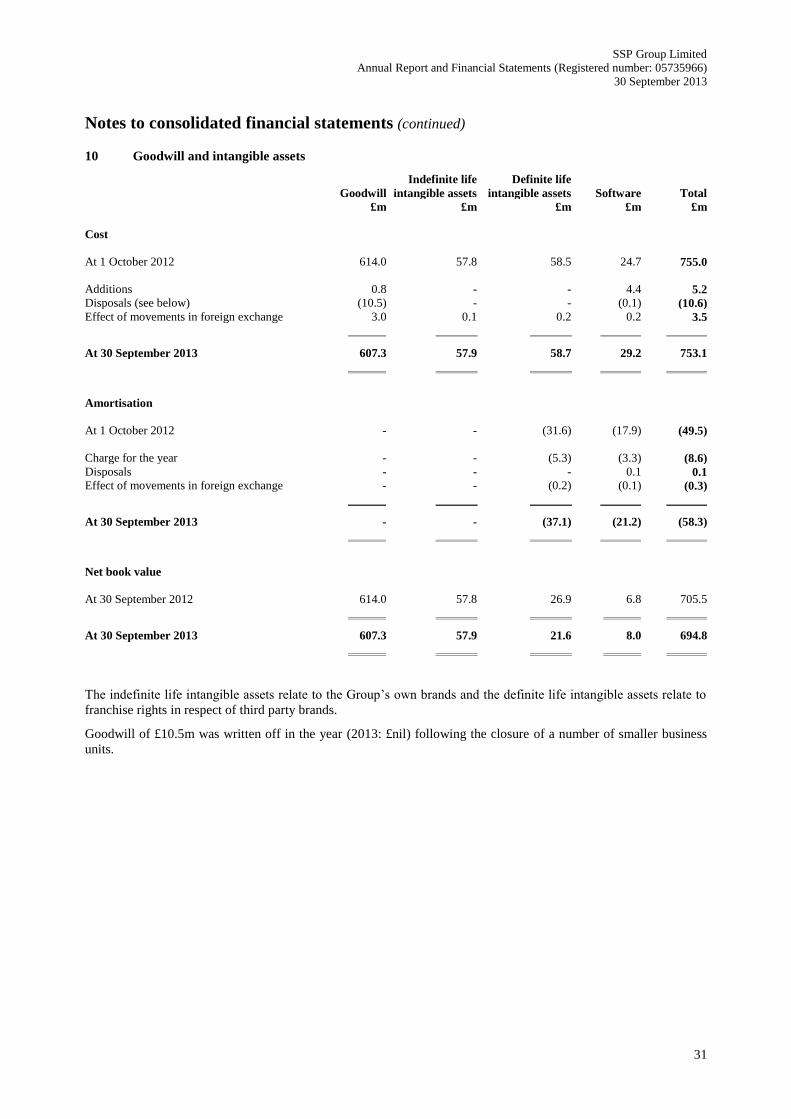
SSP Group Limited
Annual Report and Financial Statements (Registered number: 05735966)
30 September 2013
31
Notes to consolidated financial statements (continued)
10 Goodwill and intangible assets
Goodwill
Indefinite life
intangible assets
Definite life
intangible assets Software Total
£m £m £m £m £m
Cost
At 1 October 2012 614.0 57.8 58.5 24.7 755.0
Additions 0.8 - - 4.4 5.2
Disposals (see below) (10.5) - - (0.1) (10.6)
Effect of movements in foreign exchange 3.0 0.1 0.2 0.2 3.5
At 30 September 2013 607.3 57.9 58.7 29.2 753.1
Amortisation
At 1 October 2012 - - (31.6) (17.9) (49.5)
Charge for the year - - (5.3) (3.3) (8.6)
Disposals - - - 0.1 0.1
Effect of movements in foreign exchange - - (0.2) (0.1) (0.3)
At 30 September 2013 - - (37.1) (21.2) (58.3)
Net book value
At 30 September 2012 614.0 57.8 26.9 6.8 705.5
At 30 September 2013 607.3 57.9 21.6 8.0 694.8
The indefinite life intangible assets relate to the Group’s own brands and the definite life intangible assets relate to
franchise rights in respect of third party brands.
Goodwill of £10.5m was written off in the year (2013: £nil) following the closure of a number of smaller business
units.

SSP Group Limited
Annual Report and Financial Statements (Registered number: 05735966)
30 September 2013
32
Notes to consolidated financial statements (continued)
10 Goodwill and intangible assets (continued)
Impairment tests for goodwill and intangible assets
Goodwill and intangible assets are allocated to the Group’s CGUs identified according to operating segment. Details
of goodwill and indefinite life intangible assets allocated to CGUs or groups of CGUs are provided in the table
below:
Goodwill
Indefinite life
intangible assets 2013 2012 2013 2012
£m £m £m £m
UK 171.3 177.0 55.6 55.6
Continental Europe 358.9 353.7 2.3 2.2
Rest of the World 77.1 83.3 - -
607.3 614.0 57.9 57.8
The Group tests goodwill and indefinite life intangible assets annually for impairment. This did not result in any
impairment in the year (2012: £nil).
The recoverable amount of all CGUs is determined based on value in use calculations. These calculations use cash
flow projections based on financial budgets and forecasts approved by the Board. The key assumptions for these
calculations are shown below:
2013 UK Continental
Europe
RoW
Growth rate applied beyond approved forecast period 2% 2% to 3% 2% to 5%
Discount rate 11.3% 11.3% to 12.8% 11.3% to 16.9%
Forecast period 5 years 5 years 5 years
2012 UK Continental
Europe
RoW
Growth rate applied beyond approved forecast period 2% 2% to 5% 2% to 5%
Discount rate 11.0% 11.0% to 12.5% 11.0% to 15.0%
Forecast period 5 years 5 years 5 years
Sensitivity analysis
A sensitivity analysis has been performed in assessing the recoverability of goodwill and intangible assets. For each
operating segment, an increase of 0.5% in the discount rate or a decrease in the growth rate of 0.5% would not result
in the carrying amount for any CGU or groups of CGUs exceeding its recoverable amount.
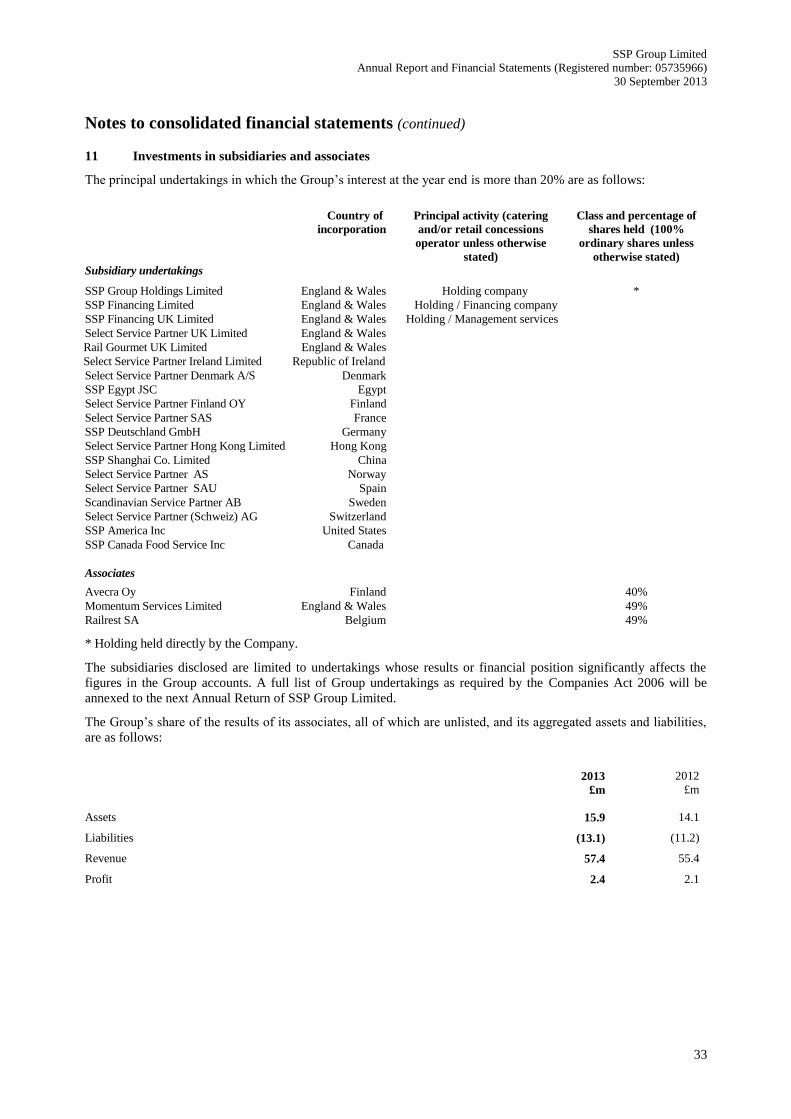
SSP Group Limited
Annual Report and Financial Statements (Registered number: 05735966)
30 September 2013
33
Notes to consolidated financial statements (continued)
11 Investments in subsidiaries and associates
The principal undertakings in which the Group’s interest at the year end is more than 20% are as follows:
Country of
incorporation
Principal activity (catering
and/or retail concessions
operator unless otherwise
stated)
Class and percentage of
shares held (100%
ordinary shares unless
otherwise stated)
Subsidiary undertakings
SSP Group Holdings Limited England & Wales Holding company *
SSP Financing Limited England & Wales Holding / Financing company
SSP Financing UK Limited England & Wales Holding / Management services
Select Service Partner UK Limited England & Wales
Rail Gourmet UK Limited England & Wales
Select Service Partner Ireland Limited Republic of Ireland
Select Service Partner Denmark A/S Denmark
SSP Egypt JSC Egypt
Select Service Partner Finland OY Finland
Select Service Partner SAS France
SSP Deutschland GmbH Germany
Select Service Partner Hong Kong Limited Hong Kong
SSP Shanghai Co. Limited China
Select Service Partner AS Norway
Select Service Partner SAU Spain
Scandinavian Service Partner AB Sweden
Select Service Partner (Schweiz) AG Switzerland
SSP America Inc United States
SSP Canada Food Service Inc Canada
Associates
Avecra Oy Finland 40%
Momentum Services Limited England & Wales 49%
Railrest SA Belgium 49%
* Holding held directly by the Company.
The subsidiaries disclosed are limited to undertakings whose results or financial position significantly affects the
figures in the Group accounts. A full list of Group undertakings as required by the Companies Act 2006 will be
annexed to the next Annual Return of SSP Group Limited.
The Group’s share of the results of its associates, all of which are unlisted, and its aggregated assets and liabilities,
are as follows:
2013 2012
£m £m
Assets 15.9 14.1
Liabilities (13.1) (11.2)
Revenue 57.4 55.4
Profit 2.4 2.1

SSP Group Limited
Annual Report and Financial Statements (Registered number: 05735966)
30 September 2013
34
Notes to consolidated financial statements (continued)
11 Investments in subsidiaries and associates (continued)
The following table summarises the movement in investment in associates during the year:
2013 2012
£m £m
At beginning of the year 5.2 4.5
Profits for the year 2.4 2.1
Dividends received (2.2) (2.3)
Currency adjustment (0.1) (0.4)
Other - 1.3
At end of the year 5.3 5.2
12 Deferred tax assets and liabilities
Recognised deferred tax assets and liabilities
Deferred tax assets and liabilities are attributable to the following:
Assets Liabilities 2013 2012 2013 2012
£m £m £m £m
Intangible assets - - (9.5) (4.1)
Property, plant and equipment 5.1 1.3 (2.8) (0.9)
Provisions 1.2 0.7 - -
Tax loss carry forwards 4.2 - - -
Other - 0.2 (1.3) (1.9)
Tax assets / (liabilities) 10.5 2.2 (13.6) (6.9)
Set off of tax (7.5) - 7.5 -
Net tax assets / (liabilities) 3.0 2.2 (6.1) (6.9)
Movement in net deferred tax during the year: 1 October
2012
Recognised
in the year
Currency
adjustment
30 September
2013
£m £m £m £m
Intangible assets (4.1) (5.4) - (9.5)
Property, plant and equipment 0.4 2.1 (0.2) 2.3
Provisions 0.7 0.6 (0.1) 1.2
Tax loss carry forwards - 4.2 - 4.2
Other (1.7) 0.5 (0.1) (1.3)
(4.7) 2.0 (0.4) (3.1)

SSP Group Limited
Annual Report and Financial Statements (Registered number: 05735966)
30 September 2013
35
Notes to consolidated financial statements (continued)
12 Deferred tax assets and liabilities (continued)
Unrecognised deferred tax assets and liabilities
Unrecognised deferred tax assets and liabilities in these financial statements are attributable to the following:
Assets Liabilities 2013 2012 2013 2012
£m £m £m £m
Property, plant and equipment 16.0 30.5 - -
Tax losses 65.9 70.3 - -
Provisions 9.8 2.9 - -
91.7 103.7 - -
The above deferred tax assets have not been recognised due to the uncertainty over the future profitability of the
companies within the Group to which these deferred tax assets relate.
No deferred tax liability has been recognised on the unremitted earnings of overseas subsidiaries based on the
current repatriation policy of the Group and the fact that, given the current tax regimes in the countries in which the
Group operates, only an insignificant amount of withholding tax would arise should the Group choose to remit the
earnings of certain subsidiaries.
13 Inventories
2013 2012
£m £m
Food & beverages 22.4 22.3
Other consumables 2.4 2.4
24.8 24.7
14 Trade and other receivables
2013 2012
£m £m
Trade receivables 32.0 31.9
Other receivables 43.8 44.5
Prepayments and accrued income 35.1 32.6
110.9 109.0
Non-current (other receivables) 24.2 19.3
Current 86.7 89.7
15 Cash and cash equivalents
2013 2012
£m £m
Cash at bank and on hand 94.6 80.8
Short term bank deposits 87.5 81.4
182.1 162.2

SSP Group Limited
Annual Report and Financial Statements (Registered number: 05735966)
30 September 2013
36
Notes to consolidated financial statements (continued)
16 Short term and long term borrowings
2013 2012
£m £m
Current liabilities
Finance leases 1.4 1.4
Other loans - 3.3
1.4 4.7
Non-current liabilities
Bank loans 1,048.7 1,030.0
Finance leases 2.4 2.6
1,051.1 1,032.6
Bank loans
Bank loans include:
Facility A debt (amounting to £678.3m as at 30 September 2013) - matures on 15 June 2016 and accrued cash-
pay interest at LIBOR or EURIBOR plus a margin of approximately 2.5% per annum during 2013 (2012:
2.0%).
Tranche B1 debt (amounting to £376.3m as at 30 September 2013) - matures on 15 June 2017 and accrues cash-
pay interest at LIBOR or EURIBOR (but capped at 2.25% per annum).
Bank loans are shown net of unamortised bank fees totalling £5.9m (2012: £7.6m).
Finance lease liabilities
Finance lease liabilities are payable as follows: 2013 2012
£m £m
Less than one year 1.4 1.4
Between one and five years 2.0 2.0
More than five years 0.4 0.6
3.8 4.0
17 Trade and other payables
2013 2012
£m £m
Current
Trade payables 94.8 83.1
Other payables 86.7 90.0
Other taxation and social security 19.3 20.7
Accruals and deferred income 120.7 109.8
321.5 303.6
Non-current
Other payables 0.4 1.0

SSP Group Limited
Annual Report and Financial Statements (Registered number: 05735966)
30 September 2013
37
Notes to consolidated financial statements (continued)
18 Post employment benefit obligations
Group
The Group operates a number of post employment benefit schemes including both defined contribution and defined
benefit schemes. In respect of the defined contribution schemes, amounts paid during the year were £5.9m (2012:
£7.8m) across the Group. There are no contributions outstanding at the balance sheet date. The principal defined
contribution scheme is called the SSP Group Pension Scheme and the main defined benefit scheme is called the Rail
Gourmet UK Limited Shared Cost Section (of the Railways Pension Scheme). In addition there are a number of
other long term employee benefit schemes within Europe.
Information is provided below for the Rail Gourmet UK Scheme separately and the other European schemes in
aggregate.
The total net deficit, in respect of the Group’s long term employee benefits, comprises: 2013 2012
£m £m
The Rail Gourmet UK Scheme (see (a) below) (5.2) (2.5)
European schemes (see (b) below) (9.8) (11.4)
(15.0) (13.9)
(a) The Rail Gourmet UK Limited Shared Cost Section (of the Railways Pension Scheme)
The Scheme covers permanent managerial, administrative and sales staff of Rail Gourmet UK Limited. On 3
October 1995 the scheme was closed to new members and up to the date of acquisition by SSP Group Limited all
new employees joined the Compass Group pension scheme.
Since the formation of the SSP Group, in 2006, shortly prior to its acquisition by the Company from the Compass
Group, employees became eligible to join the SSP Group Pension Scheme, a defined contribution scheme. This
scheme is available to all eligible employees joining the Group after that date and will provide benefits based on the
employees’ and employing companies’ contributions.
In June 2012 it was agreed with the Trustees of the Rail Gourmet scheme that from 1 July 2012 the company
contributions would remain at 13.5% of pensionable pay (with members paying 9%), from 1 July 2013 the company
contributions would increase to 15% (with employees paying 10%) and from 1 July 2014 the company contributions
would increase to 16.5% (with employees paying 11%) until the results of the next formal actuarial review are
known. The total payments made during the year were £0.1m and contributions next year are expected to be £0.2m.
The Scheme was subject to its last full actuarial valuation by a qualified independent actuary as at 31 December
2011. This valuation has been updated for IAS 19 purposes for the year ended 30 September 2013 by a qualified
independent actuary, using the major assumptions set out below:
2013 2012
Discount rate applied to scheme liabilities 4.43% 4.17%
Rate of increase in salaries 3.45% 2.64%
Rate of increase in pensions in payment 2.45% 1.74%
Expected return on scheme assets 7.38% 6.61%
Inflation assumption 2.45% 1.64%

SSP Group Limited
Annual Report and Financial Statements (Registered number: 05735966)
30 September 2013
38
Notes to consolidated financial statements (continued)
18 Post employment benefit obligations (continued)
At the balance sheet date, scheme members were assumed to have the following life expectancies at age 60:
2013 2012
Male pensioner now aged 60 26.5 26.5
Female pensioner now aged 60 28.9 28.9
Male pensioner now aged 40 27.6 27.6
Female pensioner now aged 40 30.5 30.5
The major categories of assets in the Scheme, their percentage of the total Scheme assets and the expected rate of
return as at 30 September 2013 were:
2013 2012
Expected
rate of
return
(% p.a.)
% of total
scheme
assets
Expected
rate of
return
(% p.a.)
% of total
scheme
assets
Equities (based on FTSE UK Gilts 15 years) 7.86% 83.7% 7.02% 91.8%
Property / infrastructure 7.11% 7.2% na na
Fixed interest investments (based on FTSE UK Gilts 15 years) 3.11% 8.1% 2.07% 7.7%
Cash (based on 15 year interest rate swaps) 3.10% 1.0% 2.30% 0.5%
The fair value of the Scheme’s assets, which are not intended to be realised in the short term and may be subject to
significant change before they are realised, and the present value of the Scheme’s liabilities, which are derived from
cash flow projections over long periods and thus inherently uncertain, were:
2013 2012
£m £m
Fair value of scheme assets 26.1 25.0
Present value of funded liabilities (31.3) (27.5)
––––––– ––––––– Net Pension liability (5.2) (2.5)

SSP Group Limited
Annual Report and Financial Statements (Registered number: 05735966)
30 September 2013
39
Notes to consolidated financial statements (continued)
18 Post employment benefit obligations (continued)
The following amounts have been charged or credited in arriving at the profit for the year:
2013 2012
£m £m
Current service cost (reported in employee remuneration) (0.3) (0.2)
Interest on pension Scheme liabilities (reported in finance expense) (1.1) (1.2)
Expected return on pension Scheme assets (reported in finance expense) 1.6 1.5
–––––– –––––– Total amount credited/(charged) 0.2 0.1
Changes in the present value of the Scheme liabilities are as follows:
2013 2012
£m £m
Scheme liabilities at beginning of the year (27.5) (24.5)
Current service cost (0.3) (0.2)
Employee contributions (0.1) (0.1)
Interest on pension Scheme liabilities (1.1) (1.2)
Actuarial losses (3.3) (3.0)
Benefits paid 1.0 1.5
–––––– ––––––
Scheme liabilities at end of the year (31.3) (27.5)
Changes in the fair value of Scheme assets are as follows:
2013 2012
£m £m
Scheme assets at beginning of the year 25.0 24.6
Expected return 1.6 1.5
Employer contributions 0.1 0.1
Employee contributions 0.1 0.1
Actuarial gains 0.3 0.2
Benefits paid (1.0) (1.5)
––––––– –––––––
Scheme assets at end of the year 26.1 25.0
Actual return on Scheme assets (expected return and actuarial gains or losses) 1.9 1.7
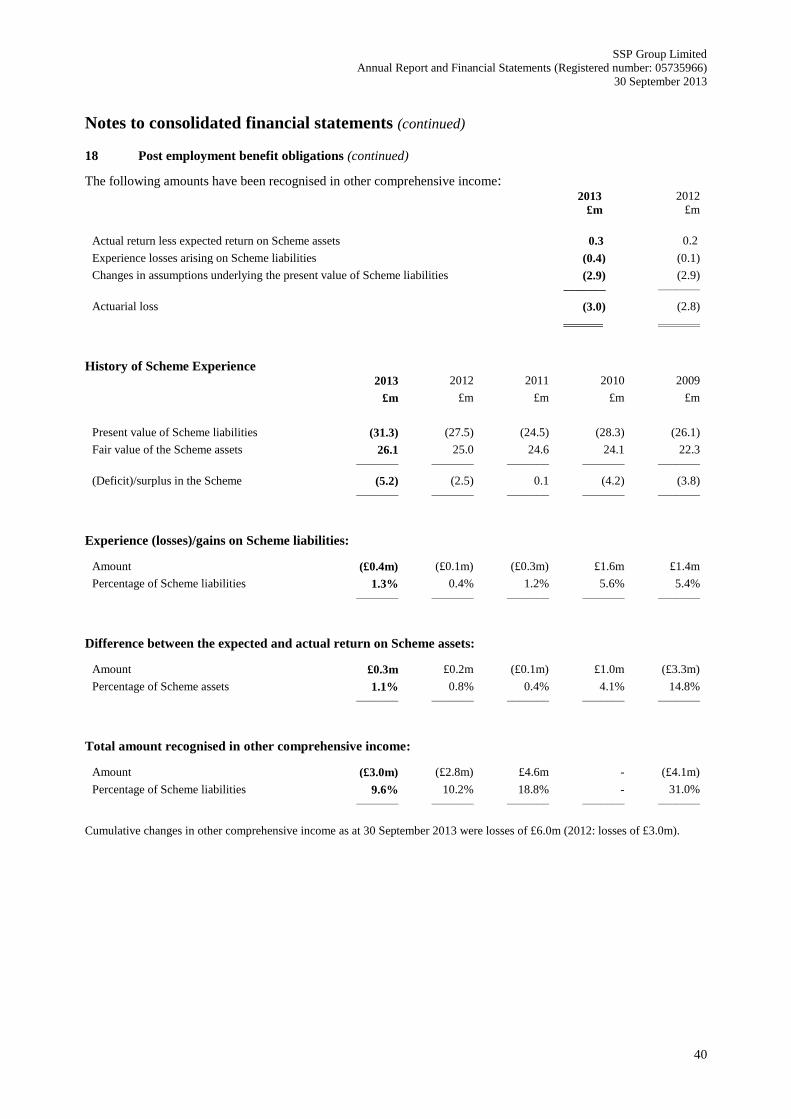
SSP Group Limited
Annual Report and Financial Statements (Registered number: 05735966)
30 September 2013
40
Notes to consolidated financial statements (continued)
18 Post employment benefit obligations (continued)
The following amounts have been recognised in other comprehensive income: 2013 2012
£m £m
Actual return less expected return on Scheme assets 0.3 0.2
Experience losses arising on Scheme liabilities (0.4) (0.1)
Changes in assumptions underlying the present value of Scheme liabilities (2.9) (2.9)
––––––– –––––––
Actuarial loss (3.0) (2.8)
History of Scheme Experience 2013 2012 2011 2010 2009
£m £m £m £m £m
Present value of Scheme liabilities (31.3) (27.5) (24.5) (28.3) (26.1)
Fair value of the Scheme assets 26.1 25.0 24.6 24.1 22.3
––––––– ––––––– ––––––– ––––––– –––––––
(Deficit)/surplus in the Scheme (5.2) (2.5) 0.1 (4.2) (3.8)
––––––– ––––––– ––––––– ––––––– –––––––
Experience (losses)/gains on Scheme liabilities:
Amount (£0.4m) (£0.1m) (£0.3m) £1.6m £1.4m
Percentage of Scheme liabilities 1.3% 0.4% 1.2% 5.6% 5.4%
––––––– ––––––– ––––––– ––––––– –––––––
Difference between the expected and actual return on Scheme assets:
Amount £0.3m £0.2m (£0.1m) £1.0m (£3.3m)
Percentage of Scheme assets 1.1% 0.8% 0.4% 4.1% 14.8%
––––––– ––––––– ––––––– ––––––– –––––––
Total amount recognised in other comprehensive income:
Amount (£3.0m) (£2.8m) £4.6m - (£4.1m)
Percentage of Scheme liabilities 9.6% 10.2% 18.8% - 31.0%
––––––– ––––––– ––––––– ––––––– –––––––
Cumulative changes in other comprehensive income as at 30 September 2013 were losses of £6.0m (2012: losses of £3.0m).
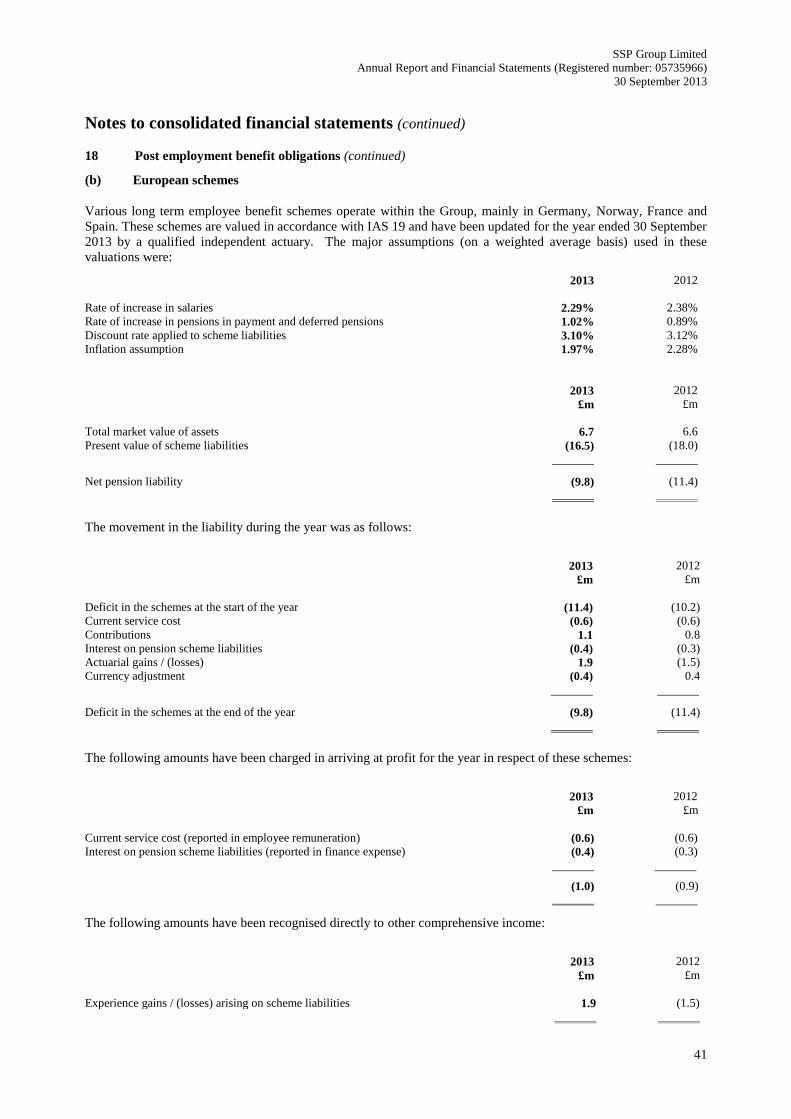
SSP Group Limited
Annual Report and Financial Statements (Registered number: 05735966)
30 September 2013
41
Notes to consolidated financial statements (continued)
18 Post employment benefit obligations (continued)
(b) European schemes
Various long term employee benefit schemes operate within the Group, mainly in Germany, Norway, France and
Spain. These schemes are valued in accordance with IAS 19 and have been updated for the year ended 30 September
2013 by a qualified independent actuary. The major assumptions (on a weighted average basis) used in these
valuations were:
2013 2012
Rate of increase in salaries 2.29% 2.38%
Rate of increase in pensions in payment and deferred pensions 1.02% 0.89%
Discount rate applied to scheme liabilities 3.10% 3.12%
Inflation assumption 1.97% 2.28%
2013 2012
£m £m
Total market value of assets 6.7 6.6
Present value of scheme liabilities (16.5) (18.0)
Net pension liability (9.8) (11.4)
The movement in the liability during the year was as follows:
2013 2012
£m £m
Deficit in the schemes at the start of the year (11.4) (10.2)
Current service cost (0.6) (0.6)
Contributions 1.1 0.8
Interest on pension scheme liabilities (0.4) (0.3)
Actuarial gains / (losses) 1.9 (1.5)
Currency adjustment (0.4) 0.4
Deficit in the schemes at the end of the year (9.8) (11.4)
The following amounts have been charged in arriving at profit for the year in respect of these schemes:
2013 2012
£m £m
Current service cost (reported in employee remuneration) (0.6) (0.6)
Interest on pension scheme liabilities (reported in finance expense) (0.4) (0.3)
(1.0) (0.9)
The following amounts have been recognised directly to other comprehensive income:
2013 2012
£m £m
Experience gains / (losses) arising on scheme liabilities 1.9 (1.5)

SSP Group Limited
Annual Report and Financial Statements (Registered number: 05735966)
30 September 2013
42
Notes to consolidated financial statements (continued)
19 Provisions
Onerous
contracts
Other
Total
£m £m £m
At 1 October 2012 (6.6) (5.4) (12.0)
Expenditure in year - 1.6 1.6
Charged in the income statement
- Unwind of discount (0.6) (0.6) (1.2)
- Utilised in the year 1.8 - 1.8
Increased in the year - (3.1) (3.1)
Currency adjustment 0.1 - 0.1
At 30 September 2013 (5.3) (7.5) (12.8)
Provision for onerous contracts is made when the expected benefits to be derived by the Group from a contract are
lower than the unavoidable cost of meeting its obligations under the contract. The projected shortfall in benefits
compared with unavoidable costs over the life of such contracts has been discounted to present value using the risk
adjusted discount rate of 11.8%.
Other provisions represent estimates of expected costs to be incurred in restoring a site to its original condition when
it is vacated at the end of the lease term. These costs have been also discounted using the risk adjusted discount rate
of 11.8%.
20 Business disposal
There have not been any disposals in the current financial year. In the prior year, the Group disposed of its O’Learys
franchise business in Sweden for a cash consideration of £8.5m. The disposal proceeds and related profit on disposal
is shown in the table below.
2013 2012
£m £m
Cash received - 8.5
Net assets disposed - (0.7)
Goodwill disposed - (0.5)
Transaction expenses - (0.4)
Profit on disposal - 6.9
The disposal of the O’Learys business was not treated as a discontinued operation as the sale did not have a material
effect on the nature and focus of the Group’s operations. Furthermore, this did not represent a material reduction in
the turnover of SSP’s business.

SSP Group Limited
Annual Report and Financial Statements (Registered number: 05735966)
30 September 2013
43
Notes to consolidated financial statements (continued)
21 Capital and reserves
Share capital 2013 2012
£m £m
Issued, called up and fully paid
19,999,999 Ordinary shares of £0.01 each 0.2 0.2
200,000 Preferred ordinary shares of £0.01 each - -
99,831,700 Class B preference shares of £0.01 each 1.0 1.0
417,670,000 Deferred ordinary shares of £0.01 each 4.2 4.2
5.4 5.4
Ordinary shares
The ordinary shareholders are entitled to receive notice of, attend and speak at and vote at general meetings of the
Company. Ordinary shareholders have one vote for each ordinary share held by them.
Preferred ordinary shares
Preferred ordinary shareholders are entitled to receive notice of and to attend and speak at general meetings of the
Company. Preferred ordinary shareholders may not vote in respect of these shares at general meetings of the
Company unless:
(a) the resolution is one which directly or indirectly varies, modifies, alters or abrogates any of the rights, privileges,
limitations or restrictions attaching to the class of these shares held by them; or
(b) the resolution is for the winding up of the Company, the reduction of share capital or the redemption or purchase
by the Company of any of its shares.
Class B preference shares
Class B preference shareholders are entitled to receive notice of and to attend and speak at general meetings of the
Company. Class B preference shareholders may not vote in respect of these shares at general meetings of the
Company unless:
(a) the resolution is one which directly or indirectly varies, modifies, alters or abrogates any of the rights, privileges,
limitations or restrictions attaching to the class of these shares held by them; or
(b) the resolution is for the winding up of the Company, the reduction of share capital or the redemption or purchase
by the Company of any of its shares.
Deferred ordinary shares
These shares do not confer any voting rights and in practice no right to dividends or return of capital.
Share premium 2013 2012
£m £m
At beginning of the year 642.8 642.8
Premium on shares issued in the year 0.1 -
At end of the year 642.9 642.8

SSP Group Limited
Annual Report and Financial Statements (Registered number: 05735966)
30 September 2013
44
Notes to consolidated financial statements (continued)
21 Capital and reserves (continued)
Reserves
Translation
reserves
£m
Cash flow
hedging
reserves
£m
Retained
earnings
£m
Total
£m
At 1 October 2012 15.5 (12.0) (855.3) (851.8)
Loss for the financial year - - (1.2) (1.2)
Net loss on hedge of net investment in foreign operations (9.0) - - (9.0)
Other foreign exchange translation differences (6.8) - - (6.8)
Effective portion of changes in fair value of cash flow hedges - 6.7 - 6.7
Actuarial losses on defined benefit pension schemes - - (1.1) (1.1)
At 30 September 2013 (0.3) (5.3) (857.6) (863.2)
Translation reserves
The translation reserve comprises all foreign exchange differences arising since 1 October 2010, the transition date
to IFRS, from the translation of the financial statements of foreign operations, as well as from the translation of
liabilities that hedge the Company’s net investment in foreign subsidiaries.
Cash flow hedging reserves
The hedging reserve comprises the cumulative net change in the fair value of the Group’s interest rate swaps.
Non-controlling interests 2013 2012
£m £m
At beginning of the year 10.2 8.5
Share of profit for the year 3.5 2.0
Dividends paid to minorities (2.5) (1.9)
Capital contribution from minorities 8.8 2.2
Currency adjustment (0.2) (0.6)
At end of the year 19.8 10.2

SSP Group Limited
Annual Report and Financial Statements (Registered number: 05735966)
30 September 2013
45
Notes to consolidated financial statements (continued)
22 Cash flow from operations
Note 2013 2012
£m £m
Cash flows from operating activities
Profit / (loss) for the year 2.3 1.4
Adjustments for:
Depreciation 9 70.6 68.2
Amortisation 10 8.6 9.4
Goodwill written off
Finance income
10
7 10.5
(1.6)
-
(4.3)
Finance expense 7 44.5 51.0
Share of profit of associates 11 (2.4) (2.1)
Exceptional costs before tax 4 6.3 2.5
Taxation 8 13.9 13.0
152.7 139.1
Increase in trade and other receivables (1.9) (7.4)
Increase in inventories (0.1) (0.1)
Increase in trade and other payables, and in provisions 7.7 23.9
Cash flow from operations 158.4 155.5
23 Financial instruments
(a) Financial instruments by category
Financial assets 2013 2012
£m £m
Trade and other receivables 110.9 109.0
Cash and cash equivalents 182.1 162.2
293.0 271.2
Financial liabilities 2013 2012
£m £m
Bank loans (1,048.7) (1,030.0)
Finance leases (3.8) (4.0)
Derivative financial instruments (5.4) (12.6)
Trade and other payables excluding other taxation and social security (302.6) (287.2)
(1,360.5) (1,333.8)

SSP Group Limited
Annual Report and Financial Statements (Registered number: 05735966)
30 September 2013
46
Notes to consolidated financial statements (continued)
23 Financial instruments (continued)
(b) Fair values of financial instruments
The fair values of all financial assets and financial liabilities by class together with their carrying amounts shown in
the balance sheet are as follows:
Carrying
amount
Fair
value
Carrying
amount
Fair
value
2013 2013 2012 2012
£m £m £m £m
Loans and receivables
Cash and cash equivalents 182.1 182.1 162.2 162.2
Other receivables 110.9 110.9 109.0 109.0
Total loans and receivables 293.0 293.0 271.2 271.2
Non-derivative financial liabilities measured at
amortised cost
Bank loans (1,048.7) (1,054.6) (1,030.0) (1,037.6)
Finance lease liabilities (3.8) (3.8) (4.0) (4.0)
Other payables (302.6) (302.6) (287.2) (287.2)
Total financial liabilities measured at amortised cost (1,355.1) (1,361.0) (1,321.2) (1,328.8)
Derivative financial liabilities
Interest rate swaps (5.4) (5.4) (12.6) (12.6)
Total derivative financial liabilities (5.4) (5.4) (12.6) (12.6)
Bank loans
Fair value is calculated based on present value of future principal and interest cash flows, discounted at the market
rate of interest at the balance sheet date.
Finance lease liabilities
Fair value is based on the present value of the future lease payments, discounted at the rate implicit in the lease.
Other non derivative financial instruments (excluding bank loans)
Due to the short term nature of non derivative financial instruments (excluding bank loans) the fair value is
approximate to the carrying value.
Derivative financial instrument
Derivative financial instruments relate to interest rate swaps and are valued using relevant yield curves and
exchange rates as at the balance sheet date.
Fair value hierarchy
All derivative financial liabilities are categorised as Level 2 under which the fair value is measured using the inputs
other than quoted prices observable for the liability, either directly or indirectly.

SSP Group Limited
Annual Report and Financial Statements (Registered number: 05735966)
30 September 2013
47
Notes to consolidated financial statements (continued)
23 Financial instruments (continued)
(c) Credit risk
The Group’s concentration of credit risk in relation to trade receivables is not considered material. The balances
relate to a number of customers for whom there is no recent history of default. The ageing of trade receivables at the
balance sheet date was as follows: 2013 2012
£m £m
Total trade receivables 33.0 32.7
Less: impairment provision for trade receivables (1.0) (0.8)
32.0 31.9
Of which:
Not yet due 23.7 25.1
Overdue, between 0 and 6 months 8.6 6.4
Overdue, more than 6 months 0.7 1.2
Impairment provision for trade receivables (1.0) (0.8)
32.0 31.9
The movement in the allowance for impairment in respect of trade receivables during the year was as follows:
2013 2012
£m £m
At beginning of the year (0.8) (1.2)
Charged in the year (0.2) (0.1)
Utilised in the year 0.1 0.4
Currency adjustment (0.1) 0.1
At end of the year (1.0) (0.8)
Other classes of assets in trade and other receivables do not include any impaired assets.
(d) Credit quality of cash at bank and short-term deposits
The credit quality of cash at bank and short-term deposits has been assessed by reference to Moody’s external
ratings as follows:
2013 2012
£m £m
High grade 56.1 57.5
Upper medium grade 91.7 69.6
Medium grade 2.5 3.4
Non-investment grade 1.8 3.4
Unrated 5.4 5.3
157.5 139.2
Cash in hand and in transit 24.6 23.0
182.1 162.2

SSP Group Limited
Annual Report and Financial Statements (Registered number: 05735966)
30 September 2013
48
Notes to consolidated financial statements (continued)
23 Financial instruments (continued)
(e) Financial risk management
The main financial risks of the Group relate to the availability of funds to meet business needs, the risk of default by
counterparties to financial transactions, and fluctuations in interest and foreign exchange rates. In this regard the
Treasury function is mandated by the Board to manage the financial risks that arise in relation to underlying
business needs. The function has clear policies and operating parameters, and its activities are regularly reviewed by
the Board to ensure compliance. The function does not operate as a profit centre and speculative transactions are not
permitted.
Financial instruments, including derivatives, are used on occasion to manage the main financial risks arising during
the course of business. These risks are liquidity risk and market risk and are discussed further below:
Liquidity risk
The Group’s objective in managing liquidity risk is to ensure that it can meet its financial obligations as and when
they fall due. In order to achieve this, the Treasury department maintain an appropriate level of funds and facilities
to meet each year’s planned funding requirement.
The following are the contractual maturities of financial liabilities including estimated interest payments:
2013
Carrying
amount
Contractual
cash flows
1 year
or less
1 to
<2years
2 to
<5years >5years
£m £m £m £m £m £m
Non-derivative financial liabilities
Bank loans 1,048.7 1,169.4 26.0 41.1 1,102.3 -
Finance lease liabilities 3.8 5.1 1.5 1.4 1.4 0.8
Trade and other payables 302.6 302.6 300.8 0.4 1.4 -
Provisions 12.8 34.7 3.6 2.2 4.1 24.8
Derivative financial liabilities
Interest rate swaps used for hedging 5.4 5.6 4.1 1.4 0.1 -
1,373.3 1,517.4 336.0 46.5 1,109.3 25.6
2012
Carrying
amount
Contractual
cash flows
1 year
or less
1 to
<2years
2 to
<5years >5years
£m £m £m £m £m £m
Non-derivative financial liabilities
Bank loans 1,030.0 1,175.3 27.6 25.9 1,121.8 -
Finance lease liabilities 4.0 4.8 1.4 1.3 1.3 0.8
Trade and other payables 287.2 287.2 286.2 1.0 - -
Provisions 12.0 32.1 2.3 3.1 3.2 23.5
Derivative financial liabilities
Interest rate swaps used for hedging 12.6 13.4 7.6 4.1 1.7 -
1,345.8 1,512.8 325.1 35.4 1,128.0 24.3
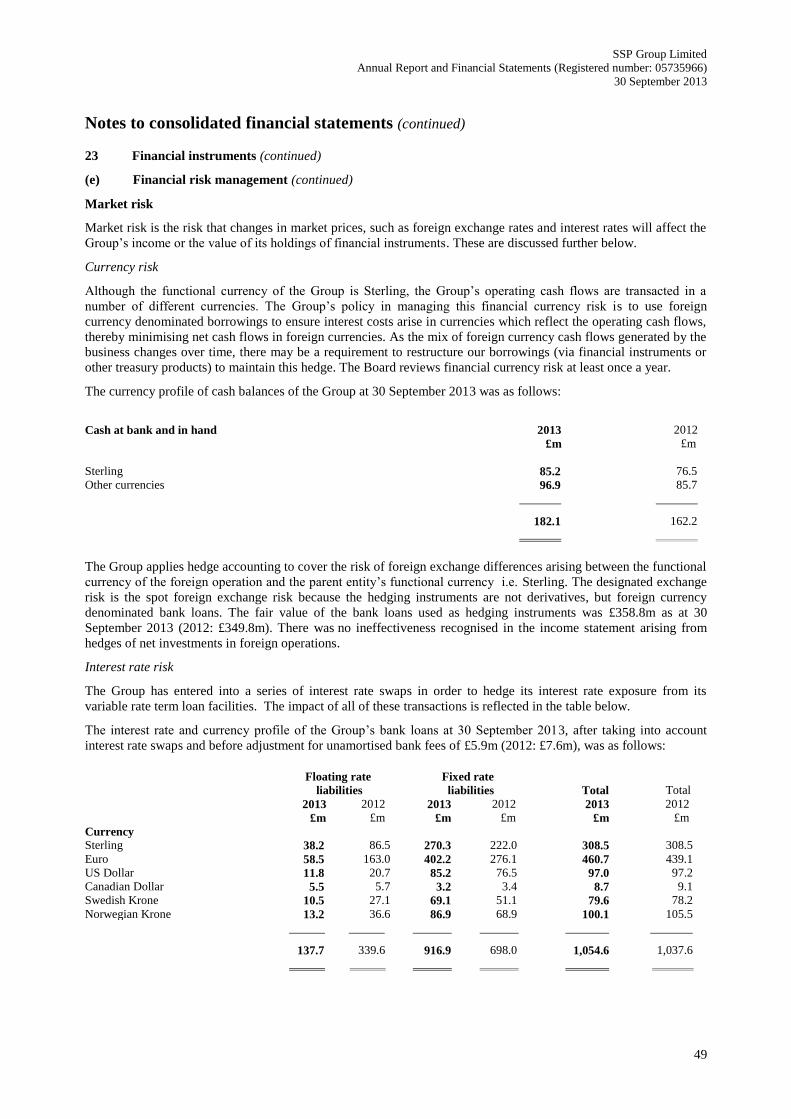
SSP Group Limited
Annual Report and Financial Statements (Registered number: 05735966)
30 September 2013
49
Notes to consolidated financial statements (continued)
23 Financial instruments (continued)
(e) Financial risk management (continued)
Market risk
Market risk is the risk that changes in market prices, such as foreign exchange rates and interest rates will affect the
Group’s income or the value of its holdings of financial instruments. These are discussed further below.
Currency risk
Although the functional currency of the Group is Sterling, the Group’s operating cash flows are transacted in a
number of different currencies. The Group’s policy in managing this financial currency risk is to use foreign
currency denominated borrowings to ensure interest costs arise in currencies which reflect the operating cash flows,
thereby minimising net cash flows in foreign currencies. As the mix of foreign currency cash flows generated by the
business changes over time, there may be a requirement to restructure our borrowings (via financial instruments or
other treasury products) to maintain this hedge. The Board reviews financial currency risk at least once a year.
The currency profile of cash balances of the Group at 30 September 2013 was as follows:
Cash at bank and in hand 2013 2012
£m £m
Sterling 85.2 76.5
Other currencies 96.9 85.7
182.1 162.2
The Group applies hedge accounting to cover the risk of foreign exchange differences arising between the functional
currency of the foreign operation and the parent entity’s functional currency i.e. Sterling. The designated exchange
risk is the spot foreign exchange risk because the hedging instruments are not derivatives, but foreign currency
denominated bank loans. The fair value of the bank loans used as hedging instruments was £358.8m as at 30
September 2013 (2012: £349.8m). There was no ineffectiveness recognised in the income statement arising from
hedges of net investments in foreign operations.
Interest rate risk
The Group has entered into a series of interest rate swaps in order to hedge its interest rate exposure from its
variable rate term loan facilities. The impact of all of these transactions is reflected in the table below.
The interest rate and currency profile of the Group’s bank loans at 30 September 2013, after taking into account
interest rate swaps and before adjustment for unamortised bank fees of £5.9m (2012: £7.6m), was as follows:
Floating rate
liabilities
Fixed rate
liabilities
Total
Total
2013 2012 2013 2012 2013 2012
£m £m £m £m £m £m
Currency
Sterling 38.2 86.5 270.3 222.0 308.5 308.5
Euro 58.5 163.0 402.2 276.1 460.7 439.1
US Dollar 11.8 20.7 85.2 76.5 97.0 97.2
Canadian Dollar 5.5 5.7 3.2 3.4 8.7 9.1
Swedish Krone 10.5 27.1 69.1 51.1 79.6 78.2
Norwegian Krone 13.2 36.6 86.9 68.9 100.1 105.5
137.7 339.6 916.9 698.0 1,054.6 1,037.6

SSP Group Limited
Annual Report and Financial Statements (Registered number: 05735966)
30 September 2013
50
Notes to consolidated financial statements (continued)
23 Financial instruments (continued)
(e) Financial risk management (continued)
Interest rate risk (continued) Fixed rate financial liabilities
Weighted average
interest rate
Weighted average time for
which rate is fixed in years
2013
%
2012
% 2013 2012
Currency
Sterling 4.4 3.8 1.6 2.3
Euro 4.2 3.6 1.6 2.3
US Dollar 4.1 3.5 1.6 2.3
Swedish Krone 5.3 4.7 1.6 2.3
Norwegian Krone 6.0 5.4 1.6 2.3
4.5 3.9 1.6 2.3
The fair value of the interest rate swaps was £5.4m as at 30 September 2013 (2012: £12.6m). There was no
ineffectiveness recognised in the income statement, the amount recognised within other comprehensive income
amounted to £6.7m (2012: £6.9m). This represented the effective portion of changes in the fair value of the interest
rate swaps.
Sensitivity analysis
A change of 50 basis points in interest rates at the balance sheet date would have increased / (decreased) equity by
the amounts shown in the table below. This calculation assumes that the change occurred at the balance sheet date
and had been applied to risk exposures existing at that date.
This analysis assumes that all other variables, in particular foreign currency rates, remain constant and considers the
effect of financial instruments with variable interest rates and the fixed rate element of interest rate swaps. The
analysis is performed on the same basis for the prior year.
2013 2012
£m £m
Equity
Increase 5.5 6.2
Decrease (5.6) (6.3)
(f) Capital management
The Board’s policy is to maintain a strong capital base so as to maintain investor, creditor and market confidence
and to sustain future development of the Group. The Group’s capital is represented by the share capital, reserves,
retained earnings and net debt. The capital of the Group is managed in accordance with its investment policy, in
pursuit of its investment objectives. As part of its banking arrangements, the Group has to comply with the financial
covenants including those in relation to liquidity, interest cover, debt cover and cash flow on a regular basis.
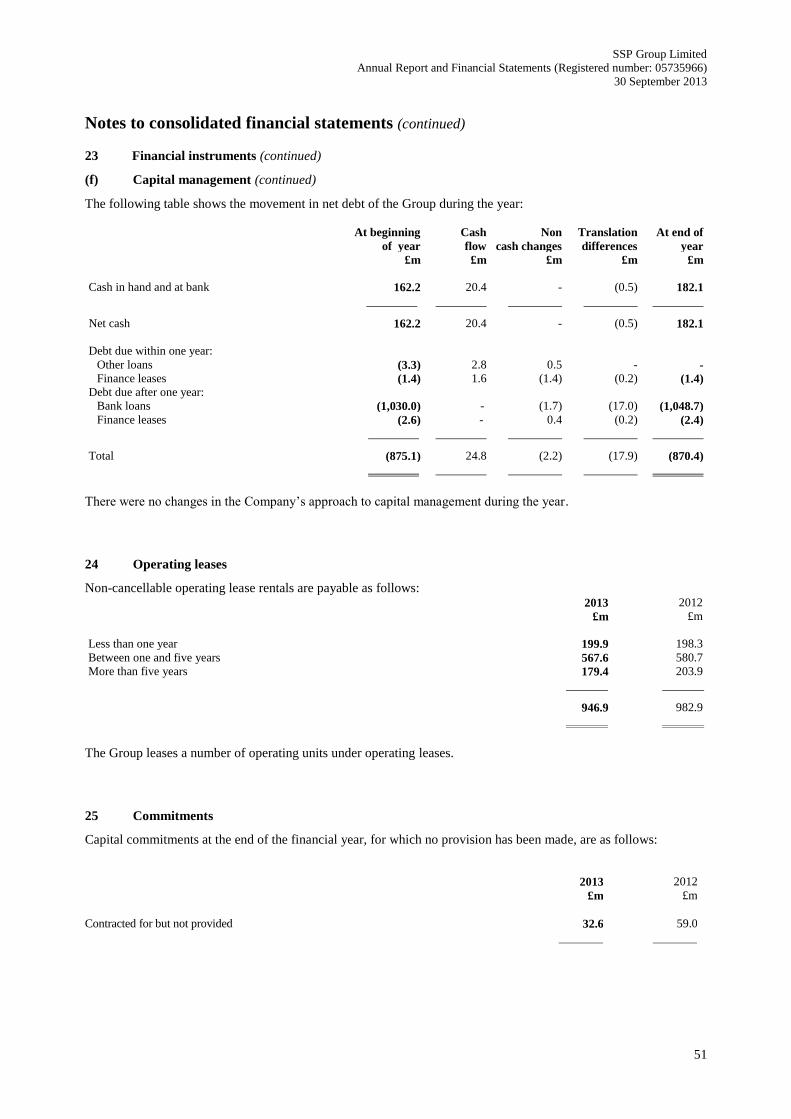
SSP Group Limited
Annual Report and Financial Statements (Registered number: 05735966)
30 September 2013
51
Notes to consolidated financial statements (continued)
23 Financial instruments (continued)
(f) Capital management (continued)
The following table shows the movement in net debt of the Group during the year:
At beginning
of year
Cash
flow
Non
cash changes
Translation
differences
At end of
year
£m £m £m £m £m
Cash in hand and at bank 162.2 20.4 - (0.5) 182.1
Net cash 162.2 20.4 - (0.5) 182.1
Debt due within one year:
Other loans (3.3) 2.8 0.5 - -
Finance leases (1.4) 1.6 (1.4) (0.2) (1.4)
Debt due after one year:
Bank loans (1,030.0) - (1.7) (17.0) (1,048.7)
Finance leases (2.6) - 0.4 (0.2) (2.4)
Total (875.1) 24.8 (2.2) (17.9) (870.4)
There were no changes in the Company’s approach to capital management during the year.
24 Operating leases
Non-cancellable operating lease rentals are payable as follows: 2013 2012
£m £m
Less than one year 199.9 198.3
Between one and five years 567.6 580.7
More than five years 179.4 203.9
946.9 982.9
The Group leases a number of operating units under operating leases.
25 Commitments
Capital commitments at the end of the financial year, for which no provision has been made, are as follows:
2013 2012
£m £m
Contracted for but not provided 32.6 59.0

SSP Group Limited
Annual Report and Financial Statements (Registered number: 05735966)
30 September 2013
52
Notes to consolidated financial statements (continued)
26 Related parties
Transactions with key management personnel
Directors of the Company control 0.3% (2012: 1.4%) of the voting shares of the Company.
The compensation of key management personnel (including the directors) is as follows:
2013 2012
£m £m
Key management emoluments including social security costs 1.3 2.8
Company contributions to money purchase pension schemes 0.1 0.1
Compensation for loss of office 2.2 -
3.6 2.9
Included in other creditors is an amount payable to key management personnel of £nil (2012: £1.5m) in relation to
long term incentive bonus schemes.
27 Ultimate controlling undertaking
The Company’s ultimate controlling undertaking is EQT IV Limited, a company registered in Guernsey, which acts
as General Partner of the limited partnership which acts as General Partner, Managing Limited Partner or Manager
to the funds which have a controlling interest in the Company.

SSP Group Limited
Annual Report and Financial Statements (Registered number: 05735966)
30 September 2013
53
Company balance sheet At 30 September 2013 Note 2013 2012
£m £m £m £m
Fixed assets
Investments III 105.0 105.0
Current assets
Debtors (including £100.0m (2012: 100.0m) due after
more than one year)
IV
111.7
112.2
Cash at bank and in hand 0.1 0.2
Creditors: amounts falling due within one year V - (0.5)
Net current assets 111.8 111.9
Net assets 216.8 216.9
Capital and reserves
Called up share capital VI 5.4 5.4
Share premium account VII 642.9 642.8
Profit and loss account VII (431.5) (431.3)
Shareholders’ funds 216.8 216.9
The notes from pages 55 to 57 form an integral part of these financial statements.
These financial statements were approved by the board of directors on 20 December 2013 and were signed on its
behalf by:
Vagn Soerensen Date: 20 December 2013
Director

SSP Group Limited
Annual Report and Financial Statements (Registered number: 05735966)
30 September 2013
54
Reconciliations of movements in company shareholders’ funds For the year ended 30 September 2013
2013 2012
£m £m
Loss for the financial year
Premium on shares issued
(0.2)
0.1
(0.3)
-
Net reduction in shareholders’ funds (0.1) (0.3)
Shareholders’ funds at beginning of year 216.9 217.2
Shareholders’ funds at end of year 216.8 216.9

SSP Group Limited
Annual Report and Financial Statements (Registered number: 05735966)
30 September 2013
55
Notes to the company financial statements
I Accounting policies
The following accounting policies have been applied consistently in dealing with items which are considered
material in relation to the financial statements, except as noted below.
Basis of preparation
The financial statements have been prepared in accordance with applicable United Kingdom accounting standards
under the historical cost accounting rules.
SSP Group Limited is the ultimate parent company of the SSP Group. The financial statements of SSP Group
Limited for the year ended 30 September 2013 have been prepared on a going concern basis, having regard to the
SSP Group’s trading forecasts for the next twelve months as highlighted in the SSP Group’s directors’ report on
page 9.
Notwithstanding the above however, there remains a risk that a further downturn in the global economy could result
in passenger numbers and consumer spending in the travel market which are worse than the Board is currently
envisaging. As a result, the directors have also reviewed forecasts which include sensitivities that make allowance
for this risk. Should such a scenario arise the directors are confident they have adequate liquidity and covenant head
room to ensure that the SSP Group can meet its liabilities as they fall due for the foreseeable future. Accordingly,
the directors believe that it is appropriate to prepare these financial statements on a going concern basis.
Under section s408 of the Companies Act 2006 the Company is exempt from the requirement to present its own
profit and loss account.
Under FRS 1 (revised) “Cash Flow Statements”, the Company is exempt from the requirements to prepare a cash
flow statement as its cash flows are included within the published consolidated cash flow statement of SSP Group
Limited.
The Company is also exempt under the terms of Revised FRS 8 “Related Party Disclosures” from disclosing related
party transactions with wholly-owned subsidiaries within the Group.
Investments
Investments in subsidiaries are stated at cost less provision for impairment losses.
Impairment
The carrying values of the Company’s assets are reviewed for impairment when events or changes in circumstances
indicate that the carrying amount of the fixed asset may not be recoverable. If any such indication exists, the asset’s
recoverable amount is estimated. An impairment loss is recognised whenever the carrying amount of an asset
exceeds its recoverable amount.
Taxation
The charge for taxation is based on the results for the year and takes into account taxation deferred because of
timing differences between the treatment of certain items for taxation and accounting purposes. Tax is recognised in
the profit and loss account except where it relates to items taken directly to equity, in which case it is recognised in
equity. Deferred tax is recognised in respect of all timing differences between the treatment of items for taxation and
accounting purposes which have arisen but not reversed by the balance sheet date, except as otherwise required by
FRS 19. The company has not adopted a policy of discounting deferred tax balances as permitted by FRS 19.
Deferred tax assets are recognised to the extent that it is regarded as more likely than not that they will be recovered.
II Remuneration of directors
2013 2012
£m £m
Directors’ emoluments 0.1 0.1
The directors are not members of any Group pension schemes.
The average number of persons employed by Company (including directors) during the year was 5 (2012: 5).

SSP Group Limited
Annual Report and Financial Statements (Registered number: 05735966)
30 September 2013
56
Notes to the company financial statements (continued)
III Fixed asset investments
Shares in
group
undertaking
£m
Cost
At beginning and end of the year 522.8
Provisions
At beginning and end of the year (417.8)
Net book value
At 30 September 2013 and at 30 September 2012 105.0
IV Debtors
2013 2012
£m £m
Amount receivable from Group undertakings 111.7 112.2
V Creditors
2013 2012
£m £m
Other creditors - 0.5
VI Called up share capital 2013 2012
£m £m
Issued, called up and fully paid
19,999,999 Ordinary shares of £0.01 each 0.2 0.2
200,000 Preferred Ordinary shares of £0.01 each - -
99,831,700 Class B Preference shares of £0.01 each 1.0 1.0
417,670,000 Deferred Ordinary shares of £0.01 each 4.2 4.2
5.4 5.4

SSP Group Limited
Annual Report and Financial Statements (Registered number: 05735966)
30 September 2013
57
Notes to the company financial statements (continued)
VII Share premium and reserves
Share premium Profit and loss 2013 2012 2013 2012
£m £m £m £m
At beginning of the year 642.8 642.8 (431.3) (431.0)
Premium on shares issued in the year
Loss for the year
0.1
-
-
- -
(0.2)
-
(0.3)
At end of the year 642.9 642.8 (431.5) (431.3)
VIII Contingent liabilities
The Company is a member of a VAT group and consequently is jointly liable for the VAT group’s liability. The
Company’s contingent liability at 30 September 2013 was approximately £7.7m (2012: £6.1m).
IX Ultimate parent undertaking and controlling party
The Company’s ultimate controlling undertaking is EQT IV Limited, a company registered in Guernsey, which acts
as General Partner of the limited partnership which acts as General Partner, Managing Limited Partner or Manager
to the funds which have a controlling interest in the Company.