ssni q115-earnings-slides v001-d0mwd6
TRANSCRIPT

© 2015 Silver Spring Networks 1 © 2015 Silver Spring Networks
Q115 Earnings Call May 7, 2015
© 2015 Silver Spring Networks 2
This document contains forward-looking statements that involve risks and uncertainties. These forward-looking statements include statements regarding the momentum in Silver Spring Networks’ business, future growth and future financial results, including expected improvements in gross profit and our outlook for the second quarter and full year 2015. Statements including words such as "anticipate", "believe", "estimate" or "expect" and statements in the future tense or about future events are forward-looking statements. These forward-looking statements are preliminary estimates and expectations based on current information and are subject to business and economic risks and uncertainties that could cause actual events or actual future results to differ materially from the expectations set forth in the forward-looking statements. Important factors that could cause results to differ materially from the statements herein include: timing around customer decisions and deployment pace; dependence on a limited number of customers and key suppliers; general economic risks; specific economic risks in different geographies and among different industries; failure to maintain or increase renewals and increase business from existing customers; uncertainties around continued success in sales growth and market share gains; lengthy sales cycles with no assurances that a prospective customer will select Silver Spring’s products and services; amounts included in backlog may not result in billings or revenue; adverse publicity about, or consumer or political opposition to, the smart grid; security breaches involving smart grid products or services; the ability to integrate technology into third-party devices and Silver Spring’s relationship with third-party manufacturers; execution and customer adoption risks related to new product introductions and innovation, including our recently announced fifth generation networking platform and products; the ability to attract and retain personnel, including members of Silver Spring’s management team; changes in strategy; technological changes that make Silver Spring’s products and services less competitive; competition, particularly from larger companies with more resources than Silver Spring; international business uncertainties; the ability to acquire and integrate other businesses; and other risk factors set forth from time to time in Silver Spring’s filings with the SEC, copies of which are available free of charge at the SEC’s website at www.sec.gov.
All forward-looking statements in this document reflect Silver Spring’s expectations as of May 7, 2015. Silver Spring undertakes no obligation, and expressly disclaims any obligation, to update any forward-looking statements in this document in light of new information or future events.
In addition, the preliminary financial results set forth in this document are estimates based on information currently available to Silver Spring. While Silver Spring believes these estimates are meaningful, they could differ from the actual amounts that Silver Spring ultimately reports in its Quarterly Report on Form 10-Q for the quarter ended March 31, 2015. Silver Spring assumes no obligation and does not intend to update these estimates prior to filing its Form 10-Q for the quarter ended March 31, 2015.
Forward-Looking Statements

© 2015 Silver Spring Networks 3
• Q1 Ahead of Plan
• Our Business Model is Succeeding
- 40.3% gross margin
- Double-digit growth of Silver Spring content
- New solutions up 60% from prior year
- Managed services & SaaS above $50 million run-rate
• Silver Spring Powering Leading Smart Grid Deployments
• Five New International Signings
State of the Business

© 2015 Silver Spring Networks 4 © 2015 Silver Spring Networks
Q115 Financial Review
Jim Burns, Chief Financial Officer

© 2015 Silver Spring Networks 5
Q114 Q115
$72$63
Q114 Q115
18.720.8
Q114 Q115
$9 $15
$62 $48
Q114 Q115
Q115 Financial Results Non-GAAP Revenue Network Footprint (Cumulative Endpoints)
$Millions, Endpoints in Millions
Non-GAAP Revenue by Type Non-GAAP Revenue by Solution
Services*
Product*
AMI
New Solutions
Note: Some figures may not add due to rounding * Excludes 3rd-Party
+11% Double Digit Growth
SSN Content*
3rd-Party
3rd-Party

© 2015 Silver Spring Networks 6
$9 $10
$11 $13
$20 $22
Q114 Q115
30.0%
40.3%
Q114 Q115
Executing on our Business Model Non-GAAP New Solutions Revenue Non-GAAP Services Revenue
$Millions, except Recurring Revenue per Cuml. Endpoint
+10.3 pts
Note: Some figures may not add due to rounding * TTM refers to the trailing twelve month period
Managed/SaaS
Prof. Services
$2.15 $2.24
Q114 Q115
TTM*
+19% $9
$15
Q114 Q115
+60%
Recurring Revenue per Cuml. Endpoint Non-GAAP Gross Margin
+5%
+13%
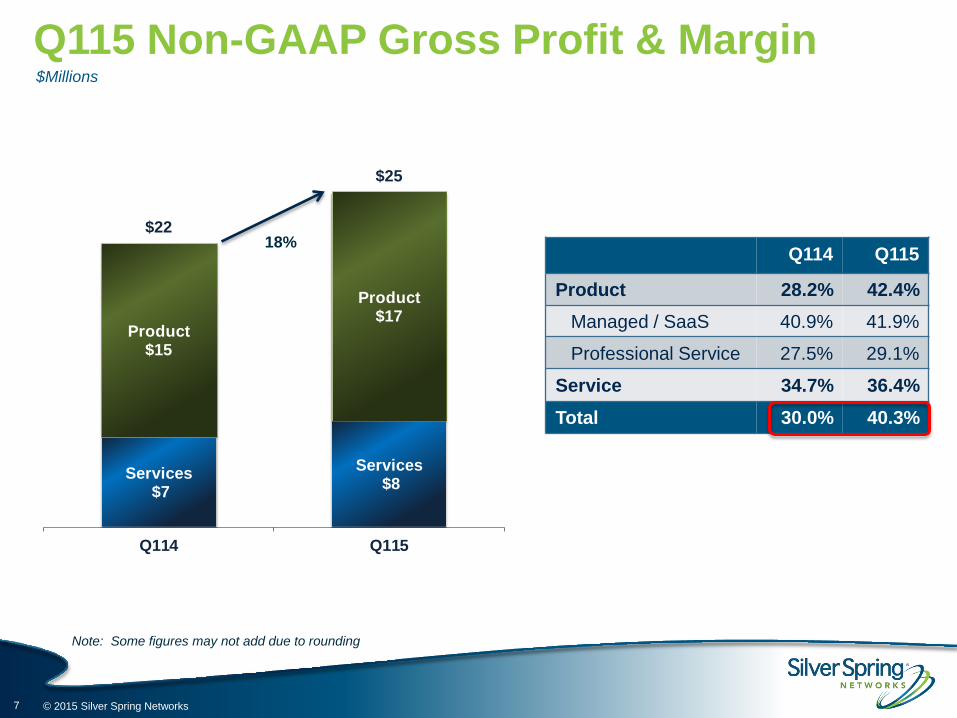
© 2015 Silver Spring Networks 7
Services$7
Services$8
Product$15
Product$17
$22
$25
Q114 Q115
Q115 Non-GAAP Gross Profit & Margin $Millions
Note: Some figures may not add due to rounding
Q114 Q115
Product 28.2% 42.4% Managed / SaaS 40.9% 41.9%
Professional Service 27.5% 29.1%
Service 34.7% 36.4% Total 30.0% 40.3%
18%

© 2015 Silver Spring Networks 8
$121 $111
Q414 Q115
$(9)
$(6)
Q114 Q115
$(0.19)
$(0.11)
Q114 Q115
Q115 Financial Results Non-GAAP Operating Expenses Non-GAAP EPS
$Millions, except EPS
Non-GAAP Net Loss Cash & Equivalents
+$0.08
+$3M
Note: Some figures may not add due to rounding
$7 $8
$15 $14
$8 $10
$30 $31
Q114 Q115
Detectent acquisition
G&A
S&M
R&D
© 2015 Silver Spring Networks 9
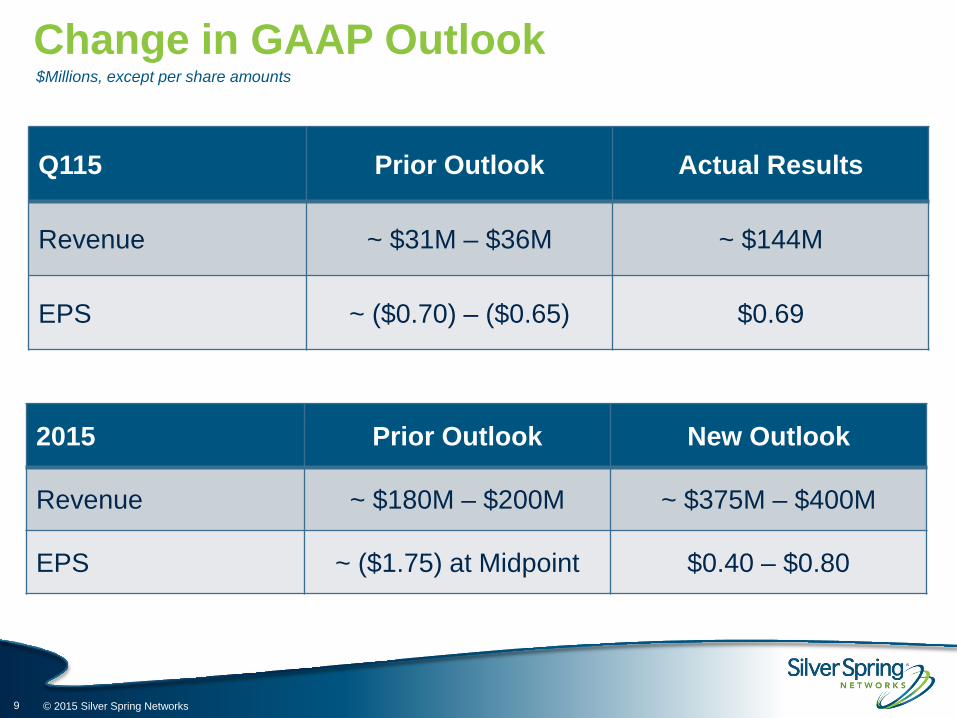
Change in GAAP Outlook $Millions, except per share amounts
Q115 Prior Outlook Actual Results
Revenue ~ $31M – $36M ~ $144M
EPS ~ ($0.70) – ($0.65) $0.69
2015 Prior Outlook New Outlook
Revenue ~ $180M – $200M ~ $375M – $400M
EPS ~ ($1.75) at Midpoint $0.40 – $0.80

© 2015 Silver Spring Networks 10
Non-GAAP Outlook $Millions, except per share amounts
Q215 2015
Revenue ~ $65M – $70M ~ $270M – $290M
Gross Margin ~ 39% – 41% ~ 39% – 41%
Operating Expenses $29M – $30M Flat to Slightly Up Y/Y
Income Taxes ~ $0.5M ~$2.0M*
Earnings per Share ~ ($0.08) – ($0.04) ~ ($0.05) at the midpoint
Share Count ~ 50M ~ 50M – 52M
Note: Some figures may not add due to rounding * Excludes one-time Detectent tax benefit

© 2015 Silver Spring Networks 11 © 2015 Silver Spring Networks
Silver Spring Networks Q&A

© 2015 Silver Spring Networks 12 © 2015 Silver Spring Networks
Supplemental

© 2015 Silver Spring Networks 13
Silver Spring believes that its results of operations under generally accepted accounting principles, or GAAP, when considered in isolation, may only provide limited insight into the performance of its business in any given period. As a result, Silver Spring manages its business, makes planning decisions, evaluates its performance and allocates resources by assessing non-GAAP measures such as non-GAAP revenue, recurring non-GAAP revenue, recurring non-GAAP revenue per endpoint, cost of non-GAAP revenue, non-GAAP gross profit (loss), non-GAAP gross margin, non-GAAP operating income (loss), non-GAAP net income (loss), non-GAAP earnings (loss) per share, and adjusted EBITDA, and total backlog, in addition to other financial measures presented in accordance with GAAP. Silver Spring believes that these non-GAAP and other financial measures offer valuable supplemental information regarding the performance of its business, and will help investors better understand the sales volumes, and gross margin and profitability trends, as well as the cash flow characteristics, of its business. The non-GAAP measures should not be considered in isolation from, are not a substitute for, and do not purport to be an alternative to, revenue, cost of revenue, gross profit (loss), gross margin, operating income (loss), net income (loss), earnings (loss) per share or any other performance measure derived in accordance with GAAP. Silver Spring may consider whether other significant non-recurring items that arise in the future should also be excluded in calculating the non-GAAP financial measures it uses.
Non-GAAP revenue represents amounts invoiced for products for which ownership, typically evidenced by title and risk of loss, has transferred or services that have been provided to the customer, and for which payment is expected to be made in accordance with normal payment terms. Non-GAAP revenue excludes amounts for undelivered products, services to be performed in the future, and amounts paid or payable to customers. Non-GAAP revenue is initially recorded as deferred revenue and is recognized as revenue when all revenue recognition criteria have been met under Silver Spring’s accounting policies as described in Silver Spring’s filings with the Securities and Exchange Commission. Silver Spring reconciles revenue to non-GAAP revenue by adding revenue to the change in deferred revenue in a given period.
Recurring non-GAAP revenue is non-GAAP revenue from managed services and SaaS, as well as customer support and other service offerings. Recurring non-GAAP revenue is primarily recurring in nature and includes managed services, hosting and software maintenance, and support fees, as well as one-time managed services and SaaS set up fees. Customer support and other services are provided to customers outside of managed and SaaS offerings, and are also recurring in nature.
Recurring non-GAAP revenue per endpoint represents a trailing twelve month non-GAAP revenue per cumulative endpoints deployed inception-to-date.
Cost of non-GAAP revenue represents the cost associated with products and services that have been delivered to the customer, excluding stock-based compensation, amortization of intangibles, and acquisition-related charges. Cost of product shipments for which revenue is not recognized in the period incurred is recorded as deferred cost of revenue. Deferred cost of revenue is expensed in the statement of operations as cost of revenue when the corresponding revenue is recognized. Costs related to services are expensed in the period incurred. Silver Spring reconciles cost of revenue to cost of non-GAAP revenue by adding cost of revenue and the change in deferred cost of revenue, less stock-based compensation, amortization of intangibles, and acquisition-related charges included in cost of revenue, in a given period.
Non-GAAP gross profit (loss) is the difference between non-GAAP revenue and cost of non-GAAP revenue. Non-GAAP gross margin is non-GAAP gross profit (loss) as a percentage of non-GAAP revenue.
Non-GAAP operating income (loss) represents operating loss adjusted for non-GAAP revenue and cost of non-GAAP revenue and excludes expenses related to the amortization of intangible assets, stock-based compensation, acquisition-related charges, restructuring and legal settlements.
Non-GAAP net income (loss) represents net income (loss) adjusted for changes in deferred revenue and deferred cost of revenue, and excludes expenses related to the amortization of intangible assets, stock-based compensation, acquisition-related charges, income tax benefit related to acquisitions, restructuring, and legal settlements.
Non-GAAP income (loss) per share represents non-GAAP net income (loss) divided by weighted average shares outstanding for the period.
Adjusted EBITDA is net income (loss) adjusted for changes in deferred revenue and deferred cost of revenue, other (income) expense, net, (benefit) provision for income taxes, depreciation and amortization, stock-based compensation, acquisition-related charges, restructuring, legal settlements, and certain other items management believes affect the comparability of operating results.
Non-GAAP and Other Financial Measures

© 2015 Silver Spring Networks 14
Services Reclassification
* TTM refers to the trailing twelve month period
$M, Non-GAAPQ114A Q214A Q314A Q414A Q115A Q114A Q214A Q314A Q414A Q115A
Services Revenue 19.6$ 21.4$ 21.3$ 20.3$ 22.1$ 19.6$ 21.4$ 21.3$ 20.3$ 22.1$ Professional Services 9.6 11.0 10.6 9.6 10.3 9.1 10.5 9.8 8.8 9.5 Managed Services 10.0 10.4 10.7 10.7 11.8 10.5 10.9 11.5 11.6 12.6
Gross Profit 6.8 8.1 7.3 8.4 8.0 6.8 8.1 7.3 8.4 8.0 Professional Services 2.7 3.7 2.7 3.5 3.2 2.5 3.4 2.2 3.0 2.8 Managed Services 4.1 4.5 4.6 4.9 4.8 4.3 4.7 5.2 5.5 5.3
Gross Margin 34.7% 37.9% 34.3% 41.5% 36.4% 34.7% 37.9% 34.3% 41.5% 36.4%Professional Services 28.4% 33.2% 25.3% 36.8% 31.2% 27.5% 32.5% 22.0% 33.9% 29.1%Managed Services 40.7% 43.0% 43.2% 45.7% 40.9% 40.9% 43.1% 44.8% 47.2% 41.9%
Endpoints 526 371 633 552 548 526 371 633 552 548 Cumulative Endpoints 18,710 19,081 19,714 20,266 20,814 18,710 19,081 19,714 20,266 20,814
Mgd Svcs TTM Revenue 38.3$ 39.4$ 40.2$ 41.8$ 43.5$ 40.2$ 41.6$ 42.7$ 44.5$ 46.5$
Recurring Rev per Cuml. EP 2.05$ 2.07$ 2.04$ 2.06$ 2.09$ 2.15$ 2.18$ 2.16$ 2.20$ 2.24$
Prior Reclassed

© 2015 Silver Spring Networks 15
GAAP Financial Statements
Change in Deferred Revenue and Deferred
Cost of RevenueStock-based
CompensationAmortization of
IntangiblesRestructuring &
Litigation Acquisition
Related Costs
Non-GAAP Financial
Information
Product revenue 105,035$ (64,033)$ -$ -$ -$ -$ 41,002$ Service revenue 38,605 (16,508) - - - 22,097
Net revenue 143,640 (80,541) - - - 63,099
Product cost of revenue 56,617 (32,516)$ (228) (262) - - 23,611 Service cost of revenue 15,568 - (1,495) - - (11) 14,062
Total cost of revenue 72,185 (32,516) (1,723) (262) - (11) 37,673
Gross profit 71,455 (48,025) 1,723 262 - 11 25,426 Product Margin 46.1% 42.4%Service Margin 59.7% 36.4%Total Margin 49.7% 40.3%
Operating Expenses Research and development 15,694 - (2,180) - - (4) 13,510 Sales and marketing 9,297 - (1,238) (140) - - 7,919 General and administrative 12,129 (1,882) (7) - (720) 9,520 Restructuring 194 - - (194) - -
Total operating expenses 37,314 - (5,300) (147) (194) (724) 30,949
Operating Loss 34,141 (48,025) 7,023 409 194 735 (5,523) Operating Margin 23.8% -8.8%
Other income (expense), net 288 - - - - - 288 (Benefit) Provision for income taxes (476) - - - - 890 414
Net loss 34,905$ (48,025)$ 7,023$ 409$ 194$ (155)$ (5,649)$ Income (Loss) per shareBasic 0.71$ (0.11)$ Diluted 0.69$ (0.11)$ Number of shares used in computationBasic 49,306 49,306 Diluted 50,899 49,306
Q115 GAAP to Non-GAAP Reconciliation $Thousands, except per share amounts
Note: Some figures may not add due to rounding * Net of Foreign Currency Translation

© 2015 Silver Spring Networks 16
GAAP Financial Statements
Change in Deferred Revenue and Deferred
Cost of RevenueStock-based
CompensationAmortization of
Intangibles
Change in Fair Value of Warrant and Derivatives
Litigation and Restructuring
Non-GAAP Financial
Information
Product revenue 28,227$ 24,006$ -$ -$ -$ -$ 52,233$ Service revenue 16,002 3,615 - - - 19,617
Net revenue 44,229 27,621 - - - 71,850
Product cost of revenue 17,915 20,257 (632) (48) - - 37,492 Service cost of revenue 14,870 - (2,060) - - - 12,810
Total cost of revenue 32,785 20,257 (2,692) (48) - - 50,302
Gross profit 11,444 7,364 2,692 48 - - 21,548 Product Margin 36.5% 28.2%Service Margin 7.1% 34.7%Total Margin 25.9% 30.0%
Operating Expenses Research and development 17,725 - (3,155) - - - 14,570 Sales and marketing 9,223 - (2,045) - - - 7,178 General and administrative 11,667 - (3,540) - - - 8,127
Total operating expenses 38,615 - (8,740) - - - 29,875
Operating Loss (27,171) 7,364 11,432 48 - - (8,327) Operating Margin -61.4% -11.6%
Other expense, net (37) - - - - - (37) Provision for income taxes 599 - - - - - 599
Net loss (27,807)$ 7,364$ 11,432$ 48$ -$ -$ (8,963)$
Loss per share, basic and diluted (0.58)$ (0.19)$
Number of shares used in computation, basic and diluted
47,693 47,693
Q114 GAAP to Non-GAAP Reconciliation $Thousands, except per share amounts
Note: Some figures may not add due to rounding * Net of Foreign Currency Translation

© 2015 Silver Spring Networks 17
GAAP Outlook $Millions, except per share amounts
Q215 2015
Revenue ~ $45M – $55M ~$375M – $400M
Gross Margin ~ 33% – 36% ~ 42% – 45%
Operating Expenses ~ $34M – $35M ~ $134M – $140M
Income Taxes ~ $0.5M ~ $1M*
Earnings per Share ~ ($0.40) – ($0.30) ~ $0.40 – $0.80
Share Count 50M – 52M 50M – 52M
Note: Some figures may not add due to rounding * Includes one-time Detectent tax benefit

© 2015 Silver Spring Networks 18
Outlook Reconciliation $Millions, except per share amounts
Note: Some figures may not add due to rounding
Low High Low HighNet revenue
GAAP net revenue 45$ 55$ 375$ 400$ Change in deferred revenue, net of foreign currency translation 20 15 (105) (110)
Non-GAAP net revenue 65$ 70$ 270$ 290$
Gross profitGAAP gross profit (loss) 15$ 18$ 156$ 182$
Change in deferred revenue, net of foreign currency translation 20 15 (105) (110) Change in deferred cost of revenue, net of foreign currency translation (11) (6) 48 40 Stock-based compensation 2 2 7 7
Non-GAAP gross profit 25$ 29$ 105$ 119$ GAAP gross margin % (as a % of GAAP net revenue) 33% 33% 42% 45%Non-GAAP gross margin % (as a % of non-GAAP net revenue) 39% 41% 39% 41%
Net income (loss)GAAP net loss (21)$ (17)$ 21$ 41$
Change in deferred revenue, net of foreign currency translation 20 15 (105) (110) Change in deferred cost of revenue, net of foreign currency translation (11) (6) 48 40 Stock-based compensation, Amortization of Intangibles, Other* 8 6 31 28
Non-GAAP net income (loss) (4)$ (2)$ (5)$ 0$
Net loss per shareGAAP loss per share (0.40)$ (0.30)$ 0.40$ 0.80$ Non-GAAP loss per share (0.08)$ (0.04)$ (0.10)$ 0.00$
Basic Share Count 50 50 50 50 Diluted Share Count 52 52 52 52
* Stock-based compensation, Amortization of Intangibles, Other also include Acquisition-Related and Restructuring Charges
2015 GuidanceQ215 Guidance