ssis sql hb_li
TRANSCRIPT


Slide Contents
3 SQL Server Integration Services (SSIS)
8 SQL Programming 15 SQL Server Analysis Services
(SSAS) 22 SharePoint Server 25 MDX Programming
This portfolio contains examples of my business intelligence projects using Microsoft BI Product Stack.

SQL Server Integration Services (SSIS)
3

A new database “All Works” is setup as the staging area for the ETL process. A thorough understanding of the relationships between the tables in the following data diagram is important in determining the sequence of tables to be loaded and in enforcing referential integrity.
4

A Script Task is utilized to maintain multiple sets of variables with scripts in C#, for instance, one for keeping track of row counts of data processed dynamically at the
folder level, one for row counts at the file level.

One SSIS package is created to do ETL for one target table. The following illustrates the data processing within the Job Timesheets package: the data process pipeline starts by extracting data from a CSV file. The data is then conversed, processed and transformed (filter, remove duplicates, lookups, validate) as it passes through the pipeline, and is finally loaded into the target job timesheets table either as inserts or updates. It logs any rows that error out for review and correction. Similarly, seven more packages are generated for seven target tables.
6

7
A Sequence Container is deployed to run the eight ETL packages in sequence based on the relationships between the tables in the “All Works” Database to ensure referential integrity. If the eight packages are processed successfully, data maintenance tasks are performed. A success or failure notice email will be sent out depending on whether the data maintenance tasks are all successfully completed or not.A Master Package is created to contain the Sequence Container, the maintenance tasks and the email notices; then a SQL Server Agent Job is setup to run the Master Package on a predefined schedule to automate the entire data processing procedure.

SQL ProgrammingSQL Programming covers a broad range of content: Data Types and Variables, Specialized Functions, Stored Procedures, Control-Of-Flow Operations, Error Handling, Etc. Due to time/space constraints, I will illustrate only some of the relatively new SQL functions/procedures/ programs that I have used in my projects in the following: 1. Data Modification: OUTPUT clause, MERGE, select TOP(with ties) option 2. Aggregation: RANK() OVER (Partition by), GROUPING SETS 3. SQL Functions: PIVOT, CROSS APPLY4. Common Table Expression (CTE), Correlated and Recursive Queries 5. User Defined Functions (UDF) that returns TABLE type 6. Error Handling Program: Begin Try...End Try Begin Catch...End Catch

Upper: OUTPUT clause, MERGE to update and Insert data Lower: Common Table Expression (CTE), RANK () OVER

GROUPING SETS

User Defined Function (UDF) that returns Table type, select TOP with Ties, CROSS APPLY
User Defined Function (UDF) that returns Table type, select TOP with Ties, CROSS APPLY

CTE & Recursive Query

CTE & Pivot

Error Handling with “Begin TRY… End Try Begin Catch…End Catch”

SQL Server Analysis Services (SSAS)
15

16
The Development and Deployment of the All Works SSAS Cube Data Source View of the Star Schema
17
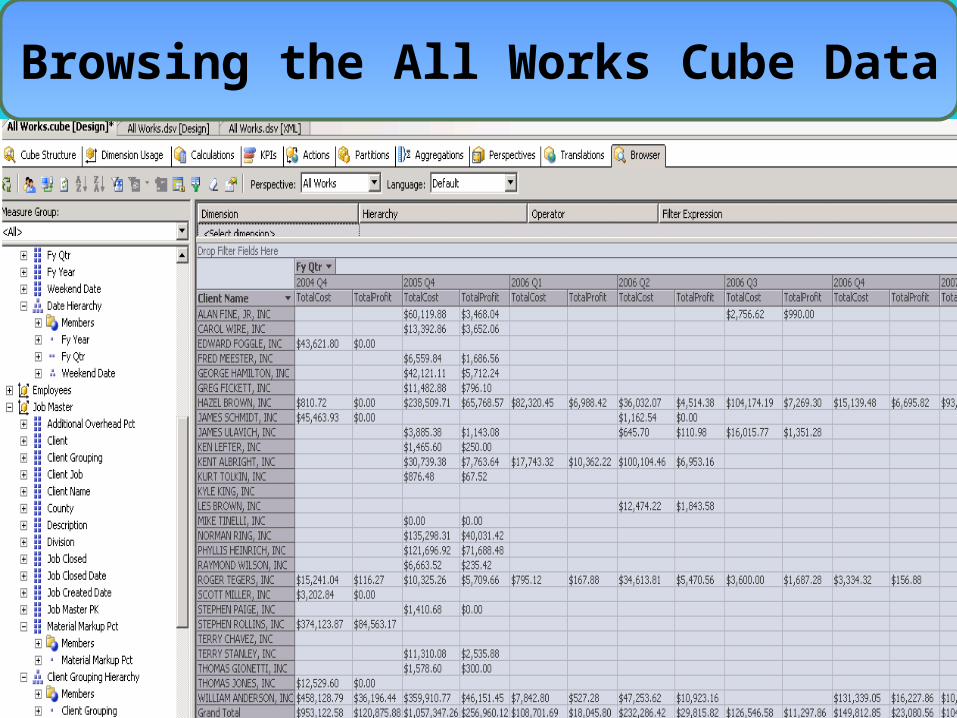
Browsing the All Works Cube Data

18
Definition of Calculated Members

19
Definition of Key Performance Indicators (KPIs)

20
This is an example of a KPI developed from the AllWorks.cube, which is deployed to the Excel Spreadsheet for the end users. All the data in the cube, including all KPIs,
can be explored through the Pivot Table Field List.
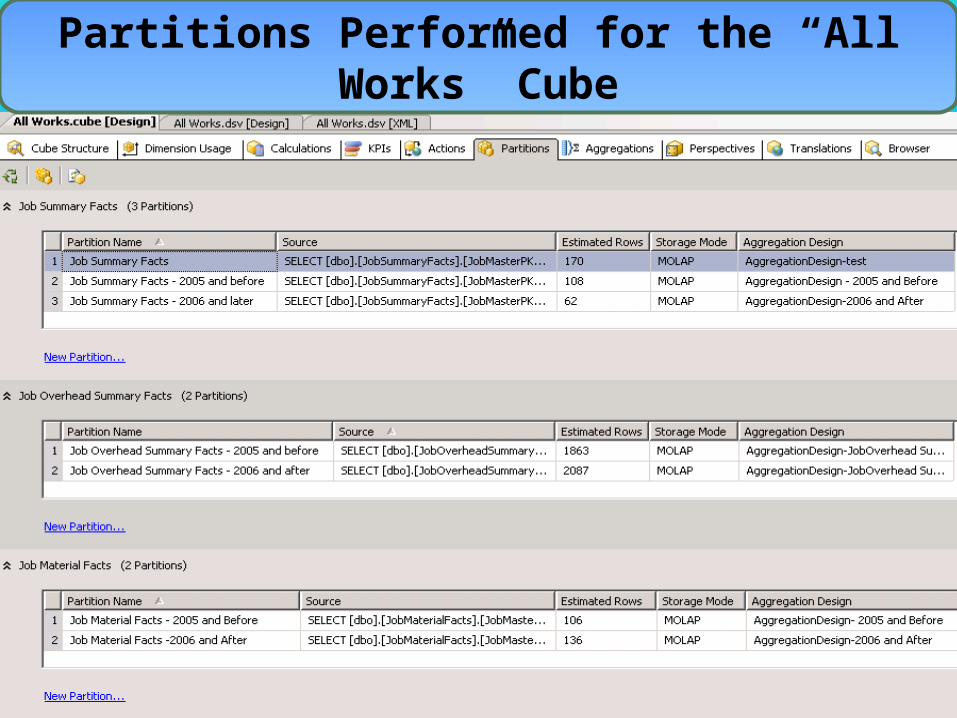
Partitions Performed for the “All Works” Cube

SharePoint Server
22

Employee Labor Report Deployed to a SharePoint Server

configure security settings: give users/groups appropriate permissions.
MDX Programming
25

MDX query for the primary dashboard (Slide 15 and 16 in SSRS Section)

This MDX Query shows two measures, Internet Sales Amount and Internet Freight Cost, are sliced against three dimensions:
Date (FY Year), Product and Customer (Country)

---The End---
Hong-Bing Li, February, 2015
Thank you for viewing this presentation!