ss attitudinal precedents in the adoption and usage
TRANSCRIPT

ss
ATTITUDINAL PRECEDENTS IN THE ADOPTION AND USAGE CONTINUANCE OF TECHNOLOGY ENABLED BANKING SELF-SERVICES: A STUDY
AMONG BANK CUSTOMERS IN KERALA
Thesis Submitted to Cochin University of Science and Technology
for the award of the Degree of Doctor of Philosophy
under the Faculty of Social Sciences
by
RAJISHA T. Reg. No. 4683
Under the Supervision of
Dr. S. RAJITHA KUMAR Professor
SCHOOL OF MANAGEMENT STUDIES
COCHIN UNIVERSITY OF SCIENCE AND TECHNOLOGY Kochi - 682 022
January 2020

Attitudinal Precedents in the Adoption and Usage Continuance of Technology Enabled Banking Self-services: A Study among Bank Customers in Kerala
Ph. D. Thesis under the Faculty of Social Sciences
Submitted by
Rajisha T. Research Scholar School of Management Studies Cochin University of Science and Technology Cochin - 682 022, Kerala, India email: [email protected]
Supervising Guide
Dr. S. Rajitha Kumar Professor School of Management Studies Cochin University of Science and Technology Cochin - 682 022, Kerala, India email: [email protected]
School of Management Studies Cochin University of Science and Technology Kochi - 682 022
January 2020

I, Rajisha T., hereby declare that the thesis entitled “Attitudinal
Precedents in the Adoption and Usage Continuance of Technology Enabled Banking Self-services: A Study among Bank Customers in Kerala” is a record of bonafide research work done by me under the
supervision and guidance of Dr. S. Rajitha Kumar, Professor, School of
Management Studies for the award of the Degree of Doctor of Philosophy
under the Faculty of Social Sciences. I further declare that no part of the
thesis has been presented before for the award of any Degree, Diploma,
Associateship, Fellowship or any other title of any University or Board.
Place: Kochi Rajisha T. Date:


Date:………………..
This is to certify that the thesis entitled “Attitudinal Precedents in the Adoption and Usage Continuance of Technology Enabled Banking Self-services: A Study among Bank Customers in Kerala” submitted by Ms. Rajisha T. to the Cochin University of Science and Technology, for the award of the Degree of Doctor of Philosophy under the Faculty of Social Sciences, to the best of my knowledge and belief, is a record of bonafide research work carried out by her under my supervision and guidance. All the relevant corrections and modifications suggested by the audience during pre-submission seminar and recommended by the Doctoral Committee have been incorporated in the thesis.
She is permitted to submit the thesis.
Dr. S. Rajitha Kumar (Supervising Guide)


Thasmai Shri Gurave Namah!!!
At this moment of accomplishment, I am grateful to the God Almighty, who enlightened me with strength and blessings during the course of this research study. It is with a profound sense of gratitude and pleasure, I acknowledge the invaluable contributions of my teachers, family members and friends to make this research a reality.
First of all, I wish to place on record my indebtedness and deep hearted gratitude to my research guide Prof. (Dr) S. Rajitha Kumar for his inspiring and systematic guidance without which this research would never have been completed. Words are inadequate to express my heartfelt thanks to him for his continuous support and motivation throughout the period of this study. I thank him for all his contributions of time, great advices and encouragements with constructive suggestions which enabled me to develop as an independent researcher. His guidance helped me in all the time of research and writing of this thesis. I could not have imagined a better advisor and mentor for my study.
My sincere thanks to Dr. Sebastian Rupert Mampilly former Professor at School of Management Studies and my Doctoral committee member, for his invaluable suggestions and advices. His assistance during research methodology sessions at the time of course work has helped me in different stages of this research work.
I am greatly indebted to Prof. (Dr) D. Mavoothu, Director, School of Management Studies, Cochin University of Science and Technology, for the supports and encouragements extended to me. I would like to acknowledge Prof. (Dr) Harikumar, Dean, Faculty of Social Sciences. I also thank all other faculty members, office and library staffs of School of Management Studies, for the enduring support and co-operation during the course of this study.

My special thanks to all my fellow research scholars for their moral support and encouragement. I would like to specially mention Dr. Sangeetha Krishnan, Mrs. Neenu Wilson, Mrs. Sajida P, Dr. Anoopa Narayanan, Dr. Veeva Mathew, Ms. Sreya R., Dr. Praveena K., Dr. Manesh N.A., Ms. Shyni V.K., Ms. Natasha P., Mrs. Anju Philip, Mrs. Vinney, Mrs. Nimmy for their supports and assistances at many stages of this research work. I wish to express my sincere gratitude to Dr. M. Sarngadharan, Prof. Sasidharan and Mr. Preman E.K. for their valuable support for this research work. I would like to specially mention my dear friends Dr. Dhanya K.P, Ms. Shyja K, Ms. Prasra S, Ms. Anupama, Ms. Aishwarya and my dear friends at Athulya Hostel for their patronage and love that strengthened me to overcome all the struggles during this period. I am extremely thankful to all the respondents from whom the data was collected, for their valuable time and patience in responding to the questionnaire.
I am grateful to my father Mr. Kanaran T. for his instinct support and encouragement, my mother Mrs. Ajitha K., for her prayers and continued faith which made the journey possible to me. My heartfelt gratitude to my husband Mr. Aji. M.P for his unconditional support and inspiration which helped me to sustain in this academic journey. I express my sincere thanks to my sister Reshma and all other family members, in-laws, and friends for their support, motivation and encouragements. I also acknowledge the contributions of those whose name has not been mentioned here, but who have nevertheless played their part in making this research a reality.
Above all, I thank God for all the blessings and kindness showered on me throughout my life.
Rajisha T.
Chapter 11 INTRODUCTION ............................................................................... 01 - 29
1.1 Technology Adoption in Banking Sector- An Overview ............. 01 1.2 Technology Enabled Banking Self- Services (TEBSS) .............. 05 1.3 Current Trends in TEBSS ............................................................. 14 1.4 Technology Adoption in Indian Banking Sector-Current
Scenario ........................................................................................... 18 1.5 Need and Significance of the Present Study ................................. 22 1.6 Report Presentation ....................................................................... 27 References ............................................................................................... 29
Chapter 22 REVIEW OF LITERATURE............................................................... 31 - 94
2.1 Introduction ..................................................................................... 32 2.2 Technology Adoption Research in Banking Sector ..................... 34 2.3 Users’ Perceptions on Technology Adoption Decisions .............. 40 2.4 Research on Post-adoption Behaviour of Customers on
TEBSS ............................................................................................. 50 2.5 Risk Perception of Customers in TEBSS Adoption ..................... 67 2.6 Studies on Continuance Intention in Technology Adoption
Context ............................................................................................. 70 2.7 Research Gap .................................................................................. 75 2.8 Chapter Summary ........................................................................... 80 References ......................................................................................... 80
Chapter 33 CONCEPTUAL FORMULATION OF THE STUDY ...................... 95 - 166
3.1 Introduction ..................................................................................... 96 3.2 Theories of Technology Adoption ................................................ 96 3.3 Post-Adoption Theories .............................................................. 108 3.4 Conceptual Model and Relationship of Variables ...................... 115 3.5 Chapter Summary ......................................................................... 139 References ............................................................................................. 140

Chapter 44 RESEARCH METHODOLOGY ..................................................... 167 - 207
4.1 Research Problem ........................................................................ 168 4.2 Objectives of the Study ................................................................ 172 4.3 Research Hypotheses ................................................................... 173 4.4 Conceptual and Operational Definitions of Variables .............. 175 4.5 Research Design ........................................................................... 184 4.6 Scope of the Study ....................................................................... 186 4.7 Sampling Design ........................................................................... 188 4.8 Data Collection Method ............................................................... 189 4.9 Instrument used for Data Collection............................................ 190 4.10 Statistical Techniques Used for Analysis .................................... 192 4.11 Measurement of Testing of Variables ........................................ 192 4.12 Reliability and Exploratory Factor Analysis of Variables ......... 194 4.13 Limitations of the Study ............................................................... 204 4.14 Chapter Summary.......................................................................... 205 References .............................................................................................. 205
Chapter 55 ANALYSIS OF PURPOSE AND EXTENT OF USAGE OF TEBSS BY CUSTOMERS .............................................................. 209 - 284
5.1 Demographic Profile of the Respondents ................................... 210 5.2 Analysis of Purpose and Extent of Usage of Technology
Enabled Banking Self-Services (TEBSS) .................................. 217 5.3 Analysis of Usage Intensity of TEBSS by Respondents ........... 278 5.4 Chapter Summary ......................................................................... 284
Chapter 66 RELATIONSHIP BETWEEN CUSTOMERS’ PERCEPTION ON ADOPTABILITY, POST-USE EXPERIENCES AND CONTINUANCE INTENTION ...................... 285 - 378
6.1 Introduction ................................................................................... 286 6.2 Customers’ Perception on Adoptability of TEBSS .................... 286 6.3 Demographic Characteristics and Customers’ Perception
on Adoptability of TEBSS ........................................................... 289 6.4 Analysis of Post-use Experiences of Customers on TEBSS ......... 307 6.5 Analysis of Continuance Intention of Customers in Using
TEBSS ........................................................................................... 321 6.6 Confirmatory Factor Analysis of Variables ................................ 328

6.7 Measurement Model Analysis ..................................................... 332 6.8 Influence of Customers’ Perception on Adoptability of
TEBSS on Continuance Intention to use the TEBSS ................. 343 6.9 Influence of Customer Satisfaction and Post-Use Trust
in the Relationship Between Adoptability of TEBSS and Continuance Intention to Use The TEBSS ................................. 347
6.10 Influence of Risk Perception of Customers in the Relationship between Post-use Trust and Continuance Intention to Use the TEBSS ......................................................... 364
6.11 Validation of the Proposed Model of the Study ......................... 370 6.12 Chapter Summary ........................................................................ 377 References .............................................................................................. 377
Chapter 77 DISCUSSION, FINDINGS, SUGGESTIONS AND CONCLUSION ................................................................................ 379 - 422
7.1 Discussion and Findings .............................................................. 380 7.2 Suggestions ................................................................................... 410 7.3 Implications of the Study ............................................................. 414 7.4 Conclusion .................................................................................... 419 7.5 Scope for Future Research ........................................................... 421 References .............................................................................................. 421
BIBLIOGRAPHY ........................................................................... 423 - 460
APPENDICES ................................................................................. 461 - 490 Appendix 1 - Questionnaire ....................................................... 461 Appendix 2 - Result of Factor Analysis...................................... 467 Appendix 3 - Post –hoc Analysis Result of ANOVA .................. 470 LIST OF PUBLICATIONS ...................................................................... 491


Table 1.1 Growth of Digital Banking Transactions in India ................ 20 Table 4.1 Data Collection Details ........................................................ 190 Table 4.2 Instrument Used for Data Collection ................................... 191 Table 4.3 Test of Normality .................................................................. 193 Table 4.4 Harman’s Common Method Variance Bias Test ................ 194 Table 4.5 Reliability Analysis- Awareness .......................................... 195 Table 4.6 KMO and Bartlett’s Test of Sphericity –Awareness .......... 196 Table 4.7 Reliability Analysis- Accessibility ...................................... 197 Table 4.8 KMO and Bartlett’s Test of Sphericity –Accessibility .......... 198 Table 4.9 Reliability Analysis - Ease of Use ....................................... 198 Table 4.10 Reliability Analysis - Usefulness......................................... 199 Table 4.11 Reliability Analysis - Continuance Intention ...................... 200 Table 4.12 Reliability Analysis - Satisfaction ....................................... 200 Table 4.13 KMO and Bartlett’s Test of Sphericity –Satisfaction......... 201 Table 4.14 Reliability Analysis - Post-Use Trust .................................. 202 Table 4.15 KMO and Bartlett’s Test of Sphericity – Post-Use Trust ...... 202 Table 4.16 Reliability Analysis - Risk Perception ................................ 203 Table 4.17 KMO and Bartlett’s Test of Sphericity –Risk Perception ....... 204 Table 5.1 Analysis of Respondents’ Age and Occupation ................. 216 Table 5.2 Bank wise Classification of Respondents ........................... 219 Table 5.3 Type of Account Using by Respondents ............................. 220 Table 5.4 Classification of the Respondents based on Type of
TEBSS Using ........................................................................ 221 Table 5.5 Respondents’ Age-wise Analysis on Type of TEBSS Use ... 222 Table 5.6 Respondents’ Gender-wise Analysis on Type of
TEBSS Use............................................................................ 223 Table 5.7 Respondents’ Place of Residence-wise Analysis on
Type of TEBSS Use ............................................................. 225 Table 5.8 Occupation wise Analysis of Type of TEBSS Use ............ 227 Table 5.9 Respondents’ Monthly Income-wise Analysis on
Type of TEBSS Use ............................................................. 229 Table 5.10 Years of Use of TEBSS by Respondents ............................ 230 Table 5.11 Years of Use of TEBSS and Age of Respondents .............. 231 Table 5.12 Years of use of TEBSS and Gender .................................... 232

Table 5.13 Years of Use of TEBSS and Place of Residence of Respondents .......................................................................... 233
Table 5.14 Years of Use of TEBSS and Occupation ............................ 234 Table 5.15 Years of use TEBSS and Monthly Income ......................... 235 Table 5.16 Descriptive Analysis on Purpose of Usage of TEBSS ....... 236 Table 5.17 Classification of the Respondents based on TEBSS
Usage Frequency................................................................... 237 Table 5.18 Age-wise Analysis of TEBSS Usage for Payment
Services ................................................................................. 241 Table 5.19 Occupation-wise Analysis of TEBSS Usage for
Payment Services .................................................................. 242 Table 5.20 Income wise analysis of TEBSS Usage for Payment
Services ................................................................................. 243 Table 5.21 Education-wise Analysis of TEBSS Usage for Payment
Services ................................................................................. 244 Table 5.22 Age-wise Analysis of TEBSS Usage for Informational
Services ................................................................................. 245 Table 5.23 Occupation-wise Analysis of TEBSS Usage for
Informational Services ......................................................... 246 Table 5.24 Income-wise Analysis of TEBSS Usage for
Informational Services ........................................................... 247 Table 5.25 Education-wise Analysis of TEBSS Usage for
Informational Services .................................................... 248 Table 5.26 Age-wise Analysis of TEBSS Usage for Fund Transfer
Services ................................................................................. 249 Table 5.27 Occupation-wise Analysis of Usage of TEBSS for
Fund Transfer Services ......................................................... 250 Table 5.28 Income-wise Analysis of TEBSS Usage Fund Transfer
Services ................................................................................. 251 Table 5.29 Education wise Analysis of TEBSS Usage for Fund
Transfer Services ................................................................... 252 Table 5.30 Age wise Analysis of TEBSS Usage for Booking
Services ................................................................................. 253 Table 5.31 Occupation-wise Analysis of Usage of TEBSS for
Booking Services .................................................................. 254 Table 5.32 Income-wise Analysis of TEBSS Usage for Booking
Services ................................................................................. 255
Table 5.33 Education-wise Analysis of TEBSS Usage for Booking Services ................................................................................. 256
Table 5.34 Age-wise Analysis of TEBSS Usage for Online Shopping / E-Commerce Transactions ................................ 257
Table 5.35 Occupation-wise Analysis of Usage of TEBSS for Online Shopping/ E- Commerce Transactions ................... 258
Table 5.36 Income-wise Analysis of TEBSS Usage for Online Shopping/ E-Commerce Transactions ................................. 259
Table 5.37 Education-wise Analysis of TEBSS Usage for Online Shopping/ E-Commerce Transactions ................................... 260
Table 5.38 Age-wise Analysis of TEBSS Usage for POS Transactions .......................................................................... 261
Table 5.39 Occupation-wise Analysis of Usage of TEBSS for POS Transactions.................................................................. 262
Table 5.40 Income-wise Analysis of TEBSS Usage for POS Transactions .......................................................................... 263
Table 5.41 Education-wise Analysis of TEBSS Usage for POS Transactions .......................................................................... 264
Table 5.42 Occupation of Respondents and TEBSS Usage for Payment Services .................................................................. 265
Table 5.43 Monthly Income of Respondents and Use of TEBSS for Payment Services ............................................................ 266
Table 5.44 Occupation of Respondents and Informational Service Usage ........................................................................ 267
Table 5.45 Monthly Income and Use of TEBSS for Informational Services ................................................................................. 268
Table 5.46 Occupation of Respondents and Use of TEBSS for Fund Transfer Services ......................................................... 269
Table 5.47 Monthly Income of Respondents and Use of TEBSS for Fund Transfer Services ................................................... 270
Table 5.48 Occupation of Respondents and Use of TEBSS for Booking Services .................................................................. 272
Table 5.49 Monthly Income of Respondents and Use of TEBSS for Booking Services ............................................................ 273
Table 5.50 Occupation of Respondents and Online Shopping/ E-commerce through TEBSS ............................................... 274
Table 5.51 Monthly Income and Online Shopping/ E-Commerce Through TEBSS .................................................................... 275

Table 5.52 Occupation and TEBSS Use for POS Transactions ........... 276 Table 5.53 Monthly Income and TEBSS Use for POS Transactions ...... 277 Table 5.54 Analysis of Usage Intensity of TEBSS ............................... 279 Table 5.55 Age of Respondents and Usage Intensity of TEBSS.......... 280 Table 5.56 Occupation of Respondents and Usage Intensity of
TEBSS ................................................................................... 281 Table 5.57 Monthly Income of Respondents and Intensity of
Usage of TEBSS ................................................................... 282 Table 6.1 Customers’ Perceptions on Adoptability of TEBSS .......... 287 Table 6.2 Age of Respondents and Awareness about TEBSS............ 290 Table 6.3 Education of Respondents and Awareness on TEBSS ....... 291 Table 6.4 Occupation of Respondents and Awareness on TEBSS ........ 292 Table 6.5 Monthly Income of Respondents and Awareness on
TEBSS ................................................................................... 293 Table 6.6 Age of Respondents and Accessibility of TEBSS .............. 294 Table 6.7 Education of Respondents and Accessibility of TEBSS ....... 295 Table 6.8 Occupation of Respondents and Accessibility of TEBSS ..... 296 Table 6.9 Monthly Income of Respondents and Accessibility
of TEBSS............................................................................... 297 Table 6.10 Age of Respondents and Ease of Use of TEBSS ................ 298 Table 6.11 Education of Respondents and Ease of Use of TEBSS ........... 299 Table 6.12 Occupation of Respondents and Ease of Use of TEBSS ......... 300 Table 6.13 Monthly Income of Respondents and Ease of Use of
TEBSS.................................................................................... 301 Table 6.14 Age of Respondents and Usefulness of TEBSS ................. 302 Table 6.15 Education of Respondents and Usefulness of TEBSS ....... 303 Table 6.16 Occupation of Respondents and Usefulness of TEBSS .......... 304 Table 6.17 Monthly Income of Respondents and Usefulness of
TEBSS.................................................................................... 305 Table 6.18 Analysis of Post-Use Experiences of Customers on
TEBSS ................................................................................... 307 Table 6.19 Age of Respondents and Satisfaction in using TEBSS.......... 309 Table 6.20 Education of Respondents and Satisfaction in using
TEBSS ................................................................................... 310 Table 6.21 Occupation of Respondents and Satisfaction in using
TEBSS ................................................................................... 311

Table 6.22 Monthly Income of Respondents and Satisfaction in using TEBSS ......................................................................... 312
Table 6.23 Age of Respondents and Post-Use Trust in using TEBSS ...... 314 Table 6.24 Education of Respondents and Post-Use Trust in
using TEBSS ......................................................................... 315 Table 6.25 Occupation of Respondents and Post-Use Trust in
using TEBSS ......................................................................... 316 Table 6.26 Monthly Income and Post-Use Trust in using TEBSS ....... 317 Table 6.27 Age of Respondents and Risk Perception in using
TEBSS ................................................................................... 318 Table 6.28 Education of Respondents and Risk Perception in
using TEBSS ......................................................................... 319 Table 6.29 Occupation of Respondents and Risk Perception in
using TEBSS ......................................................................... 320 Table 6.30 Monthly Income of Respondents and Risk Perception
in using TEBSS ..................................................................... 321 Table 6.31 Analysis of Continuance Intention to use the TEBSS ........ 322 Table 6.32 Age of Respondents and Continuance Intention to
use the TEBSS ...................................................................... 323 Table 6.33 Education of Respondents and Continuance Intention
to use the TEBSS .................................................................. 324 Table 6.34 Occupation of Respondents and Continuance Intention
to use the TEBSS .................................................................. 325 Table 6.35 Monthly Income of Respondents and Continuance
Intention to use the TEBSS .................................................. 326 Table 6.36 Model fit Results of Conceptual Model .............................. 334 Table 6.37 Standardised Estimates of Factor Loadings ........................ 336 Table 6.38 Result of Correlations between Variables in Conceptual
Model ..................................................................................... 339 Table 6.39 Reliability of Measurement Constructs ............................... 341 Table 6.40 Measurement Model Validity .............................................. 342 Table 6.41 Fit Indices of the Model relating Customers’ Perception
on Adoptability of TEBSS and Continuance Intention to use the TEBSS .................................................................. 345
Table 6.42 Result of Hypotheses Test between Customers’ Perception on Adoptability and Continuance Intention to Use the TEBSS ................................................................. 345

Table 6.43 Impact of Awareness on Satisfaction and Post-Use Trust ....................................................................................... 350
Table 6.44 Impact of Satisfaction and Post-use Trust on Continuance Intention .......................................................... 350
Table 6.45 Direct Effect- Awareness on Continuance Intention .......... 351 Table 6.46 Indirect Effects- Awareness on Continuance Intention ......... 351 Table 6.47 Impact of Accessibility on Satisfaction and Post-Use
Trust ....................................................................................... 354 Table 6.48 Impact of Satisfaction and Post-use Trust on
Continuance Intention............................................................ 354 Table 6.49 Direct Effect- Accessibility on Continuance Intention .......... 355 Table 6.50 Indirect Effects-Accessibility on Continuance Intention ....... 355 Table 6.51 Effect of Ease of Use to Satisfaction and Post-Use
Trust ....................................................................................... 357 Table 6.52 Influence of Satisfaction and Post-use Trust on
Continuance Intention .......................................................... 358 Table 6.53 Direct effect– Ease of Use on Continuance Intention ........ 358 Table 6.54 Indirect Effects- Ease of Use on Continuance Intention .......... 359 Table 6.55 Effect of Usefulness on Satisfaction and Post-Use
Trust ....................................................................................... 361 Table 6.56 Effect of Satisfaction and Post-use Trust on Continuance
Intention................................................................................. 361 Table 6.57 Direct Effect – Usefulness on Continuance Intention ........ 362 Table 6.58 Indirect effects- Usefulness on Continuance Intention .......... 362 Table 6.59 Interaction Effect-Risk Perception ...................................... 366 Table 6.60 Conditional Effect of Post- use Trust on Continuance
Intention................................................................................. 367 Table 6.61 Direction of Effect of Risk Perception ................................ 367 Table 6.62 Matrix of the Conditional Effects ........................................ 368 Table 6.63 Model Fit- Structural Model ................................................ 372 Table 6.64 Path Estimates- Structural Model ........................................ 373
Figure 1.1 Volume of Transactions through Different Types of Digital Payment Systems in India.......................................... 21
Figure 2.1 Classification of E banking Literature ................................... 32 Figure 3.1 Conceptual Model of the Study ........................................... 138 Figure 5.1 Gender -wise Classification of Respondents ...................... 210 Figure 5.2 Age wise Classification of Respondents ............................. 211 Figure 5.3 Location wise Classification of Respondents ..................... 212 Figure 5.4 Education-wise Classification of Respondents ................... 213 Figure 5.5 Occupation-wise Classification of Respondents................. 214 Figure 5.6 Monthly Income wise Classification of Respondents ............ 215 Figure 6.1 Measurement Model ............................................................. 333 Figure 6.2 Structural Model of Customers’ Adoptability and
Continuance Intention to use the TEBSS ............................ 344 Figure 6.3 Mediation Model – Awareness and Continuance
Intention .............................................................................. 349 Figure 6.4 Mediation Model – Accessibility and Continuance
Intention................................................................................. 353 Figure 6.5 Mediation Model – Ease of Use and Continuance
Intention ............................................................................... 357 Figure 6.6 Mediation Model- Usefulness and Continuance Intention .... 360 Figure 6.7 Moderation Model ................................................................ 365 Figure 6.8 Template of Model for Moderation Analysis .................... 365 Figure 6.9 Statistical Template for Moderation Analysis ............. 365 Figure 6.10 Structural Model of the Study .............................................. 371


AGFI - Aggregate Goodness of Fit Indices AI - Artificial Intelligence AEPS - Aadhar Enabled Payment Interface ALPM - Automatic Ledger Processing Machines AMOS - Analysis of Moment Structures ANOVA - Analysis of Variance API - Aadhaar based Payment Instruments ASS - Accessibility ATMS - Automatic Teller Machines ASV - Average Shared Variance AVE - Average Variance Extracted AWR - Awareness BCG - Boston Consultancy Group BCT - Block Chain Technology BHIM - Bharat Payment Interface CBS - Core Banking System CBTS - Core Banking Technology Systems CFA - Confirmatory Factor Analysis CFI - Comparative Fit Indices CI - Continuance Intention CR - Composite Reliability ECS - Electronic Clearing System EFTS - Electronic Fund Transferring System ECM - Expectation Confirmation Model EOU - Ease of Use EPS - Electronic Payment Services ESQ - Electronic Service Quality EUCSS - End User Computing Satisfaction EU - Ease of Use GFI - Goodness of Fit Indices GST - Goods and Service Tax

HDFC - Housing Development Finance Corporation IB - Internet Banking ICT - Information and Communication Technology IDT - Innovation Diffusion Theory IFI - Incremental Fit Indices IMPS - Immediate Payment Services IS - Information Systems IT - Information Technology IVR - Instant Voice Response KMO - Kaiser Mayor Olkins KYC - Know Your Customer LAN - Local Area Network LLCI - Lower Limit of Confidence Interval MB - Mobile Banking MIAC - Model of Intention Adoption and Continuance MIS - Management Information System NFC - Near Filed Communication NFI - Normed Fit indices NEFT - National Electronic Fund Transfer System NNFI - Non-Normed Fit Indices NRI - Non-Resident Indians OTP - One Time Password PC - Personal Computer PEOU - Perceived Ease of Use PGFI - Parsimony Goodness of Fit Indices PIN - Personal Identification Number PMJDY - Pradhan Mantri Jan Dhan Yojana POS - Point of Sale PPI - Pre-Paid Instruments RBI - Reserve Bank of India RMR - Root Mean Square Residual RMSEA - Root Mean Square of Error Approximation RP - Risk Perception

RPA - Robotic Process Automation RTGS - Real Time Gross Settlement SAT - Satisfaction SBT - State Bank of India SCT - Social Cognitive Theory SEM - Structural Equation Modelling SE - Standard Error SERVQUAL - Service Quality SPSS - Statistical Package for Social Sciences SMS - Short Message Service SRMR - Standardized Root Mean Square Residual SSBT - Self-Service Banking Technology SSTS - Self- Servicing Technologies TAM - Technology Acceptance Model TEBSS - Technology Enabled Banking Self-Services TLI - Tucker Lewis Index TPB - Theory of Planned Behavior TRA - Theory of Reasoned Action TRST - Trust ULCI - Upper Level of Confidence Interval UPI - Unified Payment Interface UTAUT - Unified Theory of Acceptance and Use of Technology WWW - World Wide Web
…..…..


Introduction
1
1.1 Technology Adoption in Banking Sector- An Overview
Banking sector everywhere throughout the world has been
witnessing the rapid technological changes over the period of past few
decades. Banks around the world are actively pushing for digitalisation of
performance after the introduction of Information and Communication
Technology (ICT). The gigantic changes in the sector as a way to overcome
the out-dated approaches and mismanaged client relationships resulted in
true transformation in the performance of banks. This was the fundamental
reason for the transfer of technology into global destinations for integration.
Apart from the information technology development, diffusion of internet
technology by the introduction of World Wide Web (WWW) in the mid-
90s has also significantly influenced in the changes of banking sector.

Chapter 1
2
That was another upheaval of information sharing through an interconnected
network all over the world. The internet technology had rolled out
significant improvement in information sharing by connecting the people
and places through the web and also had opened a new virtual platform
for information exchange. Banks from all over the world have been
spending a huge amount of money and resources for the development of
technology and for upgrading the existing technology in order to achieve
the operational efficiency, cost reduction, product innovations as well as
to compete with the opponents.
Technology adoption in the banking sector resulted in excellent
improvements in the operations of banks, customer services, reduction in the
cost of operations and the introduction of innovative products and services.
Varieties of innovative products and services based on latest technology are
available with banks and they are still spending much on research and
development works to make use of more sophisticated technologies.
Presently banks redefined and re-engineered the products and services to
cater the changing needs of the customers and the conventional banking is
now replaced as convenient banking. In this information diffusion era,
customers are more demanding and they are having high level of
expectations. Moreover, people are more techno-savvy than ever before.
Hence, to cope up with the changing scenarios, banks are reshaping their
business into more customised manner with the support of technology. The
role of banking is redefined from a mere financial intermediary to a service
provider of various financial services under one roof, acting like a financial
supermarket. Innovation due to technology adoption had a positive impact on
customer services besides the benefit it had gained in the form of reduced

Introduction
3
cost of operations. The financial service industry is now emphasising their
focus on the creation of new possibilities by embracing digitalisation and
exploring the ways to increase internal efficiencies, provide value-added
customer services, minimise risk and become the engine for growth.
Before the advent of technology, banking system followed a
structured, systematic way of doing banking. The banking culture of the
human beings can be traced back from the history of mankind. It started
long ago in the form of its basic nature of lending and borrowing while
people started their society-based lifestyle and trading. The information
technology evolution affected every sphere of human life gradually. The
banking sector, is no exception is one of the prominent sectors of an
economy, has also resulted in numerous changes with these technologies.
The traditional bricks and mortar system of banking was completely taken
out and replaced by the innovative methods of service delivery and
improved products and services for the time period.
Information technology developments were the catalyst for revolution
in the banking sector. Application of the technology in the banking sector
has resulted in hectic changes in the performance of banks and other
financial institutions. It enabled banks to do few more functions other
than the traditional banking practices. Regardless of those which were out
of our thoughts a couple of decades ago, most of them are now a vital part
of our daily life. Its wider classifications include Debit/Credit cards,
Internet banking, Mobile banking, etc. As a result of all these changes,
many new products from banks and other third-party financial service
providers are getting popularised among users.

Chapter 1
4
The application of technology in banking was started with the huge
electromechanical calculators which were used basically for performing
simple arithmetic operations. But the technologies were evolving and
updating timely by embracing the new features and advanced possibilities.
In the history of banking, customer-based innovations were started from
the early stage of introduction of electro-mechanical or electronic machines
for data printing and calculations and followed with typewriters, printing
machines, electromechanical tabulators, card punching machines, etc. The
most important among them was Automatic Ledger Posting Systems
(ALPMS). It was considered as the first banking technology used for
maintaining the primary ledgers working out profits and interest at
periodic intervals. Stand-alone PCs with LAN connectivity was used later
in banks. The next set of technology developments in the banking sector
was the introduction of the communication software namely BANKNET
to provide messages and file transfer between branches of banks and
across banks.
Apart from the computerisation of banks, ATMs are the real
revolution happened in the banking sector. By the development of ATMs,
the conventional method of doing basic banking activities got totally
shifted to another platform. By the popularity of networking technology,
the infinite possibility of inter connectivity has also opened another
perspective of doing banking. Internet facilitated banks to create their
own web pages and customers are offered the facility of accessing these
web pages through the web browsers even while sitting at home. Internet
banking is called as the stepping stone of the all innovative banking
technologies like, RTGS, EFTS, etc. (Subrangshu, 2016).

Introduction
5
1.2 Technology Enabled Banking Self- Services (TEBSS)
Self-Service Technology (SST) is a common technology that
customers are using independently for performing banking transactions
without any interaction with or assistance from bank employees. An SST
is a service in which, there is no direct assistance from or interaction with
a human service agent (Salomann & Dous, 2007). The self‐service is
conceptualised as the transference of control to the customers, although
the extent to which this is realised may be influenced by the design of the
self‐service (Bradly & Sparks, 2012). Meuter & Robert (2000) defined
the Self- Service Technology as “Technology interface that enables
customers to access a service independent of direct service employee
involvement.” First form of SSBT was ATM. Tele-banking, Internet
Banking, Mobile Banking, EFTS, POS, Bank Cards etc. are also included
in this category.
The beginning of SST in banking sector was started for the first
time in India, when HSBC bank started ATM in the year 1987. Following
to ATMs, Internet Banking and Mobile Banking ushered the concept of
self-service technologies. The concept was popularised in the period of
1990s, when internet banking became popular. The success of ATMs has
prompted banks to start deploying more innovations in products and
services in these categories, such as Tele-banking, Internet banking,
Mobile banking, etc. The adoption of NEFT, RTGS etc. had introduced
basically to strengthen the efficiency of self-service banking technologies.
The most important technology behind the aggressive application of
Technology Enabled Banking Self-Services (TEBSS) was the introduction

Chapter 1
6
of Core Banking System (CBS) in 2000. Core Banking System (Centralised
Online Real-time Exchange) is a method of networking of branches. This
system enabled the customers to perform their banking operations from
any branch of the bank on CBS network regardless where the customer is
maintaining his or her account. This system has completely taken out the
old concept of ‘customer of a particular branch’ and redefined it as
‘customer of the bank’. In general, core banking services include floating
new accounts, servicing loans, deposits and withdrawals and customer
relationship management. It enabled the banks to launch new products
and services targeting specific customer segments after identifying their
banking and investment needs. ATMs, internet banking and mobile
banking etc. have attained customers’ attraction since they provide
banking services at anywhere and anytime. Some of the common types of
TEBSS are explained in the following section.
1.2.1 ATM (Automated Teller Machine)
ATM is an electronic banking outlet that provides the basic banking
facilities to the customer without the support or the assistance from bank
employees. In 1960s, first ATM was introduced in London, which used
paper token at first and later used a magnetic code-based card for
transactions. ATMs assures convenient, quick and self-service everyday
transactions to customers like withdrawals and deposit of cash at any time
or anywhere the outlet is available. Present days with internet connectivity
ATM counters are spread all across the world which can do many of the
banking functionalities. Now it replaced the employees in bank branches
for doing the basic banking transaction like withdrawal of cash, checking

Introduction
7
balance and account information. The ATM centres are now common in
all places, and the customers of banks are blessed with the additional
facility of banks that; they can make transactions from anywhere and
anytime.
ATMs can be termed as any time money, as it is the first move to
overcome the limitation of banking hours for transactions at bank
branches. By the introduction of technology-oriented banking followed by
the spread of internet and mobile banking, the traditional system of
stipulated time period for working of the bank has been taken away from
the mind of people. Wide spread use of ATMs by bank customers for
different purposes such as cash withdrawals, checking statements, or
balance enquiry, etc. lead to the setting up of large number of ATM
outlets at nooks and corners. ATMs are now available with the facility of
cash deposit and more advanced capabilities. The specialty of ATMs
today is that, most of the ATMs are connected to inter-bank network and
which enables to withdraw money from any bank’s ATM outlets. The
primary type of ATM only allowed the customers to withdraw cash and
receive information about the updated balances and information of
statements of accounts etc. Whereas, the more complex models of ATMs
allow the customers to deposit cash as well as line of credit payments,
transfers, and report of account information. To avail the features of these
complex ATMs, the customer must be the account holder of the
concerned bank that operates the machine. Future ATMs are likely to be
expected as full-service terminals of banks.

Chapter 1
8
1.2.2 Credit Cards
Credit card is generally a charge card in a sense, in which holder
can avail credit from the issuing bank. The bank charges a commission
for the provided credit. In order to avail the credit, the holder should have
sufficient credit standing and repayment capacity, which is checked by
the bank before the issue of such cards. The card holder can avail the
credit easily, conveniently, and in flexible terms. The card contains the
basic information regarding the holder as well as bank such as name of
holder, name of bank, period of validity, place of validity, image of
holder, logo on the card and the hologram, magnetic strip and signature
etc. The use of credit card first originated in U.S in 1920s, when the oil
companies and restaurants began to issue the cards to their customers for
purchases. Diners club card was the first type of universal credit card
introduced in 1950. Another type of card in this line was the American
Express Card issued for travel and entertainment by American express
Company in 1958. Now it is being popular and all commercial banks are
issuing the credit cards to their customers based on the credit score of the
customer.
1.2.3 Electronic Payment System (EPS)
The electronic payment system is a financial exchange system
offered by the banks where transactions are taking place online between
buyers and sellers. An operational network- governed by laws, rules and
standards that link bank accounts and provides the functionality for
monetary exchange using bank deposit. It helps the customers to make
online payment for their shopping such as online reservation, online bill

Introduction
9
payment, online ticket booking, online order processing, etc. E-payment
systems can be classified into two, cash payment system as well as credit
payment system. In e-cash payment system, the payments are settled
through electronic fund transferring mechanism. Whereas in the credit
payment system, the settlements are carried out via credit cards or
e-wallets or smart cards.
1.2.4 Debit Cards
Debit cards are another important type of plastic cards widely used.
It is same as a credit card in appearance and features but only the difference
is that, debit card requires an account and balance in that account to use it.
The card holder should have a bank account and the card is under a pay
now scheme, which means that the holder’s account is debited with the
payment at the same time itself. The holder is using his own money and
the bank need not bother about the credit worthiness and repayment capacity
of the holder. Generally, debit cards are used for smaller value payment as
compared to credit cards and the banks have connected the card through the
ATMs. The first form of a debit card was introduced by Barclays in U.K. In
1978. In the late 70s the card system was introduced in the U.S. and Canada
also. It was given to businessmen with big accounts which can be used with
ATMs. Debit cards became popular in India, after 1990s by the growth of
ATMs. In those days, debit cards were largely used for ATM transactions.
During the year 2000, it was reported commendable growth in the usage of
debit cards since that was the period when ATM cum debit cards got much
attention by the customers. But the exponential growth of such cards is
reported after the demonetisation in 2016.

Chapter 1
10
1.2.5 Telephone Banking
Telephone banking is a service provided by the banks or other
financial institutions, which enables customers to perform financial
transactions over telephone, without the need to visit a bank branch or
ATM. The user can perform banking activities through a phone call.
Telephone banking services generally include obtaining account balances,
list of latest transactions, electronic bill payment and fund transfer between
customers account to another account etc. To access the telephone banking
services, the customer would call the special number set up by the bank/
financial institution. The service can be provided using an automated
system using speech recognition technology or by live customer
representatives. Telephone banking was first introduced in 1984 by Girobank
in UK. Telephone banking evidenced its growth during the early 1990s,
and was heavily used by the first generation direct banks. However, the
development of online banking in the early 2000s started a long-term
decline in this system.
1.2.6 Internet Banking
Internet Banking refers to the system that enables banks to perform
their activities through an online platform. Customers can access to their
accounts and information on the products and services of banks through
the websites of banks without face to face contact with bank employees.
Since this is a non -personal communication channel, it re-shaped the way
of carrying out traditional banking activities. Apart from cost reduction, it
offers a number of benefits to banks as well as customers like time
saving, effortless, convenience, and 24-hour availability of banking

Introduction
11
services anywhere. In November 1993, Stanford Federal Credit Union
conducted its first four internet transactions. They were the first financial
institution to offer online internet banking services to all of its members
from October 1994. Reduced transaction costs, easier integration of the
services and enhanced time saving are the unique attractions of using
internet banking by banks all over the world.
1.2.7 Electronic Clearing Services (ECS)
Electronic Clearing Service is another important type of service
that was entirely new system to the existing fund transfer system at the
time of its introduction. Under this system, one can transfer funds from
one account to another through electronic format that is in paperless way.
Generally, it was made utilising by the institutions for distribution of
funds, dividend payments, payment of bills, other charges, etc. ECS
provides paperless credit/debit transactions directly linked to the account
of customers and also provides the faster method of periodic payments. It
is generally used in bulk transfers from one account to many accounts or vice
versa. Utility service providers such as telephone companies, electricity
boards, credit card collection companies, collection of loan instalments by
banks or other financial institutions, mutual fund companies and insurance
companies etc. are now eligible to participate in the ECS scheme.
1.2.8 EFTS (Electronic Fund Transferring System)
The Electronic Fund Transferring System is another important type
of new services generally offered by banks. It is the mechanism, through
which clients can transfer their funds electronically from one bank account
to another without any paper transactions. Normally the electronic fund

Chapter 1
12
transferring is done through electronic terminals like ATMs, credit cards,
fed wires, and point of sale transactions. All banks are now providing this
service through their established electronic delivery channels. Today
people are more concentrated on the online banking and online
transactions. This has highly routed to spread the EFTS among customers.
One of the important EFTS tools that is available on the internet is PayPal.
By using this site customers can shop, move money to bank accounts, sell,
buy, and request money directly from their bank account. Another
important feature of EFTS is that, when the customer transfers money from
one country to another, it will automatically calculate the currency and
exchange rates which is highly cost effective and time saving.
1.2.9 RTGS (Real Time Gross Settlement)
This is specialised fund transferring services system. It enables
transfer of money or securities takes place from banks one account to
another on a real time and gross basis without any waiting period. The
transactions are then processed on a gross basis and settled as soon as
possible. Gross settlement simply means that, transactions are settled
down on one to one basis not in netting up with any other transactions.
Generally, it is used in bulk transactions which need immediate closing.
The first system of RTGS was introduced in U.S Fedwire system which
was launched in 1970. In 1984 France and U.K implemented RTGS type
systems. It was highly useful for the period to transfer bulk amount of
fund between banks. Currently banks provide different types of fund
transfer services similar to RTGS like National Electronic Fund Transfer
System (NEFT) and Immediate Payment Services (IMPS). Each of these

Introduction
13
services provides different kinds of functionalities based on the value of
services, speed of services, service availability and other factors. EFT
types of transactions can offer additional services such as sale, refund,
withdrawal, cash advance, deposit, cash back, inter account transfer,
payment, inquiry, administrative transactions etc. Also, this includes
some personal non-financial services like PIN change.
1.2.10 Mobile Banking
Mobile banking is a financial service, provided by banks or other
organisations that allows its customers to conduct financial transactions
remotely by using a mobile device such as a smartphone or tablet. By the
popularity of mobile phones in the early 1990s, the customer authentication
was made more secure by using the One-Time password (OTP) system in
which an authentication passcode is sent to the mobile number of the user
to authorise the banking transaction. It was started with SMS banking and
later developed to internet banking with the entry of internet enabled
mobile phones. The privacy and security of mobile phone and development
of smart phone resulted in further improvement in mobile banking services.
Former the mobile banking was meant SMS banking, that is informing the
customers through text messages. The services include some basic services
like sending information of accounts by the bank to check the account
details such as balance enquiry or anything. Mobile banking reduces the
cost of handling transactions but it does not allow the transactions
involving cash. Mobile banking before 2010 was largely based on SMS
banking. Typical mobile banking services now include mini statements and
checking of account history, alerts on account activities, monitoring of

Chapter 1
14
term deposits, access to loan statements, access to card statements, mutual
funds or equity statements, insurance policy management, fund transfer
between customer linked accounts, paying third parties includes bill
payments, check remote deposits, portfolio management services, status
of request for credit, cheque book /card request services, and other location
based services etc.
1.2.11 E-Wallets
The fast pace of technological change means even the frontiers cannot
even afford to stop innovating. Technology players, including Google,
Amazon, Facebook and Apple, as well as smaller fintech companies are
circling the industry looking for ways to participate and create value without
taking on the burden of a regulated balance sheet like banks. E-wallet is their
focus. E-wallet is a convenient, easy-to-use, secure global payment system. It
is flexible “personal banking system” with a number of pay-out and pay-in
options. It is an online portal which uses API based interface which one can
add money to it from bank or links the card or internet banking details
in it and securely make payment through it with mobile phone-based
authentication. It can make transaction without waiting for the bank to
authorise the beneficiary and the payment can be made instantly by scanning
a graphical code or simply entering an ID or linked mobile number e.g.
PayTM, Airtel money, Phone pay, Tez etc.
1.3 Current Trends in TEBSS
Banking sector soon applies the technological changes and a lot of
new emerging technologies are evolved in banking and financial service
sector. Customers are offered unique banking experiences through these

Introduction
15
innovations which was completely out of their thought before. The
global banking sector is becoming both more strategically focused and
technologically advanced to respond to consumer expectations while trying
to defend market share against an increasing array of competitors. A great
deal of emphasis is being placed on digitalising core business processes
and reassessing organisational structures and internal talent to be better
prepared for the future of banking. As a part of these mega-trends, banks
will also experiment with new mobile applications and voice-enabled
gadgets to enhance both delivery and contextual personalisation.
Ultimately, the consumer will be front and centre (Marous, 2018). Some
of the important trends that are currently viewing in the banking sector
as well as some of the expected transformations are briefly explained
below.
1.3.1 Digital Only Systems
Banks are expected to be soon become a digital only system which
indicates a complete exchange of products and services through the
platform like mobile, internet and tablets. It is characterised as paperless,
branchless and signature less way of doing banking that offers 24 hours
service to customers. In India, it is expected to make it possible through
Aadhaar based infrastructure.
1.3.2 Biometric Technology
Digital identification goes beyond the traditional customer
identification methods. It helps the customers to interact with the bank
uniquely by evaluating distinguished biological features like eyes, vein,
hand, face, retina, voice, etc. It can expect to avoid the security issues and

Chapter 1
16
safety threats in virtual banking. Customers are expected to seamless services
across channels without going through the repetitive identification and
verification procedures. Biometric technology was first evolved in U.K
when the HSBC bank introduced voice recognition and touch services for
customer identification.
1.3.3 Artificial Intelligence
Artificial Intelligence provides quick and personalised services by
dealing with each customer separately on their specific requirements. It
can be used to collect information and automatically build a model based
on information, make inferences and communication of the results in a
natural way. Large banks in India only have plans to introduce AI now.
The process of AI involves machine learning, computer vision, natural
language progression and natural language generation. The benefits of AI
in banks and credit unions are widespread in reaching back office
operations, compliance, customer experiences, delivery of services and
risk management etc. As a part of using Artificial Intelligence, robotics
has also come into picture as a new technology solution.
1.3.4 Robotic Process Automation (RPA)
It is another technology, that helps to automate the processes which
are repetitive in nature. Indian banks have started using robotics to answer
the customer queries related to different types of transactions like
DEMAT account, locker facilities, loan, deposit etc. Already some robots
can sense their environment, recognise objects, and responds to information
with useful and safe behaviour. Over time they will be able to do more
complex tasks.

Introduction
17
1.3.5 Block Chain Technology
Innovative method or record keeping and other bank end function of
banks, document management reporting, payments etc. are possible
through BCT for banks. It will enhance the efficiency in fraud prevention
and increase transparency of processes. Block chain technology was first
introduced in 2008. Block chain will do to banks what the internet did to
media. Block chain assures high level of safety and security when it
comes to exchanging data, information and money. It allows the user to
transact in a transparent network infrastructure with low operational cost.
The highlighted feature of the adoption of block chain technology in the
customer identification is that, independent verification of each customer
done by one bank or financial institution that would be accessible to
others to use. So that, the KYC process does not have to be restarted
again. Block chain technology is set fundamentally to transform banking
and financial services. It decentralises the financial management from a
central authority to a widespread network of computers. In which, financial
transactions are broken down into encrypted pockets, or “blocks” which
are then added to “chain” of computer code and encrypted for enhanced
cyber security.
1.3.6 Google Glass Technology
Google glass technology in banking is a part of wearable technology.
Through this technology, it is possible to locate the nearest bank
branch/ATM, check account balance and use video conferencing for
technical support etc. Wearable banking may not yet be ready for prime
time. It is still important to understand and participate in the development

Chapter 1
18
of new technologies that eventually will bring together people, process,
data, and things to make networked connections more relevant and
valuable, creating new capabilities and richer experiences for consumers,
businesses and financial institutions (Marous, 2014).
1.4 Technology Adoption in Indian Banking Sector-Current Scenario In India, banking system was developed in the early ages of
civilisation as 18th century in its ancient form. Structured and systematic
banking was originally developed during British Rule. The British system
of banking was followed in India since 18th century. India had a long
history of trading with foreign merchants and Britain being the biggest
among this, started the British East India Company in Kolkata with the
aim of getting trade monopoly. When there was a need for them to have a
proper system of banking for trade, they started the first commercial bank
in India, Bank of Calcutta in 1806.
The banking sector in India witnessed tremendous changes in the
pace and pattern of the way of banking is done in the post-independence
period. After the independence, banking network got more established by
merging the smaller banks and nationalisation of major banks. During the
last 3 decades, banking sector underwent the most phenomenal changes
by turning into a technology-based system. The banking system changed
its operations from the piles of papers in shelves to the ease and comfort
at the fingertip of customers.
India, being the largest democracy and an emerging economic giant,
technology enabled banking systems makes it possible to cater the needs

Introduction
19
of customer population, which is growing exponentially each year. As a
result of the impact of Liberalisation, Privatisation, and Globalisation,
Indian economy opened for foreign trade and a number of foreign banks
started setting up their branches in India. The economic reforms of early
1990s also widened the scope of the new age banking systems in India
with the introduction of new generation private sector banks. The new
generation private sector banks paved the way of technology adoption.
They started penetrating among the Indian customers by providing world
class quality of services with technology-oriented products and services.
The requirement of computerisation in Indian banking was felt in 1980s.
As a part of the movement, for the client benefit and customer support in
reporting etc. RBI set up a committee headed by Dr. C. Rangarajan.
But banks began using Information and Communication Technology
in a wide way after the introduction of Core Banking System. The core
banking system was the stepping stone of the integrated mechanism in
banking sector. It provides the interconnectivity of different branches of a
bank as well as different banks itself in a connected network. Now the
growth of Indian banking in virtual platform is remarked as one of the
prominent spaces of digital banking all over the world.
Moreover, the demonetisation was declared in India in November
2016, and it affected the usage of electronic banking in a big way. The
following table and graph are based on the NPCI statistics on the growth
of digital payments after the demonetisation. The graph depicts the
volume of transactions carried out through different types of digital
payment systems for three months periods in the post-demonetisation.

Chapter 1
20
Tabl
e 1.
1: G
row
th o
f Dig
ital B
anki
ng T
rans
actio
ns in
Indi
a El
ectr
onic
Pay
men
t Sys
tem
s - R
epre
sent
ativ
e Dat
a (U
pdat
ed a
s on
Mar
ch 0
6, 2
018)
Vo
lum
e in
mill
ion,
Val
ue in
Rs.
billi
on
Dat
a fo
r th
e pe
riod
RTG
S N
EFT
C
TS*
IMPS
* N
AC
H*
UPI
* U
SSD
**
Deb
it an
d C
redi
t C
ards
at
POS
&
PPI #
M
obile
B
anki
ng
Tota
l volume
value
volume
value
volume
value
volume
value
volume
value
volume
value
volume (in thousand) value (in Rs. thousand)
volume
value
volume
value
volume
value
volume
value
Nov-
16
7.9
7847
9.2
123.
0 88
07.8
87
.1
5419
.2
36.2
32
4.8
152.
5 60
6.6
0.3
0.9
7.0
7302
.6
205.
5 35
2.4
59.0
13
.2
72.3
12
44.9
67
1.5
9400
4.2
Dec-
16
8.8
8409
6.5
166.
3 11
537.
6 13
0.0
6811
.9
52.8
43
1.9
198.
7 62
6.8
2.0
7.0
102.
2 10
3718
.4
311.
0 52
2.2
87.8
21
.3
70.2
13
65.9
95
7.5
1040
55.3
Jan-
17
9.3
7748
6.1
164.
2 11
355.
1 11
8.5
6618
.4
62.4
49
1.2
158.
7 54
1.4
4.2
16.6
31
4.3
3817
60.2
26
5.5
481.
2 87
.3
21.0
64
.9
1206
.7
870.
4 97
011.
4
Feb-
17
9.1
7421
8.8
148.
2 10
877.
9 10
0.4
5993
.9
59.7
48
2.2
150.
5 59
2.0
4.2
19.0
22
4.8
3570
55.2
21
2.3
391.
5 78
.4
18.7
56
.2
1080
.0
763.
0 92
594.
5
Mar
-17
12.5
12
3375
.8
186.
7 16
294.
5 11
9.2
8062
.8
67.4
56
4.7
182.
1 82
9.4
6.2
23.9
21
1.2
3379
62.4
22
9.7
416.
2 90
.0
21.5
60
.8
1499
.9
893.
9 14
9589
.1
Apr-1
7 9.
5 88
512.
2 14
3.2
1215
6.2
95.3
69
90.6
65
.1
562.
1 21
2.6
905.
2 6.
9 22
.0
188.
9 30
1650
.5
231.
1 43
1.4
89.2
22
.3
61.0
14
43.8
85
3.1
1096
02.2
May
-17
10.4
90
170.
5 15
5.8
1241
0.8
97.1
67
45.9
66
.7
585.
6 19
4.4
692.
4 9.
2 27
.7
192.
6 31
6723
.7
233.
4 45
0.8
91.3
25
.3
64.9
19
40.7
85
8.5
1111
09.3
Jun-
17
9.8
9281
2.6
152.
3 12
694.
2 91
.9
6409
.9
65.8
59
6.5
197.
3 70
8.6
10.2
30
.7
198.
9 31
3277
.0
232.
4 46
8.2
84.7
24
.1
77.1
15
84.7
84
4.7
1137
45.2
Jul-1
7 9.
4 87
149.
3 14
8.1
1201
1.6
92.2
63
42.5
69
.1
604.
8 20
4.3
771.
7 11
.4
33.8
19
0.7
3020
97.8
23
7.6
439.
3 88
.7
25.1
69
.5
1019
.2
861.
1 10
7378
.4
Aug-
17
9.5
8916
3.4
151.
6 12
500.
4 92
.1
6224
.3
75.7
65
1.5
205.
2 75
2.4
16.6
41
.3
191.
8 29
4239
.4
243.
0 45
7.1
89.7
27
.2
70.8
10
33.0
88
3.4
1098
17.9
Sep-
17
9.6
1023
48.1
15
7.7
1418
2.1
92.2
62
71.5
82
.9
717.
6 17
6.0
628.
4 30
.8
52.9
20
2.7
3235
78.5
24
0.3
478.
2 87
.5
27.6
86
.3
1121
.6
877.
0 12
4706
.8
Oct-1
7 10
.0
9205
6.1
158.
8 13
851.
3 94
.4
6340
.2
88.1
75
0.4
187.
0 90
0.5
76.8
70
.3
184.
6 29
9071
.8
255.
7 53
0.5
96.2
32
.7
130.
9 11
68.7
96
7.3
1145
32.2
Nov-
17
10.8
98
410.
5 16
2.0
1388
4.0
96.3
66
33.9
89
.5
782.
6 19
7.5
724.
1 10
4.8
96.4
18
2.4
2873
09.6
24
4.6
483.
3 92
.8
32.0
12
2.8
848.
4 99
8.5
1210
47.1
Dec-
17
10.9
10
0907
.8
169.
0 15
779.
2 94
.6
6564
.0
98.0
87
1.1
183.
0 71
4.0
145.
5 13
1.4
179.
9 29
9367
.3
263.
9 52
8.7
99.1
35
.1
113.
3 92
1.5
1064
.2
1255
31.5
Jan-
18
11.2
10
7488
.4
170.
2 15
374.
1 96
.7
6792
.6
99.6
88
2.1
208.
1 72
7.7
151.
7 15
5.4
172.
8 29
0020
.0
271.
1 52
1.9
113.
6 38
.3
106.
3 92
8.7
1122
.3
1319
80.8
Feb
18
0.5
4689
.0
12.5
78
2.7
4.0
319.
0 4.
4 45
.1
14.4
61
.9
5.8
9.7
7.0
1322
0.0
8.6
15.5
4.
2 1.
5 5.
4 52
.9
54.4
59
24.5
2.
*: S
ourc
e N
PCI.

Introduction
21
Based on the above figures the following graph is generated. The
graph shows the growth in the volume of transaction through different
types of digital payment systems in India, during the one-year period after
demonetisation. Usage of bank cards, NEFT, IMPS, mobile banking are
showing the exponential growth. Steady growth in the NEFT transactions
are reported during the period, whereas UPI transactions are emerging as
trendy after demonetisation. Volume of transactions through bank cards
are also showing the high growth rate. Mobile banking and IMPS showed
the increased trends following Pre-Paid Instruments.
Fig. 1.1: Volume of Transactions through Different Types of Digital Payment Systems in India
050
100150200250300350400450500
RTGS NEFT IMPS UPI USSD Bank Cards PPI M.B

Chapter 1
22
1.5 Need and Significance of the Present Study
In terms of digital adoption, financial services are already much
larger than any other categories like consumer electronics or travel. In the
last few years Indian banking sector also has realised the need of
introducing technology-based products and services for meeting the ever-
changing needs of customers. The adoption of technology has gained
customer acceptance in different technology-based products and services
like ATMs, Internet Banking, Mobile Banking, different types of bank
cards like debit cards, credit cards and digital wallets etc. Over the last
decade, the adoption of these products and services are increasingly high
among bank customers. Apart from reduced cost of operations, these
products and services are offering a number of distinguished features to
their users. Since the customers are more demanding and having high
expectations being techno savvy in this information diffusion era, banks
are reshaping their business into more sophisticated manner. Thus, the
role of banking is redefined as a financial supervisor rather than a
financial intermediary to an individual customer.
As discussed earlier, India is in the midst of a digital revolution,
with internet users are going beyond just search and social networking
and moving to more mature activities like online shopping and banking.
Cashless economy is emerging as a global trend and the government
following demonetisation, is trying its best to create a cashless society.
Digital India program of the Indian government for setting up an open
architecture layers such as Aadhar, India Stack, Bharat Bill Payment
System and GST, etc. are actively developing the entire digital ecosystem.

Introduction
23
Virtual banking/ direct banking is also an important step forward. In
addition to the push for digitisation, new policies favour financial
inclusion and promote competition ultimately point to the emergence of a
digital, inclusive, and interoperable financial-service market in India.
Now the technology adoption has reached in its nascent stage.
Already 70 percent urban internet users are digitally influenced during
financial product purchase. That is, they use at least one digital channel
during their financial transactions. But still India is in the 54th position out
of 84 countries in the digital money Index (BCG 2019). Four pillars for
digital money index are; Government support, Financial and technology
infrastructure, Presence of digital banking solutions, and Propensity of
customers/businesses to use digital banking innovations. India has better
rating on technology and financial infrastructure; but fares poorly on
propensity to use digital innovations. Availability of low-cost smart
phones, localised contents, and low level of digital literacy in terms of
simple user experience are only needed for the simple adoption of such
products or services. But for success, sustained use of such services in
long run is essential.
When government of India, declared demonetisation on November
8, 2016, the objectives of the authority was to dispose of fake currency
notes, reveal the black money, and eradicate the drugs and terrorism
financing. In addition to that, one main objective which was not expressly
stated was to encourage the cashless transactions. The sudden declaration
of the demonetisation of currencies made a deep dip in Indian economy
and the immediate policy change created the crisis. It forced customers to

Chapter 1
24
use cashless system for a period. This incident has given a sudden
momentum on the internet-based banking technology. Though in the
initial days of demonetisation, there was a substantial increase in the
digital transactions and they seem to be declining later on. Users of the
technology-based banking at the time of demonetisation tend to go back
to the currency-based system after the release of new currencies. Nearly
after two years of the demonetisation, currency in the circulation has
crossed the pre-note ban level. This is the case and clear example to state
that, continued usage of TEBSS will not get a push by mere policy
compulsion. Hence, it can be concluded that, the rate of adoption is not at
all determines the success of these technologies, instead the active usage
of the same is to be considered.
A customer centric study of technology in banking was felt very
important for the situation in order to analyse the customer behaviour in
the post-adoption phase of such technologies. Investigation of the long-
term user behaviour with technology has been given important concern in
the technology-based studies across innovation adoption disciplines.
Similarly, academic research attention on technology adoption in banking
has to be focused towards the assessment of user experiences on
technologies in long run, rather than investigating the initial intention and
attitude towards the innovations. Since the application of innovations and
technology developments necessitate the success in long run, post-
adoption usage analysis become more important to the situation. It is clear
that technology advancement in banking sector would offer a complete
transformation of traditional banking to virtual platforms once the
continuance intention of users can be ensured.

Introduction
25
The current study is being conducted in a period when the country
was going through the biggest revolution in the banking sector, the
demonetisation. On 8th November 2016 the Prime Minister of India
declared an unexpected demonetisation of two higher denominations of
Indian currency notes. This resulted in crisis of shortage of currency notes
in the country. As an alternative solution for the crisis, people were forced
to go for the extensive use of cashless transactions through internet and
mobile based banking products and services. This was resulted in a
tremendous hike in the usage of technology-based banking products and
services by a vast population within a shorter period of time. Before
demonetisation, most of the technology-based banking products and
services were less popular or underutilised by customers. Hence the
adoption-based studies where extensively done during that period. As a
part of Digital India campaign, government of India promoted IT
infrastructure development and promoted some initiatives for technology
based financial inclusion programmes like PMJDY, Kisan Credit Card,
BHIM (UPI), Payment banking, E-wallets, etc. As there are many
advantages in going digital, it is indeed to track the usage behaviour of
early adopters in order to encourage credit/debit card payments and online
banking transactions through mobile or internet. Hence, the present study
becomes more relevant in the scenario of post-demonetisation in India.
This study is carried out in the state of Kerala. While looking into
the banking sector of Kerala, it is one of the total banked states in India in
the sense that, the majority of the population has a single bank account in
their name. Performance of banks in Kerala is now remarked as highly
competitive and efficient as the banks and bank branches are large in
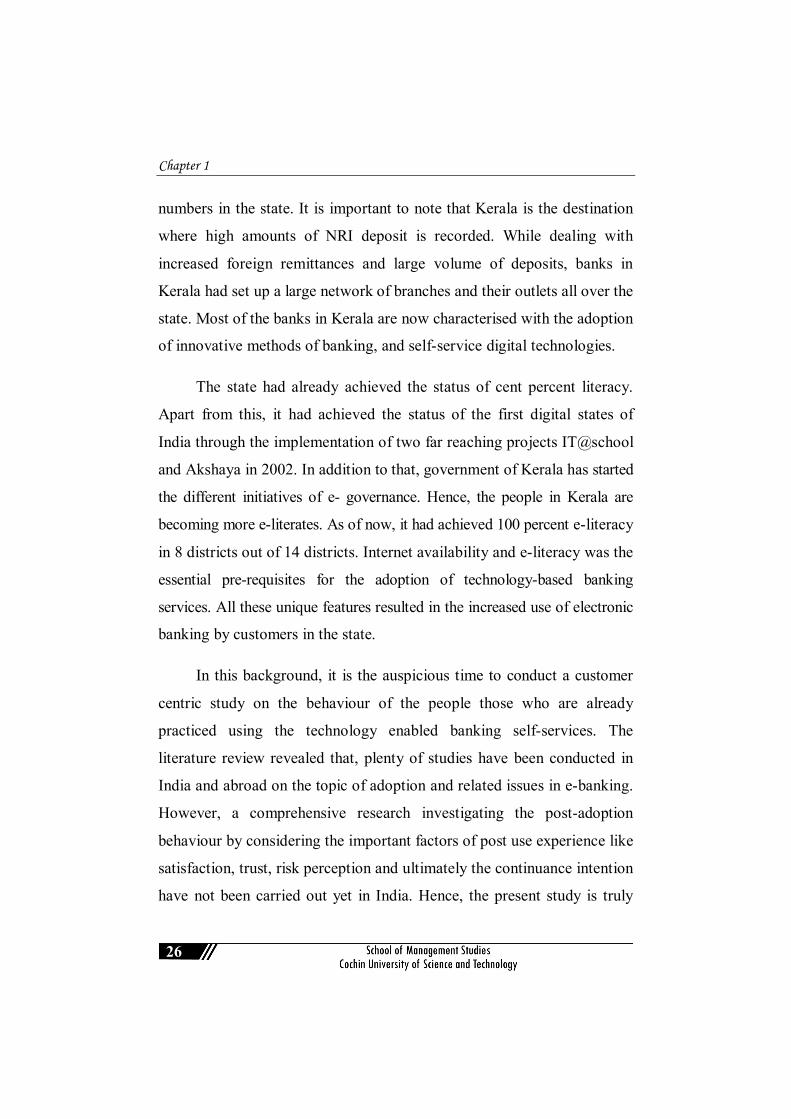
Chapter 1
26
numbers in the state. It is important to note that Kerala is the destination
where high amounts of NRI deposit is recorded. While dealing with
increased foreign remittances and large volume of deposits, banks in
Kerala had set up a large network of branches and their outlets all over the
state. Most of the banks in Kerala are now characterised with the adoption
of innovative methods of banking, and self-service digital technologies.
The state had already achieved the status of cent percent literacy.
Apart from this, it had achieved the status of the first digital states of
India through the implementation of two far reaching projects IT@school
and Akshaya in 2002. In addition to that, government of Kerala has started
the different initiatives of e- governance. Hence, the people in Kerala are
becoming more e-literates. As of now, it had achieved 100 percent e-literacy
in 8 districts out of 14 districts. Internet availability and e-literacy was the
essential pre-requisites for the adoption of technology-based banking
services. All these unique features resulted in the increased use of electronic
banking by customers in the state.
In this background, it is the auspicious time to conduct a customer
centric study on the behaviour of the people those who are already
practiced using the technology enabled banking self-services. The
literature review revealed that, plenty of studies have been conducted in
India and abroad on the topic of adoption and related issues in e-banking.
However, a comprehensive research investigating the post-adoption
behaviour by considering the important factors of post use experience like
satisfaction, trust, risk perception and ultimately the continuance intention
have not been carried out yet in India. Hence, the present study is truly

Introduction
27
relevant and opportune to perform at the point of view of both the
academic and banking perspectives.
1.6 Report Presentation
The present study explains the post-adoptive use and continuance
intention of bank customers in Technology Enabled Banking Self-
Services (TEBSS), by checking the impact of some factors on the
continuance intention. Integrated model linking customers’ perception on
adoptability of TEBSS to continuance intention by checking the influence
of some user experiences was proposed and empirically tested. The report
of the research work is presented in seven chapters.
Chapter 1: Introduction of the Study - Detailed introduction to the study
is given in the chapter about the overview of technology
adoption in banking sector. Technology adoption in Indian
banking sector, most common technology enabled banking
products and services and the future prospects of the trends
are discussed in detail. The significance of the present study
is also included in this chapter.
Chapter 2: Review of Literature - Earlier studies in the field of technology
adoption in banking sector, post-adoption studies, both
customer centric studies and others are considered for review.
Chapter 3: Conceptual Formulation of the Study - The chapter explains
the conceptual formulation of the study by explaining the
hypothesised relationship between variables in the study.

Chapter 1
28
Chapter 4: Research Methodology - This chapter explains the various
aspects of research methodology adopted for the current
study.
Chapter 5: Analysis of Purpose and Extent of Usage of TEBSS by
Customers - Discussed about the purpose and extent of usage
analysis of TEBSS. The first part of the chapter included the
basic demographic analysis of sample. Usage analysis of
TEBSS by customers is given in the following section which
includes the analysis of purpose and extent of usage of
TEBSS. Usage analysis was further explained on the basis of
different demographic characteristics of respondents.
Chapter 6: Relationship Between Customers’ Perception on Adoptability,
Post-use Experiences and Continuance Intention - The first
section of this chapter holds the analysis of customers’
perception on adoptability of TEBSS. Second section of the
chapter covers the analysis of post-use experiences of
customers and continuance intention. The third section of the
chapter holds the testing of hypotheses, mediation and
moderation analysis and assessment of conceptual model
proposed in chapter 3.
Chapter 7: Discussion, Findings, Suggestions and Conclusion - This
chapter presents the discussions, findings and suggestions. It
also includes the theoretical and practical implications of the
study followed by conclusion and scope for further research.

Introduction
29
References
[1] Ajimon (2013). A Customer Centric Study of Internet Banking in Kerala. Kottayam: Mahathma Gandhi University.
[2] Bradly & Sparks (2012). Explanations: If, When, and How They Aid Service Recovery. Journal of Services Marketing, 41-50.
[3] Malhotra Pooja (2009). An Analysis of Internet Banking Offerings and its Determinants in India. Internet research, Emerald, 87-106.
[4] Marous J (2018). Five Innovation Trends That Will Define Banking in 2019. Financial Brand
[5] Meuter & Robert (2000). Self-Service Technologies: Understanding Customer Satisfaction with Technology-Based Service Encounters. Journal of Marketing, 50-64.
[6] NPCI (2018) Electronic Payment System Representative Data, National Payment Corporation of India, Mumbai
[7] Salomann & Dous (2007). Self-Service Revisited; How to Manage Hi-tech and Hi-touch in Customer Relationships. Europian Management Journal, 310-319.
[8] Singh (2015). Customer Perception of Mobile Banking: An Empirical Study in National Capital Region Delhi. Journal of Internet Banking and Commerce.
[9] Subrangshu, S. (2016). Technological Innovations in Indian banking Sector- A Trend Analysis. Journal of Commerce and Management Thought, 171-185.
…..…..


Review of Literature
31
This chapter provides the detailed review of literature covering the
variables under the study. Chapter discusses the details of findings of
previous studies on technology adoption in banking sector in India as
well as abroad. Gaps in the literature are also described at the last
section of this chapter.

Chapter 2
32
2.1 Introduction
The banking sector had changed dramatically through the whole
period of its ancient form of bricks and mortar banking to the new form of
virtual banking. Studies on banking had taken place in all over the world.
The major studies conducted in the area of banking can be broadly
classified into studies on two perspectives banks’ perspectives and
customers’ perspectives. The sub categories of all the other literature were
routed from the main categories of the above two. Sub-divisions of the
available academic literature on banking can be further divided into retail
banking services, studies on distribution channels, technology adoption,
customers’ trust and customers’ satisfaction. The structure of e-banking
literature is depicted in the following picture for better understanding.
Fig. 2.1: Classification of E-banking Literature
Customer point of view
Institution point of view
Electronic banking literature
Retail banking services
Distribution channels
Adoption Customer
satisfaction Customer
trust

Review of Literature
33
The literature reviews divided into three sections for the present
study. The first section of the literature is related to the adoption of
technology enabled banking self -services. Since it is the primary thing to
be taken for consideration, the adoption and related issues were largely
studied in earlier literature. The first section of literature mainly focused
on the of adoption behaviour of the customers, to analyse the factors
behind the adoption of banking innovations irrespective of the technology
like internet banking, mobile banking, or bank cards. The Second section
of the literature review discussed is the studies in post-adoption behaviour
of customers relating to the technology. In this section of literature, most
of the post-adoption studies of technology adoption in general as well as
in banking sector were reviewed. From the detailed review of the
literature, it is evidenced that, customer satisfaction and customer trust are
the important issues once a customer started using the innovative banking
products and services. Customer satisfaction is crucial for retaining the
customers with existing technology for long term. When it comes to
usage of technology, customer trust is also important in addition to
satisfaction. Unlike other factors, satisfaction and post-use trust are
interrelated in the case of technology usage especially when it comes to
financial dealings. Trust is found significant in long term relationship
with any technology. Hence, the previous studies which have addressed
the satisfaction and trust in technology adoption had reviewed in this
section in detail. The last section of the literature review dealt with the
studies on continuance intention in using the technology. This section of
literature review presents the concept of intention to continue the usage of
technology and the related studies which explained continuance intention

Chapter 2
34
so far. These studies were originally reviewed mostly from information
system research. Since the focus of the present study is to identify the role
of different factors in explaining the continuance intention in using the
technology enabled banking self-services, the earlier studies took place in
the continuance intention with technology in banking sector were also
revised in depth.
2.2 Technology Adoption Research in Banking Sector
Adoption of technology in the banking sector was started in early
90’s with the introduction of the new banks as a part of deregulating the
economies for globalisation, privatisation, and liberalisation. Technology
adoption had great influences in the performance of banking activities and
the overall growth in the financial service sector itself. Technology
enabled products and services had changed the way of banking is done.
Adoption of information and communication technology and introduction
of information sharing system through interconnected networks, i.e.;
World Wide Web, made it possible to introduce the changes in the
financial service sector, as it was already implemented in many other
sectors. Literature on technology adoption in the banking sector was
concentrated mainly on the issues and impacts of technology adoption as
well as the factors that insist towards the adoption of technology. It was
the trend for many years earlier that, to identify the factors which
contributed towards the adoption of technology for delivering the services
to the customers in different forms. Most important changes happened in
the banking sector due to technology adoption were traced back from
the introduction of ATMs, Internet banking, Mobile banking and card
Review of Literature
35
technologies, self-service banking kiosks, NFC enabled cards and up to
robotics. Now the form of banking highly depends on technology.
Research on technology adoption in banking has gained rapid scholarly
attention in developing countries since the year 2000 when internet
banking became a popular phenomenon. The studies were mostly focused
in the area of adoption issues and prospects of internet banking, mobile
banking and satisfaction of the customers in the technology-oriented
products and services (Sabi, 2014).
Studies on adoption and use of technology in banking had routed in
the early 90s at the time of computerisations of branches. Wide use of
mobile and internet-based technologies changed the scenario later. After
2000, the internet technology emphasised in routing of delivery of
banking services to people. The first among the studies on technology
adoption in banking had discussed the issue of adoption in academic
research by (Sathye, 1999). His research revealed some factors like
security issues, lack of awareness, un-reasonable prices are the main
reasons for non-adoption of online banking. The most important factors
reported in their study for the non-adoption of technology were ‘lack of
awareness, and security issues’. Following to him, (Howcraft 2002) added
a list of factors leading to adoption of the banking technology such as
lower fees, recommendations by family/friends, 24-hours access to
services, time efficiency, better service quality and coverage in the
popular media etc. Other factors like accuracy, user-friendliness, transaction
speed, convenience, experience, involvement of consumers was added by
(Cheung & Michael, 2002) as influencing factors of adoption. Further they
had found that, individual expectations regarding accuracy, security,

Chapter 2
36
transactions speed, user friendliness, user involvement, and convenience are
the most important quality attributes in the perceived usefulness of
internet-based e-retail banking. Quality attributes like accuracy, security,
network speed, user-friendliness and convenience are highly contributed
to perceived usefulness and willingness to use it in different degrees.
By focusing on these factors, in the order of significance, financial
institutions would be able to effectively enhance the customer value of
internet/ e-retail banking.
According to the study (Serkan & Safak, 2004) reliability of the
bank and privacy, along with convenient aspects were the most important
elements of accepting the internet banking. Study demonstrated that,
information seeking activities and money transfers are most common
among the customers who adopted the technology enabled banking
services. The study examined the behaviour of the adopters and non-
adopters of internet banking. The result further revealed that, in both the
groups, there is no homogeneity in demographics. After the wide
popularity of the technology-based banking all over the world, banking on
technology has gained special academic attention. Journals in this
discipline have devoted special issues to the topic (Nath & Mukherjee,
2003).The research mostly done in the area of adoption related topics and
concentration was given in the identification of different factors behind
the adoption and non-adoption since the non-adoption was the real issue
during that time. Factors that influenced the adoption intention and
attitude of people towards the banking technology were frequently
analysed with different theories. Those factors are commonly appeared to
be consistent with different cultures across different countries.

Review of Literature
37
As stated earlier, the technology adoption in banking research was
originally started from the central issue of non- adoption of technology
for a long time. Customers’ perceptions were measured in those studies as
influential factors of adoption. A bunch of factors were identified like
lack of awareness and technology related issues which are limiting the
adoption intention. Laforet & Li (2005) identified perception of risk,
technological and computer skills are the main barriers to the adoption of
e-banking among customers. In their study, they had found that, security
reasons and lack of awareness caused the risk perception of customers in
adopting the technology in banking. A study on adoption of internet
banking was done by William & Kristy (2006) found that, accessibility as
the most important factor which contributes towards the adoption of
internet banking. Apart from accessibility, study found self-efficacy and
convenience impacted on consumer adoption of internet banking. This
study was conducted in the year 2006, which was the period when usage
of internet banking was very limited. The study also found that perceived
risk has some negative effect on adoption intention and they had further
stated that, customers during that period became more curious about the
trust and security concerns in the internet banking. In the same year (Gerrard
& Cunningham, 2006) identified eight major factors that inhibits the
adoption of e-banking. Risk, lack of perceived need, lack of knowledge
about the services, inertia, inaccessibility, lack of human touch, pricing
concerns and technology fatigue etc. are included in those factors.
Only after 2010, mobile banking and internet banking had
penetrated among common people. In India also, internet banking and
mobile banking gained popularity only after 2010. Several studies had

Chapter 2
38
conducted in this area related to adoption intention, safety, security issues
and other important factors. Studies in that period were mainly
concentrated on identifying the factors that lead to the acceptance of
internet banking and mobile banking. Both the customer perspective
studies as well as bank’s perspective studies were carried out to analyse
the critical factors. Major factors like security & privacy, trust,
innovativeness, familiarity, awareness level was identified by different
researchers as the reasons for acceptance of e-banking services among
Indian customers. In a study of internet banking acceptance (Dixit &
Datta, 2010) shared their view that, in spite of their security and privacy
concern, adult customers are willing to adopt online banking if banks
provide them necessary guidance. In another study (Thulani & Kosmas,
2011) indicated that people use mobile and internet banking only for
checking the account balances and payment of bills and to transfer funds.
He added that, cost reduction being the only influencing factor behind
their adoption.
After the spread of e- banking technology all over the world,
adoption issue became vital. During this period, behavioural theories of
technology adoption has been applied to explain the behaviour of
customers in acceptance of technology-oriented banking products and
services. In information system research, these theories were well
connected with the prediction of acceptance behaviour and use of
technology. Later, the technology adoption studies in banking sector
turned to apply these theories in order to find the best predictor to
adoption, underlying factors of satisfaction, trust and related issues in
technology. The theories most widely used in banking studies were

Review of Literature
39
include; Technology Acceptance Model, Innovation, Diffusion theory,
Theory of Planned Behaviour, Theory of Reasoned Action, Social
Cognitive Theory, Expectation Confirmation Theory, and Unified Theory
of Acceptance and Use of Technology (UTAUT) etc. But for predicting
the adoption and acceptance of technology, TAM, TPB, IDT etc. were
frequently used. Apart from explaining the behaviour with a theory alone,
researchers combined the constructs of one or more theories together to
better explain user behaviour. These theories are well discussed in the
conceptual formulation part of this study.
One of the most used theories of technology adoption was the
Technology Acceptance Model put forward (Davis F. , 1989). The model
was well accepted and most discussed one among the information system
researches. Moreover, it was accepted and applied by many other social
science theories to explain the technology acceptance behaviour of
people. The core of Technology Acceptance Model was the explanation
of behavioural intention in adopting a new technology. The theory
explained that ease of use and usefulness lead to attitudes and thereby
behavioural intention in using the technology. Theory of Planned
Behaviour (TPB) and the Theory of Reasoned Action (TRA) were already
proved as capable of explaining the innovation adoption behaviour, but
Technology Acceptance Model was much more relevant in the online
context or in internet-based technologies. Many researchers in the field of
banking and financial services had identified the influence of TAM
constructs in the adoption decision of internet and mobile banking for the
past few years.

Chapter 2
40
2.3 Users’ Perceptions on Technology Adoption Decisions
For measuring user attitudes in MIS research, Swason (1982) used
some perception related constructs. He found that the usage of information
report was based on the trade- off between perceived information quality and
associated cost of access. In his work, the perceived information quality was
demonstrated like usefulness and associated cost of access was like ease of
use. Both constructs were measured the perceptions of the potential users
in the usage of information report. After this study, perception measures
had been widely used to predict the user behaviour. After the initial TAM
model, Davis (1983) further analysed the constructs and found that,
perceived usefulness had direct influence on actual system usage. Later,
studies on TAM mainly focused on these two important constructs of ease
of use and usefulness and the predictive capability of the constructs on
behaviour was found as high at any context.
The term perceived ease of use was defined their study (Davis
1989) as “the degree to which a person believes that using a particular
system would be free from effort” and perceived usefulness as “the
degree to which a person believes that using a particular system would
enhance their job performance”. The constructs perceived ease of use and
usefulness had originally developed prior to the TAM theory. Prior
researchers were already found the importance of the two beliefs, which
has prime importance in adoption and use of a technology or any
innovation. In the information system research, similar constructs were
used in behaviour prediction. Bandura (1982) identified two constructs
self-efficacy and outcome judgment as influencing factors in predicting

Review of Literature
41
the behaviour on innovation adoption in any given instance. Self-efficacy
is how well one can execute a course of action required for a prospective
situation that was “ease of use” and the outcome judgment is the extent to
which a behaviour once successfully executed is believed to be linked to
valued outcomes that was “usefulness”.
Based on these constructs a study then carried out by Gefen &
Straub (1997) found that, males were given high importance on usefulness
whereas females had more importance in ease of use when tested the
adoption behaviour. Moreover, analysing the effect of TAM models in
technology adoption, many researchers tried to extend the TAM model
with situational specific variables and integrated the TAM model with
other models for analysing the influences. One of such comparative
analyses of TAM with other competing models i.e.; Theory of Planned
Behaviour, Decomposed Theory of Planned Behaviour, identified that
TPB theory has more explaining power than TAM because of the
variables attitudinal, social influence and subjective norms (Taylor &
Todd, 1995).
In 1995 Taylor & Todd explained the concept with integrating the
TAM model with TPB by integrating social influences and behavioural
control as added variables. The experienced groups and inexperienced
groups were compared in the study to analyse the behaviour by adding the
variables like subjective norms, voluntariness, image (social influence
process) and cognitive instrumental process (job relevance, output quality,
result demonstrability, and perceived ease of use). The usage intention
was measured in information system research by Venkatesh & Davis

Chapter 2
42
(2000) as an extension to the existing model of technology acceptance.
This modified model later known as TAM 2model. In their study, they
had found that perceived usefulness as the most important antecedent of
usage intention and the ease of use as the second important predictor of
usage intention. Also, they identified that when usage becomes mandatory,
the subjective norms had a direct effect on the usage intention. In the case
of usage becoming voluntary, the subjective norms have no direct effect on
it. They advocated that, as much as individuals experienced direct
experience with a system over time, user relied less on social information
on the formation of the perceived usefulness and intention whereas
continued to judge the system's usefulness based on potential status of
benefits resulting from the use.
Later, the UTAUT model explained the adoption of technology
from a completely new dimension. By integrating different models of
technology adoption (Viswanath & Morris, 2003) formed this model to
explain the technology acceptance. This model was proposed by
integrating eight models of adoption namely Theory of Reasoned Action,
Theory of Planned Behaviour, Technology Acceptance Model, Innovation
Diffusion Theory, the Motivational Model, models of combined TAM
and TPB, the model of PC utilisation and Social Cognitive Theory. A
longitudinal study was conducted with the proposed model in four different
organisations to analyse the adoption. The study found that performance
expectancy, effort expectancy, social influence and facilitating conditions
directly influenced the usage intention. Based on the UTAUT model
several technology adoption studies in banking had also been reported. A
study by Carolina & Oliveiraa (2014) used the UTAUT model to explain

Review of Literature
43
the user adoption behaviour of internet banking. In their study performance
expectancy, effort expectancy and social influence and risk perception
were found as significant predictors of adoption of internet banking.
Perceived risk has been found as strong predictor of adoption intention.
In supporting the view of extended models, (Kent & Kerem, 2005)
opined that, Model of Technology Acceptance should be reformulated to
focus more on the key construct usefulness in service systems. In his
study, it was found that the usefulness as the most important predictor of
usage intention. The study suggested that integrating trust with TAM will
give more emphasis on social exchange processes that are central to
adoption. Later, (Lee & Chi, 2009) combined the constructs in TAM and
TPB for an integrated model with perceived risks and perceived benefits
for explaining internet banking adoption among customers. The study
indicated that the perceived risk factors, especially security and privacy
risk and financial risks are adversely affecting the intention of customers
to adopt online banking and the positive factors which influence the
decision had perceived benefits and perceived usefulness.
Technology Acceptance Model with Theory of Planned Behaviour
was combined to add more factors and recognise their influence in
customer adoption by Bhmani & Yaghoubi (2010). Study found that,
perceived usefulness strongly predicts the behavioural intention in online
banking technologies. Ease of use, subjective norms and attitude were
also appeared as significant in determining the usage intention in the same
study. In another study (Wu & Lin, 2010) identified perceived ease of use
and trust are two important factors in the decision-making process to

Chapter 2
44
adopt online banking. When TAM theoretical model was extended with
convenience and computer self-efficacy, it was found that, computer self-
efficacy and convenience also had significant influence in predicting the
ease of use (Florentina & Shen, 2011). Analysis of the effect of ease of
use and usefulness along with attitude, perceived behavioural control,
subjective norm and perceived risk (constructs of theory of planned
behaviour) on adoption intention was found as positive in another
study(Al-Smadi & Mohammad, 2012). He identified that; adoption
intention is influenced by the attitude of persons. According to the
opinion of (Cyril Eze & Yaw, 2011) attitude of persons towards the
technology was the main predictor of adoption intention. The ease of use
and usefulness are helping the users to form the attitude. Hence, he
concluded that the two variables, ease of use and usefulness together can
predict the adoption behaviour.
The study of antecedents and consequences of technology adoption
in the banking sector (Joshua & Koshy, 2011) revealed that, usefulness
has significant impact on adoption intention whereas ease of use has only
less significance in adoption of such products and services. Study
identified that, level of adoption of ATMS seems high and all other
services like internet banking and mobile banking etc. were less
concentrated. The study analysed the individual adoption behaviour of the
technology-based banking self-services including ATMs, internet banking
and mobile banking. The level of adoption was checked with each of the
products among the users and reasons of non-adoption was also checked.

Review of Literature
45
The reason for reluctance of using the e-banking in the period
because of the expectation of risk and lack of pre- use trust (Kesharwani
& Singh Bisht, 2011). In the study, they had identified factors like ease of
use, usefulness, website quality and perceived risk are affecting the
internet banking adoption. Website quality had found a negative effect on
perceived risk. Thus, they recommended that, designing the website for
internet banking as more important to ensure the secure presentation in
order to enhance the security and thereby reduce the perceived risk.
Among the users of internet banking across China, India and Malaysia,
(Ernovianti & Matr, 2012) conducted a study and it was revealed that,
apart from ease of use and usefulness, self- efficacy also had a significant
effect in using the services.
TAM constructs with compatibility and perceived security and
privacy risk was again analysed in the study of (Giovanis & Apostolos,
2012). They had found that, compatibility was the key factor followed by
TAM factors and risk elements. One of the main attractions of this study
was that perceived usefulness had found a partial mediation between the
relationship of ease of use and behaviour intention to use internet
banking. They analysed the role of perceived risk factors on intention to
adopt the online banking technologies. It was like the findings of Geetha
& Vaithiyanathan (2012) that, ease of use and usefulness had a positive
influence whereas perceived risk had negative significant influence on
adoption intention. In the same way (Gamal & Gebba, 2013) found an
insignificant effect of usefulness on behavioural control when the
extended TAM model used with the Theory of Planned Behaviour
constructs to explain mobile banking adoption. Surprisingly, in his study

Chapter 2
46
another interesting finding was found that, perceived ease of use had an
insignificant effect on attitude towards mobile banking at the same time
perceived usefulness had significant effect. Another replication of the
model with the construct ‘government support and security analysis found
that, it had a positive association in determining the adoption intention of
online banking (Yee & Chong, 2013).
Influence of perceived ease of use, perceived usefulness, attitude,
subjective norm and perceived behavioural control on intention to use
internet banking were tested together by combining the two models
(TAM & TPB) by Safeena & Date et al. (2013), and had observed that
perceived ease of use, perceived usefulness, attitude, subjective norm and
perceived behavioural control are the influencing factors for adoption of
online banking. In the same year, another study (Maditinos & Chatzoudes,
2013) analysed the TAM model with risk factors to analyse the effects of
the adoption of online banking. The result of the study revealed that,
usefulness, security risk and performance risk had direct significant
impact on adoption intention. Whereas, ease of use and quality of internet
connection had only an indirect influence on adoption intention. Followed
by this study, another study (Muneesh & Sareen, 2013) also applied an
integrated model of TAM with web trust. The analysis of the effect of
web trust and TAM variables on internet banking adoption disclosed the
finding that, perceived ease of use alone as being less capable to promote
the adoption. Instead, accessibility and appeal play a far greater role in
encouraging the usage.

Review of Literature
47
Taking the perspective of users and non-users, (Jeong & Yoon, 2013)
identified that, consumers’ perceptions are different between mobile banking
users and non-users. For users, perceived ease of use is the most
important factor while perceived self-efficacy significantly influence non-
user’s adoption intention. Since the internet banking penetration appeared
as low and the impact of ease of use and usefulness together with internet
security traced as the reason for the same (Al-Rfou & Nahar, 2013).
Additionally, (Nasri & Zarai, 2014) brought an argument that, the role of
ease of use and usefulness in determining the intention to use was proved
by several studies but, what contributing to perceived usefulness and ease
of use to become the strong predictors was still unsearched. Further analysis
on these constructs indicated that, customers’ perceived usefulness was
determined by perceived ease of use, awareness of services and its
benefits and social influence, while their perceived ease of use was
affected by security and privacy and self-computer efficacy.
Repeatedly, adoption intention of e-banking in the study (Rahman
& Kaushik, 2014) extended the TAM model with the ‘need for interaction
and perceived risk’. The findings of this study indicated that the
usefulness of the service was the most important factor which lead to
adoption. But perceived risk was a vital issue in the adoption intention
with strong negative influence on adoption intention. In another study, by
integrating quality and experience to the five dimensions of TAM, ease of
use and experience (Alsamydai & Mahamood, 2014) were found as
prominent. Some other factors such as perceived cost and perceived risk
were examined in the study of Alsoufi & Ali (2014) and they failed to
prove the significant effect of these factors on the users' intention to use

Chapter 2
48
mobile banking. But adding the constructs compatibility, personalisation
and alliance services with the constructs ease of use and usefulness for
examining the influencing factors of usage and the result revealed that,
compatibility and personalisation had most significant influence than ease
of use and usefulness on usage (Daneshgadeh & Yıldırım, 2014). Adding
to his findings, Dash & Bhushan (2014) found that, trialability too had the
significant effect with compatibility on attitude in using the mobile
banking technology. Whereas, the relative advantage has no significant
impact in Indian context. Risk and need for interaction with bank
employees had evidenced to have significant influence on the adoption
decision of the customers across different types of technology-oriented
products and services. Among all these studies, the effect of ease of use
and usefulness had been examined with other related constructs and
majority of them showed that both the constructs had significant impact
than any other related constructs.
Apart from ease of use and usefulness, several other factors were
also identified in the literature as the influencing factors of adoption.
Since the ATMS were widely used and common service it rendered had a
strong influence of all factors in adoption (Kaushik & Zillur, 2014). In
other studies, majority of the factors were identified as same. Accessibility,
quality and security, user awareness, risk perceptions are established as
the important determinants of the extensive usage of internet-based
banking technologies (Shin Ho & Yahya, 2015). When it was tested with
six specific risk facets; security, privacy, social, time, performance and
financial risk synthesised with the construct perceived web site features
including perceived system quality and perceived information quality

Review of Literature
49
found that, perceived usefulness, perceived security, perceived social
facet, and perceived system quality are the most influential factors explaining
the adoption of internet banking services (Jayasiri & Gunawaradana, 2016).
Many studies were carried out based on TAM constructs with other
constructs in the field of banking research; Santouridis & Kyritsi (2013);
Candra & Sevenperi (2013); Tavishi & Kumar (2013); Maduku & Daniel
(2014); Sharma & Madhumohan (2015); Alwan & Abdelhailm (2016).
All these studies implied that TAM variables ‘perceived ease of use’ and
‘perceived usefulness’ in predicting the adoption intention and attitude
towards using the technology-oriented products and services. Contrasting
the view of all the researches in the field of internet banking with TAM,
Gounaris & Koritos (2013) had found out that, perceived characteristics
of the innovation are much more important in predicting the adoption
intention. The study also considered the demographic and psychometric
features of the respondents and identified the influence of the same on
adoption intention. Eight major factors had been identified in the decision
of adoption of mobile banking in the study (Sankar & Kumari, 2016) such
as awareness, ease of use, usefulness, social influence, security and
privacy risk, self -efficacy, financial cost, compatibility. Among these
identified factors, the study found usefulness has the most powerful
impact on the adoption behaviour and the social influence had the least
importance in the adoption of mobile banking. From the earlier period
itself the importance of the model TAM was proved in technology
adoption. The recent literature confirms that even if the TAM is an old
theory of adoption, it is not outdated in predicting the adoption behaviour.
Studies on TAM still implies that role of perceived ease of use and

Chapter 2
50
perceived usefulness are vital in technology acceptance/ intention of
adoption or innovation.
Decision to adopt a new technology is exactly the decision to use
the same. Making use of the technology enabled products and services in
the day to day banking transactions reached its growth stage after 2010.
Studies after 2010 in electronic banking research were mainly focused on
the usage and post-adoption issues.
2.4 Research on Post-adoption Behaviour of Customers on TEBSS Studies on the post-adoption behavior of customers related with
technology enabled banking self- services were addressed two types of
issues viz; customer satisfaction and customer trust. Once the services are
adopted by the customers, their experience after the usage shall determine
the usage and continuity in using the services later. For analysing the
experience of customers, three important factors like customer satisfaction,
customer trust and risk were under consideration for evaluating the future
user behavior. Satisfaction is the major determinant of future use by
customers after the use of any products or services. It has much relevance
in the case of invisible and intangible services. Banking services are highly
sensitive since it is related with the financial dealings of customers, and one
would always be conscious while utilising the same. Customer
satisfaction was treated as a crucial issue more or equal to the adoption
intention. Once a customer starts using the technology-oriented products
and services, he simply becomes the adopter, when he starts using the
same for his day to day activities, then only he become an active user, an

Review of Literature
51
active or extensive usage only can create a virtual banking system instead
of the traditional bricks and mortar system of banking. Post- adoption
behavior of technology hence is more relevant than that of adoption
behavior such that, it includes satisfaction, post-use trust, risk perception
and continuance intention.
2.4.1 Customer Satisfaction Studies in TEBSS
The study of satisfaction dates back to research of Cardozo (1965);
Howard & Sheth (1969). These studies are considered as the starting
point of scientific interest in satisfaction, its origin and consequences
(Firdous & Farooqi, 2015). Later the period, customer satisfaction had got
much attention from the academic researchers, now it is one of the most
researched areas of marketing dynamics. Based on the findings of earlier
researchers, satisfaction can be explained from two perspectives; conceptual
criterion and referential criterion. Conceptual criterion defines the customer
satisfaction through process/ types of responses of consumers. But the
referential criterion defines the customer satisfaction through the
reflections of the aspects of the situation in which the process or types of
responses occur. According to the referential criterion satisfaction is
identified from the point of view of a specific transaction as a post-choice
evaluative judgement or an emotional response of the customer in relation
with the adoption and use.
From the literature, it was understood that the satisfaction is the
general attitude manifested by consumers as a result of experience
accumulated through the buying behavior (Liebana-Cabanillas & Munoz-
Leiva, 2013). Apart from the satisfaction from goods and services,

Chapter 2
52
e-service satisfaction had also gained special importance after the
introduction of e-commerce and internet-based transactions. Richard
(1997) defined customer satisfaction as a judgment that a product or
service feature, or the products or service itself provides (or providing) a
pleasurable level of consumption related fulfillment, including levels of
under or over fulfillment.
Studies on satisfaction of internet-based technology-oriented
banking services gained much attention of scholars after 2010. Before
that, only few studies on satisfaction came in to popularity in online
banking context. End User Computing Satisfaction model was the model
to measure the satisfaction with technology related products and services
in information system research during that period. Constructs of EUCS
model content, ease of use and accuracy supported the satisfaction of the
customers. Hereafter the studies on satisfaction popularised and quality of
service satisfaction was adapted into online context. Researchers then
concentrated on the issue of satisfaction of the customers in the online
context, especially in the banking context. Different theories and models
had then emerged to explain the satisfaction. However, recently in marketing
research, studies were concentrated on online service satisfaction in financial
sector, as a part of consumer decision making.
Center of attention then broadly changed to satisfaction in online
banking rather than the adoption. Several studies were carried out to
measure the satisfaction in online banking context. Service quality was
the proximal measure of satisfaction in the service sector. In online
services also the customer satisfaction was measured in service quality

Review of Literature
53
scale. Studies on satisfaction in online banking was mainly focused
towards measuring the satisfaction by applying this scale. Satisfaction
depends on the quality of the services in terms of convenience,
accessibility, accuracy, security, usefulness, bank’s image and website
design in the online platform (Sadhegi & Hanzaee, 2010). Same finding
in one or other way was put forwarded in the study (Yoon & Cheolho,
2010) which described that; design, speed, security information, content
and customer support significantly influence the satisfaction. Whereas,
ease of use has no significant effect on the high experienced group and
low experienced group. The study also postulated that, the effect of
design, security, speed and information content on satisfaction were
significantly higher in the high experienced group, whereas in the low
experienced group, effect of customer support service on customer
satisfaction is significantly higher.
In addition to this, some important factors, which were expected to
affect the satisfaction were identified as security, authenticity and
reliability of the technology in the study (Rashid & Zohra, 2011). In
another study (Ahmad & Hasan, 2011) observed that, accessibility,
convenience, security, privacy content, design, fees & charges and speed
had significant impact on the customer satisfaction. The study confirmed
that the e-banking functionality had significant impact in customer
satisfaction, loyalty and thereby positive word of mouth. Adding to this
(Musiime & Ramadhan, 2011) noticed awareness as a principal factor
which influenced the satisfaction of customers in internet banking
context.

Chapter 2
54
Factors significantly influencing the satisfaction are identified by
(Kumbhar, 2011) in his study on customer satisfaction in e-banking. The
factors include, perceived value, brand perception, cost effectiveness,
easy to use, convenience, problem handling, security/assurance and
responsiveness etc. Some other factors like contact facilities, system
availability, fulfilment, efficiency and compensation were also found
significant in determining the satisfaction. In connection with this,
another five quality dimensions are studied by (Yashasvi & Mistry, 2012)
and observed that reliability, efficiency, privacy of information and
easiness to use the services significantly impacting satisfaction. Apart
from these factors, ease of service use, website design, speed of connectivity
and transactions, information security; information, content and support
services had found significant effect on user’s satisfaction in the study
(Mandan & Kheiry, 2013). But (Pratap & Bhattacharya, 2013) stated that
service delivery as the most important in customer satisfaction in online
context.
Former studies of measuring customer satisfaction in mobile
banking identified the factors like information quality and system quality
as influencing factors on satisfaction and moderating effect of trust on
information presentation and satisfaction relationship (Chung & Kwon,
2009). All the service quality scale items, reliability, responsiveness,
empathy and tangibility and assurance were tested to analyse the effect on
customer satisfaction in another study and found all the four factors
except assurance had significant impact on customer satisfaction. Among
the factors, empathy had a stronger impact on customer satisfaction
(Aghdaie & Faghani, 2012). Besides these findings Kapoor (2015) also

Review of Literature
55
identified that service quality dimensions like tangibility, reliability,
responsiveness, assurance and empathy have more or less a great impact
on customer satisfaction with internet banking services. Together with
service quality, system quality and information quality also influenced
customer satisfaction in electronic banking.
Customer evaluates the utility of the services after the initial usage
for assessing the satisfaction. Supporting this view, a study (Chulmo &
Yulia, 2013) found reliability, convenience, ease of use and range of
functionality of the e- banking technology as critical factors in the
customer evaluation of the utility. In the case of internet banking
information quality was important since they are already experienced with
it, but for mobile banking, usefulness had significant impact on utility and
customer satisfaction. Analysis of the e-service quality factors further,
(Vijay, 2013) further identified system availability, e-fulfilment, accuracy,
efficiency, security, responsiveness, ease of use, convenience, cost
effectiveness, problem handling, compensation, contact and perceived
value are reliable dimensions of e- service quality scale and it had good
predictive ability in determination of customers’ satisfaction. In addition
to these factors, two additional factors, aesthetic value and proper
guidance of the website were also found as crucial for e-service quality
and e-satisfaction ultimately to e-loyalty in the study (Mohd & Md Ariff,
2013). In accordance with the findings of earlier studies, (Asadollah &
Askaripoor, 2013) found significant impact of accessibility, easiness,
trust, security, website designing, website content and speed as explaining
the satisfaction. Agreeing with this Mohamad & Salwani (2013) stated
Chapter 2
56
that technology trust is one of the important factors, which influences
customer satisfaction in internet banking.
In a study with 708 e -banking customers in Tehran City Nasrin &
Akram (2014) identified five factors after exploratory factor analysis that,
usability, efficiency, security and website image influencing customer
satisfaction. Security, privacy, accountability and designing website
further identified as factors which are significant in predicting customer
satisfaction in internet banking context in the work (Naser & Mohamad,
2014). Whereas user friendliness and safety among the four factors like
speed and trust worthiness found as most important in satisfaction in
another study (Islam & Umme, 2014). A supporting inference was made
by George & Kumar (2014) while examining the quality dimensions of
service influencing satisfaction. They have identified the same factors in
the previous studies i.e.; reliability, responsiveness, security, privacy and
fulfillment, except efficiency and website attributes as largely influencing
customer satisfaction. In their study, they found that privacy has strong
influence on satisfaction. Following their study, a nine dimension scale
of e-service quality for measuring the satisfaction was identified in the
study (Agrawal & Tripathi, 2014) which includes reliability, responsiveness,
ease of use, personalisation, security and trust, website aesthetic, efficiency,
fulfillment and contact.
Since the four factors, ease of use, customer support, privacy,
transaction and payment have observed as significant in predicting
customer satisfaction (Abdullah & Som, 2015), (Firdous & Farooqi,
2015), continuous transformation of the service features of the internet

Review of Literature
57
banking transactions necessitated banks for consistent updates. It was
recognised that, problem with satisfaction arise when there was mismatch
of the expectations met by customers in any of these quality dimensions
(Munir, 2015). Again, in another study (Amin, 2016), four dimensions of
the service quality had noted as having substantial role in explaining
satisfaction of the customers and the efficiency of banking website had
found as stronger. The study also stated that customer e– service quality,
e- satisfaction and e-loyalty, are positively interconnected. Apart from
these, two additional factors namely convenience and speed were also
found as significant in the study (Goh & Yeo, 2016). Ease of use, security
and speed of transactions were also found significant in the study of
(Naser & Majid, 2016) in the same year.
Researchers turned their attention from explaining the service
quality for satisfaction, to trust, privacy and security issues as those
became crucial when information and technology related frauds reported
while transacting with online banking. The trustworthiness of the banking
products and services with the speed of delivery bring into being
considerable changes in internet banking satisfaction (Sanjeepan & Ragel,
2007). They confirm that the gap of customer awareness about internet-
based products and services was existed in the period of study. Awareness
about the use, benefits, risk, safety and privacy issues are not well shared
among the customers from the respective authorities. In another study
(Saeedeh & Abolfazl, 2017) proved that personalisation of services has no
effect on customer satisfaction.

Chapter 2
58
The mobile banking products and systems have proved their pivotal
role in the financial deepening, especially in rural India. It has ensured
customers to perform banking operations by making use of mobile
phones. In most of the developing countries, especially in India, the
number of mobile connections exceeds the number of people with bank
accounts. The rural India was facing the problem of lack of access to most
of the financial and banking products. This was because of the fact that 74
per cent of the Indian population lives in rural India and only 18 percent
of the total banking exists in rural area. The spreading of mobile banking
products and systems hence can contribute to erase the rural-urban divide
and integrate rural economy with the global economy(John, 2013).
With the objective of changing the focus to the behavior of early
adopters of mobile banking to evaluate the aspects of their satisfaction,
many studies were taken forward. Number of elements are identified by
researchers leading to satisfaction in mobile banking was similar to other
electronic banking technologies. Ease of use, usefulness, relative advantage,
perception of risk had significant influence on customer satisfaction
(Kumari & Janaka 2014). Satisfaction in mobile banking was measured
with the service quality scale by Ataur et al. (2017) also found that, all
the four factors had significant influence on satisfaction. The findings
were repeated in the study (Mousa & Luvai, 2017). Adding points to
this, a study in the following year proved that, perceived ease of use,
perceived usefulness, security and consumer awareness had influence in
adoption and satisfaction in mobile banking(Hada & Singh, 2018). To
be more specific, (Kodithuwakku, 2018) identified three type of factors;
technology related factors which include, website quality, user friendliness,

Review of Literature
59
responsiveness, speed and availability, transactions based factors, which
include security, cost, assurance, reliability, availability of transactions,
types and usefulness and demographic factors like age, income, education
and gender as having significant influence on customer satisfaction in
internet based banking.
In electronic banking research, it was vital to analyse the satisfaction of
the customers who are using the technology-oriented banking products and
services. Since the lack of direct interference and guidance from banks and
the financial dealings are carried out in online platforms, the bonding
between banks and customers depends on the quality of the services offered.
Satisfaction in service-oriented sectors like, job satisfaction, satisfaction on
the systems and institutions, etc. are measured in research using service
quality scale called SERVQUAL developed by (Parasuraman & Leonard,
1985). Studies on satisfaction of electronic banking users gained the
academic attention of researchers after the extensive usage of ATMS and
other related services by customers after 2000. Apart from satisfaction
studies of ATMS and phone banking, attention of researchers was turned
towards internet and mobile based banking service satisfaction. When the
internet came into practice, satisfaction of internet-based products and
services became a necessity. For the purpose of the same (Parasuraman,
Zeithaml, & Malhotra, 2005) developed a scale E-S-Q as a measure of
electronic service quality. Most of the studies in online context adapted the
scale of e-service quality to measure the e- service satisfaction. E-services
are characterised as self -services, lack of direct interactions between service
providers and users are absent and it will ultimately result in need of
customer satisfaction for existence.

Chapter 2
60
Since the way of banking was shifted from the traditional system to
e- channels, the way of delivering services to customers were completely
taken to online platforms. Customers interactions with banks were routed
to this channel, hence the measurement of satisfaction was based on these
channels. Website of the banks to perform the banking operations was
assessed to measure the satisfaction and trust in e-banking since the
surface of banking activities directed from the websites. For measuring
the quality of services, website quality had evidenced as having
commendable influence. For measuring the website quality different types
of measurement scales were used by researchers, like WebQual (Watson
& Goodhue, 2002), SITEQUAL (Zeithaml & Parasuraman, 2002), later
an e-service quality scale named as E –SQ scale with five dimensions like
: information availability, ease of use, privacy/security, graphic style,
reliability (Zeithaml & Parasuraman, 2002). The scale was refined later
by (Parasuraman, Zeithaml, & Malhotra, 2005) and confirmed as four
which includes efficiency, fulfillment, availability, privacy. Later they
added additional items to the existing scale and named it as re-recovery of
service quality scale, consisting of 11 items. Scales of service quality and
e- service quality is interchangeably used by researchers and academicians
for measuring the satisfaction in online context.
2.4.2 Studies on Customers’ Trust in TEBSS
The role of trust in technology and related products and services
was not a necessity but mandatory. To build and maintain long term
relationship between the customer and online service provider, especially
in the era of interconnected networked globe, trust has an imperative role.

Review of Literature
61
Mainly there exist three types of trust relationship in conceptualisation:
People with people, people with institution and people with technology.
The critical antecedents of the trust with technology were characteristics
of the technology itself, the person using it, or the functions performed
with technology. People initially might be having a perception regarding
trust in technology, it develops through experience and once they got a
satisfactory experience then the trust bonding deepens. Role of trust was
fundamentally analysed in mobile and internet banking context mainly in
adoption intention studies.
In information system research as well as related areas of research,
where technology adoption and related issues discussed, the pre-adoption
trust mainly the perception about trust was analysed. Perceptual factors
are tested for identifying the perceived trust. Three perceptual factors,
including perceived credibility, perceived ease of use and perceived risk
had found significant in determining the trust (Cynthia L. & Beverly,
2003). Trust concept got research attention when it was evidenced as
essential for satisfied and expected outcome as a result of transactions
(David & Elena, 2003). Findings of the study (Pin & Hsin, 2005) noticed
that expensive mobile banking and e-commerce system remains un-
utilised because of the existence of trust related issues. Most of the trust-
based studies pointed out the relationship between risk perception and
trust perception. Trust is the “willingness to take risk,” and the level of
trust is an indication of the amount of risk that one is willing to take
(Schoorman & Mayer, 2007). Lii (2009) empirically tested and found the
mediating role of customer trust and satisfaction to customer loyalty. In the
online context, trust was a much more important factor since the parties

Chapter 2
62
engaged in the transactions are not keeping a personal contact. In the spirit of
trust and distrust customer accepts and uses the technology-based products
and service (Benamati, 2010). Irrespective of the transactions, whether
M-Commerce, online banking or online service, privacy and trust have
received much attention in the literature. But today’s privacy and trust
issues are not limited to only activities relating to online transactions, but
many activities on the internet (Liao & Liu, 2011).
Trust in the online banking context were studied by different
researchers across the world. They examined the factors antecedent to
trust in electronic banking to explain the usage and behavioural intention.
Two important antecedents of trust in electronic banking were identified
(Yousafzai & Foxall, 2003) as perceived security and perceived privacy.
For potential customer and repeat customer trust appeared as different.
Service quality dimensions of reliability, assurance, responsiveness have
significant impact on repeated customers’ trust. Whereas, for empathy did
not find significant impact on the same. Apart from the service quality
factors, the study found that satisfaction of the customers of technology
had significant impact on trust in repeated customers (Hee-Woong & Xu,
2004). Structural assurance had the strongest influence for creating
trusting belief in transacting online. Apart from this, familiarity and
situational normality also had significant impact on trust (Man, 2006).
The important thing with post-use trust in specific technology was
grounded with the awareness of the user about the technology as well as
their ability to anticipate the result under different conditions. So, the
construct of awareness was found positively related with the post-
adoption usage and trust.

Review of Literature
63
Trust was identified as an important antecedent of the user
behaviour intention by (Yousafzai & Foxall, 2009) and stated it as a
multi-dimensional construct with three antecedents namely perceived
trustworthiness, perceived privacy and perceived security. Also, another
relation between trust and perceived risk was identified (Kyung & Bipin,
2009) as risk perception mediates the relationship between trust and
trusting behaviour. Since the studies on trust in post-adoption especially
in relation with loyalty and continuance intention was fragmented.
Studies were mainly concentrated on pre-adoption stage issues connecting
with trust. After the analysis of post-adoption use and trust in IT (Jason &
Harrison, 2009) identified specific characteristics of IT; functionality,
support, helpfulness, predictability and dependability to be addressed by
the trust. Inter- relationship and interactions among customer’s online
trust and other relevant factors such as satisfaction and loyalty in e-
banking found significant (Kmaran & Mohammed, 2010).
Several studies proved that, for user continuance intention with the
technology needed trusting intention as fundamental. Online purchase and
services involved a great deal of risk, once the service provider can assure
trust in the service and the customer experienced it, then the future
intentions to use will be generated (Syed & Qureshi, 2011). In addition to
that, another study (Soheila Ghaane, 2011) found mediating role of e-trust
and e-satisfaction to e-loyalty in e- banking context. The e-loyalty was
nothing but the customer being loyal or having a positive intimacy with
the service provider. The role of trust was analysed with channel
technologies in their work (Dimitriadis & Nickolaos, 2011). In their
study, they had identified that mediating role of trust in technology

Chapter 2
64
acceptance and trusting belief. Furthermore, trusting intention also had
evidenced as strongly mediating on the trusting belief and technology
acceptance. The study was made on two channels simultaneously internet
banking as well as phone banking. The behavioural intention was identified
as pattern of adoption as like each channel but differ across transactions.
Trust was found as a very relevant factor in customers’ pre-use and
post-use phase of information system usage. It was also found as vital in
creating a positive attitude in adoption decision in pre-adoption stage.
Then trust develops and changes according to time with the user
interactions with the technology. Pre-use trust had significant influence
on satisfaction as well as on post use-trust (Venkatesh & Thong, 2011).
In pre-use trust (initial trust) potential users have not yet experienced the
new technology and thus build the initial trust based on their assumptions.
Existing users of technology have already experienced its characteristics
and built post-use trust based on their own perceptions, which may
confirm or contradict their initial trust (Ortega, 2011). In order to be loyal,
identified trust is important. To be specific, trust in the sense of security
was found as the important factor leading to trusting belief and customer
satisfaction to continuance intention in online banking context (Susanto &
Chang, 2012). Trust is built from factors such as guarantee, safety net,
etc. in the online context and it is improved through ease of use and
accessibility of information (Mahmoud & Alsheyyab, 2012).
Trust was tested as a mediating factor for measuring the effective
commitment-trust relationship with online banking (Abdollahi &
Saideenia, 2012) and proved that, there existed a mediating effect of trust

Review of Literature
65
in the relationship. Also, another study indicated that, security, privacy
and usability had significant association with trust in online banking
context. In the opinion of (Zhou, 2012), for continued usage of technology,
especially in internet technology, trust is affected by the perceived
usefulness and flow of experience. Different views exist on customer-
based trust in virtual platform. In a study, institution-based trust was
identified as the most important type of trust in online banking (Naimat &
Poloola, 2013).
Pre-use trust in electronic banking was well discussed among
researchers. Factors influencing the pre-use trust were identified in e-
banking context (Yi-Luen & Shyong Ong, 2015) and found perceived
security and perceived risk are closely associated with the trust in
technology. Among the identified factors, perceived security is one of the
main antecedents of trust and risk. This finding was a supporting evidence
of many other earlier researchers. Once, the customer has full confidence
on the service provider, then the trusting intentions and usage intention
will be high. Same view was shared in another study as lack of privacy
from imprudent website that caused the leakage of user personal
information, which further leads to distrust of the system. This distrust of
the system then would generate a negative effect to the intention to reuse
internet business transactions and in sharing these bad experiences with
others. Hence, if there were no strict rules and regulations in this business
transaction would yield a negative effect toward reuse intention (Piriyakul
& Raepepan, 2015).

Chapter 2
66
Trust leads the user to adopt and commit to use technology and
although there are many degrees of trust, commitment was more clearly
defined. Though a user may look, lurk and otherwise test a system, a
point comes when the choice must be made to trust it enough to utilise it
or decline to commit (Patricia, 2016). In explaining post-adoptive user
trust in technology-based products and services, majority of the studies
followed the ideas of post- adoption behaviour studies in information
system research. Plenty of evidences supporting the views that post-
adoption behaviour as more relevant to explain the trust and repeat usage
(Jason & Thatcher, 2017).
Satisfaction studies in mobile banking mainly analysed the effect of
trust. It was found in the previous literatures that; trust is vital in
explaining customer satisfaction in online context. Supporting the view of
the succeeding studies on mobile banking customer satisfaction proved
the positive association between trust and satisfaction. To the existing
literature on trust and satisfaction (Hong, 2015) added two important
findings that, trust has not only the direct effect but also has indirect
effect through perceived ease of use, perceived usefulness and structural
assurance in online payment context. Supporting to the findings, (Hossain
& Md Yahin, 2015) also found that trust as essential for satisfaction and
loyalty in mobile banking context. When satisfaction in mobile banking
services becomes a point of discussion, trust plays an important role in
explaining satisfaction with loyalty and positive word of mouth. These
factors had been tested with perceived justice as a moderator and revealed
variance in customer satisfaction according to high and low justice group.
Some researchers further discussed the mediating role of trust in mobile

Review of Literature
67
banking satisfaction, but the role of trust in shaping customer satisfaction
in mobile banking was rare (Wahab & Yousuf, 2017).
2.5 Risk Perception of Customers in TEBSS Adoption
Risk perception is one of the vital elements in studying the
consumer behaviour, especially in the case of online background.
Customer behaviour was predicted with a strong effect on perception of
risk. It is more powerful to explain the customer behaviour, since the
customer will always try to avoid mistakes rather than trying to maximise
the utility. Customer perspective risk is evident in-service context since it
is intangible, un-standardised and un-guaranteed. Research on risk
perception in the online context, especially in M-Commerce and
technology usage has got more attention after the advent of internet and
wide use of wireless technology by the common man like mobile phone
and other related items.
Risk perception of customers regarding the technology itself as well
as online transactions goes way back to information system research. At
the time of the adoption of technology by human beings happened for the
first time, most of the prospective users had not used it. The main reason
of the technology aversion was the perception of different type of risks by
users regarding the technology. The research on risk perception in online
banking also was an important issue for the period of its introduction till
now. Cunningham (1967) identified two categories of perceived risk,
performance risk and psychosocial risk. He describes performance risk in
three subgroups as temporal, economic and effort and psychosocial into
two as psychological and social risk. He again classified it under six

Chapter 2
68
dimensions as performance, financial, opportunity/time, safety, social and
psychological loss. Perceived risk in e- banking was the potential for loss,
in the pursuit of desired outcome of using e- banking services. In e-
service context, performance related risk was more important including
time risk and financial risk (Featherman & Pavlou, 2002). Very rich of
consumer behaviour literature identified and used the risk concept as such
as he identified. The indirect effect of perceived risk identified on
adoption intention demonstrated that, it influences only through trust
(Lee, Kim, & Ki, 2007).
The moderating effect of risk perception on trust and trusting
intention was checked by (Kyung & Bipin, 2009). But the result implied
that, interaction effect is significant for trusting intention, by perceived
risk. Another study demonstrated that perceived risk and trust in online
banking contexts as closely associated and both have a significant effect
in determining the usage of online banking services (Lifen & Koenig-
Lewis, 2010). Consumers may have different orientations towards
perceived risk underlying in the technology they are using. Consumers
may be risk averse or innovative with respect to the type of orientation,
the level of impact of different types of risk to them may vary (Klaus-
Peter & Seegebarth, 2010).
The trust could not be separated from risk, need of trust arises in an
online context, because it involves a certain amount of risk (Ankit
Kesharwani, 2012). In another study of e- banking usage, (Gholamreza &
Eiz, 2012) stated psychological risk, uncertainty about result and
operational risk were more relevant to the context. In another study

Review of Literature
69
among the different dimensions of perceived risk in online banking
context, (Farzianpour & Mahsa, 2014) identified performance risk,
privacy and security risk dimensions had significant effect on adoption
intention. Among these types of risks, privacy risk was more crucial. In
another study of risk management in the online banking context identified
security risk as most threatening issue among online banking users as well
as the greatest challenge to the service providers (Abdou, John, &
Adewunmi, 2014). Supporting the earlier studies, performance risk, social
risk and time risk, financial risk and the security risk were identified as
mostly influencing the usage of technology-based banking services
(Fadare, 2016).
In e-banking context, risk was treated as a multi-dimensional
construct. Several authors identified the different dimensions of risk
associated with e-banking. The similarity of the fact was that, most of the
studies used different dimensions of risk to measure risk perception in
online banking adoption (Kassim & T.Ramayah, 2015). For identifying
the continuance intention in using electronic banking, a study in Malaysia
was conducted by (Normalini & Ramayah, 2015) who identified social
risk, time loss risk, opportunity cost risk are having considerable effect on
continuity in using the e-banking services.
Moderating role of risk perception was tested in the study of (Kim
& Hyo-Joo, 2008) in the adoption of technology. Prior to his study, most
of the information system researchers were identified and analysed the
risk perception as the important antecedent of the adoption intention. In
their study, they had tested the role of risk perception as the moderator in

Chapter 2
70
the adoption intention. The moderating effect was tested in the relationship
of ease of use and usefulness to the adoption. The study found that, users
who perceive higher risk about technology will be affected by how easy it
can be used. The study advocated that when users perceive low risk,
managers must focus on communicating usefulness of the technology.
2.6 Studies on Continuance Intention in Technology Adoption Context
Continuance intention was discussed as a research topic in early
information system research, then it was applied in Productions and
Operations, Marketing, Financial services, Human Resource Management
and all other allied disciplines. The topic got academic interests and
enriched with plenty of studies later throughout the period, especially in
behavioural studies in social science. The mass of the continuance
intention literature sheds light towards the future of the adapted
technology, whether it is an information system, mobile app, internet
banking or any other technology-based system or service or process.
Studies backed with great emphasis on the theories of continuance
intention was, theories of technology adoption and user behaviour in
information system research. The main theory of continuance intention
was the expectation and confirmation theory by a series of studies by
Oliver (1977). Most of the studies based this theory to explain the
continuance intention behaviour, extensions and modifications were made
to this theory by researchers over the period. Initial acceptance of the
information system was an important first step towards realising
information system success, long term viability and its eventual success
depend on continued use rather than first time use (Bhattacherjee, 2001).

Review of Literature
71
Studies on continuance intention were largely reviewed from
information system research, marketing research and other related
disciplines. For current study, online technology continuance studies are
fundamentally examined and the brief summary of the earlier findings
regarding the factors affecting continuance intention in such technologies
are discussed.
Most of the studies done earlier on service quality and continuance
intention together depicted that, perceived usefulness has significant
influence on continuance intention. In an examination of extended use of
complex information system, a study put forwarded another important and
quite different conclusion that, perceived ease of use has strong impact on
predicting extended usage of such systems rather than perceived usefulness.
Another interesting finding of this study was satisfaction has no relevance
in the presence of ease of use and usefulness for determining the extent of
usage of information system (Hsieh & Wei Wang, 2007). Similarly, past
usage and usage habit had proved as also significant in the user continuance
decisions (Wu & Kuo, 2008). Contradictorily, (Jen-Hwa Hu & Brown,
2009) found that, service quality dimensions had significant impact
on customer’s continuance intention in e-service context. In their study on
e- learning system (Chen & Chang, 2013) observed that, perceived value
and satisfaction are the two major determinants together explains the
continuance intention. For perceived value, information quality was
essential. Supporting to this in mobile commerce context, a study identified
that, quality of service factors perceived usefulness and satisfaction highly
influenced the customer continuance intention in dealing with mobile
commerce (Lee & Chen, 2014).

Chapter 2
72
In social networking site usage, continuance intention has been
tested with an integrated model of post acceptance of information system
with perceived ease of use (Chen & Huei-Huang, 2011). Utility aspect
was found as more important in the post acceptance stage than hedonic
factors. Hence, the continuance intention in online services mainly
depended on these utilitarian factors (Prybutok & Xu, 2011). So, the
UTAUT2 model with service quality was integrated by (Albugami &
Bellaj, 2014) and found that, performance expectancy, website design,
habit and security as the significant factors which affected continuance
intention in online technologies.
Again, continuance intention with social networking sites usage
(Praveena & Thomas, 2014) also disclosed the effect of some factors
perceived ease of use, perceived usefulness with perceived enjoyment.
Since the social networking sites were used for pleasurable level of
experience, perceived enjoyment, (additional factor, which is context
specific) showed much influence than the original TAM variable on
attitude. Adding personality variables to the integrative model of
information system continuance intention, (Kim & Lee, 2016) found that,
information system quality in terms of system congruence and expectation
congruence had a direct effect on the satisfaction and satisfaction had a
direct significant effect on continuance intention. Additionally, by extending
the original Information System Continuance Model and Expectation
Confirmation Model with the construct ease of use (Cicic & Semina,
2015) found it had significant impact on satisfaction and continuance use
intention.
Review of Literature
73
Another study of mobile money transfer technology, continuance
use intention was analysed and indicated that, perceived usefulness, trust,
subjective norms and satisfaction had significant effects on continuance
intention (Yousuf & Ali, 2017). The latest study on continuance use
intention in information system research indicated that, a combined model
of TAM with the theory of interpersonal behaviour has better explaining
capacity of continuance intention. It can be used as a supplementary
model to explain continuance use intention (Cheung & Huang, 2017).
Very few studies had concentrated on customer’s continuance
intention in e- banking context. A study by (Kasheir & Ashour, 2009)
demonstrated that ease of use has the bearing in predicting the
continuance intention in internet banking. Whereas, novice customers or
those considering first time adoption of internet banking may be
influenced by perceived usefulness, perceived ease of use and subjective
norms. Once the customer uses the services, the effect of these variables
may diminish and ease of use may become salient. Supporting these
findings,(Gupta, Rakhi, & Shiv, 2013) argued that, value dimensions had
a significant impact over other dimensions like social dimensions,
technology dimensions and channel dimensions, on continuance use
intention in internet banking.
Compatibility and satisfaction were added with TAM model in another
study (Tsai, Jui-Lin, & Ming-Tien, 2014) to predict the continuance
intention of internet banking, it had found that, all the antecedents, ease of
use, usefulness compatibility and satisfaction had significant effect on
user continuance intention. But in contrary to the findings of the other

Chapter 2
74
studies, they found ease of use has less impact on continuance intention
when compared with other constructs.
Continued use of internet banking was discussed by some earlier
researchers in the academic field. But mobile banking continued use
studies were less in numbers, since it was much more sophisticated
technology in banking. Service quality factors of mobile banking with
customer satisfaction and perceived risk had been analysed in the study
(Kumar & Ravindran, 2012) and found that, the quality features like
information quality, network quality and satisfaction has strong influence
in explaining continuance intention. Post-use trust in mobile banking has
been analysed in another study (Al-Ghazali, Rasli, & Yusoff, 2015) to
explain the continuance use behaviour. It was indicated that, information
quality and system quality defined the post-use trust in mobile banking
context. It supported the model of satisfaction attitudinal loyalty along
with quality measures for continuance use intentions.
In a concurrent channel usage context, bank client’s beliefs about
internet banking as well as cross channel evaluative synergies and dis-
synergies were found as impacting the continued use of mobile banking
(Boshoff & Jacques Nel, 2014). Convenience and time saving benefits
experience of concurrent user in internet banking strongly influenced their
mobile banking usefulness perceptions. On the other hand, mobile
banking continued use intention was pertaining with mobile banking risk
perceptions, trust and self-efficacy.
When the smartphone based banking services using smart phone
app became popular, a study (Chang & Young, 2016) on smartphone

Review of Literature
75
banking evidenced that, users did not consider security and privacy for
satisfaction, even though they are considerably influencing the user trust.
Continuity intention on smartphone banking services with expectation
and confirmation theory in another study showed that, confirmation after
the usage was affected by security, trust, privacy, satisfaction and
usefulness. Meanwhile, the usefulness considerably impacted satisfaction
and continuance intention additionally trust was affected by security and
privacy (Chang, 2016). Perceived risk, service quality and technology
readiness of the customers were identified together in order to measure
the continuity intention on e-banking. It demonstrated an indirect impact
of technology readiness and perceived risk through service quality on
continuance intention. Integrating the construct trust with expectation
confirmation model (Shahimi & Rani, 2018) developed a conceptual
model for explaining continuance intention in mobile banking services.
The proposed model was tested and proved its validity.
From the detailed review of the available literature summarised
above, it is observed that a comprehensive study on post-adoption
behaviour of customers is yet to be done, specifically focusing on
continuance intention in using TEBSS. Based on this observation, the
following literature gap has been identified. The proposed study is aiming
to fill this research gap.
2.7 Research Gap
The present review of literature on technology adoption in banking
sector confirmed that, throughout the previous three decades, the volume
of research under adoption of technology is vigorous. The researchers in

Chapter 2
76
this field had been eager to know the adoption intention of such
technology enabled banking products and services. It began with ATMs
and evolved through internet banking, mobile banking, bank cards and
now reached in smartphone mobile banking apps and digital payments.
While looking at these studies on technology adoption in the banking
sector, either from customers’ perspective or from the banks’ perspective,
most of the studies were found addressing the issues of acceptance of
technology.
The banking sector developed and shaped as it is in the present form
simply because of the technology adoption. It had started years back
when the bank offices were computerised and developed through
automation of the services. The current e-banking researches are highly
attributed to adoption behaviour and those studies focused on various
factors that favour and limiting adoption of technology. Now the
technology adoption has reached at its peak and there is no relevancy in
re-analysing the same factors which were contributing to the adoption of
such technologies in today’s context. Additionally, lion’s share of such
studies in banking are emphasised in ascertaining the intention of
adoption or intention to use such technologies. Post-adoption studies are
rare and very less in numbers in the banking context. Also, in the
available post-adoption studies, analysis of post-use behaviour after their
initial usage of TEBSS are missing. The earlier studies already stated that
the intention and actual use are not same in the technology/innovation
adoption context. Even though, the studies in e-banking considered the
term intention to use the TEBSS as actual use of TEBSS, but there exists
intention and actual behaviour gap. Only when the usage analysis of

Review of Literature
77
TEBSS is conducted after the initial adoption, this gap is getting
identified. Present studies in post-adoption behaviour of customers in
banking technologies are missing this actual usage analysis of TEBSS.
Hence the literature review basically highlights the need for carrying out
an empirical study on post-use behaviour of customers of TEBSS with
special attention to the usage analysis.
As stated earlier, researchers and practitioners emphasised their
attention towards analysing the post-adoption behaviour of customers of
these technology-enabled banking services after a decade of adoption of
these technologies. But most of the studies on post-adoption behaviour
ended-up in measuring customer satisfaction rather than analysing the
post-use experiences of customers. Information system research itself
supports the fact that users’ satisfaction is not an adequate measure of
success of an innovation/new technology, but it is the extended and
continued use of a system or an innovation. Hence, the focus should be
given to analyse the future intention of customers in using such
innovations. Existing studies in e-banking context were hardly given the
priority towards this domain.
Moreover, the literature review strongly highlights the need for
analysing the post-use experience, since the long-term success of any
technology/innovation is attributed to the favourable experience in the use
of such technologies and which further determines the future intention
and extended use of such innovations. Due to the increasing competition,
banks are trying hard to attain uniqueness in service delivery to retain the
customers as loyal. In a system which follows same technology, methods

Chapter 2
78
and procedures, just co-existing without being unique will gradually make
the banks lose the competition. Retaining the existing customers is more
crucial and challenging than attracting a new customer. This is the reason
for the continuous updating of technology, which focus on innovations to
improve customer experiences. Thus, for banks and financial service
providers, it was highly needed to understand the post-use experiences of
customers to provide unique customer experiences to stand ahead of
competition. Hence, it is utmost important to focus the research interest
towards ascertaining the post-use experiences covering post-use trust and
risk perception of customers in using TEBSS in addition to satisfaction. A
comprehensive study covering post-use experience and future intention of
TEBSS is still lacking in the present scenario.
While looking at the previous studies on continuance intention with
technologies, it was identified that, customer satisfaction as the main
antecedent of continuance intention. But in information system research
especially in new technology adoption context, trust is taken as one of the
prominent factors that explains the user behaviour in the post-adoption
stage. No major studies in e-banking literature were found as analysing
the post-use trust as an antecedent to continuance intention. Moreover,
lack of perceived trust was found as one of the important factors that
limiting the customers’ adoption to TEBSS due to the reason that the
financial dealings of the customers are highly sensitive, hence they are
given prime focus to safety and security issues. Since no previous studies
explained how the customer satisfaction and post-use trust influence the
continuance intention of customers in using TEBSS, it is indeed to

Review of Literature
79
analyse the influence of post-use trust and satisfaction in determining the
future intention to use the TEBSS.
Furthermore, the previous studies in information system research
identified that, customers are having certain adoptability perceptions
which are evidenced to have significant influence both in the adoption
and post-adoption stage of a new technology. These common perceptions
include user awareness, ease of use, usefulness and accessibility of the
technology. These perceptions are largely used in the technology adoption
studies in banking sector to explain the adoption intention. Since the
TEBSS use of customers depend on the adoptability features of TEBSS, it
is truly relevant to analyse the influence of customers’ perceptions on
adoptability of TEBSS in the post-use experiences as well in the future
intention to use the TEBSS. An integrated study covering the three phases
of technology adoption such as intention, adoption and continuance
should ascertain the user perceptions in the intention stage, user
experiences in the adoption stage and future intention in the continuance
stage. Considerable shortage of studies was noticed covering all these
elements together in e-banking context.
Apart from all these, Kerala is one of the banking states in India
where, people are more techno-savvy, high literates and having high
quality of life index compared to other states in India. A study on
continuance intention in TEBSS is more relevant as far as Kerala is
concerned since most of the people in Kerala have already started using
the same.

Chapter 2
80
2.8 Chapter Summary
The present chapter of literature review discusses the insights of the
earlier studies done in technology adoption in the banking sector. Studies
related to technology adoption, post-adoption studies related to customer
satisfaction, trust, risk and security issues and continuance intention were
reviewed and presented in detail. Apart from the studies in banking,
studies mostly reviewed from information system research and marketing
research to support the theoretical model depicted in the study. The
review has shown that, there are still un-explored areas of research
interests in the technology adoption behaviour of people especially in
banking context. The last section of the chapter includes the research gap
of the study.
References
[1] Abdollahi & Saideenia (2012). Factors Affecting Client Trust in Online Banking -A Case Study of SAMAN. International Journal of Economics and Business Modeling, 149-151.
[2] Abdou & Adewunmi (2014). An Investigation of Risk Management Practices in Electronic Banking: The Case of the UK Banks. Banks and Bank Systems, 1-24.
[3] Abdullah & Som (2015). Internet Service Features and Satisfaction Among Internet Banking Users. Journal of Management Research, 400-410.
[4] Aghdaie & Faghani (2012). Mobile Banking Service Quality and Customer Satisfaction (Application of SERVQUAL Model). International Journal of Management and Business Research, 351-361.
[5] Agrawal & Seth (2014). A Conceptual Framework on Review of E-Service Quality in bBnking Industry. International Journal of Social, Behavioral, Educational, Economic, Business and Industrial Engineering, 3903-3907.

Review of Literature
81
[6] Al- Eddin Mohd Khalaf & Hasan (2011). E-banking Functionality and Outcomes of Customer Satisfaction: An Empirical Investigation. International Journal of Marketing Studies, 50-65.
[7] Albugami & Bellaj (2014). The Continued Use of Internet Banking: Combining UTAUT2 Theory and Service Quality. Journal of Global Management Research, 11-28.
[8] Al-Ghazali & Rasli (2015). Antecedents of Continuous Usage Intention of Mobile Banking Services from the Perspective of DeLone and McLean Model of Information System Success. International Journal of Economics and Financial Issues, 13-21.
[9] Al-Jabri & Ibrahim (2012). Mobile Banking Adoption: Application of Diffusion of Innovation Theory. Journal of Electronic Commerce Research,, 379-391.
[10] Al-Rfou & Nahar (2013). The Usage of Internet Banking - Evidence from Jordan. Asian Economic and Financial Review, 614-623.
[11] Alsamydai & Mahamood (2014). Adaptation of the Technology Acceptance Model (TAM) to the Use of Mobile Banking Services. International Review of Management and Business Research, 2016-2028.
[12] Al-Smadi & Mohammad (2012). Factors Affecting Adoption of Electronic Banking: An Analysis of the Perspectives of Bank Customers. International Journal of Business and Social Science, 294-309.
[13] AlSoufi & Ali (2014). Customers Perception of Mobile Banking Adoption in Kingdom of Bahrain-An Empirical Assessement of an Extended TAM Model. International Journal of Managing Information Technology, 1-13.
[14] Alwan & Abdelhalim Issa (2016). Determinants of Internet Banking Adoption Among Customers of Commercial Banks: An Empirical Study in the Jordanian Banking sector. International Journal of Business and Management, 95-104.
[15] Amin (2016). Internet banking Service Quality and Its Implication on E-customer Satisfaction and E-customer Loyalty. International Journal of Bank Marketing,, 280-306.
[16] Ankit Kesharwani (2012). The Impact of Trust and Perceived Risk on Internet Banking Adoption in India: An Extension of Technology Acceptance Model. International Journal of Bank Marketing, 303-322.
[17] Asadollah & Askaripoor (2013). The Impact of E-Baking Service Quality Dimensions on Customer's Satisfaction and Brand Equity (Case Study: Refah Bank, Tehran). Business and Management Research, 25-37.

Chapter 2
82
[18] Ataur & Mahamudul (2017). Mobile Banking Service Quality and Customer Satisfaction in Bangladesh:An Analysis. Cost Management, 25-32.
[19] Bahmani& Yaghoubi (2010). Factors Affecting the Adoption of Online Banking An Integration of Technology Acceptance Model and Theory of Planned Behavior. International Journal of Business and Management, 159-165.
[20] Bandura (1982). Self Efficacy Mechanism in Human Agency. American Psychologist, 122-147.
[21] Barry Howcraft (2013). Consumer Attitude and the Usage and Adoption of Home‐based Banking in the United Kingdom. International Journal of Bank Marketing, 111-121.
[22] Benamati (2010). Trust and Distrust in Online banking, Their Role in Developing Countries. Information Technology for Development, 161-175.
[23] Bhattacherjee (2001). Understanding Information System Continuance; An Expectation Confirmation Model. MIS Quarterly, 351-370.
[24] Boshoff & Jacques (2014). The Impact of Cross-Channel Cognitive Evaluation on the Continued Intentions of Mobile Banking. Management Dynamics, 1-18.
[25] Candra & Sevenpri (2013). Revisit Technology Acceptance Model for Internet Banking (Case Study: Public Banking in Indonesia). International Conference on Computer, Networks and Communication Engineering (pp. 734-735). Indonesia: Atlantis Press.
[26] Cardozo (1965). An Experimental Study of Customer Effort, Expectation, and Satisfaction. Journal of Marketing Research, 244-249.
[27] Carolina & Oliveiraa (2014). Understanding the Internet banking Adoption: A Unified Theory of Acceptance and Use of Technology and Perceived Risk Application. International Journal of Information Management, 1-13.
[28] Chang & Young (2016). Determinants of Continuance Intention to Use the Smartphone Banking Services; An extention to Expectation Confirmation Model. Industrial Management and Data System, 508-525.
[29] Chen & Chnag (2013). Exploring the Determinants of E‐learning Systems Continuance Intention in Academic Libraries. Library Management, 40-55.
[30] Chen & Huei-Huang (2011). A Conceptual Model to Understand the Effects of Perceptionon on the Continuance Intention in Facebook. Australian Journal of Business and Management Research, 29-34.

Review of Literature
83
[31] Cheung & Zhu (2003). Online Consumer Behavior: A Review and Agenda for Future Research. 16th Bled eCommerce Conference eTransformation (pp. 194-218). Slovenia: Bled, Slovenia.
[32] Cheung & Huang (2017). Cognitive Factors in Predicting Continued Use of Information Systems with Technology Adoption Models. Information Research, 1-47.
[33] Cheung & Michael (2002). Internet-Based E-banking and Consumer Attitudes; An Empirical Study. Information and Management, 283-295.
[34] Chulmo & Yulia (2013). A study of Mobile and Internet banking Service- Applying for IS Success Model. Asia Pacefic Journal of Information System, 65-86.
[35] Chung & Kwon (2009). Effect of Trust level on Mobile banking Satisfaction: A Multi-group Analysis of Information System Success Instruments. Behavior and Information Technology, 549-562.
[36] Cicic & Semina (2015). Changes in Beliefs, Satisfaction and Information System Continuance Intention of Experienced Users. Intenational Journal of Business and Information Systems, 509-535.
[37] Cunningham (1967). The Major Dimensions of Perceived Risk. Risk Taking and Information Handling in Consumer Behavior. MA, USA: Harvard University Press,.
[38] Cynthia & Beverly (2003). On-line Trust: Concepts, Evolving themes, A Model. Internattional Journal of Human-Computer Studies, 737-758.
[39] Cyril Eze & Yaw (2011). Factors Affecting Internet Banking Adoption among Young Adults: An Evidence from Malesia. International Conference on Social Science and Humanity, 377-381.
[40] Daneshgadeh & Yıldırım (2014). Empirical Investigation of Internet Banking Usage: The Case of Turkey. Procedia Technology (pp. 322-331). Turkey: Elsevier.
[41] Dash & Bhusan (2014). Determinants of Customers’ Adoption of Mobile Banking: An Empirical Study by Integrating Diffusion of Innovation with Attitude. Journal of Internet Banking and Commerce, 1-21.
[42] David & Elena (2003). Trust and TAM in Online Shoping: An Integrated Model. M I S Quarterly, 51-90.
[43] Davis & Mayer (2007). An Integrative Model of Organisational Trust: Past, Present and Future. Academy of Management Review, 344-354.

Chapter 2
84
[44] Davis (1989). Perceived Usefulness,Perceived Ease of Use, and User Acceptance of Information Technology. MIS Quarterly, 319-340.
[45] Davis (1993). Use Acceptance of Computer Technology: System Charecteristics and User Pereptions. International Journal of Man- Machine Studies, 475-487.
[46] Dimitriadis & Nickolaos (2011). The Effect of Trust, Channel Technology and Transaction Type on the Adoption of Self-Service Bank Channels. The Service Industries Journal, 1293-1310.
[47] Dixit & Datta (2010). Acceptance of E-banking among Adult Customers: An Empirical Investigation in India. Journal of Internet Banking and Commerce, 1-17.
[48] El- Kasheir & Ashour (2009). Factors Affecting Continued Usage of Internet Banking Among Egyptian Customers. Communication of the IBIMA, 252-263.
[49] Ernovianti & Matr (2012). The Usage of Internet Banking Service among Highe Learning Students in Malaysia. American Journal of Economics, 105-108.
[50] Fadare (2016). A Survey on Perceived Risk and Intention of Adopting Internet Banking. Journal of Internet Banking and Commerce, 1-21.
[51] Farzianpour & Mahsa (2014). Consumers' Perceived Risk and Its Effects on Adoption of Online Banking Services. American Journal of Applied Sciences, 47-56.
[52] Featherman & Pavlou (2002). Predicting E- service adoption, A Perceived Risk Facets Perspective. Human- Computer Interaction Studies in MIS, 1034-1046.
[53] Firdous & Farooqi (2015). Impact of Internet Banking Service Quality on Customer Satisfaction. Journal of Internet Banking and Commerce.
[54] Florentina Rusu & Shen (2011). An Empirical Study on E-Banking Acceptance in the United Arab Emirates (UAE). Journal of Electronic Banking Systems, 1-9.
[55] Gamal & Gebba (2013). Mobile Banking Adoption: An Examination of TechnologyAcceptance Model and Theory of Planned Behavior. International Journal of Business Research and Development, 35-50.
[56] Geetha & Vaithiyanathan (2012). Assessment of a Modified Technology Acceptance Model among E-banking Customers in Coimbatore City. International Journal of Innovation, Management and Technology, 181-187.

Review of Literature
85
[57] Gefen & Straub (1997). Gender Difference in the Perception and Use of E-mail: An Extention to the Technology Acceptance Model. MIS Quarterly, 389-400.
[58] George & Kumar (2014). Impact of Service Quality Dimensions in Internet Banking on Customer Satisfaction. Springer, 73-85.
[59] Gerrard & Cunningham (2006). Why Consumers are not Using Internet Banking: A Qualitative Study. Journal of Service Marketing, 160-168.
[60] Gholamreza & Khaled (2012). Technology of E-banking: Perspective of Costumers’ Perceived Risk and Uncertainty. Indian Journal of Science and Technology, 2200-2208.
[61] Giovanis, & Apostolos. (2012). An Extention of TAM Model with IDT and Security/ Privacy Risk in the Adoption of Internet Banking Services in Greece. Euromed Journal of Business, 24-53.
[62] Goh & Yeo (2016). Understanding Customer Satisfaction of Internet Banking: A Case study in Malacca. Procedia Economics and Finance, Science Direct, Elsevier. 80-85.
[63] Gounaris & Koritos (2013). Investigating the Drivers of Internet Banking Adoption Decision: A Comparison of Three Alternative Frameworks. International Journal of Bank Marketing, 282-304.
[64] Gupta & Rakhi (2013). Dimensions Affecting Consumers’ Continued Usage and Frequency of Usage of Internet Banking: Empirical Evidence from India. International Journal of Engineering and Innovative Technology (IJEIT), 21-32.
[65] Hada & Singh (2018). Online Banking and Customer Satisfaction in Public and Private Sector Banks: Evidence from India. IOSR Journal of Business and Management, 10-20.
[66] Hee-Woong & Xu (2004). A Comparison of Online Trust Building Factors between Potential Customers and Repeat Customers. Journal of the Association for Information Systems, 392-420.
[67] Hernandez-Ortega (2011). The Role of Post use Trust in the Acceptance of a Technolgy: Drivers and Consequances. Technovision, 523-538.
[68] Hong (2015). Examining Mobile Payment User Adoption; From the Perspective of Trust. International Journal of Networking and Virtual Organisations, 117-130.
[69] Hossain & Md Yahin (2015). Mobile Banking and Customer Satisfaction: The Case of Dhaka City. World Review of Business Research, 108-120.

Chapter 2
86
[70] Howard & Sheth (1969). The Theory of Buyer Behavior. New York: Willey Marketing Series.
[71] Hsieh & Wei Wang (2007). Explaining Employees’ Extended Use of Complex Information Systems. European Journal of Information Systems, 216-227.
[72] Iranmanesh & Ali (2012). New Approach to Study of Factors Affecting Adoption of Electronic Banking Services with Emphasis on the Role of Positive Word of Mouth. African Journal of Business Management, 4328-4335.
[73] Islam & Umme (2014). Customer Satisfaction of Internet Banking in Bangladesh: A Case Study on Citibank N.A. Asian Journal of Applied Science and Engineering, 51-62.
[74] Jaism & Hamdi (2012). Factors Influening Consume's Satisfaction and Continuity to deal with E- banking Services. Global Journal of Management and Business Research, 128-142.
[75] Jason & Harrison (2009). The Role of Trust in Post-Adoption IT Exploration: An Empirical Examination of Knowledge Management Systems. IEEE Transactions and Engineering Management, 1-15.
[76] Jason & Thatcher (2017). How and Why Trust Matters in Post-Adoptive Usage: The Mediating Roles of Internal and External Self-efficacy. The Journal of Strategic Informations, 1-21.
[77] Jayasiri & Dharmadasa (2016). Adoption of Internet Banking in Sri Lanka - An extension to Technology Acceptance Model. Asia Pacefic Journal of Contemporary Education and communication Technology, 179-189.
[78] Jen-Hwa & Brown (2009). Determinants of Service Quality and Continuance Intention of Online Services: The Case of eTax. Journal of the American Society for Information Science and Technology, 292-306.
[79] Jeong & Yoon (2013). An Empirical Investigation on Consumer Acceptance of Mobile Banking Services. Business and Management Research, 31-40.
[80] John (2013). Mobile Banking Products and Rural India: An Evaluation. IOSR Journal of Economics and Finance, 36-40.
[81] Joshua & Koshy (2011). Usage Patterns of Electronic Banking Services by Urban Educated Customers: Glimpses from India. Journal of Internet Banking and Commerce, 1-12.

Review of Literature
87
[82] Kapoor (2015). Customer Satisfaction and E–Banking Services: A Case Study of Tricity. International Journal of Innovative Research in Science, Engineering and Technology, 10270-10277.
[83] Kassim & Ramayah (2015). Measurement Model of Risk Perception in Internet Banking Based on Malysian Context. ARPN Journal of Engineering and Applied Sciences, 17632-17639.
[84] Kaushik & Zillur (2014). Innovation Adoption Across Self-Service Banking Technologies in India. International Journal of Bank Marketing, 96-121.
[85] Kent & Kerem (2005). Customer Acceptance of Internet Banking in Estonia. International Journal of Bank Marketing, 200-216.
[86] Kesharwani & Singh (2011). The Impact of Trust and Perceived Risk on Internet Banking Adoption in India. International Journal of Bank Marketing, 303-322.
[87] Kim & Hong (2016). Antecedents of Use-Continuance in Information Systems: Toward an Inegrative View. Journal of Computer Information Systems, 61-73.
[88] Kim & Hyo-Joo (2008). The Effects of Perceived Risk and Technology Type on Users’ Acceptance of Technologies. Information and Management, 1-9.
[89] Klaus-Peter & Seegebarth (2010). The Influence of Consumers’ Risk Attitudes and Behavioron the Adoption of Online Banking Services. Journal of Marketing Trends, 7-16.
[90] Kmaran & Mohammed (2010). A Model for E- banking Trust in Iran's Banking Industry. International Journal of Industrial Engineering and Production Research, 23-33.
[91] Kodithuwakku (2018). Impact of Internet Banking on Customer Satisfaction: A Case Study of State Banks in Kandy District. Academy of Social Science Journal, 1114-1122.
[92] Kumar & Ravindran (2012). An Empirical Study on Service Quality Perceptions and Continuance Intention In Mobile Banking Context in India. Journal of Internet Banking and Commerce, 1-22.
[93] Kumari & Janaka (2014). Impact of Mobile Banking Services on CustomerSatisfaction:A Study on Sri Lankan State Commercial Bank. International Journal of Computer and Information Technology, 546-552.
Chapter 2
88
[94] Kumbhar (2011). Factors Affecting Customer Satisfaction in E- banking- Some Evidence from Indian Banks. Management Research and Practice, 1-14.
[95] Kyung & Bipin (2009). Trust, Perceived Risk and Trusting Behavior in Internet banking. Asia Pacefic Journal of Information System, 1-23.
[96] Laforet & Li (2005). Consumers’ Attitudes Towards Online and Mobile Banking in China. International Journal of Bank marketig, 362-380.
[97] Lee & Chi (2009). Factors Influencing the Adoption of Internet Banking: An Integration of TAM and TPB with Perceived Risk and Perceived Benefit. Electronic Commerce Research and Applications, 130-141.
[98] Lee & Kim (2007). Factors Influencing the Adoption Behavior of Mobile Banking : A South Korean Perspective. Journal of Internet Banking and Commerce, 1-9.
[99] Lee & Chen (2014). Perceived Quality as a Key Antecedent in Continuance Inetntion on Mobile Commerce. International Journal of Electronic Commerce Studies, 123-142.
[100] Liao & Kuanchin (2011). Examining the Impact of Privacy, Trust and Risk Perceptions Beyond Monetary Transactions: An Integrated Model. Electronic Commerce Research and Applications, 702-715.
[101] Liebana-Cabanillas & Munoz-Leiva (2013). The Determinants of Satisfaction with E-banking. Industrial Management & Data Systems, 750-767.
[102] Lifen & Koenig-Lewis (2010). Adoption of Internet banking Services in China: Is it all about Trust? International Journal of Bank Marketing, 7-26.
[103] Lii (2009). A Model of Customer E-loyalty in the Online Banking. Economics Bulletin , 891-902.
[104] Maditinos & Chatzoudes (2013). An Examination of the Critical Factors Affecting Consumer Acceptance of Online Banking; A Focus on the Dimensions of Risk. Journal of Systems and Information Technology, 97-116.
[105] Maduku & Daniel (2014). Customers’ Adoption and Use of E-banking Services: The South African Perspective. Banks and Bank Systems, 78-88.
[106] Mahmoud & Alsheyyab (2012). Effect of Trust on E-Banking User’s Satisfaction: A Review. Research Journal of Applied Sciences, Engineering and Technology, 1397-1406.

Review of Literature
89
[107] Man (2006). Factors Affecting Customers' Trust in Online Banking. Hong Kong: Hong Kong Baptist University.
[108] Mandan & Kheiry (2013). Analysis of the Effects of Electronic Banking on Customer Satisfaction and Loyalty (Case study: Selected Branches of Melli Bank in Tehran). Inter Disciplinary Journal of Contemporary Reseach in Business, 230-241.
[109] Mohamad & Salwani (2013). Technology Trust and Mobile Banking Satisfaction: A Case of Malaysian Consumers. International Conference on Innovation, Management and Technology Research, Elsevier. 53-58.
[110] Mohd & Md Ariff (2013). The Impacts of Service Quality and Customer Satisfaction on Customer Loyalty in Internet Banking. Procedia - Social and Behavioral Sciences, Elsevier, 469-473
[111] Mousa & Luvai (2017). Privacy and Personalisation in Continued Usage Intention of Mobile Banking: An Integrative Perspective. Information System Frontiers, 1-13.
[112] Muneesh & Sareen (2013). Factors Influencing the level of Adoption of Internet Banking: An Integration of TAM and Web Trust Model. Asian Journal of Management Research, 130-145.
[113] Munir (2015). E-Banking Service Quality and Customer Satisfaction of a State Owned Schedule Bank of Bangladesh. Journal of Internet Banking and Commerce.
[114] Musiime & Ramadhan (2011). Internet Banking, Consumer Adoption and Customer Satisfaction. African Journal of Marketing Management, 261-269.
[115] Naimat & Poloola (2013). The Effect of Trust in Adoption of Internet Banking: A case study of Nigeria. Academic Research Journals, 20-24.
[116] Naser & Majid (2016). Investigating Effective Factors on Customer Satisfaction of Internet banking ; The Case of Post Bank of Iran. International Journal of Humanities and Cultural Studies, 1706-1718.
[117] Naser & Mohamad (2014). Studying the Impact of E-Service Quality on E-Loyalty of Customers in the area of E- banking Services. Journal of Management and Sustainability, 126-133.
[118] Nasri & Zarai (2014). Emprical Analysis in Internet Banking Adoption in Tunisia. Asian Economic and Financial Review, 1812-1825.
[119] Nasrin & Akram (2014). Identify and Rank the Factors Affecting Customer Satisfaction of E-Banking. International Business and Management, 162-168.

Chapter 2
90
[120] Nath & Mukherjee (2003). A Model of Trust in Online Relationship Banking. The International Journal of Bank Marketing, 5-15.
[121] Normalini & Ramayah (2015). Perceived Risk Factors Influence on Intention to Continue Using Internet Banking among Malaysians. Global Business Review.
[122] Oliver (1980). A Cognitive Model of the Antecedents and Consequences of Satisfaction Decisions. Journal of Marketing Research, 460-469.
[123] Oliver (1977). Effect of Expectation and Disconfirmation on Post- Exposure Product Evaluations - An Alternative Interpretation. Journal of Applied Psychology, 480-486.
[124] Parasuraman & Zeithaml. (2005). E-S-QUAL a Multiple-item Scale for Assessing Electronic Service Quality. Journal of Service Research, 213-233.
[125] Parasuraman & Leonard (1985). A Conceptual Model of Service Quality and Its Implication for Future Research (SERVQUAL). International Journal of Marketing, 41-50.
[126] Patricia (2016). When, How, and Why Do We Trust Technology Too Much? Emotions, Technology and Behavior, 85-106.
[127] Pin & Hsin (2005). Toward an Understanding of the Behavioral Intention to Use Mobile banking. Computers in Human behavior, 873-891.
[128] Piriyakul & Raepepan (2015). Effects of Trust, Satisfaction and Factors Corresponding to TAM on Intention to Reuse Internet Business Transaction. International Review of Management and Business Research, 872-890.
[129] Pratap & Bhattacharya (2013). Customer Satisfaction in Indian Retail Banking: A Grounded Theory Approach. USA: Nova Southeastern University.
[130] Praveena & Thomas (2014). Continuance Intention to Use Facebook: A Study of Perceived Enjoyment and TAM. Bonfring International Journal of Industrial Engineering and Management Science, 24-29.
[131] Prybutok & Xu (2011). An Integrated Model for Customer Online Repurchase Intention. Faculty Research and Creative Activity, 1-11.
[132] Rahman & Kaushik (2014). Innovation Adoption Across Self-Service Banking Technologies in India. International Journal of Bank Marketing, 96-120.

Review of Literature
91
[133] Rashid & Saleem. (2011). Relationship Between Customer Satisfaction and Mobile Banking Adoption in Pakistan. International Journal of Trade, Economics and Finance, 537-544.
[134] Richard (1997). Satisfaction: A Behavioural Perspective on the Consumer. NewYork: McGraw Hill.
[135] Sabi (2014). Research Trends in the Diffusion of Internet Banking in Developing Countries. Journal of Internet Banking and Commerce, 1-31.
[136] Sadhegi & Hanzaee (2010). Customer Satisfaction Factors (CSFs) with Online Banking Services in an Islamic Country Iran. Journal of Islamic Marketing, 249-267.
[137] Saeedeh & Abolfazl (2017). Effect of Electronic Service Quality on Customer Satisfaction and Loyalty Saderat Bank’s Customers. International Journal of Scientific study, 407-411.
[138] Safeena & Date (2013). Combination of TAM and TPB in Internet Banking Adoption. International Journal of Computer Theory and Engineering, 146-150.
[139] Sanjeepan & Ragel (2017). A Study on Impact of Switching Cost on Customer Satisfaction for Internet Banking Services at Commercial Banks in Batticaloa. International Journal of economics and business management, 12-23.
[140] Sankar & Kumari (2016). Factors Affecting Mobile Banking Adoption Behavior in India. Journal of Internet Banking and Commerce, 1-24.
[141] Santouridis & Kyritsi (2013). Investigating the Determinants of Internet Banking Adoption in Greece. The Economies of Balkan and Eastern Europe Countries in the Changed World (EBEEC 2013), Science Direct, Elsevier. 501-510
[142] Sathye (1999). Adoption of Internet banking by Australian consumers: An Empirical Investigation. International Journal of Bank Marketing, 324-334.
[143] Serkan & Safak (2004). Adoption of Internet Banking among Sophisticated Consumer Segments in an Advanced Developing Country. International Journal of Bank Marketing, 212-232.
[144] Shahimi & Rani (2018). Conceptual Model; Continuance Intention of Mobile banking Among Malaysian Customers. Conference on Technology & Operations Management (2ndCTOM), 394-402.

Chapter 2
92
[145] Sharma & Madhumohan (2015). Predicting Determinants of Internet Banking Adoption; A two-Staged Regression-Neural Network Approach. Management Research Review, 750-766.
[146] Shin Ho & Yahya (2015). Consumers’ Perception Towards the Extent of Internet Banking Usage in Malysia. Problems and Perspectives in Management, 288-295.
[147] Shish & Lien (2015). Perceived Quality Factors of Location-based Apps on Trust, Perceived Privacy Risk, and Continuous Usage Intention. Behavior and information technology, 2-10.
[148] Simon Gyasi Nimako (2013). Customer Satisfaction With Internet Banking Service Quality In The Ghanaian Banking Industry. International Journal of Scientific & Technology Research, 165-175.
[149] Singh (2017). Adoption of Internet Banking Services in India: An Empirical Study. Global Journal ofManagement and Business research E marketing, 36-42.
[150] Soheila Ghaane (2011). Full Relationship among E- satisfaction, E-service quality E- trust and E-loyalty; The case of Iran E-banking. Journal of Theoratical and Applied Information Technology, 1-6.
[151] Susanto & Chang (2012). The Role of Trust and Security in Smartphone Banking Continuance. IEE International Conference on Systems, Man, and Cybernetics, Research Gate. 2133-2138
[152] Swanson (1982). Measuring User Attitudes in MIS Research- A Review. Omega International Journal of Mangement Science, 157-165.
[153] Syed & Qureshi (2011). Trust and Initial Acceptance of Mobile Banking in Pakistan. International Journal of Scientific & Engineering Research, 1-14.
[154] Tavishi & Kumar (2013). An Empirical Study on Technology Adoption by Indian Banks. Global Journal of Management and Business Studies, 1169-1172.
[155] Taylor & Todd (1995). Assessing IT usage: The Role of Prior Experience. MIS Quarterly, 561-570.
[156] Taylor & Todd (1995). Understanding Information System Usage: A Test of Competing Models. Information System Research, 144-176.
[157] Tejinder Pal Singh (2014). Factors Influencing E-Banking Adoption in India: An Amalgamation of TAM and TPB. International Journal of Computer Science and Technology, 91-96.

Review of Literature
93
[158] Thulani & Kosmas (2011). Adoption And Use of SMS/Mobile Banking Services in Zimbabwe: An Exploratory Study. Journal of Internet Banking and Commerce, 1-14.
[159] Tsai, H.-T & Ming-Tien (2014). The Influences of System Usability and User Satisfactionon Continued Internet Banking Services Usage Intention: Empirical Evidence from Taiwan. Electronic Commerce Research, 137-169.
[160] Venkatesh & Davis (2000). A Theoretical Extension of the Technology Acceptance Model: Four Longitudinal Field Studies. Management Science, 186-204.
[161] Venkatesh & Thong (2011). Extending the Two-stage Information Systems Continuance Model: Incorporating UTAUT Predictors and the Role of Context. Information System Journal, 527-555.
[162] Vijay (2013). Refinement and Retesting of“eBankQual” Scale in Internet Banking Service Settings. Emerging Trends in Infromation Technology and Management (pp. 1-14). Maharashtra: Munich Personal RePEc Archive.
[163] Viswanath & Morris et.al (2003). User Acceptance of Information Technology: Toward a Unified View. MIS Quarterly, 425-478.
[164] Wagner & Oliveiria et al.(2017). Apps for Mobile Banking and Customer Satisfaction: A cross-Cultural Study. International Journal of Bank Marketing, 1133-1153.
[165] Wahab & Yousuf (2017). The Role of Trust in the Relationship between Quality Factors and Customer Satisfaction in Mobile Banking: A Conceptual Framework. The Social Science, 712-718.
[166] Wang & Han Yaojun (2015). Modeling and Empirical Study of Users’ Continuance Intention Toward Location Based Service. International Business and Management, 8-15.
[167] Watson, & Goodhue (2002). WEBQUAL : A Measure of Web site Quality. American Marketing Association, 432-438.
[168] Williamson & Kirsty (2006). Understanding Consumer Adoption of Internet Banking: An Intrepretive Study in the Austrelian Banking Context. Journal of Electronic Commerce Research, 50-66.
[169] Wu & Lin et al. (2010). A Study of Bank Customer's Perceived Usefulness of Adopting Online Banking. Global Journal of Business Research, 101-108.
[170] Wu & Kuo (2008). An Investigation of Habitual Usage and Past Usage on Technology Acceptance Evaluations and Continuance Intention. The Database for Advances in Information Systems, 48-73.

Chapter 2
94
[171] Yashasvi & Mistry (2012). Level of Customer Satisfaction While Using Internet Banking: A Study of Anand City. International Journal of Marketing & Business Communication, 58-65.
[172] Yee & Chong (2013). Online Banking Adoption- An Empiricl Analysis. International Journal of Bank Marketing, 267-287.
[173] Yi-Luen & -Shyong Ong (2015). Security Risk and Trust in Individual's Internet Banking Adoption; An Integrated Model. International Journal of Electronic Commerce Studies, 343-356.
[174] Yoon, & Cheolho. (2010). Antecedents of Customer Satisfaction With Online Banking in China: The Effects of Experience. Computers in Human Behavior, Elsavier, 1296-1304.
[175] Yousafzai & Pallister (2003). A Proposed Model of E-trust for Electronic banking. Technovation, Elsevier, 847-860.
[176] Yousafzai & Foxall (2009). Multi-dimensional Role of Trust in Internet Banking Adoption. Service Industries Journal, 591-605.
[177] Yousuf & Ali (2017). Determenents of Continuance Intention to Use Mobile Money Transfer,: An Integrated Model. Journal of Internet Banking and Commerce, 1-24.
[178] Zeithaml & Parasuraman (2002). Service Quality Delivery Through Web Sites: A Critical Review of Extant Knowledge. Journal of the Academy of Marketing Science, 362-375.
[179] Zhou (2012). Examining Continuance Usage of Mobile Internet Services from the Perspective of Resistance to Change. Information Development, 22-31.
…..…..

Conceptual Formulation of the Study
95
This chapter reviews the existing fundamental theories of technology
adoption behaviour and post-adoption behaviour in information
system research and other related disciplines. It also covers the
theoretical basis for the formulation of the conceptual model and
hypothesised relationship between variables used in the study.

Chapter 3
96
3.1 Introduction
The conceptual framework for the present study is formulated after
the detailed review of the existing technology adoption and post-adoption
theories. Most of the earlier literature on adoption behaviour was based
on the technology adoption theories of information system research.
Technology adoption theories basically explain the individual adoption
intention and usage of a new technology. Whereas, the post-adoption
theories mainly explain user satisfaction and continuance intention of
users of a specific technology. These theories were originally evolved
from adoption theories. Since the current study postulates the post-
adoption behaviour of customers in using TEBSS, the technology
adoption theories as well as post-adoption theories are equally important
in explaining the user behaviour. Hence, both these theories are considered
for formulating the conceptual framework.
3.2 Theories of Technology Adoption
Individual behaviour towards the acceptance of a new technology is
assessed based on various technology adoption theories developed by
former researchers in the field of information system research.
Technology adoption is one of the important areas of research and it was
originated with the work of (Rogers, 1962) ‘Diffusion of Innovations’.
Following this theory, several modifications and new theories were
evolved and discussed in different literature. The theories in this area
considered the technological elements and the users’ psychological
attributes to predict the user behaviour. The psychological attributes
include attitude and intention towards the technology / innovation.

Conceptual Formulation of the Study
97
Although there are several theories on technology adoption, Taylor&
Todd (1995) differentiated the IT adoption theories into two broad
categories such as intention-based models and diffusion of innovation
perspectives. The first category of the theories employed behavioural
intention of the people to predict the technology adoption and usage.
Also, these theories focused on the elements of intention such as attitudes,
subjective norms, factor influences, facilitating conditions, etc. The
theories in this category include the Theory of Reasoned Action, Theory
of Planned Behaviour, Technology Acceptance Model and Triandis
Model of Choice Behaviour etc. The second approach examines the
adoption and usage of IT in diffusion of innovation perspectives.
Models from social psychology such as TRA, TPB, TAM and
Triandis are widely used in adoption studies. Among these, the first three
theories are predominantly used. Whereas, the Triandis theory is seldom
used in information system research as well as in other disciplines.
Diffusion of Innovation Theory, Theory of Reasoned Action, Theory of
Planned Behaviour, Technology Acceptance Model, TAM2 and TAM3
revised, and UTAUT etc. are fundamentally reviewed as background
theories for this study.
3.2.1 Diffusion of Innovation Theory
Diffusion of innovation theory is considered as the oldest theory of
innovation adoption and was put forward by Rogers (1962). Diffusion is
the process by which an innovation is communicated through certain
channels over the time among the members of a social system. According
to this theory, there are four elements which influence the spread of a new

Chapter 3
98
idea, which includes innovation, communication channel, time, and social
system. Apart from these, five other important factors that affect the adoption
of innovation viz. relative advantage of innovation, compatibility of
innovation, complexity of innovation, trialability of innovation, and
observability of innovation. According to this theory, innovation diffusion
and adoption happens after several steps of understanding like, persuasion,
decision, implementation and confirmation. This led to the identification of
adopters as innovators, early adopters, early majority, late majority and
laggards. Studies were widely carried out in behavioural science to explain
the adoption behaviour by adding several factors to the DOI theory Waleed
& Louis (2010); Combs et al. (2009); Hernan & Requelme (2010); Ibrahim
Al-Jabri (2012); Dzogbenuku (2013): Manoranjan (2014).
This theory is widely accepted in institutional framework but it
failed to explain the innovation adoption behaviour of individuals.
Moreover, the main concern of Diffusion of Innovation Theory was the
technical factors that affect the adoption of innovation. The other factors
like social, economic and political factors are not included in the theory,
and the theory was more deterministic in nature. As the theory ignores the
social context, it was criticised generally in the information system
research. Thereafter the theories explaining the individual’s adoption of
technology have emerged in the information system context like TRA,
TPB, TAM, UTAUT etc.
3.2.2 Theory of Reasoned Action (TRA)
Theory of Reasoned Action is another important theory predicting
the user behaviour in uncertainties. This theory was mainly applied to

Conceptual Formulation of the Study
99
study the behaviour of people in online context and widely used in
predicting the adoption intention of individuals on technology. It was put
forward by Icek &Fishbein in 1975. Much of the technology adoption
literature widely used Technology Acceptance Model (TAM) which is
actually based on TRA. According to this theory, behavioural intention is
determined by two important factors; personal factors (attitude towards
behaviour) and a person’s perception of social pressures termed as
subjective norms. It conceptualises the relationship between variables in
such a way that, subjective norms and attitude towards behaviour
positively influences the behaviour intention and intention leads to the
actual behaviour. It is one of the common theories in innovation
acceptance. Also, it explains the impact of some external factors like
behavioural belief, outcome evaluation, normative belief, motivation to
comply etc. in the formation of attitude and subjective norms. Studies
widely applied TRA in e- banking adoption context includes the studies
of AL- Majali (2011); Juwaheer & Pudaruth (2012); Nor & Shanab (2008)
and Fang (2006).
Theory of Reasoned Action ignores the situational factors which
have practically strong influence in determining the intention and
behaviour. The major limitation of this theory was that, it basically
focused on the attitude of persons and their psychological elements. Since
the individual’s attitude and beliefs depends on their personal characteristics,
the predictive power of the theory was found to be low. Moreover, the
theory is based on perception facts as well as self-reported facts, which
has been reported as a limitation by several experts in this field. Thus, in
research on technology adoption, the Theory of Reasoned Action is rarely

Chapter 3
100
used. As an extended model, Theory of Planned Behaviour is formulated to
overcome the limitation of the predictive capacity of this theory.
3.2.3 Theory of Planned Behaviour (TPB)
Theory of Planned behaviour was developed by Ajzen (1985;
1991). Perceived behavioural control concept was added to the Theory of
Reasoned Action as a predictor of behavioural intention to improve the
predictive power of the theory. As per the theory, human behaviour
follows whatever information he or she happens to have available
logically and systematically. Thus, the Theory of Reasoned Action is
successful only when the behaviour is under person’s volitional control. A
person may not actually perform the behaviour unless behaviours are
fully under his/her volitional control. Even though he/she is highly
motivated by his/her own attitudes and subjective norm, they may not
actually perform the behaviour due to intervening environmental
conditions. The Theory of Planned Behaviour (TPB) was originally
developed to predict behaviours in this context where, individuals have
incomplete volitional control. In planned behaviour theory, it is found
that, behaviour is affected by perceived behavioural control. As per the
theory, the behavioural intention is not only affected by attitude and
subjective norm, but it is also affected by perceived behavioural control
significantly.
According to (Ajzen, 1991), perceived behavioural control is a
person’s perception of the ease or difficulty of performing the behaviour
of interest. It is assumed to reflect the past experience as well as
anticipated impediments and obstacles. It is usually used in technology

Conceptual Formulation of the Study
101
adoption studies in information system research along with the Theory of
Reasoned Action. Hence the constructs used in the Theory of Planned
Behaviour are same as the constructs of the Theory of Reasoned Action,
with the added construct perceived behavioural control. Some other
related constructs are also added to the theory to predict the perceived
behavioural control. Those include behavioural belief (belief about
behaviour), normative belief (belief about what others think about
behaviour), control belief (belief about level of control over behaviour),
self-efficacy (individual’s perception that, he or she will be able to
perform a certain behaviour successfully), volitional control (actual wilful
control over behaviour) and actual control (an individual’s control over
behavioural factors such as readily available resources such as money,
time, skill, co-operation of others etc.).
Taylor & Todd (1995) modified the Theory of Planned Behaviour
with the constructs like relative advantages, compatibility, and
complexity from the Diffusion of Innovation Theory and developed a new
theory. This theory is known as Decomposed Theory of Planned
Behaviour (DTPB). DTPB has the benefit of adding the TRA core
constructs and in addition to it, it broadens the attitudinal belief,
normative belief and control belief. So, the theory has better explanatory
power than that of pure Theory of Planned Behaviour and Theory of
Reasoned Action(Shih & Fang, 2004).TPB has been applied in the studies
of different disciplines including task performance, consumer behaviour,
ethical behaviour, dishonest behaviour, investment decisions, acceptance
of different types of innovations, etc. by many researchers such as Shaoyi
(1999); Kesharwani & Bisht (2012); Bhatt (2012) and Margaret (2000).

Chapter 3
102
The limitation of Theory of Planned Behaviour is with regard to its
complexity. It is difficult to apply across diverse user contexts. Since the
constructs used in TPB are more specific, it requires a pilot study to
identify the relevant outcomes, reference groups and control variables in
every context in which it is used (Mathieson, 1991). Technology
Acceptance Model also used the same measures for intention and attitude,
but Davis (1989) had developed standard instruments for other constructs.
While the measures of TPB beliefs need to be modified for each context,
it is more complex to use than TAM. The empirical studies proved that,
both models provide good predictions of intention of individuals to use an
innovation, but TAM is slightly outperforming TPB.
3.2.4 Technology Acceptance Model
TAM is one of the first research models to explain how a person’s
perception about ease of use, usefulness and attitude towards the use of a
specific technology can influence the adoption intention and behaviour.
This model was put forward by Fred Davis in 1986. TAM attempted to
explain the reason why people accept or reject certain innovations and it
was basically tailored for modelling user’s acceptance of information
systems or technologies. The basic model of TAM included and tested
two beliefs Perceived Ease of Use and Perceived Usefulness. The earlier
theories proved the effect of innovation characteristics on user behaviour.
Hence, the perceived characteristics of the system usage (Perceived ease
of Use and Perceived Usefulness) have been taken to predict the adoption
intention in TAM. The first modified version of TAM was developed to
explain the general determinants of computer acceptance that leads to

Conceptual Formulation of the Study
103
explain the user behaviour across the broadest range of end using
computer technologies and user populations (Davis, 1989). In the first
modified version of TAM, Davis (1989) proposed that the system use
depends upon the user’s motivation which in turn is directly linked by
external stimulus including system capabilities and features. According to
him, user’s motivation is determined by three factors; Perceived Ease of
Use, Perceived Usefulness and attitude towards using. The model is
considered as one of the solid models of technology adoption. The model
was first used in information system research and both the constructs ease
of use and usefulness were proven to have strong influence on the attitude
of a person towards the system usage intention. Later the lion’s share of
technology acceptance studies was modelled on the TAM constructs and
the model is now known for being one of the most cited models in the
technology acceptance behaviour.
During the period 1986-1990, studies widely used the TAM model.
This was the period of introduction stage of TAM. During the period
1990-1995, studies mainly focused on confirming the model as the best
predictor of the behaviour of technology acceptance. A number of studies
conducted during this time period proved the model as an ideal one to
explain the behaviour. This is termed as the confirmation stage of TAM.
Thereafter, during the period of 1995-2000, the studies with TAM
focused on model extension. In this stage, researchers added new
variables to the basic TAM model for better explaining the context as
well as behaviour. After 2000, the studies using TAM ideally changed the
fundamental model to improve the prediction of the model in varying
contexts by keeping the basic constructs as ease of use and usefulness.
Chapter 3
104
Technology Acceptance Model is more parsimonious and more
robust in various information system applications, also it is specific to
information system usage for applying the concepts of ease of use and
usefulness. It connects the variables as ease of use and usefulness lead to
attitude towards using, attitude towards using predicts the behavioural
intention and the behavioural intention finally determines the actual
system usage.
The main limitation of TAM as pointed by Bagozzi (2007) was
about the intention and actual behaviour link. According to him, intention
may not represent the actual use, because of the time gap. Uncertainties
due to the changes in behaviour of a person according to the time and
situations may have influence on the attitude. As per the TAM model,
user’s behaviour is completely determined by the underlying factors of
the model and hence it is a deterministic model. But the fact is that the
intention is subjected to evaluations and reflections which may direct the
person to reformulate the intention and thereby behaviour. Hence, the
TAM model has been extended multiple times for studying the innovation
acceptance behaviour of people in different disciplines.
3.2.5 Extended Technology Adoption Models
In the first modified version of TAM Davis et al. (1989) included
the concept of behavioural intention as mediator of actual behaviour and
attitude. Venkatesh& Davis (1996), extended TAM by eliminating the
attitude construct from the main model after finding that perceived ease of
use and perceived usefulness have significant influence on behaviour
intention. TAM 2 model was later developed by Venkatesh & Davis (2000)

Conceptual Formulation of the Study
105
with additional constructs of subjective norm, experience, voluntariness,
image, job relevance, output quality, and result demonstrability. It was found
that, in mandatory use settings, subjective norm had a strong impact in
predicting the behaviour intention than that of perceived ease of use and
usefulness, but not in voluntary systems.
The final version of the TAM model was developed by Venkatesh
& Davis (2003). Several studies proved that; the usefulness better
explains the intention and behaviour than the perception of ease of use.
Venkatesh & Bala (2008) modified the TAM2 model with determinants
of usefulness and ease of use namely individual differences, system
characteristics, social influences, and facilitating conditions and later
named it as TAM3 Model. In TAM3 model, relationships between constructs
are established as perceived ease of use to perceived usefulness, computer
anxiety to perceived ease of use, perceived ease of use to behavioural
intention and which were moderated by experiences.
3.2.6 Unified Theory of Acceptance and Use of Technology (UTAUT) Model
This theory was developed and popularised by Venkatesh et al.
(2003). UTAUT model has four important constructs consisting of
performance expectancy, effort expectancy, social influence and facilitating
conditions. Five similar constructs including perceived usefulness,
extrinsic motivation, job fit, relative advantage and outcome expectation
forms the performance expectancy in this model while effort expectancy
captures the notions of ease of use and complexity. There are seven
constructs and the above four found as significant in the prediction of

Chapter 3
106
adoption behaviour. The other three constructs which are excluded are
attitude towards using, self-efficacy and anxiety. This theory is considered as
more superior than that of other theories, with a 70 percentage or more
variance explained. The theory proposed that the performance expectancy,
effort expectancy, social factors and facilitating conditions are determining
the behavioural intention and behavioural intention predicts the actual
behaviour. Apart from these constructs, the theory tested the moderating
effect of age, gender, experience and voluntariness of use.
The UTAUT 2 model is the modified form of the UTAUT base
model. According to the situations and the technology under study, the
model is replicated and modified. The main limitation of the theory is the
absence of the individual characteristics and it is criticised due to its
complexity.
The above-mentioned theories are established in the studies of
information system research. Therefore, the applicability of these theories
is situation specific. Hence, the theories are extended to incorporate the
contextual specific variables and thereby ensured the accuracy of the
theories in behaviour prediction. One important thing to be noted is that,
all these theories are similar in one or other way. Hussain (2014)
analysed the similarities of the theories and according to him, the theories
are similar in following perspectives; Firstly, the theory of TPB and TAM
are both developed from the TRA theory. Secondly, all models that
employ any of the theories assume a consequence path of actions initiated
by an attitude toward innovation, followed by intention formation, and
completed with actual behaviour. Thirdly, the consequent relationship
Conceptual Formulation of the Study
107
occurs mainly among four constructs assuming that, cognitive, normative,
or affective beliefs form attitudes, which in turn influence behavioural
intention and the actual adoption.
By the development of technology in advanced form risk factors,
security and trust factors become vital in adoption decisions. Thus, the
TAM model was modified in a number of studies by giving the focus to
variables like risk factors, Pikkarainen & Kari (2004); Drennan (2010);
Ankit& Bisht (2012); Mansour & Ben (2016) and Kumar & Balaji
(2017). Perceived security and trust Nadim & Noorjahan (2007);
Giovanis & Binioris (2012); Abdou& Thomas (2015); Alalwan &Dwidi
(2015); Lallmahamood & Muniruddeen (2007); Aklaq & Ejaz (2013);
Lee (2008); Lacramiora & Cosmin (2013); Bashir &Madhavaiah (2015)
and Jean-Pierre &Normad (2011). Personal factors; like awareness,
computer self-efficacy, perceived credibility Wang & Yu-min (2003);
Fawzy & Esawai (2017); Kumar &Madhumohan (2014) and Bijith &
Yajnik (2017) etc.
Since the TAM and its extended models are proven as the most
used framework for explaining the user behaviour in the innovation
acceptance studies. These studies focused on the effect of perceptions
of technology characteristics specifically usefulness and convenience
to adoption intention. In this point of fact, the constructs ‘Ease of Use’
and ‘Usefulness’ have been adopted for the purpose of the present
study.

Chapter 3
108
3.3 Theories of Post-Adoption Behaviour
In prior studies of information system research, behavioural
intention, actual use and user satisfaction were the major dependent
variables (Choudhury & Karahanna, 2008). In the first stage of research,
behavioural intention was most important. The focus changed once the
prospective user started to use the particular system. Extensive usage and
satisfaction became more important thereafter. Comparatively limited
studies have taken place in post-adoption behaviour of technology
acceptance. In information system research, it is impossible to predict the
user behaviour in the post-acceptance stage with the adoption theories.
Thus, for explaining the continuance use intention of a system/ innovation,
the theories of post-adoption behaviour were applied in research.
These theories assume the behaviour as a cognitive procedure, as
people examine the technology during the usage stage. Analysis of post-
adoption behaviour become vital in order to address the changes in the
perceptions of people on technology usage and to understanding about the
continued use and their future intentions like re- purchase or use
intentions. Expectation and Confirmation Theory, IS success Model,
Theory of IS success continuance and MIAC are the main theories in
predicting the post-adoption behaviour. The important theories of post-
adoption behaviour are summarised below.
3.3.1 Expectation and Confirmation Theory
Expectation and Confirmation Theory was originally developed by
Oliver (1980). The theory assumed that, the consumer’s post purchase
satisfaction is jointly determined by the pre-purchase expectation,

Conceptual Formulation of the Study
109
perceived performance of technology and confirmation of expectation.
Expectation and Confirmation Theory is one of the oldest theories in post-
adoption behaviour studies. The theory focused on both pre-adoption and
post-adoption variables. The predictive ability of this theory has been
demonstrated over a wide range of product repurchase and service
continuance contexts (Bhattacherjee, 2001). According to this theory,
customers form an initial expectation of a specific product or service prior
to purchase and then, they accept and use that product or service. After
the period of initial consumption, they form perceptions about the
performance. Finally, they assess its perceived performance with their
original expectation and determine the extent to which their expectations
are confirmed. Based on the confirmation, satisfaction/ affection is
formed according to their confirmation level and satisfied customers form
a repurchase intention while dissatisfied customers discontinue its
subsequent use (Oliver, 2008).
Expectation and confirmation theory states that the confirmation as
an additional determinant of satisfaction. Since the basis of satisfaction is
their expectation, it may vary from the pre- use to post- use. The changes
in the expectation may route from the difference of experiences of the
customers after the first-time use. The pre-acceptance expectation may be
influenced by the information and opinions, whereas the post- acceptance
expectation is formed after the experience and hence it is practical. Main
constructs used in ECT include expectation, perceived performance,
confirmation, satisfaction and repurchase intention. This is the basic
theory of consumer satisfaction. According to this theory, satisfaction is
Chapter 3
110
the antecedent of the repurchase intention. The pre-purchase expectation
and post-purchase performance determines the satisfaction. The
relationships are modelled in the way that, pre-purchase expectation and
confirmation of expectation determines the customer satisfaction which
later leads to repurchase intention.
3.3.2 Information System (IS) Success Model
IS success Model is considered as one of the outstanding models
among the post-adoption behavioural models. This model was proposed
by (Delone & McLean, 1992). IS success model explained the satisfaction
as the main criteria for success. According to them, system quality and
information quality determine the satisfaction. Post-use trust was added to
IS success model and it was proved that; information quality and system
quality decide the post-use trust. IS success model was tested in different
areas with modifications. This model was widely used to predict the
success in social networking site usage, mobile service usage, etc. User
satisfaction and continuance intention were added to IS success model by
(Lingling & Xuesong, 2014) as a success factor of innovation. According
to this extended model, customer satisfaction and customer trust after the
initial use become the criterion for assessing success. Gradually the
concept of continuance intention was also termed as the key indicator of
the success.
3.3.3 Information System Continuance Model
Based on the Expectation Confirmation Theory, (Bhattacherjee,
2001) developed a model for information system usage continuance. The
expectation construct is replaced by perceived usefulness and the model is

Conceptual Formulation of the Study
111
considered as information system continuance intention model. ECM
treats IT users’ continuance decisions as consumer’s repurchase decisions in
marketing. According to Battacherjee (2001), satisfaction, confirmation, and
perceived usefulness determine users’ intention to continue to use an
information system. Thus, the ECM differentiates from ECT toward three
directions; first, ECM claims that pre-acceptance variables are included in
the confirmation and satisfaction constructs. Second, perceived usefulness
is measured by post-acceptance expectations (perceived usefulness was
the only construct consistently influencing user intention in both adoption
and post-adoption phases). Third, ECM includes perceived performance
into confirmation construct (Vasileios & Moridis, 2013). Expectation
Confirmation Model has been applied to a number of studies including
psychology, organisational behaviour, information system research, work
environment etc. The choice of the constructs namely, experience,
expectation and outcome vary according to the context. The major constructs
used in the model include perceived usefulness, confirmation, satisfaction,
and continuance intention. Satisfaction is measured by analysing the gap
between the expectation and confirmation after experiencing the products or
services. It is defined as the pleasurable level of experience over their
expectation after the consumption of a product or service.
Apart from repurchase intention, the service and technology
continuance was also measured using this theory. The model is extended
with the added variables like Perceived playfulness (Lin & Wu, 2005),
Perceived enjoyment (Xu, 2007), information system commitment (Wang
& Carol, 2008), technology readiness (Shish, 2013), habit (Lai & Chen,
2016), ease of use and usefulness (Brown & Venkadesh, 2008) etc.

Chapter 3
112
3.3.4 MIAC (Model of Intention Adoption and Continuance)
Model of Intention Adoption and Continuance (MIAC) was
developed by (Cheung & Zhu, 2003). It connects the three constructs of
information system literatures namely, intention, adoption and the
continuance intention together. This model was first proposed in the
online context by integrating the Expectation Confirmation Model and the
attitudinal model. The attitudinal model discussed the factors affecting the
adoption behavior whereas the ECM model explained the post-adoption
intention and behavior. By integrating these two models into a common
framework, MIAC model was first tested in online consumer behavior
and as a result the different factors that influences the online consumer
behavior was identified.
According to this model, different types of factors influence the
customer online behavior. Those factors include; individual/consumer
characteristics, product/service characteristics, environmental influences,
medium characteristics, and online merchant and intermediary
characteristics. Among these factors, characteristics of consumers like
demographics, personality, value, lifestyle, consumer resources, and
knowledge have not been explored. Similarly, the factors related to the
medium characteristics (network availability, reliability, stability, speed,
externalities, information quality, shopping aids medium richness and
convenience), and environmental influences (culture and reference
groups) have not been fully investigated in prior studies of online
consumer behaviour (Cheung, 2003). The comprehensive model was also
not empirically tested in the study. But the framework of intention

Conceptual Formulation of the Study
113
adoption and continuance were widely accepted and tested by adding
relevant constructs in later studies.
Several studies have then been carried out based on the MIAC
model and the extended models of MIAC framework. In online consumer
continuance intention behaviour (Cheung et al., 2003) proposed an
integrated model based on this base model. That integrated model included
consumer characteristics like lifestyle, motivation, innovativeness,
involvement, demographics, flow, satisfaction, experience, trust, attitude,
and values; product/service characteristics include; product knowledge,
type, layout, frequency of purchase, tangibility, differentiation, and price,
merchant/ intermediary characteristics like service quality, privacy and
security, control, brand reputation, and after sale service; medium
characteristics consists of web design, navigation, ease of use, usefulness,
interface, reliability, security etc. and environmental characteristics like
culture, subjective norms, exposure, attention, image etc. All these factors
are assumed to have influence on intention, adoption and continuance
intention but the model was not empirically tested during that time.
3.3.5 Integration of Pre-Adoption Models and Post-Adoption Models for Continuance Intention
Since the studies in the continuance intention of information system
research has been evolved a decade ago only, a unified framework for the
behaviour prediction is still absent. Based on the base model of MIAC
and the model of expectation and confirmation, several modified models
with relevant variables has been used to explain the continuance intention
behaviour. The TAM model is extended for predicting the continuance

Chapter 3
114
intention behaviour in the studies of Hamid & Abdullah (2016); Mei-
Chun Wu (2008) and Stacie Peter (2008). Some other studies extended
the TAM to predict the user’s continuance intention in the same way by
adding different factors like, structural assurance, subjective norm,
convenience and firm reputation, trust, perceived enjoyment Chao Wen
(2011) and Mohtar (2011); interpersonal behaviour and habit (Huang,
2017), with ECT (Mohamed & Hussein, 2014), continued trust and
satisfaction (Sikdar & Kumar, 2014).
Expectation and Confirmation Model was also modified widely for
predicting continuance intention. Expectation and Confirmation Model
was integrated with Technology Acceptance Model constructs (ease of
use and usefulness) in a study by Piriyakul et al. (2015) has proved that,
trust and satisfaction are the antecedents to continuance intention in
internet-based transactions. ECM again integrated with important
constructs like, perceived quality (Hsiang-Ming Lee, 2014); (Hartmut &
Huff, 2012), trust, self-efficacy and perceived security (Susanto & Chang,
2016), TAM, TTF, and perceived risk (Shunbo Yuan, 2016) for analysing
the continuance intention in innovation adoption studies.
All these studies have accepted the limitation of the absence of an
integrated model explaining the pre-adoption and post-adoption behaviour
in technology adoption context. Since the online technologies being the
part of the daily life of the individuals, it is essential to have an integrated
framework to explain the continuance intention. Consideration should be
given for maintaining the long-term sustainable relationship rather than
creating adoption intention. Still most of the research on technology

Conceptual Formulation of the Study
115
continuance is done in the absence of the integrated framework. Model of
Intention Adoption and Continuance is the best available model to predict
the basic sequence of behaviour from the adoption stage to the stage of
continuance. Hence for the current study TAM has been extended by
adding the construct accessibility, and user awareness for predicting the
customer satisfaction and post-use trust of ECM model to ultimately
explain the continuance intention. The flow of linkage between variables
was portrayed as depicted in base model of MIAC.
3.4 Conceptual Model and Relationship between Variables
In the present study, for analysing the continuance intention of
customers on technology enabled banking self-services, certain
perceptions of customers on adoptability of TEBSS are taken as
independent variables. As stated earlier, conceptual model was based on
the base model of MIAC (Model of Intention Adoption and Continuance)
and the modified version of Expectation and Confirmation Model with
trust. In addition to these, the context specific variables are also identified
from the detailed review of literature and added in the proposed model
for better prediction of the continuance intention of customers to use
theTEBSS.
3.4.1 Awareness of Technology Enabled Banking Self-Services (TEBSS) and Customer Satisfaction.
The decision-making process of innovation adoption starts from the
awareness about the innovation. Awareness is a process of gathering
information. The consumers go through a series of steps such as
knowledge, conviction, decision, and confirmation before they are ready

Chapter 3
116
to adopt a new product or service. This process is simply termed as
awareness. In the prior studies on adoption intention, the role of
awareness was tested and it was found that awareness had a positive
impact on predicting adoption intention. In the post-adoption stage of
technology, awareness has its influence in predicting user satisfaction as
well as trust. Awareness is the knowledge about the product/service and it
was found as the main predictor of user satisfaction. When the customers
are completely aware about the products and services, or the benefits and
risk of using the services, the level of their satisfaction will be high
(Sathye, 1999).
According to Rogers (1991) the adoption or rejection decision
begins when the customers become aware of the innovation. In the case of
electronic banking, customer’s awareness about all aspects of the services
and products will have significant positive influence on adoption intention
as well as satisfaction (Chaturvedi, 2010). Sankar & Kumari(2016)
confirmed the positive relationship of the variable awareness along with
many other factors like ease of use, usefulness, compatibility, social
influence, security and privacy risk, self -efficacy, financial cost etc. on
the usage of technology. Awareness originally measures the extent to
which a target population is conscious about the innovation and
formulates a general perception of what it entails. At the stage of
awareness, a person is exposed to the existence of the innovations and is
provided with information on how it functions and what its benefits are
(Dinev, 2007). Hence, it can be stated that technology adoption literature
has adequate support for the significant positive relationship between user
awareness and their satisfaction. The amount of information available to

Conceptual Formulation of the Study
117
customers regarding the advantages and disadvantages, scope and
limitations of the innovation or new technology will improve their
satisfaction. Use of new banking services may be an unfamiliar
experience for many customers, thus the low awareness about the
different aspects may result in dissatisfaction of the performance (Safeena
& Date, 2012). Being aware about the technology can motivate the
customers to utilise the technology and it causes the users to look forward
to the different aspects of technology. This will improve customer
satisfaction (Taherdoost & Shamsul, 2012).
The empirical evidences stated above support the positive
association between user awareness and satisfaction in technology
adoption context. In the banking context, only very few studies were
reported that analysed the influence of user awareness on customer
satisfaction. According to Noreen (2015) satisfaction with electronic
banking is the determinant of how much the customer knows about
electronic banking and how much they are applying their knowledge for
performing banking transactions. But not many studies were reported in
e-banking context which analysed the influence of user awareness on their
satisfaction.
3.4.2 Awareness of Technology Enabled Banking Self-Services (TEBSS) and Customers’ Post-use Trust According to Gefen (2000) trust can be described as the belief that
the other party will behave in a socially responsible manner and by so
doing the trusting party will fulfill the expectations without taking
advantage of its vulnerabilities. It is considered as the central aspect of

Chapter 3
118
every economic activity. Online banking transaction contains very
sensitive information about customers (Gefen, 2000; Morgan & Hunt,
1994) and they fear providing such confidential financial details over a
network where the direct contact with service provider is absent.
Moreover, lack of understanding/ awareness creates unfamiliarity with the
tasks in online environment and it will negatively affect the trusting belief
(Luhman, 1979). The extent of understanding about the value-added
technology usage after the adoption will enhance the trust and confidence
in technology (Jasperson, 2005). Trust in specific technology refers to the
willingness to depend on the technology in each situation in which
negative consequences are possible (McKnight & Carter, 2009). Trust in
technology relates to a technology’s specific attributes such as its
functionality, helpfulness and reliability (Micknight & Carter, 2011).
Other than the initial trust, knowledge-based trust is more important
in post- adoption studies. It is developed at the stage of post-adoption by
experiencing the new technology/ innovations. Apart from assessing the
cost and benefit in using the technology in the initial stage of adoption,
post-use trust is developed through the belief regarding specific attributes
of the technology or from the experienced functionalities of the
technology. Many researchers identified that, awareness has significant
positive influence in the technology acceptance decision as well as it has
impact on trust after adoption for extensive usage behaviour (Straub,
1991); (Krishna & Ramana, 2016); (Cherubin & Maria, 2017); (Rao,
2015). Hence, earlier researchers confirmed that the post-adoptive trusting
behaviour is based on how the individual understand specific technology’s
attributes (Tams & Bennet, 2018).

Conceptual Formulation of the Study
119
Many studies supported the positive associations of awareness on
post- use trust in technology usage context, but not many studies were
found in the e-banking context that analysed the role of awareness on the
post-use trust of customers.
3.4.3 Influence of Accessibility of TEBSS on Customer Satisfaction
The importance of accessibility was confirmed in the technology
adoption literature over the period by many researchers Haroun & Khater
(2014); Sathye (1999); Jason (1999); Luiz (2000); Lichtenstein &
Williamson (2006). Accessibility is a multi-dimensional construct
encompassing both physical, terminal access and system usage ability
(Karahanna & Straub, 1999). Accessibility of information is understood
as ease of access to technology applications as well as accessibility to the
transactions that can be carried out in them (Cabanillas & Leiva, 2013). In
a study of electronic banking usage by Daniel (1999), it was found that
lack of accessibility of the system was the main reason of non-adoption of
e- banking. In the same context (Poon, 2008) found that accessibility has
highest influence in the adoption decision.
Furthermore, in the post-adoption phase satisfaction is high when
the product and services are easily accessible (El-Qirem, 2013). Many
researchers have confirmed the significant effect of convenience on user
satisfaction and continuance intention in post-adoption studies conducted
in e-commerce sector, Lele & Maheshkar (2017); Murali & Mallikarjuna
(2014); Ganapathi (2015); Selvakumar (2014); Kinker& Shukla (2016);
Raghunath & Sahay (2015); Jadhav & Khanna (2016); Shalini &
HemaMalini (2015); Lin et al. (2011); Guo et al. (2012). In service

Chapter 3
120
satisfaction literature, accessibility of service was found to have a positive
influence on satisfaction (AbdulKadir & Jamaludin, 2012); (Barona &
Blaschke, 2016). In e-banking research, it is evidenced that accessibility
has a decisive power on satisfaction by improving the usage intention
(Poon, 2008); (Casalo´ et al., 2008); (Sadeghi & Hanzaee, 2010); (Ahmad
& Al-Zu’bi, 2011). Studies quoted above shows that, there exists positive
relationship between accessibility of technology and user satisfaction. But
in electronic banking context, over emphasise was given in testing the
influence of accessibility on user adoption intention.
The post-adoption studies in e-banking have not considered the
influence of accessibility of TEBSS on customer satisfaction. Since
accessibility is one of the unique characteristics of TEBSS, it is necessary
to analyse the influence of the same on user satisfaction.
3.4.4 Influence of Accessibility of TEBSS on Customers’ Post-use Trust It is seen from the literature on technology and trust that the
construct ‘accessibility’ has been interchangeably used as the construct
‘convenience’ or ‘technological convenience in usage’. Also, in those
cases, it was having a positive relationship with trust. In the online
banking scenario, trust is the degree of confidence customers have in
online transactions or in the online exchange channels. If the failure of
internet or connection problem happens, customer lost the trust in
the services or in the electronic channel (Reichheld & Shefter, 2000).
Roy et al. (2001) opined that the construct usability as a broader concept
of accessibility determines the trust in e-banking services. Anytime,

Conceptual Formulation of the Study
121
anywhere accessibility hence has a significant impact on customer trust
building (Ghane & Fathian, 2011). The positive relationship of accessibility
with trusting intention in technology-adoption decisions has also been
supported by earlier studies Collier & Kimes, (2013); Hosein (2009);
Muneesh & Abbo, (2013); (Shin Ho & Yahya, 2015).
In the online banking context, accessibility is termed as one of the
technologies based critical success factors for customer trust as well as
satisfaction. But very few studies looked into the analysis of the
association between accessibility of TEBSS and post-use trust of
customers.
3.4.5 Technology Acceptance Model in Post-Acceptance of Technology
For information system acceptance and use, the Technology
Acceptance Model has proved as a valid and reliable model (Mathieson
1991), (Davis 1996). According to Davis & Bagozzi (1989), TAM is
expected to explain and predict the future user behaviour based on a
sample measure taken after a very brief interaction with a system in a
pre-adoption trial. Detailed explanations of the impact of TAM in
adoption studies have been given in the earlier part of this chapter. The
Technology Acceptance Model was applied later in the post-adoption
studies of consumer behaviour research and found that, the twin
constructs of TAM; Perceived ease of use and perceived usefulness have
significant influence on post-adoption behaviour especially in customer
satisfaction and continued usage (Hong, & Tum, 2006), (Taylor & Todd,
2000).

Chapter 3
122
Empirical studies on post-adoption behaviour largely used a hybrid
model, Expectation and Confirmation Model. It has been validated with
the enhanced predictive power such that the theory incorporated different
aspects of perceptions in the original framework. It allows a comparison
of users’ pre-adoption and post-adoption perceptions and their satisfaction
with the current technology usage. However, it omits the important
characteristics of the technology such as users’ enjoyment, ease of use
and other attributes which are commonly found in technology usage. In
this background, previous studies have attempted to integrate the ECM
theory with TAM (Lee et al., 2010). Even though ECM and TAM are
designed to explain user perceptions in different aspects, there are some
similarities between the constructs of ECM and TAM (Hong &Thong,
2006). Both theories have a common construct called perceived usefulness as
the belief component. In TAM, perceived usefulness is posited to be an
antecedent to users’ intention to utilise the technology. Whereas in ECM,
the post-adoption expectation of perceived usefulness is posited as an
antecedent to satisfaction and continuance intention. Hence, it can be
concluded that, both intentions to use and intention to continue the use of
technology are equivalent constructs but measured at different points of
time (Thong et al, 2016). The hybrid model (ECM-IT & TAM) postulates
the constructs, perceived ease of use and perceived usefulness as post-
adoption perceptions and also as the antecedents of satisfaction, and
continuance intention. There have been a number of studies that examined
the influence of TAM constructs (Perceived ease of use and perceived
usefulness) in behaviour prediction in the post-acceptance of technology
(Taylor & Strutton, 2010), (Leonard, 2007). Thus, for the purpose of the

Conceptual Formulation of the Study
123
present study, the twin constructs of TAM, perceived ease of use and
perceived usefulness have been adopted for predicting the user experiences
in the post-adoption stage.
3.4.5.1 Relationship between Ease of Use of TEBSS and Customer Satisfaction
Countless studies on technology adoption have proved the impact
of the ease of use on adoption intention. In the post-adoption studies on
innovation, many studies focussed on the impact of the ideal constructs
ease of use and usefulness together on post-adoption behaviour. In the
post-adoption studies of technology, ease of use was largely regarded as a
factor that influences users’ satisfaction (McHaney & Cronan, 1998).
Concretely, Abdinnour-Helm et al. (2005) found that ease of use has a
direct and positive effect on satisfaction. Liao & Cheung (2008); Yoon
(2010) and Lee, & Wang (2012) proposed and empirically tested ease of
use as a measurement of consumer satisfaction in the online service
context.
The fact is that, even if the system is perceived to be useful, it will
be continuously used only when it becomes easy to use. Ease of use
basically measures the users’ perception on the easiness in usage, more
sophisticated technology increases the convenience in conducting banking
transactions and it enhances the customer satisfaction, thus they are
expected to continue using online banking (Kaur & Kiran2, 2014). Thus,
customer satisfaction in e-banking solely depends upon the characteristics
and features offered by the technology. In which, ease of use is more
relevant (Dondolo & Madinga, 2016). Some other researchers, Jham

Chapter 3
124
(2016) and George& Kumar (2013) have analysed the influence of ease of
use on customer satisfaction in internet banking context and they
confirmed the positive association of ease of use in determining customer
satisfaction.
3.4.5.2 Relationship between Ease of Use of TEBSS and Post-use Trust
Many of the internet-based literature on electronic commerce
(WWW, internet banking, mobile apps) suggested that, post-use trust is
one of the important factors which can be considered as the key predictor
in measuring the successful acceptance and use. Studies have shown that
trust is positively determined by perceived ease of use. If the transaction
is easier to perform then the customer will feel that they understand more
and there is less need to control the situation (Munoz-Leiva, 2008).
Moreover, the applications that are easy to use are less threatening (Moon
& Kim, 2001) and are perceived to be more useful to the customers.
Fogg et al. (2002) found that perceived ease of use is one of the factors
that most increases perceived credibility, thus making a product/ service
reliable.
In another study Featherman & Pavlou (2003), verified that; the
ease of use reduced perceived risk and thereby the customer trust in
electronic services became high. Another study, substantiated that a user-
friendly technology is perceived by the user as more reliable and hence
the trusting intention will be high (Lie bana-Cabanillas & Mun oz-Leiva,
2013); (Richard 2013), (Daud & Farida, 2018). Behavioural studies in
social science as well as information system research, have therefore
demonstrated the direct positive effect of ease of use on customer post-

Conceptual Formulation of the Study
125
use trust. But the post-adoption studies in e-banking context have rarely
analysed the influence of ease of use on post-use trust in banking
technologies.
Even though the empirical evidences in the technology adoption
literature strongly support the direct positive effect of ease of use on post-
use trust, it is not much explored in e-banking discipline. Hence it is
important to analyse the influence of ease of use of TEBSS on post-use
trust of customers in using TEBSS
3.4.5.3 Relationship between Usefulness of TEBSS and Customer Satisfaction
Usefulness is one of the main constructs used in TAM by Davis
(1989) to explain the adoption intention in information system research.
In the literature on post-adoption of technology, the researchers identified
the significant influence of usefulness in predicting user behaviour.
Perceived usefulness shows the consistent results in explaining behaviour
during both the phases of initial adoption and continuance Bhattacherjee
(2001); Davis & Bagozzi (1989); Karahanna & Straub (1999); Yue-Yang,
Hsu (2010). A large number of studies have been found that explored the
role of usefulness on post-adoption behaviour. Venkatesh and Morris
(2000) found perceived usefulness as an important factor that influences
satisfaction towards the use of information technologies. Multiple studies
have suggested that, perceived usefulness has a decisive influence on
satisfaction Zhou and Lu (2011); Saleem and Rashid (2011); Lee, &
Wang (2012); Wu (2013); Al Hawani & Mouket (2010). They have
analysed the TAM factors on user satisfaction and retention. The effect of

Chapter 3
126
TAM factors on customer satisfaction in internet banking context was
tested and found that, perceived usefulness and ease of use has significant
positive effect on customer satisfaction (George& Kumar 2013), (Sharma
& Shatya, 2014).
The research studies on information system, as well as on other
technology adoption context revealed that, there exists significant
influence of usefulness of technology on user satisfaction. Handful of
literature evidenced it as positive, but only limited studies in banking
have attempted to test the influence of usefulness on customer satisfaction
in TEBSS.
3.4.5.4 Relationship between Usefulness of TEBSS and Post-use Trust
According to Davis (1989), perceived usefulness means the extent
to which a person believes that the use of a system will improve his or her
work performance. It is measured through the perception of an individual
that he can win when using technology. The degree of performance
improvement is assessed through the expected benefits like; improved
speed in performing tasks, increase in work performance, increase in
productivity, increase in efficiency etc. (Khayati, 2013). Once the user
experiences the technology after the initial adoption, the user confirms the
perceptions of usefulness or disconfirms the expectations. The positive
experiences about the usefulness forms the trusting belief to the customer.
Gefen et al. (2003) revealed the effect of dual constructs perceived ease of
use and perceived usefulness on customer trust by developing an
integrated framework of trust and TAM. The positive association of
perceived usefulness with trust is seen in online service continuance

Conceptual Formulation of the Study
127
studies (Errikson & Kerem, 2005). In the earlier period of research, it is
evidenced that the perception of customers about the usefulness of
technology can create trust in technology. The cost-benefit analysis of
new technology in terms of performance of tasks directed the users to
trust the technology. Later it is recognised that usefulness can be in many
forms rather than the cost-benefit analysis. The positive association of
ease of use and usefulness to trust are also evidenced in the e-commerce
context by Dennis (2006); Sharma & Shatya (2014) and Celik & Yilmaz
(2011).
It is well discussed in the previous literature that the usefulness of
technology really matters for long term trust. Many studies have also
substantiated the positive effect of usefulness on post-use trust in
technology adoption behaviour (Bhatcherjee, 2002); (Loong, 2013).
However, not many studies were found in the post-adoption stage of
e-banking as analysing the influence of usefulness on post-use trust.
Customers’ actual usage experiences will modify their perceptions of
usage and influences the confirmation of their initial expectation hence
impacting the trusting belief in any new technology for long term period
(Jian, & Cohen, 2017). So, the analysis of the impact of customers’
perception about usefulness of TEBSS on post-use trust of customers is
understood as essential in the post-adoption stage of TEBSS.
3.4.6 Impact of Customer Satisfaction on Continuance Intention
Satisfaction is termed as one of the important antecedents of
repurchase intention in marketing literature. In consumer behaviour
studies of information system research, satisfaction is considered as one

Chapter 3
128
of the important predictors of continuance intention with technology
usage. Plenty of studies have already been done in the academic literature
on satisfaction and continuance intention which supported the positive
correlation of these two variables. According to the Expectation
Confirmation Model, user satisfaction is determined by expectations and
confirmation of that expectation. After this model, Bhattecherjee (2000)
proposed a model based on the Expectation and Confirmation Theory,
which is already discussed in detail in the previous part of this chapter.
This model has been tested with user satisfaction as the main antecedent
of the continuance intention. Subsequent studies also confirmed the
positive association of satisfaction with continuance intention (Limayem
et al., 2007).
When users feel satisfied with new technology in its different
aspects, they will continue using the same in the future. Several studies
carried out afterwards to predict the satisfaction and continuance intention
on innovation adoption based on this theory Chen & Mei-fang (2009);
Hadji & Degoulet, (2016); Bhatacherjee & Lin (2015); Guinea & Markus
(2009); Woong, Xu (2004); Yuan, Liu, & Yao (2014); Almahamid & Abu
(2011). In the online service usage continuance context, studies have
provided evidence for the direct positive relationship between satisfaction
and continuance intention relationship (La & Cui, 2014). Hence in the
light of literature evidences, it is more relevant in the case of TEBSS to
analyse the influence of customer satisfaction on continuance intention in
using TEBSS.

Conceptual Formulation of the Study
129
3.4.7 Influence of Post-use Trust on Continuance Intention
The importance of trust in technology is evidenced as one of the
foremost factors that should be focused on. The role of trust in deciding
the behavioural intention has been discussed in the literature. It is
essential in the mobile and electronic service delivery context. Direct
personal contact is absent in the service delivery and financial dealings of
the customer when it is carried online. The role of trust is hence vital in
the electronic banking context, where the personal information and the
confidential details of the customer are exchanged through an online
platform. The pre-adoption trust is largely studied by earlier researchers
in the technology adoption literature; whereas post-use trust studies are
limited.
Post-use trust is mandatory in long term sustained relationship with
technology (Jason et al., 2009). The post-use trust has been found to have
significant positive association with the continuance intention in the
studies of Syed et al. (2011); Ghaane (2011); Dimitriadis & Nickolaos,
(2011); Susanto et al. (2012); Hossain & Md Yahin (2015). Once the user
started using technology, trusting belief is formed based on the experiential
knowledge of the technology, and the same is more important in the long-
term usage of a technology/innovation. Trusting belief includes three
concepts; helpfulness, functionality, and reliability of the new technology.
Trusting belief is stronger construct than perceived trust as it exists at the
deeper level, the user will experiment more with different features or use
more features of the technology with an intention to continue the usage in
future (Mcknight & Carter 2016). Apart from this, in the marketing

Chapter 3
130
research, post-purchase trust is found to have a significant positive
relationship with loyalty and long-term relationship with customers.
Continuance intention can be treated as a close construct of loyalty.
The positive impact of post-use trust on the users’ continuance
intention has been proved in post-adoption studies of technology. Still,
the studies in e-banking are lacking the analysis of the influence of post-
use trust on continuance intention of customers in using TEBSS.
3.4.8 Customers’ Perceptions on Adoptability of TEBSS and Continuance Intention
Studies have demonstrated that, users may be initially attracted
towards a new technology based on their expectations about the features
of technology. After their initial adoption, users continue their usage only
if there is satisfactory match between users’ expectations and the specific
task requirements of the technology. The key factors in the adoption
process of the technology are discussed widely in innovation adoption
studies earlier. Those factors include users’ perception on technology
characteristics/ innovation attributes and individuals’ attitude towards the
technology. Influences of some common factors are also well evidenced
in the earlier studies of technology adoption in banking sector. But the
question this study seeks to answer is, whether these factors are having
significant influence in the post-adoption stage of TEBSS especially in
determining the continuance intention of customers in using the same.
Identification of some important factors in the adoption of TEBSS and
their impact on continuance intention in using the TEBSS remains as an
unanswered question in the previous research.

Conceptual Formulation of the Study
131
While analysing the technology adoption intention, one of the most
influencing factors identified in the earlier studies is user awareness about
technology/innovation. The studies quoted in the previous part of this
chapter also evidenced that, customer awareness had significant impact in
the post-adoption stage of technology. It has significant influence on
customer satisfaction and post-use trust in using the technology. Since the
TEBSS is highly information sensitive and more financial dealings are
involved in the process of carrying out transactions through TEBSS, the
influence of customer awareness about different aspects of technology is
more relevant than any other factors. Users’ consciousness and interest in
knowing about technology issues and strategies to deal with them are
more essential for the sustained use of technology in their day to day life
(Dinev & Hu 2007). Impact of awareness is over emphasised in the
previous studies on adoption intention of TEBSS. But those studies have
hardly given preference in testing the influence of customer awareness
on continuance intention in using TEBSS. Since the technology is
continuously getting updated, the user should be aware of the technological
changes and extended uses of the technology in order to cope up with
these changes. Hence for the long-term use of any technology, it is more
essential to have the user awareness about the timely changes of the
technology. No studies were found, that explores the effect of user
awareness on continuance intention in TEBSS.
Hence, in this study, it is proposed to test the influence of
customers’ awareness about TEBSS and their continuance intention in
using TEBSS.

Chapter 3
132
The unique characteristics of TEBSS were identified from the
earlier studies of adoption which includes: accessibility, convenience,
relative advantage, compatibility, complexity, trialability etc. Some of
these factors also proved its significance in the post-adoption phase of
technology. Among these, most common characteristics largely studied in
post-adoption stage of technology is accessibility of technology/innovation.
Impact of accessibility of technology on customer satisfaction and post-
use trust are previously analysed by many researchers in the information
system literature, which are explained in the earlier part of this chapter.
Accessibility is defined in terms of time, place and use dimensions in
the previous studies of technology adoption. Easy access of the TEBSS
is identified as one of the major factors that led to the adoption
intention. The findings of Rice and Shook (1998) revealed that; access
to equipment, access to information, system reliability, ease in learning
the language of use are significantly influencing the long-term sustained
use of any technology. From this finding, it can be inferred that the
accessibility should have significant influence on the continuance
intention in using TEBSS. But the studies quoted earlier did not test the
relationship between accessibility and continuance intention.
Hence, for the present study it is proposed to test the influence of
customers’ perception on accessibility of TEBSS on their continuance
intention in using TEBSS.
In the studies done earlier it is evidenced that, perception of ease of
use and usefulness have significant impact in the adoption decision as
well as in the post-adoption phase of technology/ innovation. Detail

Conceptual Formulation of the Study
133
explanation is already given in the previous part of this chapter. In those
studies, the role of ease of use and usefulness on customers’ satisfaction
as well as post-use trust are evidenced as positive. In information system
research, only after 2000, the TAM constructs are tested in the post-
adoption stage largely. According to Dondolo & Madinga (2016) “even if
the system is perceived to be useful, it will be continuously used only
when it becomes easy to use”. Hence there is a hint in the literature that,
ease of use has significant influence in the continuance intention of users
in technology usage context. Similarly, some of the studies in technology
adoption context had mentioned about the influence of usefulness on
continuance intention. Khyati (2013) found that once the user experiences
the technology with improved usefulness, they confirm it for making
decisions for long-term use. Since no major studies in banking context
have tested the influence of these factors on continuance intention of
users in using TEBSS, the influence of the twin constructs of TAM, ease
of use and usefulness on customer’s continuance intention in using
TEBSS is proposed as follows.
Customers’ perception on ease of use of TEBSS has significant
influence on continuance intention in using the TEBSS.
Customers’ perception on usefulness of TEBSS has significant
influence on continuance intention in using the TEBSS.
3.4.9 Mediating Role of Satisfaction and Post-use Trust on Continuance Intention
Satisfaction and trust are interrelated constructs in behavioural
studies. Multiple relationships are tested in the previous studies between

Chapter 3
134
satisfaction and trust particularly in online service delivery context.
According to Kotler (1997), customer satisfaction is the difference
between the level of perceived performance and customers’ expectations.
Generally, customer satisfaction has been treated as an outcome
behaviour in post-adoption studies. But a group of studies already
established the intervening effect of satisfaction in continuance intention-
behaviour as well as in customer loyalty. As mentioned earlier in this
chapter the post-adoption studies are basically modelled on the ECM and
the intervening effect of customer satisfaction was supported in all these
studies of Chen, & Fang (2009); Kumar & Ravindran (2012); Al symadayi
& Yusuf (2012); Ting & Tien (2014); Chih-Chen & Chen (2009); Luqman,
& Ismail (2014): Susanto & Chang, (2016); Hossain & Jahan (2018);
Ranjan & Malik (2018) and Trong & Minh (2019).
Certain studies in marketing research, as well as researches in other
streams well depicted the mediating role of trust in customer relationships.
Customer who trusts the online bank are likely to continue using the
services offered through it (Vatanasombuta & Igbari 2008), (Al-Sharafi,
& Herzallah, 2017), (Daud& Farida, 2018). As stated earlier, there are
differences of opinion among researchers on the relationship between
trust and satisfaction in the post-adoption phase. One group of researchers
stated that trust is an antecedent of customer satisfaction whereas another
group hypothesised a positive direction from satisfaction to trust. In the
post-adoption studies on technology, researchers have analysed the
impact of these two constructs in both the perspectives. Relationship of
trust on satisfaction has been tested and proved in many of the studies in
the online services, online technology usage context, social media usage

Conceptual Formulation of the Study
135
studies etc. (Woong, & Koh, 2004), (Wahab & Yousuf, 2017), (Gefen &
Straub, 2000). Satisfaction and trust together considered as mediators in the
study (Baig & Saud, 2015). In the background of electronic commerce, (Kim
2012) integrated a framework of Expectation and Confirmation Theory
and post-adoption model of Information System continuance. Similarly
(Cao & Gong, 2016) tested satisfaction and online trust in the continuance
intention of customers on mobile payment also proved the indirect effect
of satisfaction and trust in users’ continuance decisions.
Marketing researches have extensively checked the mediating effect
of satisfaction and trust on loyalty. In online marketing and e-satisfaction
studies, customer retention, repurchase intention, and loyalty are assessed
broadly based upon analysing the effect of satisfaction and trust Valvi&
West (2013); Kundu & Kumar (2014); Mohammed, Al-Ghazali (2015);
Ofori & Boateng, (2017). In e-finance continuance intention decision
moderating role of post-use trust was also tested and confirmed the
relationship between satisfaction and continuance intention (Zhou & Li,
2017), (Sheik & Ali, 2017). Recently, in the social media usage continuance
intention study (Praveena, 2018) identified the role of trust and
satisfaction in continuance intention. In another study, mediation effect
of satisfaction post-use trust in the online brand community continuance
intention was tested and established it as a significant (Han, Wu, Wang,
& Hong, 2018).
Therefore, in this background, an attempt is made to test the
mediating roles of customer satisfaction and their post-use trust in the
relationship between customers’ perceptions on adoptability of TEBSS

Chapter 3
136
(Awareness, Accessibility, Ease of use, Usefulness) and their continuance
intention in using the TEBSS.
3.4.10 Impact of Risk Perception on the Relationship of Post-use Trust and Continuance Intention
Perception of risk has been generally studied in technology
adoption literature. It is found as one of the critical factors in technology
adoption decision when it comes to innovative technologies. The impact
of risk in adoption intention is studied by many researchers Yong-Hui Li
(2009); Gupta (2010); Zhang, 2012); Tanakinjal (2012); Thakur (2012);
Khedmatgozar (2012); Maditinos (2013); Ricardo (2016); Fadare (2016);
Quan (2017); Rahman (2017); Hung Kit Lui (2003). In the adoption
studies of technology, the perceived risk is classified into six dimensions
which are performance, financial, time, safety, social, and psychological
risk (Cunningham, 1967), (Vasileiadis, 2014). Earlier literature proved
that; all these dimensions of risk has significant influence on customer
behaviour in the online context. In the electronic banking context, the
perceived risk; especially financial, time, privacy and security risk have
significant influence in users’ behaviour.
When it comes to the post-adoption phase, risk perception of
customers depends on their prior experience with the technology.
Increased feeling of psychological discomfort and anxiety caused by
increased risk perception causes the adopters to devalue the usefulness
and downstream the continuance intention (Featherman,2003). Once the
usage of technology/ innovation occures, risk should be analysed from
different perspectives. Thus, while analysing the post-adoptive use of

Conceptual Formulation of the Study
137
individuals on technology-enabled banking self-services, assessing the
impact of risk perception is more important. Post-use perceived risk is
conceptualised as the potential for loss in the pursuit of a desired outcome
of using e-services (Featherman, 2002).
In the virtual banking context, perceived risk is highly connected
with trust. Previous studies have proven the inter-relationship of trust and
risk in online banking. The relationship is stated as negative in many of
these studies Teo (2004); Ahmed (2013), Cocosila (2009); Kyung & Sung
(2009). Moreover, the impact of perceived risk can be traced as moderating
the satisfaction, trust, and continuance intention in different disciplines in
online consumer behaviour studies (Chen & Chang, 2010). In e-service
user studies, it is claimed that, the level of risk perception and level of
trust are varying in opposite directions. If significant level of trust exists,
the perception of risk is reduced, which in turn increases the willingness
to continue the services (Joubert & Belle, 2013). The Moderating effect of
perceived risk is found in the relationship of customer trust and continuance
intention in the studies of Shunbo (2014); Santhanamery (2016); Ebru &
Yagmur, (2014); Marzieh (2016).
In light of the reviews quoted, it is felt necessary to analyse the
moderating effect of risk perception of users on the relationship between
customers’ post-use trust and continuance intention to use the TEBSS.
From the blend of combined literature related to the research
constructs, a conceptual framework is developed for the present study in
order to test empirically and to explain the continuance intention of

Chapter 3
138
customer to use the TEBSS. The conceptual model proposed for the study
is presented below.
Fig. 3.1: Conceptual Model of the Study
The study tries to integrate a model for explaining the continuance
intention of the customers’ in the context of technology enabled banking
self-services by accommodating the customer’ perception on adoptability
of TEBSS, post-use experiences and continuance intention. The model
proposes that, ease of use, usefulness, accessibility and awareness are the
Awareness
Accessibility
Ease of Use
Usefulness
Trust
Risk Perception
Continuance Intention
Satisfaction
Adoptability of TEBSS
Post-Use Experiences of TEBSS
Continuance Intention to use TEBSS

Conceptual Formulation of the Study
139
independent variables, while satisfaction and post-use trust are the mediating
variables. Similarly, continuance intention depicted as the dependent
variable and the risk perception conceptualised as the moderating variable
in the relationship of trust and continuance intention. The conceptual
model propounding the association of the underlying variables in
predicting the behaviour and the model tries to explain the hypothesised
relationships between variables.
3.5 Chapter Summary
This chapter deals with the conceptual formulation of the study.
The proposed relationships between the variables under the study is
discussed with the support of literature. The theoretical background of
the study is also discussed in detail. Model development and process of
conceptualisation of variables and establishing the relations are also made
with the support of the earlier studies. The conceptual model is shown in
Figure 3.1. In the conceptual model, perceptions of customers on the
adoptability of TEBSS (Awareness, Accessibility, Ease of Use, and
Usefulness,) are considered as independent variables, satisfaction and
trust are intervening variables in between independent variables and
continuance intention. Risk perception is portrayed as the moderating
variable in the relationship of customer post-use trust and continuance
intention.

Chapter 3
140
References
[1] Abdollahi & Saideenia (2012). Factors Affecting Client Trust in Online Banking -A case study of SAMAN. International Journal of Economics and Business Modeling, 149-151.
[2] Abdou & Adewunmim (2014). An Investigation of Risk Management Practices in Electronic Banking: The case of the UK banks. Banks and Bank systems, 1-24.
[3] Abdou Thomas & Huang (2015). A Conceptual Model for Mobile Banking Adoption. Journal of Management Information and Decision Sciences, 111-122.
[4] AbdulKadir & Jamaludin (2012). Users’ Satisfaction and Perception on Accessibility of Public Buildings in Putrajaya: Access Audit Study. Procedia - Social and Behavioral Sciences, 429-441.
[5] Abdullah & Som (2015). Internet Service Features and Satisfaction among Internet Banking Users. Journal of Management Research, 400-410.
[6] Adam Haroun Omer Khater (2014). Factors Influencing Customers’ Acceptance of Internet Banking Services in Sudan . International Journal of Science and Research (IJSR), 1429-1433.
[7] Affanuddin Ahmed (2013). Moderating Role of Perceived Risk and Innovativeness between Online Shopping Attitude and Intention . Journal of Basic and Applied Scientific Research, 310-323.
[8] Agarwal & Prasad (1998). A Conceptual and Operational Definition of Personal Innovativeness in the Domain of Information Technology. Information System Research, 204-215.
[9] Aghdaie & Faghani (2012). Mobile Banking Service Quality and Customer Satisfaction (Application of SERVQUAL Model). International Journal of Mnagement and Business Research, 351-361.
[10] Agrawal, Tripathi & Seth (2014). A Conceptual Framework on Review of E-Service Quality in Banking Industry. International Journal of Social, Behavioral, Educational, Economic, Business and Industrial Engineering, 3903-3907.
[11] Ahmad (2013). The Moderating Effect of Technology Awareness on the Relationship between UTAUT Constructs and Behavioural Intention to Use Technology:A Conceptual Paper. Australian Journal of Business and Management Research, 14-23.

Conceptual Formulation of the Study
141
[12] Ahmed & Sheik (2017). Determinents of Continuance Intention to Use Mobile Money Transfer: An Integrated Model. Journal of Internet Banking and Commerce , 1-24.
[13] Ajzen (1991). The Theory of Planned Behavior. Organisational Behavior and Human Decision Process , 179-211.
[14] Ajzen & Fishbein (1980). Understanding Attitudes and Predicting Social Behavior. Michigan: Prentice-Hall.
[15] Akhlaq & Ejaz (2013). The Effect of Motivation on Trust in the Acceptance of Internent Banking in a Low Income Country. International Journal of Bank Marketing, 115-125.
[16] Al Hawani & Mouket (2010). The Influance of TAM Factors on Student's E Satisfaction and E-Retention within the Context of UAE E-Learning. Education, Business and Society, Contemperary Middle Eastern Issue, 299-314.
[17] Ala Eddin Mohd Khalaf & Hasan (2011). E-banking Functionality and Outcomes of Customer Satisfaction: An Empirical Investigation. International Journal of Marketing Studies, 50-65.
[18] Alalwan & Dwidi (2015). Consumer Adoption of Internet banking in Jordan: Examining the Role of Hedonic Motivation, Habit, Self-efficacy and Trust. Journal of Financial Services Marketing, 145-157.
[19] Albugami & Bellaj (2014). The Continued use of Internet Banking: Combining UTAUT2 Theory and Service Quality. Journal of Global Management Research, 11-28.
[20] Al-Ghazali, Rasli, & Yusoff (2015). Antecedents of Continuous Usage Intention of Mobile Banking Services from the Perspective of DeLone and McLean Model of Information System Success. International Journal of Economics and Financial Issues, 13-21.
[21] Al-Jabri & Ibrahim (2012). Mobile banking Adoption: Application of Diffusion of Innovation Theory. Journal of Electronic Commerce Research,, 379-391.
[22] Almahamid & Abu (2011). Factors that Determine Continuance Intention to use E-Learning System:An Empirical Investigation. International Conference on Telecommunication Technology and Applications, IACSIT Press, 242-246)
[23] AL-Majali (2011). The Use of Theory Reasoned of Action to Study Information Technology in Jordan. Journal of Internet Banking and Commerce, 1-11.
Chapter 3
142
[24] Al-Rahim & Shahizan Othman (2013). Using TAM Model To Measure The Use Of Social Media For Collaborative Learning. International Journal of Engineering Trends and Technology (IJETT), 90-95.
[25] Al-Rfou & Nahar (2013). The Usage of Internet Banking - Evidence from Jordan. Asian Economic and Financial Review, 614-623.
[26] Alsamydai & Mahamood (2014). Adaptation of the Technology Acceptance Model (TAM) to The use of Mobile Banking Services. International Review of Management and Business Research, 2016-2028.
[27] Al-Sharafi, Abdullah, & Herzallah (2017). The Effect of Perceived Ease of Use and Usefulness on Customers Intention to Use Online Banking Services: The Mediating Role of Perceived Trust. International Journal of Innovative Computing , 9-14.
[28] Al-Smadi (2012). Factors Affecting Adoption of Electronic Banking: An Analysis of the Perspectives of bank customers. International Journal of Business and Social Science, 294-309.
[29] AlSoufi & Ali, (2014). Customers Perception of Mobile Banking Adoption in Kingdom of Bahrain-An Empirical Assessement of an Extended TAM Model. International Journal of Managing Information Technology, 1-13.
[30] Alwan & Abdelhalim Issa (2016). Determinants of Internet Banking Adoption among Customers of Commercial Banks: An Empirical Study in the Jordanian Banking sector. International Journal of Business and Management, 95-104.
[31] Amin (2016). Internet Banking Service Quality and its Implication on E-customer Satisfaction and E-customer Loyalty. International Journal of Bank Marketing,, 280-306.
[32] Ankit Kesharwani (2012). The Impact of Trust and Perceived Risk on Internet Banking Adoption in India: An Extension of Technology Acceptance Model. International Journal of Bank Marketing, 303-322.
[33] Asadollah & Abbas (2013). The Impact of E-Baking Service Quality Dimensions on Customer's Satisfaction and Brand Equity (Case Study: Refah Bank, Tehran). Business and Management Research, 25-37.
[34] Ataur & Mahamudul (2017). Mobile Banking Service Quality and Customer Satisfaction in Bangladesh:An Analysis. Cost Management, 25-32.
[35] Awalluddin (2011). The Role of Technology Acceptance Model in Explaining Effect on E-Commerce Application System. International Journal of Managing Information Technolog, 1-14.

Conceptual Formulation of the Study
143
[36] Bagozzi (2007). The Legacy of the Technology Acceptance Model and a Proposal for a Paradigm Shift. Jornal of the Association of Information System, 244-257.
[37] Bahmani, Yaghoubi & Ebrahim. (2010). Factors Affecting the Adoption of Online Banking An Integration of Technology Acceptance Model and Theory of Planned Behavior. International Journal of Business and Management, 159-165.
[38] Baig & Rehma (2015). Mediating Roles of Customer Satisfaction and Customer Trust in Building Brand Loyalty. An Empirical Study in Pakistan . Business Management Dynamics , 1-29.
[39] Bandura (1982). Self-Efficacy Mechanism in Human Agency. American Psychologist, 122-147.
[40] Barona & Blaschke (2016). Explaining Accessibility and Satisfaction Related to Healthcare: A Mixed-Methods Approach. Social Indicators Research, 719-739.
[41] Barry Howcraft (2013). Consumer Attitude and the Usage and Adoption of Home‐based Banking in the United Kingdom. International Journal of Bank Marketing, 111-121.
[42] Bashir & Madhavaiah (2015). Consumer Attitude and Behavioral Intention towards Internet Banking Adoption in India. Journal of Indian Business Research, 67-102.
[43] Benamati (2010). Trust and Distrust in Online Banking, Their Role in Developing Countries. Information Technology for Development, 161-175.
[44] Bhatacherjee & Lin (2015). A Unified Model of IT Continuance: Three Complementary Perspectives and Crossover Effects. Europian Journal of Information System, 364-373.
[45] Bhatt (2012). Theory of Planned Behavior A Perspective in India Internet Banking. International Journal of Management Prudence, 22-31.
[46] Bhattacherjee (2001). Understanding Information System Continuance; An Expectation Confirmation Model. MIS quarterly, 351-370.
[47] Bijith & Yajnik (2017). Enabling Internet Banking Adoption; An Empirical Examination with Augmented Technology Acceptance Model. Journal of Enterprise Information Management, 263-294.
[48] Boshoffm & Jacques (2014). The Impact of Cross-Channel Cognitive Evaluation on the Continued Intentions of Mobile Banking. Management Dynamics, 1-18.

Chapter 3
144
[49] Cabanillas & Leiva (2013). The Determinants of Satisfaction with E-banking. Industrial Management & Data Systems, 750-767.
[50] Candra, & Sevenpri (2013). Revisit Technology Acceptance Model for Internet Banking (Case Study: Public Banking in Indonesia). International Conference on Computer, Networks and Communication Engineering Atlantis Press, 734-735.
[51] Cao & Gong (2016). Understanding Mobile Payment Users’ Continuance Intention: A Trust Transfer Perspective. Internet Research, 456-476.
[52] Carolina & Popovic (2014). Understanding the Internet Banking Adoption: A Unified Theory of Acceptance and Use of Technology and Perceived Risk Application. International Journal of Information Management, 1-13.
[53] Cathy & Wu (2005). Integrating Perceived Playfulness into Expectation Confirmation Model Web Portal Context. Information and Management, 683-693.
[54] Celik & Yilmaz (2011). Extending the Technology Acceptance Model for Adoption of E- Shopping by Consumers in Turkey. Journal of Electronic Commerce Research, 152-164.
[55] Chang & Susanto (2016). Determinants of Continuance Intention to Use the Smartphone Banking Services; An Extention to Expectation Confirmation Model. Industrial Management and Data System, 508-525.
[56] Chen & Chang (2013). Exploring the Determinants of E‐Learning Systems Continuance Intention in Academic Libraries. Library Management, 40-55.
[57] Chen & Fang (2009). Determinants of Satisfaction and Continuance Intention towards Self-Service Technologies. Industrial Management and Data Systems, 1248-1263.
[58] Chen & Huei-Huang (2011). A Conceptual Model to Understand the Effects of Perceptionon the Continuance Intention in Facebook. Australian Journal of Business and Management Research, 29-34.
[59] Cherubin & Maria (2017). Awareness of and Satisfaction with Available Treatment Options in Schizophrenia: Results from a Survey of Patients and Caregivers in Europe. European Psychiatry.
[60] Cheung & Limayem (2003). Online Consumer Behavior: A Review and Agenda for Future Research. 16th Bled eCommerce Conference eTransformation, 194-218.
[61] Cheung & Huang (2017). Cognitive Factors in Predicting Continued use of Information Systems with Technology Adoption Models. Information Research, 1-47.

Conceptual Formulation of the Study
145
[62] Cheung (2002). Internet-based E-banking and Consumer Attitudes an Empirical Study. Information and management, 283-295.
[63] Chiao-Chen & Chang (2010). The Impact of Recommendation Sources on Online Purchase Intentions: The Moderating Effects of Gender and Perceived Risk. International Journal of Economics and Management Engineering, 655-658.
[64] Chichchen & Mei-fang (2009). Determinants of Satisfaction and Continuance Intention towards Self‐Service Technologies. Industrial Management & Data Systems, 1248-1263.
[65] Chih-Chen & Chen (2009). The Empirical Study of Customer Satisfaction and Continued Behavioural Intention towards Self-Service Banking: Technology Readiness as an Antecedent . International Journal of Electronic Finance.
[66] Choudhury (2008). The Relative Advantage of Electronic Channels: A Multi Dimensional View. MIS Quarterly, 179-200.
[67] ChulmoYulia & Chung (2013). A Study of Mobile and Internet Banking Service- Applying for IS Success Model. Asia Pacefic Journal of Information System, 65-86.
[68] Chung & Kwon (2009). Effect of Trust Level on Mobile Banking Satisfaction: A Multi-group Analysis of Information System Success Instruments. Behavior and Information Technology, 549-562.
[69] Cicic & Semina (2015). Changes in Beliefs, Satisfaction and Information System Continuance Intention of Experienced Users. Intenational Journal of Business and Information Systems, 509-535.
[70] Collier & Kimes (2013). Only if It is Convenient: Understanding How Convenience Influences Self-Service Technology Evaluation. The Scholarly Commons.
[71] Combs Yuttapong & Sirion (2009). Diffusion of Innovation in Asia: A study of Internet Banking in Thailand and India. Innovative Marketing, 26-31.
[72] Cunningham (1967). The Major Dimensions of Percieved Risk in Risk Taking and Infirmation Handling in Consumer Behavior Cambridge: Hardward University Press.
[73] Cynthia & Beverly (2003). On-line Trust: Concepts, Evolving themes, A Model. Internattional Journal of Human-Computer Studies, 737-758.
[74] Cyril Eze &Yaw (2011). Factors Affecting Internet Banking Adoption among Young Adults: An Evidence from Malesia. International Conference on Social Science and Humanity, 377-381.

Chapter 3
146
[75] Daneshgadeh & Yıldırım (2014). Empirical Investigation of Internet Banking Usage: The case of Turkey. Procedia Technology Elsevier, 322-331.
[76] Daniel (1999) Provision of Electronic Banking in the UK and the Republic of Ireland. International Journal of Bank Marketing, 72-83.
[77] Dash & Bhusan (2014). Determinants of Customers’ Adoption of Mobile Banking: An Empirical Study by Integrating Diffusion of Innovation with Attitude. Journal of Internet Banking and Commerce, 1-21.
[78] Daud & Razak (2018). Impact of Customer Trust Toward Loyalty: The Mediating Role of Perceived Usefulness and Satisfaction . Journal of Business and Retail Management Research , 235-242.
[79] David & Elena (2003). Trust and TAM in Online Shoping : An Integrated Model. M I S Quarterly, 51-90.
[80] Davis & Mayer (2007). An Integrative Model of Organisational Trust: Past, Present and Future. Academy of Management Review, 344-354.
[81] Davis (1989). Perceived Usefulness, Perceived Ease of Use, and User Acceptance of Information Technology. MIS Quarterly, 319-340.
[82] Davis (1993). User Acceptance of Computer Technology: System Charecteristics and User Pereptions. Intertional Journal of Man- Machine Studies, 475-487.
[83] Davis & Bagozzi (1989). User Acceptance of Computer Technology: A Comparison of Two Theoretical Models. Management Science, 982-1003.
[84] Dennis (2006). The Impact of Trust on the Acceptance of Online Banking. Europian Association of Education and Research in Commercial Destribution, 1-19.
[85] Dimitriadis & Nickolaos (2011). The Effect of Trust, Channel Technology and Transaction type on the Adoption of Self-Service Bank Channels. The service Industries Journal, 1293-1310.
[86] Dimitrios (2013). An Examination of the Critical Factors Affecting Consumer Acceptance Online banking: A focus on the Dimensions of Percieved Risk. Journal of Systems and Information Technology, 97-116.
[87] Dishawa & Strong (1999). Extending the Technology Acceptance Model with Task Technology fit Constructs. Information and Management, 9-21.
[88] Dixit & Datta (2010). Acceptance of E-banking Among Adult Customers: An Empirical Investigation in India. Journal of Internet Banking and Commerce, 1-17.

Conceptual Formulation of the Study
147
[89] Dlodlo (2014). The Relationships Among Service Quality, Trust, User Satisfaction and Post-Adoption Intentions in M-payment Services. Mediterranean Journal of Social Sciences, 165-175.
[90] Dondolo & Madinga (2016). Ease of Use, Security Concerns and Attitudes as Antecedents of Customer Satisfaction in ATM Banking. Banks and Bank Systems, 122-126.
[91] Drennan (2010). An Investigation of Consumer Acceptance of Mobile banking. International Journal of bank Marketing , 547-568.
[92] Durodolu (2016). Technology Acceptance Model as a Predictor of Using Information System to Acquire Information Literacy Skills. Library Philosophy and Practice, 1-27.
[93] Dzogbenuku (2013). Banking Innovation in Ghana: Insight of Students’ Adoption and Diffusion. Journal of Internet Banking and Commerce, 1-20.
[94] Ebru & Yagmur (2014). The Moderating Effects of Percieved Use and Percieved Risk in Online Shopping. Journal Of Global Strategic Management, 71-85.
[95] Edward & Martey (2016). Contribution of Accessibility & Convenience as Adoption Tool of E-Banking in Ghana. International Journal of Innovative Reseach in Computer Science & Technology (IJIRCST), 159-162.
[96] El Kasheir & Yacout (2009). Factors Affecting Continued Usage of Internet Banking Among Egyptian Customers. Communication of the IBIMA, 252-263.
[97] Elena Karahanna (1999). Information Technology Adoption Across Time; A Cross Sectional Comparison of Pre-Adoption and Post- Adoption Beliefs. MIS Quarterly, 183-213.
[98] El-Qirem (2013). Critical Factors Influencing E-Banking Service Adoption in Jordanian Commercial Banks: A Proposed Model. International Business Research, 229-236.
[99] Ernovianti & Matr (2012). The Usage of Internet Banking Service among Higher Learning Students in Malaysia. American Journal of Economics, 105-108.
[100] Errikson & Nilsson (2005). Customer Acceptance of Internet Banking in Estonia. International Journal of Bank Marketing , 200-216.
[101] Fadare (2016). A Survey on Perceived Risk and Intention of Adopting Internet Banking. Journal of Internet Banking and Commerce, 1-21.

Chapter 3
148
[102] Fang (2006). Effects of Network Quality Attributes on Customer Adoption Intentions of Internet Banking. Total Quality Management & Business Excellence, 61-77.
[103] Farzianpour & Masoumeh (2014). Consumer's Perceived Risk and it Effects on Adoption of Online Banking Services. American Journal of Applied Sciences, 47-56.
[104] Fawzy & Esawai (2017). Internet Banking Adoption in Egypt: Extending Technology Acceptance Model. Journal of Business and Retail Management Research, 109-118.
[105] Featherman & Pavlou (2002). Predicting E- Service Adoption; A Perceived Risk Facets Perspective. Human- Computer interaction studies in MIS, 1034-1046.
[106] Firdous & Farooqi (2015). Impact of Internet Banking Service Quality on Customer Satisfaction. Journal of Internet Banking and Commerce.
[107] Florentina & Shen (2011). An Empirical Study on E-Banking Acceptance in the United Arab Emirates (UAE). Journal of Electronic Banking Systems, 1-9.
[108] Gamal & Gebba (2013). Mobile Banking Adoption: An Examination of TechnologyAcceptance Model and Theory of Planned Behavior. International Journal of Business Research and Development, 35-50.
[109] Geetha & Vaithiyanathan (2012). Assessment of a Modified Technology Acceptance Model among E-banking Customers in Coimbatore City. International Journal of Innovation, Management and Technology, 181-187.
[110] Gefen & Straub (1997). Gender Difference in the Perception and Use of E-mail: An Extention to the Technology Acceptance Model. MIS Quarterly, 389-400.
[111] George & Kumar (2013). Antecedents of Customer Satisfaction in IB; Technology Acceptance Model redefined. Global Business Review, 627-638.
[112] Gerrard & Cunningham (2006). Why Consumers are not Using Internet Banking: A Qualitative Study. Journal of Service Marketing, 160-168.
[113] Ghane & Fathian (2011). Full Relationship Among E-Satisfaction, E-Trust, E-Service Quality and E-loayalty; The Case of Iran E-Banking . Journal of Theroatical and Applied Information Technology, 1-6.
[114] Gholamreza & Mohammad (2012). Technology of E-banking: Perspective of Customers’ Perceived Risk and Uncertainty. Indian Journal of Science and Technology, 2200-2208.

Conceptual Formulation of the Study
149
[115] Giovanis & George (2012). An Extension of TAM Model with IDT and Security/privacy Risk in the Adoption of Internet Banking Services in Greece. Euro Med Journal of Business, 24-53.
[116] Goh & Lim (2016). Understanding Customer Satisfaction of Internet Banking: A Case Study in Malacca. Procedia Economics and Finance, Science Direct Elsevier, 80-85.
[117] Gounaris & Koritos (2013). Investigating the Drivers of Internet Banking Adoption Decision: A Comparison of three Alternative Frameworks. International Journal of Bank Marketing, 282-304.
[118] Guinea & Markus (2009). Why Break the Habit of a Lifetime? Rethinking the Roles of Intention, Habit, and Emotion in Continuing Information Technology Use. MIS Quarterly, 434-444.
[119] Gupta & Rakhi (2013). Dimensions Affecting Consumers’ Continued Usage and Frequency of Usage of Internet Banking: Empirical Evidence from India. International Journal of Engineering and Innovative Technology (IJEIT), 21-32.
[120] Hada & Singh (2018). Online Banking and Customer Satisfaction in Public and Private Sector Banks: Evidence from India. IOSR Journal of Business and Management, 10-20.
[121] Hadji & Degoulet (2016). Information System End-user Satisfaction and Continuance Intention: A unified Modeling Approach. Journal of Bio Medical Informatics, 185-193.
[122] Han & Hong (2018). A Model and Empirical Study on the User’s Continuance Intention in Online China Brand Communities Based on Customer-Perceived Benefits. Journal of Open Innovation, Technology Market and Complexity, 1-20.
[123] Hartmut & Hoehle (2012). The Role of Continuous Trust Information System's Continuance. Journal of Computer Information System, 1-9.
[124] Hee-Woong & Koh (2004). A Comparison of Online Trust Building Factors between Potential Customers and Repeat Customers. Journal of the Association for Information Systems, 392-420.
[125] Hernan & Requelme (2010). The Moderating Effect of Gender in the Adoption of Mobile Banking. International Journal of Bank Marketing, 328-341.
[126] Hernandez-Ortega (2011). The Role of Post-Use Trust in the Acceptance of a Technolgy: Drivers and Consequances. Technovision, 523-538.

Chapter 3
150
[127] Hong (2015). Examining Mobile Payment User Adoption, from the Perspective of Trust. International Journal of Networking and Virtual Organisations, 117-130.
[128] Hossain & Shakhawa (2018). Predicitng the Continuance Usage Intention on Mobile Payments: An Experimental Study of Bangaladeshi Customers. Asian Economic and Financial Review , 487-498.
[129] Hossain & Yahin (2015). Mobile Banking and Customer Satisfaction: The Case of Dhaka City. World Review of Business Research, 108-120.
[130] Hsiang-Ming & Leem (2014). Perceived Quality as a Key Antecdent in Continuance Intention on Mobile Commerce. International Journal of Electronic Commerce Studies, 123-142.
[131] Hsieh & Wei Wang. (2007). Explaining Employees’ Extended Use of Complex Information Systems. European Journal of Information Systems, 216-227.
[132] Huang (2017). Cognitive Factors in Predicting Continued use of Information Systems with Technology Adoption Models. Information Research, 1-42.
[133] Hui-Min & Lai 2016). Expectation-Confirmation Model of Information System Continuance: A Meta-Analysis . International Scholarly and Scientific Research & Innovation , 2325-2330.
[134] Hung Kit Lui (2003). TRI TAM: A Model for Integrating Trust and Risk Perceptions in Business-to-Consumer ElectronicCommerce. 16th Bled eCommerce Conference Bled, 349-364
[135] Hussain (2014). Innovation Acceptance Research: A Review of Theories, Contexts, and Approaches. Journal of Internet Banking and Commerce, 1-18.
[136] Ibrahim & Al-Jabri (2012). Mobile Banking Adoption- Application of Diffusion of Innovation Theory. Journal of Electronic Commerce Research, 379-391.
[137] Icek & Fishbein (1975). Understanding Attitudes and Predicting Social Behavior. Michigan: Prentice-Hall.
[138] Iranmanesh (2012). New Approach to Study of Factors affecting Adoption of Electronic Banking Services with Emphasis on the Role of Positive Word of Mouth. African Journal of Business Management, 4328-4335.
[139] Islam & Umme (2014). Customer Satisfaction of Internet Banking in Bangladesh: A Case Study on Citibank N.A. Asian Journal of Applied Science and Engineering, 51-62.

Conceptual Formulation of the Study
151
[140] Jaism & Hamdi (2012). Factors Influening Consumers' `Satisfaction and Continuity to deal with E- banking Services. Global Journal of Management and Business Research, 128-142.
[141] Jason & Ramsay (1999). Managing Customer Channel Usage in the Australian Banking sector. Managerial Auditing Journal, 329-338.
[142] Jason & Harrison (2009). The Role of Trust in Post-adoption IT Exploration: An Empirical Examination of Knowledge Management Systems. IEEE Transactions and Engineering Management, 1-15.
[143] Jason & Thatcher (2017). How and Why Trust Matters in Post-Adoptive Usage: The Mediating Roles of Internal and External Self-Efficacy. The Journal of Strategic Informations, 1-21.
[144] Jayasiri & Dharmadasa (2016). Adoption of Internet Banking in Sri Lanka - An Extension to Technology Acceptance Model. Asia Pacefic Journal of Contemporary Education and Communication Technology, 179-189.
[145] Jean-Pierre & Normand (2011). Modeling Perceived Usefulness on Adoption of Online Banking through TAM Model in Canadian Banking Environment. Journal of Internet Banking and Commerce, 1-22.
[146] Jen-Hwa & Brown (2009). Determinants of Service Quality and Continuance Intention of Online Services: The Case of eTax. Journal of the American Society for Information Science and Technology, 292-306.
[147] Jeong & Yoon (2013). An Empirical Investigation on Consumer Acceptance of Mobile Banking Services. Business and Management Research, 31-40.
[148] Jham (2016). Customer Satisfaction with Internet Banking: Exploring the Mediating Role of Trust . Journal of Emerging Trends in Economics and Management Sciences , 75-87 .
[149] Jian & Cohen (2017). Understanding Trust and Perceived Usefulness in the Consumer Acceptance of an E-service: A Longitudinal Investigation. Behavior and Information Technology, 125-139.
[150] John (2013). Mobile Banking Products and Rural India: An Evaluation. IOSR Journal of Economics and Finance, 36-40.
[151] Joshua (2011). Usage Patterns of Electronic Banking Services by Urban Educated Customers: Glimpses from India. Journal of Internet Banking and Commerce, 1-12.
[152] Joubert & Belle (2013). The Role of Trust and Risk in Mobile Commerce Adoption within South Africa . International Journal of Business, Humanities and Technology, 27-38.

Chapter 3
152
[153] Juwaheer & Pudaruth (2012). Factors Influencing the Adoption of Internet Banking: A Case Study of Commercial Banks in Mauritius. World Journal of Science, Technology and Sustainable Development, 204-234.
[154] Kapoor (2015). Customer Satisfaction and E – Banking Services: A Case Study of Tricity. International Journal of Innovative Research in Science, Engineering and Technology, 10270-10277.
[155] Kassim & Ramayah (2015). Measurement Model of Risk Perception in Internet Banking, based on Malysian Context. ARPN Journal of Engineering and Applied Sciences, 17632-17639.
[156] Kaur & Kiran (2014). Customer Satisfaction and Customer Loyalty in E-Banking in India: The Intricacies of Relationship . IOSR Journal of Business and Management , 6-13.
[157] Kaushik & Zillur (2014). Innovation Adoption Across Self-Service Banking Technologies in India. International Journal of Bank Marketing, 96-121.
[158] Kesharwani & Bisht (2012). The Impact of Trust and Perceived Risk on Internet Banking Adoption in India. The International Journal of Bank Marketing, 303-322.
[159] Khayati (2013). Perceived Usefulness and Use of Information Technology: The Moderating Influences of the Dependence of a Subcontractor towards His Contractor. Journal of Knowledge Management, Economics and Information Technology , 1-28.
[160] Khedmatgozar (2012). The Mediating Role of the Dimensions of the Perceived Risk in the Effect of Customers’ Awareness on the Adoption of Internet Banking in Iran. Electronic Commerce Research, 151-175.
[161] Kim (2012). An Investigation of the Effect of Online Consumer Trust on Expectation, Satisfaction, and Post-Expectation. Information Systems and E -Business Management, 219-240.
[162] Kim & Hong (2016). Antecedents of Use-Continuance in Information Systems: Toward an Integrative View. Journal of Computer Information Systems, 61-73.
[163] Kim & Hyo-Joo (2008). The Effects of Perceived Risk and Technology Type on Users’ Acceptance of Technologies. Information and Management, 1-9.
[164] Klaus-Peter & Seegebarth (2010). The Influence of Consumers’ Risk Attitudes and Behaviour on the Adoption of Online Banking Services. Journal of Marketing Trends, 7-16.

Conceptual Formulation of the Study
153
[165] Klopping & McKinney (2004). Extending the Technology Acceptance Model and the Task-Technology Fit Model to Consumer E-Commerce. Information Technology, Learning, and Performance Journal, 35-48.
[166] Kmaran & Mohammed (2010). A Model for E- banking Trust in Iran's Banking Industry. International Journal of Industrial Engineering and Production Research, 23-33.
[167] Kodithuwakku (2018). Impact of Internet Banking on Customer Satisfaction: A Case Study of StateBanks in Kandy District. Academy of Social Science Journal, 1114-1122.
[168] Krishna & Ramana (2016). A Study on Customer Awareness and Satisfaction towards Handloom Products with Special Reference to Guntur District – Andhra Pradesh. Acme Intelle International Journal of Research in Management, Social Sciences & Technology, 1-16.
[169] Kumar & Ravindran (2012). An Empirical Study on Service Quality Perceptions and Continuance Intention in Mobile Banking Contexts in India. Journal of Internet Banking and Commerce, 1- 22.
[170] Kumar & Balaji (2017). Predicting Internet banking Adoption in India: A Perceived Risk Perspective. Journal of Strategic Marketing, 418-438.
[171] Kumar & Madhumohan (2014). Internet Banking Adoption in India Structural Equation Modeling Approach. Journal of Indian Business Research, 155-169.
[172] Kumari & Janaka (2014). Impact of Mobile Banking Services on Customer Satisfaction: A Study on Sri Lankan State Commercial Bank. International Journal of Computer and Information Technology, 546-552.
[173] Kumbhar (2013). Refinement and Retesting of“eBankQual” Scale in Internet Banking Service Settings. Emerging Trends in Infromation technology and Management (pp. 1-14). Maharashtra: Munich Personal RePEc Archive.
[174] Kumbhar (2011). Factors Affecting Customer Satisfaction in E- Banking- Some Evidence from Indian Banks . Management Research and Practice, 1-14.
[175] Kundu & Kumar (2014). Impact of Trust on the Relationship of E-service Quality and Customer Satisfaction. Euro Med Journal of Business, 21-46.
[176] Kyung & Sung (2009). Trust, Perceived Risk and Trusting Behavior, in Internet Banking. Asia Pacefic Journal of Information System, 1-23.

Chapter 3
154
[177] Lacramioara, & Cosmin (2013). An Application of Technology Acceptance Model to Internet Banking Services. International Conference “Marketing – from Information to Decision, 251-266.
[178] Laforet & Li (2005). Consumers’ Attitudes towards Online and Mobile Banking in China. International Journal of Bank Marketig, 362-380.
[179] Lallmahamood, & Muniruddeen (2007). An Examination of Individual’s Perceived Security and Privacy of the Internet in Malaysia and the Influence of this on Their Intention to Use E-Commerce: Using an Extension of the Technology Acceptance Model. Journal of Internet Banking and Commerce, 1-26.
[180] Lee & Chi (2009). Factors Influencing the Adoption of Internet Banking: An Integration of TAM and TPB with Perceived Risk and Perceived Benefit. Electronic Commerce Research and Applications, 130-141.
[181] Lee & Ki (2007). Factors Influencing the Adoption Behavior of Mobile Banking:A South Korean Perspective. Journal of Internet Banking and Commerce, 1-9.
[182] Lee & Chen (2014). Perceived Quality as a Key Antecedent, in Continuance Inetntion on Mobile Commerce. International Journal of Electronic Commerce Studies, 123-142.
[183] Lee & Wang (2012). The Impact of Task Technology Fit, Perceived Usability and Satisfaction on M-Learning Continuance Intention. International Journal of Digital Content Technology and its Applications(JDCTA) , 35-42.
[184] Lele & Maheshkar (2017). A Review of Technology Adoption Models and Research Synthesis of Pre and Post-Adoption Behavior in Online Shopping. IOSR Journal of Business and Management (IOSR-JBM), 37-48.
[185] Liao & Kuanchin (2011). Examining the Impact of Privacy, Trust and Risk Perceptions beyond Monetary Transactions: An Integrated Model. Electronic Commerce Research and Applications, 702-715.
[186] Lie bana-Cabanillas & Mun oz-Leiva (2013). The Determinants of Satisfaction with E-banking. Industrial Management & Data Systems, 750-767.
[187] Lifen & Stuart (2010). Adoption of Internet Banking Services in China: Is it all about Trust? International Journal of Bank Marketing, 7-26.
[188] Lii (2009). A Model of Customer E-Loyalty in the Online Banking. Economics Bulletin , 891-902.

Conceptual Formulation of the Study
155
[189] Lingling (2014). An Empirical Study on Mobile Social Networking Services, Integrating IS Success Model, Network Externalities, and Flow Theory. Asia Pacific Journal of Marketing and Logistics, 168-189.
[190] Lingying & Zhang (2012). Dimensions of Consumers’ Perceived Risk and Their Influences on Online Consumers’ Purchasing Behavior . Communication Information Science Management Engineering , 8-14.
[191] Luiz Moutinho (2000). Modelling Bank Customer Satisfaction through Mediation of Attitudes towards Human and Automated Banking. International Journal of Bank Marketing, 124-134.
[192] Luqman & Ismail (2014). A Review on Mobile Commerce Continuance Intention Studies and its Underlying Model . Journal of Basic and Applied Scientific Research , 1-9.
[193] Maditinos & Sarigiannidis (2013). An Examination of the Critical Factors Affecting Consumer Acceptance of Online Banking; A Focus on the Dimensions of Risk. Journal of Systems and Information Technology, 97-116.
[194] Maduku & Daniel (2014). Customers’ Adoption and Use of E-banking Services: The South African Perspective. Banks and Bank Systems, 78-88.
[195] Mahmoud & Singh (2012). Effect of Trust on E-Banking User’s Satisfaction: A Review. Research Journal of Applied Sciences, Engineering and Technology, 1397-1406.
[196] Man (2006). Factors Affecting Customer’s Trust in Online banking. Hong Kong Baptist University.
[197] Mandan & Dashtipour (2013). Analysis the Effects of Electronic Banking on Customer Satisfaction and Loyalty (Case study: Selected Branches of Melli Bank in Tehran). Inter Disciplinary Journal of Contemporary Reseach in Business, 230-241.
[198] Mansour & Ben (2016). An Analysis of Business’ Acceptance of Internet Banking: An Integration of E-trust to the TAM. Journal of Business & Industrial Marketing, 982-994.
[199] Margaret Tan (2000). Factors Influencing the Adoption of Internet Banking. Journal of the Association for Information Systems.
[200] Marzieh zendehdel (2016). The Moderating Effect of Culture on the Construct Factor of Perceived Risk towards Online Shopping Behaviour. Cogent Business Management .
[201] Mathieson (1991). Redicting User Intentions: Comparing the Technology Acceptance Model with the Theory of Planned Behavior. Information System Research, 173-191.

Chapter 3
156
[202] Mckechnie & Sally (2006). Applying the Technology Acceptance Model to the Online Retailing of Financial Services. International Journal of Retail and Destributional Management, 388-410.
[203] Mcknight & Bennet (2013). Incorporating Trust in Technology into Expectation Disconfirmation Theory. Journal of Strategic Information Systems, 128-145.
[204] McKnight & Carter (2009). Trust in Technology: Development of a Set of Constructs and Measures. DIGIT ( 1-10). Association for Information Systems AIS Electronic Library (AISeL) .
[205] Micknight & Carter (2011). Trust in a Specific Technology: An Investigation of its Components and Measures. Transactions on Management Information Systems (TMIS), 1-25.
[206] Md Nor (2010). Adoption of Internet Banking Theory of Diffusion of Innovation. International Journal of Management Studies, 69-85.
[207] Mei-Chun & Wu (2008). An Empirical Investigation of Habitual Usage and Past Usage on Technology Acceptance Evaluations and Continuance Intention. The Data base for Advance Systems, 48-73.
[208] Mihail & Cocosila (2009). Early Investigation of New Information Technology Acceptance: A Perceived Risk Motivation Model. Communications of the Association for Information Systems, 340-358.
[209] Mirjana & Bacha (2016). Technology Acceptance Model for Business Intelligence Systems:Preliminary Research. Procedia Computer Science, 995 – 1001.
[210] Mohamad & Salwani (2013). Technology Trust and Mobile Banking Satisfaction: A Case of Malaysian Consumers. International Conference on Innovation, Management and Technology Research, Elsevier, 53-58.
[211] Mohammed & Rahman (2017). User Adoption of Mobile Commerce in Bangladesh: Integrating Perceived Risk, Perceived Cost and Personal Awareness with TAM. The International Technology Management Review, 103-124.
[212] Mohd & Ariff Zakuan (2013). The Impacts of Service Quality and Customer Satisfaction on Customer Loyalty in Internet Banking. Procedia - Social and Behavioral Sciences, Elsevier, 469-473.
[213] Mohtar (2018). A conceptual model; Continuance intention on mobile banking among Malaysian Customers. Conference on Technology & Operations Management, 394-402.

Conceptual Formulation of the Study
157
[214] Moon & Kim (2001). Extending the TAM for a World-Wide-Web Context. Information & Management, 217-230.
[215] Mousa & Luvai (2017). Privacy and Personalization in Continued Usage Intention of Mobile Banking: An Integrative Perspective. Information System frontiers, 1-13.
[216] Muneesh & Sareena (2013). Factors Influencing the Level of Adoption of Internet banking:An Integration of TAM and Web Trust Model. Asian Journal of Management Research, 130-145.
[217] Munir (2015). E-Banking Service Quality and Customer Satisfaction of a State Owned Schedule Bank of Bangladesh. Journal of Internet Banking and Commerce.
[218] Musiime & Ramadhan (2011). Internet Banking, Consumer Adoption and Customer Satisfaction. African Journal of Marketing Management, 261-269.
[219] Nadim & Noorjahan. (2007). The Role of Perceived Usefulness, Perceived Ease of Use, Security and Privacy and Customer Attitude to Engender Customer Adaptation in the Context of Electronic Banking. African Journal of Business Management, 032-040.
[220] Naimat (2013). The Effect of Trust in Adoption of Internet Banking: A case Study of Nigeria. Academic Research Journals, 20-24.
[221] Naser & Majid (2016). Investigating Effective Factors on Customer Satisfaction of Internet banking The Case of Post Bank of Iran. International Journal of Humanities and Cultural Studies, 1706-1718.
[222] Naser & Mehdi (2014). Studying the Impact of E-Service Quality on E-Loyalty of Customers in the Area of E- banking Services. Journal of Management and Sustainability, 126-133.
[223] Nasim & Hosein (2009). Internet Banking: An Empirical Study of Adoption Rates Among Midwest Community Banks. Journal of Business & Economics Research , 51-72.
[224] Nasri & Zarai (2014). Emprical Analysisin Internet Banking Adoption in Tunisia. Asian Economic and Financial Review, 1812-1825.
[225] Nasrin & Mohammad (2014). Identify and Rank the Factors Affecting Customer Satisfaction of E-Banking. International Business and Management, 162-168.
[226] Nath & Mukherjee (2003). A Model of Trust in Online Relationship Banking. The International Journal of Bank Marketing, 5-15.

Chapter 3
158
[227] Noreen (2015). Awareness of Electronic Banking and the Customer's Level of Satisfaction in Pakistan. Arabian Journal of Business and Management Review (Nigerian Chapter), 37-47.
[228] Normalini & Kassim (2015). Perceived Risk Factors Influence on Intention to Continue Using Internet Banking among Malaysians. Global Business Review.
[229] Norshidah Mohamed (2014). Insights into Individual’s Online Shopping Continuance Intention. Industrial Management & Data systems, 1453-1476.
[230] Ofori & Boateng (2017). Examining Customers’ Continuance Intentions towards Internet Banking Usage. Marketing Intelligence & Planning, 756-773.
[231] Oliver (1980). A Cognitive Model of the Antecedents and Consequences of Satisfaction Decisions. Journal of Marketing Research, 460-469.
[232] Oliver (1977). Effect of Expectation and Disconfirmation on Post-Exposure Product Evaluations An Alternative Interpretation. Journal of Applied Psychology, 480-486.
[233] Parasuraman & Zeithaml (2005). E-S-QUAL A Multiple-item Scale for Assessing Electronic Service Quality. Journal of Service Research, 213-233.
[234] Parasuraman & Leonard (1985). A Conceptual Model of Service Quality and its Implication for Future Research (SERVQUAL). International Journal of Marketing, 41-50.
[235] Patricia (2016). When, How, and Why Do We Trust Technology Too Much? Emotions, Technology and Behavior, 85-106.
[236] Pikkarainen & Kari (2004). Consumer Acceptance of Online Banking: An Extension of the Technology Acceptance Model. Internet Research, 224-235.
[237] Pin & Hsin (2005). Toward an Understanding of the Behavioral Intention to use Mobile Banking. Computers in Human Behavior, 873-891.
[238] Piriyakul & Raepepan (2015). Effects of Trust, Satisfaction and Factors Corresponding to TAM on Intention to Reuse Internet Business Transaction. International Review of Management and Business Research, 872-890.
[239] Poon (2008). Users’ Adoption of E-banking Services: The Malaysian Perspective. Journal of Business & Industrial Marketing, 59-69.
[240] Pratap & Bhattacharya (2013). Customer Satisfaction in Indian Retail Banking: A Grounded Theory Approach. USA: Nova Southeastern University.
Conceptual Formulation of the Study
159
[241] Praveena (2018). Trust and Hedonic Motivation: Predicting the Satisfaction and Continuance Intention to use Facebook. Asian Journal of Management, 317-321.
[242] Praveena & Thomas (2014). Continuance Intention to Use Facebook: A Study of Perceived Enjoyment and TAM. Bonfring International Journal of Industrial Engineering and Management Science, 24-29.
[243] Prybutok & Xu (2011). An Integrated Model for Customer Online Repurchase Intention. Faculty Research and Creative Activity, 1-11.
[244] Rahman & Kaushik (2014). Innovation Adoption Cross Self -Service Banking Technologies in India. International Journal of Bank Marketing, 96-120.
[245] Ranjan & Malik (2018). Explaining Customer’s Continuance Intention to Use Mobile Banking Apps with an Integrative Perspective of ECT and Self-Determination Theory. Pacefic Asia Journal of the Association for Information System, 79-112.
[246] Rao (2015). The Impact of Brand Awareness on Customer Satisfaction: A Case Study of Godfrey Phillips India Limited, India . Research Journal of Social Science and Management, 38-44.
[247] Rashid & Saleem (2011). Relationship Between Customer Satisfaction and Mobile Banking Adoption in Pakistan. International Journal of Trade, Economics and Finance, 537-544.
[248] Regina (2015). A Study on Customer Awarness and Satisfaction towards E-Banking Services. Indian Journal of Applied Research.
[249] Reichheld & Shefter (2000). E-Loyalty: Your Secret Weapon on the Web. Harward Business Review, 105-114.
[250] Ricardo (2016). Intention of Adoption of Mobile Payment: An Analysis in the Light of the Unified Theory of Acceptance and Use of Technology (UTAUT). RAI Revista de Administração e Inovação, 221-230.
[251] Richard (2013). The Influance of Perceived Ease of Use and Perceived Usefulness on Trust and Intention to Use Mobile Service Software. African Journal of Physical Health Education, Recreation and Dance, 258-273.
[252] Richard (1997). Satisfaction: A Behavioural Perspective on the Consumer. NewYork: McGraw Hill.
[253] Rogers (1991). Communication of Innovation A cross Cultural Approach. Newyork: Free Press.

Chapter 3
160
[254] Rogers (1962). Diffusion of Innovations. Newyork: Free Press of Glencoe.
[255] Roy & Dewit (2001). The Impact of Interface Usability on Trust in Web Retailers. Internet Research, Electronic Applications and Policy, 388-398.
[256] Cui (2014). Extending the Expectation Confirmation Model to Evaluate the Post- Adoption Behavior of IT Continuers and Discontinuers. Association for Information Systems AIS Electronic Library (AISeL), 1-9.
[257] Sabi (2014). Research Trends in the Diffusion of Internet Banking in Developing Countries. Journal of Internet Banking and Commerce, 1-31.
[258] Sadhegi & Hanzaee (2010). Customer Satisfaction Factors (CSFs) with Online Banking Services in an Islamic Country: Iran. Journal of Islamic Marketing, 249-267.
[259] Saeedeh & Abolfazl (2017). Effect of Electronic Service Quality on Customer Satisfaction and Loyalty Saderat Bank’s Customers. International Journal of Scientific Study, 407-411.
[260] Saeednia & Abdollahi (2012). Factors Affecting Client Trust in Online Banking - A Case Study of Saman Bank . International Journal of Economics and Business Modelin, 149-151.
[261] Safeena & Date (2013). Combination of TAM and TPB in Internet Banking Adoption. International Journal of Computer Theory and Engineering, 146-150.
[262] Safeena & Date (2012). Technology Adoption and Indian Consumers: Study on Mobile Banking . International Journal of Computer Theory and Engineering, 1020-1024.
[263] Saleh & Steve (2014). Using the Technology Acceptance Model in UnderstandingAcademics’ Behavioural Intention to Use Learning Management Systems. International Journal of Advanced Computer Science and Applications, 143-155.
[264] Sanjeepan & Ragel (2017). A Study on Impact of Switching Cost on Customer Satisfaction for Internet Banking Services at Commercial Banks in Batticaloa. International Journal of Economics and Business Management, 12-23.
[265] Sankar & Kumari (2016). Factors Affecting Mobile Banking Adoption Behavior in India. Journal of Internet Banking and Commerce, 1-24.
[266] Santhanamery (2016). The Effect of Trust in the System and Perceived Risk in Influencing Continuance Usage Intention of an E-Government System. Journal of Applied Environmental and Bilological Science, 7-18.

Conceptual Formulation of the Study
161
[267] Santouridis & Kyritsi (2013). Investigating the Determinants of Internet Banking Adoption in Greece. The Economies of Balkan and Eastern Europe Countries in the Changed World (EBEEC 2013) Science Direct, Elsavier, 501-510.
[268] Sathye (1999). Adoption of Internet banking by Australian consumers: An Empirical Investigation. International Journal of Bank Marketing, 324-334.
[269] Serkan & Atilgan (2004). Adoption of Internet Banking Among Sophisticated Consumer Segments in an Advanced Developing Country. International Journal of Bank Marketing, 212-232.
[270] Sikdar (2014). Online Banking Adoption; A Factor Validation and Satisfaction Causation Study in the Context of Indian Banking Sector. International Journal of Bank Marketing, 760-785.
[271] Shahimi & Shabudin (2018). Conceptual Model, Continuance Intention of Mobile Banking Among Malaysian Customers. Conference on Technology & Operations Management (2ndCTOM), 394-402.
[272] Shanab & Pearson (2008). Internet Banking in Malasisa Based on the Theory of Reasoned Action. The International Journal of Bank Marketing, 3-13.
[273] Shaoyi Liao (1999). The Adoption of Virtual Banking: An Empirical Study. International Journal of Information Management, 63-74.
[274] Sharma & Purushotham (2014). Technology Acceptance Perspective on User Satisfaction and Trust of E-Governement Adoption . Journal of Applied Sciences , 860-872.
[275] Sharma (2015). Predicting Determinants of Internet Banking Adoption A two-Staged Regression-neural Network Approach. Management Research Review, 750-766.
[276] Sharman (2006). Understanding Consumer Adoption of Internet Banking: An Intrepretive Study in the Australian Banking Context. Journal of Electronic Commerce Research, 50-66.
[277] Shih & Fang (2004). The Use of a Decomposed Theory of Planned Behavior to Study Internet Banking in Taiwan. Internet Research; Bradford, 213-223.
[278] Shin & Yahya (2015). Consumers’ Perception towards the Extent of Internet Banking Usage in Malysia. Problems and Perspectives in Management, 288-295.

Chapter 3
162
[279] Shish- Chich Chen (2013). Integrating Technology Readiness into Expectaion Confirmation Model- An Empirical Study of Mobile Service. Cyber Pschology Behavior and Social Networking.
[280] Shish- Chich Chen (2011). Recent Related Research in Technology Acceptance Model- A Literature Review. Australian Journal of Business and Management Research, 124-127.
[281] Shish & Lien lin (2015). Perceived Quality Factors of Location-based Apps on Trust, Perceived Privacy Risk, and Continuous Usage Intention. Behavior and Information Technology, 2-10.
[282] Shunbo Yuan (2016). An Investigation of Users’ Continuance Intention towards Mobile Banking in China. Information Development, 20-34.
[283] Simon Gyasi Nimako (2013). Customer Satisfaction With Internet Banking Service Quality In The Ghanaian Banking Industry. International Journal of Scientific & Technology Research, 165-175.
[284] Singh (2014). Factors Influencing E-Banking Adoption in India: An Amalgamation of TAM and TPB. International Journal of Computer Science and Technology, 91-96.
[285] Singh (2017). Adoption of Internet Banking Services in India: An Empirical Study. Global Journal of Management and Business Research E marketing, 36-42.
[286] Soheila Ghaane (2011). Full Relationship among E- Satisfaction, E-Service Quality E- Trust and E-Loyalty, the case of Iran E-banking. Journal of Theoratical and Applied Information Technology, 1-6.
[287] Stacie Petter (2008). Measuring Information Systems Success: Models, Dimensions and Inter Relationships. European Journal of Information Systems, 236-263.
[288] Straub (1991). Security Concerns of System Users; A Study of Perceptions of the Adequacy of Security. Information and Management, 13-27.
[289] Sumeet Gupta (2010). Examining the Relative Influence of Risk and Control on Intention to Adopt Risky Technologies. Journal of Technology Management & Innovation, 22-37.
[290] Susan Brown (2008). Expectation Confirmation: An Examination of Three Competing Models. Management Information System, 52-66.
[291] Susanto & Park (2012). The Role of Trust and Security in Smartphone Banking Continuance. IEE International Conference on Systems, Man, and Cybernetics , Research Gate, 2133-2138.

Conceptual Formulation of the Study
163
[292] Swanson (1982). Measurig User Attitudes in MIS Research- A Review. Omega International Journal of Mangement science, 157-165.
[293] Syed & Qureshi (2011). Trust and Initial Acceptance of Mobile Banking in Pakistan. International Journal of Scientific & Engineering Research, 1-14.
[294] Taherdoost & Shamsul (2012). Smart Card Technology; Awareness and Satisfaction. Journal of Computing, 128-132.
[295] Tahir & Abdollah (2013). The Impact of Technology CSFs on Customer Satisfaction and the Role of Trust : An Empirical Study of the Banks in Malaysia. International Journal of Bank Marketing, 429-447.
[296] Tamara Dinev (2007). The Centrality of Awareness in the Formation of User Behavioral Intention toward Protective Information Technologies. Journal of the Association of the Innovation System, 386-408.
[297] Tams Bennet, & Craig (2018). How and Why Trust Matters in Post-Adoptive Usage: The Mediating Roles of Internal and External Self-Efficacy. Journal of Strategic Information Systems, 170-190.
[298] Tanakinjal (2012). Exploring Technical Knowledge, Perceived Risk and the Innovative Characteristics in the Adoption of Mobile Marketing. American International Journal of Contemporary Research, 69-80.
[299] Tavishi & Kumar (2013). An Empirical Study on Technology Adoption by Indian Banks. Global Journal of Management and Business Studies, 1169-1172.
[300] Taylor (1995). Understanding Information Technology Usage; A test of Competeing Models. Information System Research, 144-176.
[301] Taylor & Todd (1995). Assessing IT usage: The Role of Prior Experience. MIS Quarterly, 561-570.
[302] Thakur (2012). Adoption Readiness, Personal Innovativeness, Perceived Risk and Usage Intention across Customer Groups for Mobile Payment Services in India. Internet Research, 369-392
[303] Thompson & Teo (2004). Consumer Trust in E-Commerce in the United States,Singapore and China. OMEGA, International Journal of Management Science, 24-38.
[304] Thong & Tum (2006). Understanding Continued Information Technology Usage Behavior: A Comparison of three Models in Context of Mobile Internet. Decision Support Systems , 1819-1834.

Chapter 3
164
[305] Thulani & Collins (2011). Adoption And Use of SMS/Mobile Banking Services in Zimbabwe: An Exploratory Study. Journal of Internet Banking and Commerce, 1-14.
[306] Trong & Minh (2019). E-Satisfaction and Continuance Intention: The Moderator Role of Online Ratings. International Journal of Hospitality Management, 311-322.
[307] Tsai- Jui & Ming-Tien (2014). The Influences of System Usability and User Satisfaction on Continued Internet Banking Services Usage Intention Empirical Evidence from Taiwan. Electronic Commerce Research, 137-169.
[308] Valvi & West (2013). E-Loyalty is not at all about Trust, Price also Matters: Extending Expectation- Confirmation Theory in Book Selling Websites . Journal of Electronic Commerce Research, 99-123.
[309] Vasileiadis (2014). Security Concerns and Trust in the Adoption of M.Commerce. Alexios Vasileiadis, 179-191.
[310] Vasileios Terzis (2013). Continuance Acceptance of Computer based Assessment through the Integration of User’s Expectations and Perceptions. Computers & Education, 50-61.
[311] Vatanasombuta & Styliano (2008). Information Systems Continuance Intention of Web-Based Applications Customers: The Case of Online Banking . Information & Management, 419-428.
[312] Venkatesh & Davis (2000). A Theoretical Extension of the Technology Acceptance Model: Four Longitudinal Field Studies. Management Science, 186-204.
[313] Venkatesh & Morris (2003). User Acceptance of Information Technology: Toward a Unified View. MIS Quarterly, 425-478.
[314] Venkatesh & Thong (2011). Extending the Two-Stage Information Systems Continuance Model: Incorporating UTAUT Predictors and the Role of Context. Information system Journal, 527-555.
[315] Vuong & Quan (2017). Perceived Risk and the Intention to use Credit Cards . International Research Journal of Finance and Economics, 77-89.
[316] Wagner & Oliveiria (2017). Apps for Mobile Banking and Customer Satisfaction: A Cross-Cultural Study. International Journal of Bank Marketing, 1133-1153.
[317] Wahab & Yousuf (2017). The Role of Trust in the Relationship between Quality Factors and Customer Satisfaction in Mobile Banking: A Conceptual Framework. The Social Scinece, 712-718.

Conceptual Formulation of the Study
165
[318] Waleed & Sandhu (2010). Factors Influencing the Adoption and Usage of Online Services in Saudi Arabia. The Electronic Journal of Information Systems in Developing Countries, 1-32.
[319] Wang & Yu- Min (2003). Determinents of User Acceptance of Internet Banking: An Empirical Study. International Journal of Service Industry Management, 501-519.
[320] Wang & Han Yaojun (2015). Modeling and Empirical Study of Users’ Continuance Intention Toward Location Based Service. International Business and Management, 8-15.
[321] Watson & Goodhue (2002). WEBQUAL : A Measure of Website Quality. American Marketing Association, 432-438.
[322] Wei Wang (2008). Explaining the Role of User Commitment in Extented use of Information System; An Empirical Investigation. Washington: Washington State University.
[323] William & Delone (1992). Information Systems Success: The Quest for the Dependent Variable. Information Systems Research, 60-95.
[324] Williamson & Kirsty (2006). Understanding Consumer Adoption of Internet Banking: An Intrepretive Study in the Austrelian Banking Context. Journal of Electronic Commerce Research, 50-66.
[325] Wu & Lin (2010). A Study of Bank Customer's Perceived Usefulness of Adopting Online Banking. Global Journal of Business Research, 101-108.
[326] Wu & Kuo (2008). An Investigation of Habitual Usage and Past Usage on Technology Acceptance Evaluations, and Continuance Intention. The Database for Advances in Information Systems, 48-73.
[327] Xu (2007). An Extended Expectation Confirmation Model for Information Systems Continuance. Wireless Communication and Networking. China: IEEE.
[328] Yadav (2014). A Study on Innovative Banking User’s Awareness Towards Mobile Banking in South Gujarat Region. Indian Journal of Applied Research, 93-97.
[329] Yashasvi & Mistry (2012). Level of Customer Satisfaction While Using Internet Banking: A Study of Anand City. International Journal of Marketing & Business Communication, 58-65.
[330] Yee & Chong (2013). Online Banking Adoption- An Empiricl Analysis. International Journal of Bank Marketing, 267-287.

Chapter 3
166
[331] Yi-Luen & -Shyong Ong (2015). Security Risk and Trust in Individual's Internet Banking Adoption; An Integrated Model. International Journal of Electronic Commerce Studies, 343-356.
[332] Yong-Hui Li (2009). Applying Theory of Perceived Risk and Technology Acceptance Model in the Online Shopping Channel. International Journal of Economics and Management Engineering, 505-511.
[333] Yoon, & Cheolho. (2010). Antecedents of Customer Satisfaction with Online Banking in China: The Effects of Experience. Computers in Human Behavior, Elsavier, 1296-1304.
[334] Yousafzai & Pallister (2003). A Proposed Model of E-Trust for Electronic Banking. Technovation, Elsevier, 847-860.
[335] Yousuf & Ali (2017). Determenents of Continuance Intention to Use Mobile Money Transfer: An Integrated Model. Journal of Internet Banking and Commerce, 1-24.
[336] Yuan & Yao (2014). An Investigation of Users’Continuance Intention towards Mobile Banking in China. Information Development, 1-15.
[337] Yue-Yang & Hsu (2010). Confirmation of Expectations and Satisfaction with the Internet Shopping: The Role of Internet Self-efficacy . Computer and Information Science , 14-22.
[338] Zeithaml & Parasuraman & (2002). Service Quality Delivery Through Web Sites: A Critical Review of Extant Knowledge. Journal of the Academy of Marketing Science, 362-375.
[339] Zhou (2012). Examining Continuance Usage of Mobile Internet Services from the Perspective of Resistance to Change. Information Developmen, 22-31.
[340] Zhou & Tsiga (2017). What Influence users’ E-finance Continuance Intention? The Moderating Role of Trust. Industrial Management & Data Systems, 1647-1670.
…..…..

Research Methodology
167
This chapter laying out the research methodology followed in this
study. The research problem, objectives, hypotheses, variables under
the study, research design, scope of the study, sampling design, details
of data collection, statistical techniques used in the study and limitation
of the study are explained in this chapter.

Chapter 4
168
4.1 Research Problem
The evolution of technology is advancing from information age to
experience age which focuses on innovations to improve the customer
experiences. Banking technologies with no exception, are getting more
popular and cheaper for the time period. Extensive use of technology in
the banking sector has redefined the role of a modern banker from mere
purveyor of credit to the service provider of various financial services at
the finger touch of customers anytime. Since the technology enabled
banking services are more popular among the bank customers, the
industry is witnessing rapid competition in adopting and updating these
technologies.
Detailed review of earlier studies revealed that, intention of
adoption of banking technologies by customers was the main focus of
research in the earlier period. Over the past two decades, considerable
amount of studies had been published in this category. Since the
customers are realising the comfort of accessing banking services through
electronic channels, many of the bank customers are started using such
technologies. A mass adoption of such technology enabled banking
services are reported in India after the demonetisation on November 2016.
However, serious discussion has yet to be made on the post-adoptive use
of TEBSS by the customers regarding to what extent the adopters are
using these services, to what extent they are satisfied with, to what extent
they trust these services and to what extent they are willing to continue
the use of such services in future. These are the real questions that are un-
answered and more relevant to be addressed for the time being.

Research Methodology
169
Since India is in the pathway of digitalising the economy, Government
has initiated several policies and programmes to boost the e-banking
transactions among the people in the country. Instead of initial adoption,
extended and continued use of such services should be promoted for the
long-term success of these technologies. Hence, the relevance of this
study is in the underlying fact that, analysis of the post-adoptive use and
continuance intention is more critical than that of analysing their initial
adoption intention. Moreover, a few studies that have looked the post-
adoption behaviour of customers in banking technology are ended up in
analysing customer satisfaction without touching any of the fundamental
factors that have influence on post-use experiences.
Customers may have certain perceptions regarding the adoptability
of technology when they are ready to adopt a new technology. Some of
these unique perceptions on adoptability have evidenced as having equal
importance in the post-adoption stage also. This includes user awareness
in technology and their perceptions regarding the specific characteristics
of that technology. In the banking context, technology characteristics like
ease of use, usefulness, are over emphasised in the adoption stage. But the
importance of these factors in the post-adoption stage are not explored
yet. Additionally, one of the unique features of TEBSS is its accessibility,
but previous studies did not explain its influence in the post-use
experiences of customers. Therefore, there is a need for understanding the
customers’ perception on adoptability of TEBSS in terms of their
awareness, accessibility, ease of use and usefulness of TEBSS in the post-
adoption stage to analyse their post-use experiences.

Chapter 4
170
Analysis of post-use experiences is more important once the user
started using any new technology. The previous studies are not explained
how the post-use experiences influence the future use intentions of
customers in banking technologies. Hence, it is indeed to study the
influence of post-use experiences such as post-use trust and risk
perception of customers in addition to satisfaction to spot their influence
on customers’ future intention to use the technology enabled banking
self-services. The degree of usage and their continuance intention to use
the TEBSS are highly depend on their satisfaction, trust and risk
perception. These are further influenced by several factors mainly
including user awareness and their perceptions about the adoptability of
these technologies. If any disconfirmation occurs in their perceptions, that
will hinder their satisfaction, trust and badly affect their risk perception.
Several researchers have agreed that, consumers are reluctant to
perform online banking transactions due to lack of trust. Since the direct
personal contact is absent in the service delivery as well as highly
confidential financial information are exchanged through an online
platform, post-use trust has substantial role in determining the usage
continuance intention of customers in these technologies. Similarly,
satisfied customers are more likely to make the extensive use of TEBSS
and they might have the strong intention to continue the use in future.
This also predicting future use behaviour of customers in using TEBSS.
So far however, there has been studies pointing out the customer
satisfaction and trust in using these services, have not looked how the
post-use trust and satisfaction influence continuance intention in using the
TEBSS. So, there is a possibility that, post-use trust and customer
Research Methodology
171
satisfaction have mediating role in the relationship between user
perceptions and continuance intention. That’s why it is more important to
study the intervening roles of post-use trust and satisfaction in the post-
adoption stage of TEBSS.
Even though there are studies on post-adoptive use of these
technologies, such studies have not attempted to check the role of risk
perception of customers in the post-use stage instead of analysing
perceived risk in the adoption intention. Users’ perception about risk after
they started using a new technology may also have significant impact on
their future use of that technology. Previous studies on adoption intention
had already proved that, the perception of risk negatively influencing user
intentions in a new technology adoption context. Similarly, the earlier
studies portrayed a bi-directional relationship between trust and risk
perception Jubert Belle (2013); Shunbo Yuan (2014); Santhanmery
(2016); Ebru & Yagmur (2014); Marzieh Zendehdel (2016). Hence there
is a possibility that, users’ trust and their continuance intention in using
TEBSS might have dependence on the level of risk perception of
customers. Therefore, it is indeed to study the moderating role of risk
perception of customers in the relationship between post-use trust and
continuance intention.
Technology adoption in banking sector had positive influence on
the performance of banks in terms of increased efficiency in service
delivery and reduced cost operations. The service providers are investing
huge amount of money in technology updates and for implementing most
modern technologies. India government also striving to achieve the vision

Chapter 4
172
‘digital economy’ by promoting the use of digital banking technologies.
Since there are many challenges ahead for the complete transformation of
financial activities into virtual platforms, it is fundamental to analyse the
factors that have influence on the post-adoptive use of TEBSS to ensure
the long-term success of these technologies. Thus, a comprehensive study
incorporating customer perceptions on adoptability of TEBSS, post-use
experiences and continuance intention may provide valuable insights
about the customer behaviour in the use of TEBSS.
4.2 Objectives of the Study
The present study entitled “Attitudinal Precedents in the Adoption
and Usage Continuance of Technology Enabled Banking Self-Services: A
Study among Bank Customers in Kerala” is undertaken with a view to
analysing the continuance intention to use the TEBSS, based on the
customers’ perception on adoptability of TEBSS and their post-adoption
experiences. The following specific objectives are formulated for the
study.
To analyse the purpose and extent of usage of TEBSS by
customers.
To measure the level of customers’ perception on the adoptability
of TEBSS in terms of their awareness, accessibility, ease of use,
and usefulness of TEBSS.
To ascertain the level of customers’ post-use experiences of
TEBSS in terms of their satisfaction, post-use trust, and risk
perception.

Research Methodology
173
To examine the influence of the customers’ perception on the
adoptability of TEBSS on their continuance intention to use the
TEBSS.
To test the mediating role of customers’ post-use experiences
of TEBSS, such as customer satisfaction and customer trust on
the relationship between customers’ perception on adoptability
of TEBSS and their continuance intention to use the TEBSS.
To examine the moderating role of risk perception of
customers on the relationship between their post-use trust and
continuance intention to use the TEBSS.
To develop and empirically test a model establishing the
relationship between customers’ perception on adoptability of
TEBSS on their continuance intention to use the TEBSS with
the mediating role of their post-use experiences and the
moderating effect of their risk perception.
4.3 Research Hypotheses
Based on the conceptual formulation and objectives of the study,
the following hypotheses are formulated.
H1 Customers’ awareness of TEBSS has a significant influence on
their continuance intention to use the TEBSS.
H2 Customers’ perception on accessibility of TEBSS has significant
influence on their continuance intention to use the TEBSS.

Chapter 4
174
H3 Customers’ perception on ease of use of TEBSS has significant
influence on continuance intention to use the TEBSS.
H4 Customers’ perception on usefulness of TEBSS has significant
influence on continuance intention to use the TEBSS.
H5 There exists a significant mediating effect of customers’ satisfaction
on the relationship between customers’ awareness and their
continuance intention to use the TEBSS.
H6 There exists a mediating effect of post-use trust of customers on the
relationship between their awareness and continuance intention to
use the TEBSS.
H7 There exists a mediating effect of customers’ satisfaction on the
relationship between customers’ perception on accessibility of
TEBSS and their continuance intention to use the TEBSS.
H8 There exists a mediating effect of post-use trust of customers on the
relationship between their perception on accessibility and
continuance intention to use the TEBSS.
H9 There exists a mediating effect of customers’ satisfaction on the
relationship between customers’ perception on ease of use of
TEBSS and their continuance intention to use the TEBSS.
H10 There exists a mediating effect of post-use trust of customers on the
relationship between their perception on ease of use of TEBSS and
continuance intention to use the TEBSS.

Research Methodology
175
H11 There exists a mediating effect of customers’ satisfaction on the
relationship between customers’ perception on usefulness of
TEBSS and their continuance intention to use the TEBSS.
H12 There exists a mediating effect of post-use trust of customers on the
relationship between their perception on usefulness of TEBSS and
their continuance intention to use the TEBSS.
H13 The risk perception of customers has a moderating effect on the
relationship between post-use trust and their continuance intention
to use the TEBSS.
4.4 Conceptual and Operational Definitions of Variables
This study consisting of eight variables. The variables under the
study are identified as important from the previous studies. All the
variables in this study are measured empirically and tested statistically.
For the purpose of measuring the variables, constructs are defined
operationally based on the earlier conceptual definitions. Conceptual and
operational definitions of the variables used in this study are given below.
4.4.1 Continuance Intention (Dependent Variable)
Users’ continuance decisions are similar to consumers repurchase
decisions, as both types of decisions (1) follow an initial decision; (2) are
influenced by the usage experience; and (3) can potentially lead to ex-
post reversal of the initial decision (Bhattacherjee, 2001). Continuance
intention is defined in information system research, as the individual’s
intention to continue using an information system (in contrast to initial
acceptance)”. According to him, the eventual success of a new technology

Chapter 4
176
is more dependent on the user’s continued usage rather than the initial
adoption. Hence, continuance intention can be conceptualised as resulting
from three determinants: (1) experiential outcome, (2) forward- looking
expectation, and (3) habit. Experiential outcome is represented using
satisfaction, which is also an emotive construct, while expected utility
embodies the forward-looking expectation (Bhattachergee & Barfar
(2011). The continuance intention is influenced by the usage, satisfaction
and perceived usefulness (Bhatterchjee, 2001).
The construct is operationally defined for the purpose of this study
is based on the theoretical definition given above. The continuance
intention is operationally defined as the intention or decision of the
individual customers, to continue the usage of technology enabled
banking self-services in future. Five- point Likert type adapted scale
(Bhatterchjee, 2001) starting from strongly agree to strongly disagree is
used for measuring the construct. It contains three measurement items like
‘I intend to continue using the technology enabled banking self- services
for performing my banking transactions in future’, ‘I intend to continue
using the technology enabled banking self- services to the extent of
services offered through it’, ‘ I will strongly recommend the technology
enabled banking self-services to others’.
4.4.2 Awareness (Independent Variable)
Awareness is another construct used in the study. Awareness is
defined as the extent to which a target population is conscious of an
innovation and formulates a general perception of what it entails. During
the awareness stage, an organisation or individual is exposed to the

Research Methodology
177
existence of the innovation and is provided information on how the
innovation functions and what its benefits are (Goodhue & Straub, 1991).
The concept awareness was defined in the innovation diffusion theory
(IDT) and was used as the initial stage of an innovation diffusion process
model. Later it was defined by Sathye (1999), as “Knowledge has an
important role on customers adoption of innovation, here knowledge
refers to the awareness of innovation and the benefits associated with,
knowledge associated with how to use the basic technology. Dinev &
Hart (2006) defined it as an antecedent for the attitude formation stage of
innovation diffusion and it was viewed as one of the key components of
consciousness raising and brings about an appreciation of the needs,
impetus, and specificity of issues, events, and processes. Technology
awareness was again defined by Dinev & Hu (2007) as a user’s raised
consciousness of and interest in knowing about technological issues and
strategies to deal with them.
The concept was operationalised for the purpose of this study based
on the conceptual definitions as; the customer knowledge about the
technology enabled banking self-services, cost, benefits and risks
associated with using of such products and services, additions and
updates, and the knowledge about how to use such products and services.
The construct is measured through a modified scale of (Dinev & Hu,
2007), Rogers (1995). The modified scale consists of four items which is
measured in five-point Likert scale. The scale item contains the
statements like ‘I am aware of how to use technology enabled banking
self-services’, ‘I am aware of the risk and how to handle those risk in
using the technology enabled banking self-services’, ‘I am aware of the

Chapter 4
178
benefits of using technology enabled banking self-services’, ‘I am
frequently getting updated with TEBSS technology. Thus, I can extend
my usage of TEBSS and manage if any transaction failure happens’.
4.4.3 Accessibility (Independent Variable)
Accessibility construct is used in the study as independent variable
based on the literature. The earlier studies show that the perceived
features about a technology has an important role in usage of the
technology. Accessibility is the unique feature of the technology enabled
banking self- services. Hence, the variable accessibility has taken for
consideration to analyse its effect on the satisfaction and post-use trust.
Accessibility is conceptually defined as, a multi-dimensional construct
encompassing both physical, terminal access and system usage ability
(Karahanna & Straub, 2003). According to Brown (1990), accessibility can
be measured as a multi-dimensional construct, and the concept is proposed to
have five phases; time, place, acquisition, use and execution. For (Rice &
Shook, 1988), accessibility consists of four aspects: accessibility of computer
equipment, access to information, system reliability and ease in learning the
language of use. However, in electronic banking context, accessibility was
understood as the ease of access to electronic banking applications as well
as accessibility to the transactions that can be carried out in them (Liébana-
Cabanilla & Muñoz-Leiva, 2015).
The construct is operationally defined as; the perception of the
customers about the features of technology enabled banking self-services
being suited to their comfort, need or purpose, in terms of time, place and
use dimensions. Variable was measured using modified six items five-

Research Methodology
179
point Likert scale (Rice & Shook; Zeithmal (2002)) including the items
like ‘technology enabled banking self-services are available at 24 hours of
the day’, ‘technology enabled banking self-services avoids the irritation of
standing on long queues in the bank branches’, ‘banking transactions can
be performed at everywhere’, ‘technology enabled banking self-services
helps to save the time’, ‘technology enabled banking self-services helps to
perform multiple banking purposes’, ‘instant access of the websites of the
banks helps me to do what I want to do’ all items are measured in five point
scale ranging from strongly agree to strongly disagree.
4.4.4 Ease of Use (Independent Variable)
Technology Acceptance Model is most widely discussed in the
technology adoption studies of information system research. Ease of use
is one of the important constructs used in Technology Acceptance Model
(Davis 1989). The construct is defined conceptually as “the degree to
which a person believes that using a particular system would be free from
effort. The construct is operationally defined in this study based on the
same definitions as ‘the degree to which a customer believes that, using
the technology enabled banking self-services will reduce his mental and
physical efforts in carrying out banking transactions’. The construct was
measured through the four items scale developed by Davis (1989). The
scale consists of the items like ‘it is easy for me to learn how to use
technology enabled banking self-services’, ‘it is easy for me to become
skilful at using the technology enabled banking self-services’, ‘I think
interacting with technology enabled banking self-services do not require a
lot of mental efforts’, ‘I don’t make any errors while using the TEBSS’.

Chapter 4
180
4.4.5 Usefulness (Independent Variable)
Usefulness is another important construct used in TAM by Davis
(1989) to explain the adoption intention in information system research.
He defined perceived usefulness as the “degree to which person believes
that, using a particular system would enhance his or her job performance”. In
information system research, the two constructs are well discussed and
accepted. For the purpose of the present study, this construct is
operationalised in the same way that “the degree to which a customer
believes that, using the technology enabled banking self-services would
enhance their efficiency in carrying out banking transactions”. It was
measured through the four items scale developed by Davis 1989. The
scale includes four items five-point Likert type questions, like ‘TEBSS
make me easier to do my banking transactions’, ‘TEBSS enables me to
perform my banking needs more quickly than traditional way of doing
banking’, ‘TEBSS allows me to manage my banking activities efficiently’,
‘TEBSS are more useful to me in conducting banking transactions’.
4.4.6 Customer Satisfaction (Mediating Variable)
Customer satisfaction is a key construct, many researchers have
been examined the satisfaction for long years back in marketing research.
Customer satisfaction is an important construct and one of the most
researched areas as it is an essential pre-condition to the existence of any
business or service. Satisfaction with products and services are explained
in different ways. Satisfaction is a feeling developed from an evaluation
of the user’s experience during the consumption time, or it is the
impression after the evaluation of the use of the product or service

Research Methodology
181
(Cudotte & woodruff, 1987). The satisfaction of customers in service is
explained by the concept of service quality in most of the earlier
researchers. E- service quality concept is another dimension of the
customer satisfaction in online context. Definition of customer satisfaction
in online context is better to explain with the concept of e-service quality.
Hence, for the purpose of this study customer satisfaction is defined in e-
service satisfaction as the study measures the satisfaction of customers in
technology- based banking products.
Service satisfaction is defined as the summary of the cognitive and
affective reactions to a service incident and it is resulting from
experiencing e-service quality (Oliver 2008). E-service quality is defined
as e- fulfilment, accuracy, efficiency, security, easiness, convenience,
cost effectiveness, and compensation (Zeithmal & Parasuram, 2000).
E-fulfilment as scope of services offered, availability of global network,
digitalisation of business information, and variety of services (Zeithaml,
Parasuram, 2000). Customer satisfaction is “Customer’s fulfilment
response, it is a judgment that a product or service features or the product
or service itself, provided (or is providing) a pleasurable level of
consumption related fulfilment, including levels of under or over
fulfilment.
The construct customer satisfaction is operationally defined in this
study based on Bhattacherjee’s (2001) post-adoptive IS use model. For
this study, the satisfaction is operationally defined as to the extent to
which, a customer is pleased or contented with the service of TEBSS after
having direct experiences with it. It measures the experiences with

Chapter 4
182
regards to the scope of services offered, digitalisation of personal
information, speed of transactions, privacy and security, language and
support and overall satisfaction in using TEBSS. The modified scale
(Zeithmal & Parasuram, 2000); (Bhtacherjee, 2001) consists of seven
items Likert type questions (Strongly agree to strongly disagree)
including ‘I am satisfied with the different types of services offered
through TEBSS’, ‘I am satisfied with the digitalisation of personal
information and account information’, ‘I am satisfied with the speed of
services such as clearing, deposits, and transfers and response to
enquiries’, ‘I am satisfied with procedures and formalities for using
TEBSS’, ‘I am satisfied with the security and privacy measures against
password and pin theft, hacking etc.’, ‘I am satisfied with the language
and information support in using TEBSS’, ‘over all I am satisfied with the
technology enabled banking self-services.’
4.4.7 Post-use Trust (Mediating Variable)
Trust is generally defined as the willingness of a party to be
vulnerable to the actions of another party based on the expectation that
the other party will perform a particular action important to the trustor
irrespective of the ability to monitor or control that other party (Mayer &
Davis, 1995). When applying the trust in technology, propensity to trust
suggests that one is willing to depend on a technology across situations
and technologies (Mcknight & Tatcher, 1998). The trust in technology
adoption is generally identified as pre-use trust and post-use trust. Pre-use
trust is based on beliefs and expectations while post-use trust is based on
users’ perceptions derived from their own experiences with the technology

Research Methodology
183
(Hernandez-Ortega, 2011). Trust in technology is reflective, because it is
grounded in the users’ knowing the technology sufficiently well that they
can anticipate how it will respond under different conditions, and it is
positively related to post-adoption use, such that users will be more
willing to experiment with different features, or to use more features, of a
technology because they understand it well enough that it has the
attributes necessary to support extended use behaviour (Mcknight &
Tatcher, 1998); (Gefen, 2000).
The concept is operationally defined as the trust/ post-use belief of
the customers based on their experience on TEBSS with respect to the
different aspects of the performance of TEBSS namely safety and
security, functionality, reliability, and correctness of the functioning of
TEBSS. Customers are directed to record whether TEBSS adequately
fulfilled their expectations with these safety and security features. The
scale ranging from strongly agree to strongly disagree with five items.
This scale was a modified scale of (Gefen, 2000; McKnight et al., 1998).
The measurement items include the statements like ‘ I feel that, TEBSS
had enough safe guards (such as encryption of passwords and PIN) to
make me feel comfortable in using’, ‘I feel that, security system of
TEBSS were suitable against un authorised access of my accounts’, ‘I
feel that technology enabled banking self-services are reliable and
trust worthy’, ‘I feel that, TEBSS had all the functionalities I needed’, ‘I
feel that TEBSS provided error free transactions in each time I am
using it’.
Chapter 4
184
4.4.8 Risk Perception (Moderating Variable)
Customer perceived certain element of risk in every activity. These
perceptions have significant influence on adoption intention. Risk
perception in post-adoption stage might have influenced by the user
experience in the technology. Dowling (1986) defined risk as “the
situation where the decision maker has a priori knowledge of both the
consequences of alternatives and their probabilities of occurrence.”
According to Stikin and Pablo (1992), “Decision makers who have a risk-
seeking propensity will perceive risks to be lower than decisions makers
who have risk-averse propensity risk perception is together with risk.
Risk perception involves beliefs about a product or service’s
potential damages to the customer, acceptance of risk involves the
interpretation of such beliefs. Eckel & Grossman (2002) stated that risk
has several meanings and interpretations that vary for every human being,
but it has a negative effect on several behaviours or intentions. The
various types of perceived risks identified in the existing literature relate
to security, privacy, time, social, financial and performance-oriented
dimensions (Lee, 2009). Individual’s current tendency to take or avoid
risks and considered as an individual trait which can change over time
(Wang, Zhao, & Zhang, 2015). Risk perception involves beliefs about a
product or service’s potential damages to the customer (Marafon &
Basso, 2018).
According to (Roselious, 1971), (Jacoby & Kaplan, 1972), perceived
risk consists of different types of risk namely performance risk, social
risk, time risk, monitory risk, and security risk. In the same line (Featherman

Research Methodology
185
& Pavlou, 2003) identified in technology adoption context risk has seven
facets namely, performance, financial, time, psychological, social, privacy
and overall risk.
Based on the conceptual definitions, the construct was operationally
defined as perceptions of the user about the different types of risks/
uncertainties involved in the use of technology enabled banking self-
services includes financial risk, security and privacy risk, performance
risk, and psychological risk associated with the use of such products and
services. This is measured with the modified scale of (Roselious, 1971)
Jacoby & Kaplan (1972), later modified by (Featherman & Pavlou, 2003)
. Perceptions of users on different dimensions of risk are framed in the
questionnaire in the form that seems to be answered by respondents based
on their experience. Scale consists of six five-point Likert type questions
like ‘I think using TEBSS for performing financial activities is risky’,
‘there is possibility of harm resulting from mis-use of my personal
information while using TEBSS’, ‘there are chances for losing money due
to fraud practices when carrying out financial transactions through
TEBSS’, ‘ there are chances for losing control over privacy of account
information when transactions take place over TEBSS’, ‘there are chances
for failure performance of transactions when using TEBSS’, ‘there is a
scope for feeling of frustration/ psychological discomfort when something
goes wrong in the use of the TEBSS’.
4.5 Research Design
The present study is descriptive and explanatory in nature. The
study describes how the customers’ perceptions on adoptability of TEBSS

Chapter 4
186
influence the post-use experiences and thereby continuance intention in
using TEBSS. Hence it is descriptive in nature. This study is explanatory
in the sense that; it explains how the outcome behaviour continuance
intention is linked by post-use experiences and customers’ perceptions on
adoptability by analysing the relationship through Structural Equation
Modelling. In order to better predict the appropriate fit of the
hypothesised relationship of the factors, these relationships are tested
accordingly.
4.6 Scope of the Study
The scope of the present study is finalised after conducting a pilot
study and it is defined in terms of the population and sources of data
collection.
4.6.1 Pilot Study
A pilot study was conducted in order to determine the scope of the
study. Since there are many types of TEBSS introduced and popularised
by commercial banks, it was very important to know about which types of
TEBSS are using by majority of bank customers to get an idea about the
TEBSS usage by bank customers. From the discussions with experts in
the banking field, it was identified that, the most common services largely
penetrated among customers are internet banking, mobile banking as well
as bank cards like credit and debit cards. So that, it is decided to include
these three types of TEBSS within the ambit of this study. Moreover,
these three types of TEBSS are interchangeably used by customers under
the common facilities.

Research Methodology
187
Since there is no formal list available about the customers who are
using the TEBSS, it was intended to approach the individual bank
customers directly by seeking whether they are using these TEBSS. The
interactions with bank managers and experts in the field was conducted to
analyse the feasibility of this study, and to assess whether there is any
problem with the study design and the instrument developed for data
collection.
4.6.2 Population of the Study
Population of the study consist of bank customers who are using
any of the Technology Enabled Banking Self-Services namely, internet
banking, mobile banking, or bank cards or combinations of any of these
services in the state of Kerala. It is further clarified here that the elements
of the population cover the customers using at least two of these services.
Customers who are using only ATM cards are excluded from the defined
population of the study.
4.6.3 Sources of Data
Data were collected for present study mainly from primary source.
The primary data required for the study were collected from customers of
banks using TEBSS on the variables in the conceptual model formulated
for the study. The information regarding technology developments in
banking sector are gathered from secondary sources like journals and
magazines, periodic reports and books relating with banking sector and
technology adoption.

Chapter 4
188
4.7 Sampling Design
Population of the study is finite but the exact number of customers
who are using the technology enabled banking self-services were not
available from the banks or any other concerned authorities as well as
they were not willing to disclose the details of their customers. This
reason made it impossible to go for the sampling techniques based on
probability. As the sample frame cannot be prepared due to non-
availability of source list of population, non-probability sampling method,
judgmental sampling, was applied to identify the sample respondents. The
bank customers, who are using any of the two technology enabled
banking self-services, were considered and included in the sample.
When the population is large, but exact size of population is
unknown, the formula developed by Coheran (1963) is largely used in
social science research for determining sample size. It was based on the
confidence level, sampling error, and variability of proportion of sample.
If the confidence interval is 95 per cent, and margin of error estimated is
5 per cent, the required sample size can be calculated as given below:
N= Z 2 × P (1- P)/ (Margin of error)2
Z score for 95% confidence level = 1.96
Hence sample size = (1.96)2 × 0.5(1- 0.5)/ (0.05)2
Sample size = 3.8416 × 0.25/.0025 = 384
While analysing the required sample size for the population based
on the formula, 384 sample is required for this study. According to Hair
et al. (2010) if the number of constructs is more than 7, there should be a

Research Methodology
189
minimum sample of 500. But in the present study, eight variables are
considered for analysis and survey method was used to collect data from
respondents. Hence, it is decided to cover sufficiently large sample for the
study and fixed 900 respondents as sample size.
From the literature, it was evident that, geographical location of the
respondents may have impact on adoption of the technology-based
banking products and services. Therefore, while identifying the sample
respondents, it was attempted to include the equal proportion of three
major locations of people, as rural, urban and semi-urban.
4.8 Data Collection Method
Primary data were collected from the bank customers who are using
TEBSS through survey method. In this study, both offline and online
modes were used for collecting data. In offline method of survey,
questionnaire was distributed to respondents directly. The customers are
identified by asking the criterion question that whether they are using
any of the TEBSS. If their answer to this question is yes, then the
questionnaire is distributed to them directly. Study covered all districts in
Kerala. For avoiding the sampling bias, study included bank customers
from all spheres of life without pointing their job, status, education and
age. For the collection of data, focus was given to include the respondents
from universities, colleges, government offices, private organisations,
banks, shopping malls, and all possible centres where customers are using
the TEBSS. In online method, questionnaire was distributed through
Google form. The link of the questionnaire was shared with nears and dears
through e-mail, different online groups such as WhatsApp, Facebook and

Chapter 4
190
LinkedIn with a request for circulating the same to bank customers in Kerala
who are using TEBSS. Details of data collection is given in the following
table.
Table 4.1: Data Collection Details
No. of Questionnaire Distributed
No. of Responses
No. of Usable Responses
Response Rate
Offline 845 664 600 78% Online 400 322 300 80% Total 1245 986 900 79%
Out of 1245 questionnaires distributed, 986 questionnaires were
collected back. After the initial screening, 48 incomplete questionnaires
were rejected. The data set was entered in SPSS for further processing.
The data set was tested for outliers through bootstrapping which showed
that there were 38 responses that cannot be used for the study. Thus, the
usable responses finally available for analysis came to 900 responses.
Finally, the sample size for the study is fixed as 900.
4.9 Instrument Used for Data Collection
A specifically designed questionnaire was used as the instrument for
data collection. The questionnaire consists of standardised and modified
scales for collecting responses for variables. In the questionnaire, five points
Likert type questions were used for each variable measurement and the
multiple option questions were used for gathering other section of
information. The validity and reliability of questionnaire were confirmed
through expert review and pre-testing of the instrument.

Research Methodology
191
Expert review was conducted in order to ensure the validity of the
instrument. It was done with the experts in the field of banking as well as
with the academicians. Based on their advice some of the questionnaire items
were restructured and modified. So as to check the problems and limitations
of the instrument, pre-test is conducted among small sample of 100 bank
customers of Ernakulam and Kozhikode districts. The collected data was
analysed using SPSS 23 to check the reliability of scales. Cronbach’s alpha
was used to test the reliability of variables under the study. It was found that
all variables in the questionnaire have good internal consistency.
Some of the items in the questionnaire were re-structured after the
pre-testing due to the report of respondents that they felt some difficulties
in understanding some terms in the questionnaire. Such items are simplified
with suitable words and sentences.
Table 4.2: Instrument Used for Data Collection
Variables Reference Number of items
Continuance Intention Bhttacherjee (2001) 3 Post-use Trust Gifen (2000), Mcknight et.al (2002),
modified by Wakefield et.al (2004) 5
Satisfaction Zeithmal Parasuram & Malhotra et.al (2000), modified by Bhattcherjee (2001)
7
Accessibility Zeithmal (2002) Modified by Behjati (2012)
6
Ease of Use Davis (1989) 4 Usefulness Davis (1989) 4 Awareness Rogers (1995)
Modified by Dinev & Quing (2007) 4
Risk Perception (Roselious, 1971) Jacoby J and Kaplan L.B (1972), modified by (Featherman & Pavlou, 2003)
6

Chapter 4
192
4.10 Statistical Techniques Used for Analysis
Statistical package for data analysis SPSS 23 was used for basic
data editing, coding and for basic analysis. The percentage analysis was
used to spot the profiles of respondents. Descriptive statistical techniques
include mean and standard deviation were applied to describe the
variables in the study. Additionally, cross tabulation of demographic
variables like age, education, occupation and income, years of using TEBSS,
type of TEBSS use and purpose of using TEBSS were carried out. ANOVA
test is used to analyse the association between selected demographic factors
and adoptability of TEBSS, post-use experiences and continuance intention.
Exploratory Factor Analysis (EFA) was carried out in order to identify the
factor structure of the construct which is measured with modified scales. The
identified factor structure is verified and confirmed using the Confirmatory
Factor Analysis (CFA). The basic model linking customer awareness, ease of
use, usefulness and accessibility of TEBSS, post-use trust, satisfaction, risk
perception and continuance intention was tested by way of regression
analysis. The integrated model was tested and validated in Structural
Equation Modelling (SEM) using AMOS version 23. Moderation and
mediation analysis were performed in the software PROCESS MACRO
version 3 developed by Hays (2013).
4.11 Measurement of Testing of Variables
4.11.1 Test of Normality of Data
Normality assumption is conventional assumption in the estimation
process. In order to check whether the random sample came from a
normal distribution or not, skewness and kurtosis measures are taken for

Research Methodology
193
consideration. The descriptive analysis has been done on all the variables
under study and kurtosis values are found to have the values less than
three, which indicates that data distribution is normal. The values of
skewness and kurtosis are given in the following table.
Table 4.3: Test of Normality
Variables Values
Skewness Kurtosis Satisfaction -1.086 1.441
Risk Perception -0.072 -.479
Continuance Intention -0.860 1.006
Awareness -0.933 0.781
Accessibility -1.294 1.716
Ease of Use -0.797 0.201
Usefulness -1.390 2.351
Post-use Trust 0.493 0.377
Source: Result of Primary Data Analysis Using SPSS
It was suggested by (Cline, 2011; citing Curran et al., 1997) that;
kurtosis value ranging from 8-20 may be taken as indicating more
extreme level of kurtosis and the skewness value greater than three (in
absolute value) indicating the more extreme level of skewness. Byrne
(citing Decarlo, 1997) suggested that since the kurtosis impacts tests the
covariances and variances it is more important than skewness (which
impacts on means) in Structural Equation Modelling.
Chapter 4
194
4.11.2 Test for Common Method Variance
Common method bias is one of the important sources of measurement
error in constructs used in behavioural research. Common method biases
arise from having a common ratter, a common measurement context, a
common item context, or from the characteristics of the items themselves
(Podsakoff, MacKenzie, & Lee, 2003). For assessing the common method
bias, Harman’s one factor test is generally used. In this test, all the
measurement items of the constructs are grouped to perform an
exploratory factor (EFA) and get it extracted as a single factor. The
following table 4.4 shows the Harman’s one factor test result for checking
the common method bias in the study.
Table 4.4: Harman’s Common Method Variance Bias Test
Total Variance Explained Component Extraction Sums of Squared Loadings
Total % of Variance Cumulative % 1 12.670 32.487 32.487
Source: Result of Primary Data Analysis Using SPSS
It is evident from the Table 4.4 that; the single component
contributes 32.5% of variance and which is below the cut of rate of
50 per cent. Hence, it can be concluded that, there is no issue of common
method bias in the present study.
4.12 Reliability and Exploratory Factor Analysis of Variables
Reliability analysis is performed to ensure the internal consistency
of the measurement items to the latent construct. It was performed on

Research Methodology
195
each variable by using Cronbach’s Alpha in SPSS. In addition to the
check for reliability, the factor structure of the constructs which are
measured in the modified scale are ascertained using Exploratory Factor
Analysis. The following section deals with the reliability analysis and
EFA of the constructs in the study.
4.12.1 Awareness (Independent Variable)
Awareness is the knowledge of the customers about the use,
benefits and disadvantage of using a product or services. When the
awareness conceptualises in a technological context, it includes the
awareness about the technology related factors, how to use it, when to use
it, as well as how to control and overcome the difficulties, knowledge
about updates and improvements etc. It was measured in four items
modified scale in the study. Reliability test results are given in the
following section.
Awareness is measured by using a modified scale and the modified
scale consists of four items five- point Likert type questions in which
respondents are requested to record their level of agreeableness ranging
from strongly agree to strongly disagree. The following table shows the
result of reliability analysis.
Table 4.5: Reliability Analysis- Awareness
Scale Cronbach’s Alpha Number of Items Awareness 0.893 4
Source: Result of Primary Data Analysis Using SPSS

Chapter 4
196
The result of reliability analysis indicates that the construct
awareness has good internal consistency, with the Cronbach’s Alpha
value of 0.893. The value of Cronbach’s Alpha is higher than the
acceptable limit, which indicates that good internal consistency of the
items to the measurement construct.
Exploratory Factor Analysis is performed for the construct awareness
as the construct is measured with a modified scale. KMO test is applied to
check the sampling adequacy for the exploratory factor analysis, it is
reasonable if the KMO value is above 0.75.
Table 4.6: KMO and Bartlett’s Test of Sphericity –Awareness
Awareness Kaiser-Meyer-Olkin Measure of Sampling Adequacy 0.793
Bartlett's Test of Sphericity Approx. Chi-Square 1395..068
Df. 6
Sig. 0.00
Source: Result of Primary Data Analysis Using SPSS
KMO test results shows that, sampling adequacy is sufficient to
move ahead with exploratory factor analysis. Bartlett’s test of sphericity
is 0.000, which is significant at (p<0.01). Exploratory factor analysis is
performed based on principal component analysis and the varimax
rotation resulted in the extraction of one component with Eigen value
greater than 1. The factor loadings 4 or higher were taken as significant.
All the factor loadings were above 4 (Appendix.2.1) and the proportion of
the variance explained by components was 65 per cent of awareness.

Research Methodology
197
4.12.2 Accessibility (Independent Variable)
Accessibility is the next independent variable under the study,
which is identified as influencing the post-adoptive use of TEBSS by
customers. Accessibility is measured in this study using 6 items
modified five-point Likert scale. Reliability analysis as well as
exploratory factor analysis are performed for the construct. The results
are shown below.
Accessibility construct is measured with six item scale. Reliability
of the construct accessibility is ascertained through the method of
Cronbach’s Alpha. The following table shows the test of reliability.
Table 4.7: Reliability Analysis- Accessibility
Scale Cronbach’s Alpha Number of Items Accessibility 0.909 6
Source: Result of Primary Data Analysis Using SPSS
The value of Cronbach’s Alpha is 0.909, which indicates that the
measurement has good internal consistency. The value of Cronbach’s
Alpha is much higher than the criterion value of 0.5.
Accessibility was measured using a modified scale. Hence the
exploratory factor analysis is performed in order to identify the factor
structure of the construct. The Following table represents the factor
analysis result of the variable accessibility.

Chapter 4
198
Table 4.8: KMO and Bartlett’s Test of Sphericity –Accessibility
Accessibility Kaiser-Meyer-Olkin Measure of Sampling Adequacy. 0.906 Bartlett's Test of Sphericity
Approx. Chi-Square 3399.862 Df. 15 Sig. 0.00
Source: Result of Primary Data Analysis Using SPSS
The result of KMO test of sampling adequacy is satisfactory and the
Bartlett’s test of sphericity is significant at 0.01. The exploratory factor
analysis was performed with principal component analysis with varimax
rotation. The result extracted as one component with Eigen value greater
than 1. The total variance explained by the items to the construct
accessibility was 69 per cent (Appendix 2.2).
4.12.3 Ease of Use (Independent Variable)
The same construct of the original TAM model perceived ease of
use is taken for the present study. The measurement of scale was adapted
from the TAM model with context specific wordings as modification.
Since the scale is an adapted scale, the exploratory factor analysis need
not be carried out. Thus, the reliability of the scale is tested using
Cronbach’s Alpha. The result of Cronbach’s Alpha is presented in the
table given below.
Table 4.9: Reliability Analysis - Ease of Use Scale Cronbach’s Alpha Number of Items Ease of Use 0.824 4
Source: Result of Primary Data Analysis Using SPSS

Research Methodology
199
The Cronbach’s Alpha value shows 0.824, which is satisfactory in
the confidence level of 95 per cent, indicating the better reliability of the
construct.
4.12.4 Usefulness (Independent Variable)
Usefulness is also adapted from the prominent model of technology
adoption TAM. The perception of the customers on technology/
innovation that the usage of the system would improve his or her job
performance is termed as usefulness. The scale consists of four items
five- point Likert type questions and the modifications of original scale is
slightly done with the replacing of context specific words. So, the
exploratory factor analysis did not perform. The reliability analysis of the
scale is tested using Cronbach’s Alpha.
Table 4.10: Reliability Analysis - Usefulness
Scale Cronbach’s Alpha Number of Items Usefulness 0.893 4
Source: Result of Primary Data Analysis Using SPSS
The result of reliability analysis indicates that the construct has
good internal consistency between its items and there are no reliability
issues with the construct. The value of Cronbach’s Alpha is 0.893, which
is above the criterion value of 0.5.
4.12.5 Continuance Intention (Dependent Variable)
Continuance intention is the outcome variable of this study.
Continuance intention in the study is defined as the intention of the

Chapter 4
200
customers to continue using the TEBSS in future, and it is measured in an
adapted scale with three items five-point Likert type questions. Reliability
of the scale was tested using the Cronbach Alpha. The value of Cronbach
Alpha of the variable is given in the following Table.
Table 4.11: Reliability Analysis - Continuance Intention
Name of the Variable Cronbach’s Alpha Number of Items Continuance Intention 0.797 3
Source: Result of Primary Data Analysis Using SPSS
It is evidenced from the table that, the value of Cronbach’s Alpha is
0.797, which is greater than the criterion value of 0.5. Thus, the scale is
considered as reliable. Internal consistency of the scale is assured through
Cronbach’s Alpha.
4.12.6 Satisfaction (Mediating Variable)
Satisfaction is defined in the study as an overall evaluation of the
TEBSS, in terms of their experience after the use of the same. Seven
items modified scale was used to measure the satisfaction. Hence the
exploratory factor analysis is also performed for the construct. Reliability
of the construct is checked with Cronbach’s Alpha. The table below
shows the result of reliability analysis.
Table 4.12: Reliability Analysis - Satisfaction
Scale Cronbach’s Alpha Number of Items Satisfaction 0.886 7
Source: Result of Primary Data Analysis Using SPSS

Research Methodology
201
The result of reliability analysis shows that the scale is reliable.
Since the value of Cronbach’s Alpha is 0.886 which is above the criterion
value of 0.5, the scale is treated as reliable and internal consistency
between items is ensured.
Satisfaction is measured in a modified scale, as the scale is modified
it was indeed to check whether the items of the scale contributing to one
factor or not. Hence the exploratory factor analysis is performed. Value
of KMO measure of sampling adequacy shows greater than criterion
value, which indicates that factor analysis can be taken forward, and the
Bartlett’s test of sphericity shows significant.
Table 4.13: KMO and Bartlett’s Test of Sphericity – Satisfaction
Satisfaction Kaiser-Meyer-Olkin Measure of Sampling Adequacy. 0.914 Bartlett's Test of Sphericity
Approx. Chi-Square 2944.131 Df. 21 Sig. 0.00
Source: Result of Primary Data Analysis Using SPSS
Exploratory factor analysis is done with principal component
analysis using varimax rotation and extracted as one component with
Eigen value greater than 1, also the identified factors explaining 59 per cent
of total variance in predicting satisfaction (Appendix 2.3).
4.12.7 Post- Use Trust (Mediating Variable)
The variable, post-use trust is measured in a modified scale
consisting of 5 items. Internal consistency of the scale is ensured through

Chapter 4
202
reliability analysis using Cronbach’s Alpha. Since the scale is modified
scale, the exploratory factor analysis is also performed. The results of
reliability analysis and exploratory factor analysis are given in the
following.
Table 4.14: Reliability Analysis - Post-Use Trust
Name of variable Cronbach’s Alpha Number of Items Trust 0.834 5
Source: Result of Primary Data Analysis Using SPSS
The reliability analysis result is showing the Cronbach’s Alpha
value 0.834, the value is above criterion value of 0.5, the values above
0.75 is indicating the better internal consistency with the items. The scale
is considered as reliable and consistent.
For performing the exploratory factor analysis, Kaiser-Meyer-Olkin
Measure of Sampling Adequacy and Bartlett’s Test of Sphericity were
analysed for trust. The result shows that the KMO test supports the
sampling adequacy for carrying out the factor analysis and the Bartlett’s
test of Sphericity is significant at 0.01 p<0.01 indicating the inter
correlations for factor analysis.
Table 4.15: KMO and Bartlett’s Test of Sphericity – Post-Use Trust
Trust Kaiser-Meyer-Olkin Measure of Sampling Adequacy. 0.827 Bartlett's Test of Sphericity
Approx. Chi-Square 163.479 Df. 10 Sig. 0.000
Source: Result of Primary Data Analysis Using SPSS
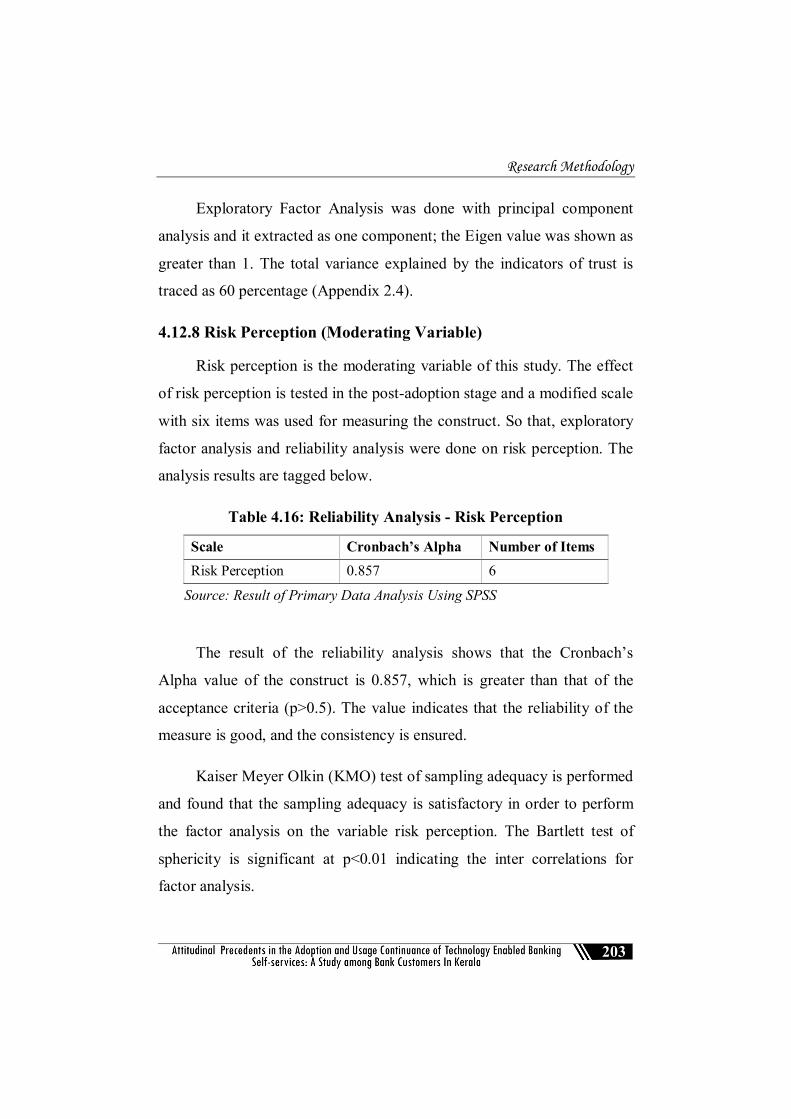
Research Methodology
203
Exploratory Factor Analysis was done with principal component
analysis and it extracted as one component; the Eigen value was shown as
greater than 1. The total variance explained by the indicators of trust is
traced as 60 percentage (Appendix 2.4).
4.12.8 Risk Perception (Moderating Variable)
Risk perception is the moderating variable of this study. The effect
of risk perception is tested in the post-adoption stage and a modified scale
with six items was used for measuring the construct. So that, exploratory
factor analysis and reliability analysis were done on risk perception. The
analysis results are tagged below.
Table 4.16: Reliability Analysis - Risk Perception
Scale Cronbach’s Alpha Number of Items Risk Perception 0.857 6
Source: Result of Primary Data Analysis Using SPSS
The result of the reliability analysis shows that the Cronbach’s
Alpha value of the construct is 0.857, which is greater than that of the
acceptance criteria (p>0.5). The value indicates that the reliability of the
measure is good, and the consistency is ensured.
Kaiser Meyer Olkin (KMO) test of sampling adequacy is performed
and found that the sampling adequacy is satisfactory in order to perform
the factor analysis on the variable risk perception. The Bartlett test of
sphericity is significant at p<0.01 indicating the inter correlations for
factor analysis.

Chapter 4
204
Table 4.17: KMO and Bartlett’s Test of Sphericity –Risk Perception Risk Perception Kaiser-Meyer-Olkin Measure of Sampling Adequacy. 0.837
Bartlett's Test of Sphericity Approx. Chi-Square 2362.058
Df. 15
Sig. 0.00
Source: Result of Primary Data Analysis Using SPSS
The result of exploratory factor analysis on risk perception through
principal component analysis was extracted as one component. The Eigen
value shows greater than 1, which results in 58.6 per cent of total variance
of the risk perception scale (Appendix 2.5).
4.13 Limitations of the Study
The commercial banks and other financial institutions are providing
number of technology-enabled banking services as well as new types of
fin-tech services in the present scenario. However, the present study has
taken the three commonly using technology enabled banking self-services
namely internet banking, mobile banking and bank cards. So, the result of
the study is possible to generalise only to these types of TEBSS.
Moreover, the general behaviour of customers who are using the three
types or combination of these TEBSS was studied but the product wise
comparison of the behaviour was not done.
Population of the study included the customers of all commercial
banks in the state. The commercial banks specially, public sector banks
and private sector banks are differentiating their technology enabled

Research Methodology
205
banking services in order to make them more efficient and to attract the
customers. Hence, analysis of bank wise difference in the usage and
continuance intention of customers in using TEBSS would provide further
explanation about the customer behaviour. But the bank wise difference
was not checked in the post-adoptive use and continuance intention of
customers of TEBSS in this study.
4.14 Chapter Summary
This chapter dealt with the methodology adopted for conducting
this study. Research problem, objectives, hypotheses, variables and the
scope of the study are included in this chapter. Research design, sampling
design, instrument used for data collection as well as method of data
collection were also discussed. At the end of this chapter, limitation of the
study is mentioned.
References
[1] Bhatterchjee (2001). Understanding Information System Continuance- An Expectation Confirmation Model. MIS Quarterly, 351-370.
[2] Brown (1990). Convenience in Service Marketing. Journal of Service Marketing, 53-59.
[3] Demirdogen & Yilmaz (2010). Customer Risk Perceptıons of Internet Bankıng – A Study In Turkey. The Journal of Applied Business Research, 57-68.
[4] Davis (1989). Perceived Usefulness, Perceived Ease of Use, and User Acceptance of Information Technology. MIS Quarterly, 319-340.
[5] Dinev & Hu (2007). The Centrality of Awareness in the Formation of User Behavioral Intention Toward Preventive Technologies in the Context of Voluntary Use. Journal of Association of Information Systems, 387-408.
Chapter 4
206
[6] Dowling (1986). Perceived Risk: The Concept and its Measurement. Psychology and Marketing, 193-210.
[7] Eckel, & Grossman. (2002). Sex Differences and Statistical Stereotyping in Attitudes toward Financial Risk. Evolution and Human Behavior, 281-295.
[8] Featherman & Pavlou (2003). Predicting e-services Adoption: A Perceived Risk Facets Perspective. Int. J. Human-Computer Studies, 451-474.
[9] Gefen (2000). E-commerce: The Role of Familiarity and Trust. Omega, 725-737.
[10] Goodhue, D., & Straub, D. (1991). Security Concerns of System Users: A study of Perceptions of the Adequacy of Security. Information and Management, 13-27.
[11] Hernandez-Ortega. (2011). The Role of Post-use Trust in the Acceptance of a Technology: Drivers and Consequences. Technovation, 523-538.
[12] Jacoby, & Kaplan. (1972). The Components of Percieved Risk. Annual Conference of the Association of Consumer Research, Chicago, 382-393.
[13] Karahanna, & Straub. (2003). Trust and TAM in Online Shopping; An Integrated Model. MIS Quarterly, 27-34.
[14] Lee & Chi (2009). Factors Influencing the Adoption of Internet Banking: An Integration of TAM and TPB with Perceived Risk and Perceived Benefit. Electronic Commerce Research and Applications, 130-141.
[15] Liébana-Cabanilla & Muñoz-Leiva (2015). Influence of Age in the Adoption of New Mobile Payment Systems. Review of Business Management, 1390-1407.
[16] Marafon & Basso (2018). Perceived Risk and Intention to use Internet Banking: The Effects of Self-confidence and Risk Acceptance. International Journal of Bank Marketing, 277-289.
[17] Mayer & Davis (1995). An Integrative Model of Organisational Trust. Academy of Management Review, 709-734.
[18] Mcknight, & Tatcher. (1998). Trust in a Specific Technology: An Investigation of its Components and Measures. Trust in technology, its components and measures.
[19] Oliver (2008). A Cognitive Model of the Antecedents and Consequences of Satisfaction Decisions. Journal of Marketing Research, 460-469.

Research Methodology
207
[20] Podsakoff, MacKenzie & Lee (2003). Common Method Biases in Behavioral Research: A Critical Review of the Literature and Recommended Remedies. Journal of Applied Psychology, 879-903.
[21] Rice & Shook (1988). Access to Usage of and Outcome from an Electronic Meassaging System. ACM Transactions on Information Systems, 255-276.
[22] Rogers (1962). Diffusion of Innovations. Newyork: Free Press of Glencoe.
[23] Roselious. (1971). Consumer Ranking of Risk Reduction Methods. Journal of Marketing, 56-61.
[24] Stikin, & Pablo. (1992). Reconceptualizing the Determinants of Risk Behavior. The Academy of Management Review, 9-38.
[25] Thong (2006). The Effects of Post Adoption Beliefs on Expectation Confirmation Model for Information Technology Continuance. International Journal of Human Computer Studies, 799-810.
[26] Wang, Zhao & Zhang (2015). Conceptual Frame Work for Risk Propensity, Risk Perception, and Risk Behaviour of Construction Project Managers. Procs 31st Annual ARCOM Conference Lincoln, UK: Association of Researchers in Construction Management, 165-174.
[27] Zeithaml & Parasuraman (2002). Service Quality Delivery Through Web Sites: A Critical Review of Extant Knowledge. Journal of the Academy of Marketing Science, 362-375.
…..…..


Analysis of Purpose and Extent of Usage of TEBSS by Customers
209
This chapter begins with demographic profile of respondents. The
first objective of the study was the analysis of purpose and extent of
usage of TEBSS by customers. The detailed analysis of TEBSS usage
and usage analysis based on different demographic characteristics are
also included in this chapter.
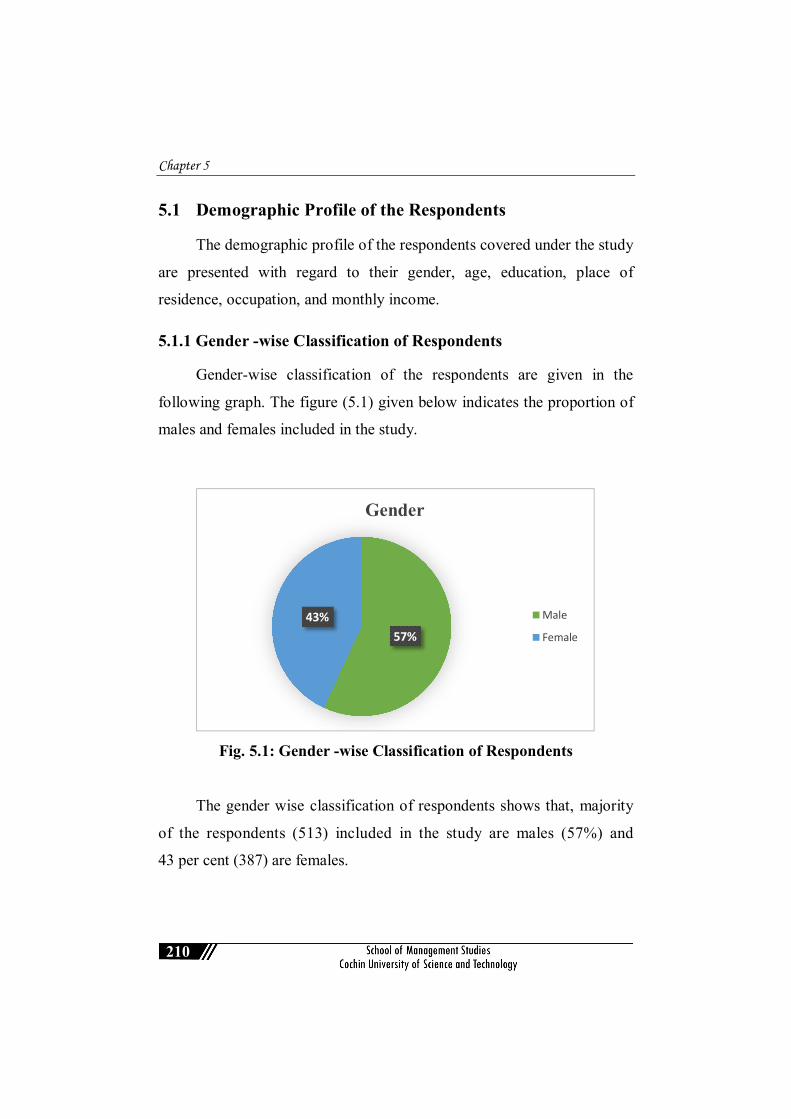
Chapter 5
210
5.1 Demographic Profile of the Respondents
The demographic profile of the respondents covered under the study
are presented with regard to their gender, age, education, place of
residence, occupation, and monthly income.
5.1.1 Gender -wise Classification of Respondents
Gender-wise classification of the respondents are given in the
following graph. The figure (5.1) given below indicates the proportion of
males and females included in the study.
Fig. 5.1: Gender -wise Classification of Respondents
The gender wise classification of respondents shows that, majority
of the respondents (513) included in the study are males (57%) and
43 per cent (387) are females.
57%43%
Gender
Male
Female

Analysis of Purpose and Extent of Usage of TEBSS by Customers
211
5.1.2 Age-wise Classification of Respondents
Age of respondents was classified into five categories. The first
category was below 25 age group, following 26-30, 31-40, 41-50 and
above 50. Following figure (5.2) shows the age-wise classification of
respondents in the study.
Fig. 5.2: Age wise Classification of Respondents
The age wise classification of respondents shows that, majority of
respondents are at the age group of 26-30, followed by 31-40, and below
25. Frequency of age group of respondents indicates that, nearly 4 per
cent of respondents included in the category of age group of 26-30,
following 31 per cent of respondents under 31- 40 age group.
Approximately half of the total respondents are included in this age
category, and nearly 5 per cent of respondents are included in the age
group above 40.
181 (20%)
386 (43%)
282 (31%)
39 (4%)12 (1%)
0
50
100
150
200
250
300
350
400
450
Below 25 26-30 31-40 41-50 Above 50
Age

Chapter 5
212
5.1.3 Location-wise Classification of Respondents
Place of residence / location of the respondent was classified into
three regions namely urban, semi-urban and rural. Following figure (5.3)
shows the spread of respondents across these three sectors.
Fig. 5.3: Location wise Classification of Respondents
Percentage analysis of respondents shows that majority (37 per cent)
of the respondents are residing in semi-urban area, 33 per cent of
respondents are from urban area and 30 per cent of respondents are from
rural area. It further indicates that, relatively equal proportion of respondents
are selected for the study in each area.
33%
37%
30%
Place of Residence of Respondents
UrbanSemi-UrbanRural

Analysis of Purpose and Extent of Usage of TEBSS by Customers
213
5.1.4 Education-wise Classification of Respondents
Educational qualification of respondents was identified for the
study. It is evident from the literature on technology adoption that,
education is an important factor which influences the adoption and use of
new technology. In the current study, education qualifications are divided
into six categories namely up to tenth, plus two, graduation, post-
graduation, professional and others.
Fig. 5.4: Education-wise Classification of Respondents
It is evident that, majority of the respondents are having graduation as
their highest educational qualification. Nearly 46 per cent of the respondents
belong to this category. Customers having post-graduation as their
educational qualification occupied 29.3 per cent. Among the respondents
13 per cent come under the category of professional education, 5.9 per cent
belongs to the plus two and 3.9 per cent are having other qualifications like
diploma and other specialised courses.
Upto Xth Plus Two/PDC Graduation Post
graduation Professional Others
No. ofRespondents 17 53 414 264 117 35
050
100150200250300350400450
No.
of r
espo
nden
ts
3.9%
13%
29.3 %
46%
5.9 %1.9%

Chapter 5
214
5.1.5 Occupation-wise Classification of Respondents
The respondents in this study are classified into seven categories of
occupation including government employee, private employee, agriculture,
business, professional/self-employed, students and others. Following figure
shows the information regarding the occupation wise classification of
respondents.
Fig. 5.5: Occupation-wise Classification of Respondents
The Figure (5.5) shows that, 24 per cent of the respondents are private
employees, 22 per cent respondents are students, 13 per cent are working in
agricultural sector, 14 per cent are government employees, 10 per cent
respondents are professionals/ self- employed, 8 per cent of respondents are
doing business and remaining 7 per cent respondents are doing other
Govt.Employee
Pvt. Employee
Agriculture
BusinessProfessional /Self Employed
Students
Others14%
24%
7%
22%
10%8%13%

Analysis of Purpose and Extent of Usage of TEBSS by Customers
215
categories of jobs including daily wages, people working in un-organised
sectors, retirees, and people doing skilled or vocational type jobs etc.
5.1.6 Monthly Income-wise Classification of Respondents
Economic status of the respondents differs based on their income.
Therefore, it is one among the important demographic factors to be
considered for analysis of usage of Technology Enabled Banking Services. Income of the respondents was grouped into six categories. The following
figure (5.6) shows the income wise classification of respondents.
Fig. 5.6: Monthly Income wise Classification of Respondents
It is evidenced that 39 per cent of the respondents belonging to the
income category below ` 20000, 22 per cent respondents are under
` 20001-30000 income group, 17 per cent of the respondents belongs to
39%
22%
17%
9%
4% 9%
Monthly Income wise Classification of Respondents
Up to 20000
20001-30000
30001-40000
40001-50000
50001-60000
Above 60000

Chapter 5
216
` 30001-40000 category of monthly income group, 9 per cent respondents
are under ` 40001-50000 and above ` 60000 monthly income group, and
finally 4 per cent of respondents included in ` 50000-60000 monthly
income group category.
5.1.7 Analysis of Respondents’ Age and Occupation
Respondents’ age and occupation are analysed using cross tabulation
in SPSS. In order to identify the frequency of respondents in different
category of age groups and their occupation, cross tabulation analysis is
performed. It also reveals which age categories of respondents are included
in each type of occupation. The table 5.1 represents the results of the
analysis.
Table 5.1 Analysis of Respondents’ Age and Occupation
Age
of
Res
pond
ents
Occupation of Respondents
Gov
t.
Empl
oyee
Pvt.
Empl
oyee
Agr
icul
ture
Busin
ess
Prof
essio
nal/
Self-
Em
ploy
ed
Stud
ents
Oth
ers
Tota
l
Below 25 5 (3%)
32 (18%)
25 (14%)
10 (6%)
13 (7%)
75 (41%)
21 (11%) 181
26-30 39 (10%)
115 (30%)
43 (11%)
24 (6%)
47 (12%)
87 (23%)
31 (8%) 386
31-40 57 (20%)
54 (19%)
53 (19%)
33 (12%)
28 (10%)
39 (14%)
18 (6%) 282
41-50 18 (46%)
8 (20.5%)
4 (10%)
6 (15%)
1 (2.5)
1 (2.5)
1 (2.5) 39
Above 50 3 (25%)
3 (25%)
3 (25%)
1 (8.3%)
2 (16,6%) 0 0 12
Total 122 212 128 74 91 86 187 900 Source: Result of Primary Data Analysis Using SPSS

Analysis of Purpose and Extent of Usage of TEBSS by Customers
217
The cross-tabulation analysis result reveals that, majority of
respondents in this study are belongs to the age group of 26-30
and most of respondents in this age category are private employees
(30 per cent), following to students (23 per cent) and agriculture
(11 per cent). The 20 per cent of users of TEBSS in 31-40 age groups are
government employees whereas the age group below 25 largely consists of
students.
5.2 Analysis of Purpose and Extent of Usage of Technology Enabled Banking Self-Services (TEBSS) The first objective of this study was to analyse the purpose and
extent of usage of TEBSS by customers. Acceptance/adoption and usage
are different terms in technology usage context. Earlier technology
adoption studies used the word ‘adoption’ in the real sense of usage. Later
the technology acceptance studies itself cleared it as an intention-based
construct. Intention leads to actual usage, but not in all the cases the
intention predicts the usage. So, there were arguments in defining the
constructs usage and adoption. Usage has been largely measured with the
frequency and duration of the usage of a specific technology. Later,
studies considered the two constructs as different. In the technology/
innovation acceptance studies, user’s exposure to technology can be
evaluated according to duration of use, intensity of use, diversity of use
(Hurtienne & Horn 2013; Langdon & Lewis, 2007) and adoption of
advanced functions (Fisk & Rogers, 2009), (Li & Luximon, 2018). Users
may initially attract to the features of an innovation, which enable them to
improve their task performance. After their initial use, they continue the
Chapter 5
218
use once they feel that the efficiency is enhanced in the performance.
Hence, for the purpose of analysing the post- use behaviour, it is
important to understand the usage behaviour of customers who already
adopted the Technology Enabled Banking Self-Services. Therefore, in the
present study, the usage of TEBSS is analysed as it is essential for the
analysis of post-adoption behaviour. Simple descriptive analysis is
applied to achieve this objective. That includes ascertainment of the
combination of TEBSS, analysis of purpose of using TEBSS, duration
and period of using the specified services through TEBSS as well as
intensity of the usage.
Before moving to the advanced usage analysis, respondents were
asked to disclose some basic information regarding their banking
activities like, the name of their most frequent bank with which they are
performing maximum number of transactions and type of account they
are maintaining with the bank etc.
5.2.1 Bank and Type of Account Using by Respondents
Respondents are asked to name their bank with which they are
maintaining their accounts. The following table shows the list of banks
with which the respondents are performing banking transactions.

Analysis of Purpose and Extent of Usage of TEBSS by Customers
219
Table 5.2: Bank wise Classification of Respondents
Name of Bank Frequency Percentage SBI 368 41
ICICI 182 20
HDFC 75 8
FEDERAL 62 7
CANARA 61 7
AXIS 30 3
PNB 16 2
SIB 43 5
INDUS 4 0.4
SYNDICATE 24 3
UBI 15 1.6
IOB 8 0.8
CSB 5 0.5
CORP 4 0.4
URBAN 3 0.3
Total 900 100
Source: Result of Primary Data Analysis Using SPSS
(SBI- State Bank of India, ICICI- Industrial Credit and Investment
Corporation of India, HDFC- Housing Development Finance Corporation,
PNB- Punjab National Bank, SIB- South Indian Bank, INDUS- Indus Ind
Bank, UBI- Union Bank of India, IOB- Indian Overseas Bank, CSB-
Catholic Syrian Bank, CORP- Corporation Bank)

Chapter 5
220
Table 5.2 reveals that, most of the respondents are customers of
State Bank of India (41 per cent) following ICICI bank (20 per cent), and
HDFC bank (8 per cent). It also reveals that majority of the respondents
are the customers of any of the public sector banks in India.
Type of accounts used by respondents with their banks are analysed
using frequency analysis. The following table depicts the details of the
analysis.
Table 5.3: Type of Account Using by Respondents
Type of Account Using Frequency Percentage
Savings Account 747 83
Current Account 153 17
Total 900 100 Source: Result of Primary Data Analysis Using SPSS
From the table it is clear that, 83 per cent of respondents use savings
account and 17 per cent of respondents operate their current account for
transactions.
5.2.2 Type of TEBSS Use by Respondents
The respondents were classified into seven categories according to
their combination of TEBSS use. Respondents were asked to identify the
different combinations of the TEBSS they are currently using for meeting
different purposes.

Analysis of Purpose and Extent of Usage of TEBSS by Customers
221
Table 5.4: Classification of the Respondents based on Type of TEBSS Using
Type of TEBSS Frequency Percentage
Debit cum Debit cum ATM Cards and Credit Card 33 3.7
Debit cum ATM Cards Card and IB 145 16.1
Debit cum ATM Cards and MB 139 15.4
Debit cum ATM Cards, Credit Card and IB 50 0.05
Debit cum ATM Cards, Credit Card and MB 46 5.1
Debit cum ATM Cards, IB and MB 261 29
Debit cum ATM Cards, Credit Card, IB and MB 226 25.1
Total 900 100
Source: Result of Primary Data Analysis Using SPSS
(ATM- Automatic Teller Machine, IB- Internet Banking, MB- Mobile Banking)
The majority of respondents (29 per cent) use the combination;
debit cum ATM cards, Internet banking and Mobile banking. The
combination of debit cum ATM cards, Internet banking, Mobile banking
and Credit cards are used by 25 per cent respondents. Another 16 per cent of
the respondents stated that they are using debit cum ATM cards and
Internet banking for their banking needs. Around 15 per cent of the
respondents use Mobile banking with ATM cards, 5 per cent of respondents
use a combination of debit cum ATM cards, Credit cards and Internet
banking and another 5 per cent use the combination of debit cum ATM
cards, Credit card and Mobile banking. Nearly 4 per cent of the
respondents are using debit cum ATM cards and Credit cards. From the
table it is evident that most of the respondents are using any three of the
basic TEBSS for their banking needs.

Chapter 5
222
5.2.2.1 Respondents’ Age-wise Analysis of Type of TEBSS Use
Age-wise analysis of respondents on their type of TEBSS usage is
done to understand the combination of TEBSS usage by respondents in
different age groups. Cross tabulation analysis is performed on age and
type of TEBSS usage and the result is presented below.
Table 5.5: Respondents’ Age-wise Analysis on Type of TEBSS Use
Type of TEBSS Using
Age of Respondents
Below 25 26-30 31-40 41-50 Above
50 Total
Debit cum ATM Cards and Credit Card
7 (4%)
15 (4%)
10 (4%)
1 (2%) 0 33
Debit cum ATM Cards and IB
30 (17%)
62 (16%)
47 (17%)
5 (13%)
1 (8.33%) 145
Debit cum ATM Cards and MB
40 (22%)
56 (15%)
34 (12%)
7 (18%) 2 (17%) 139
Debit cum ATM Cards, Credit Card and IB
8 (4%)
24 (6%)
12 (4%)
5 (13%)
1 (8.33%) 50
Debit cum ATM Cards, IB and MB
57 (31%)
108 (28%)
86 (30%)
9 (23%)
1 (8.33%) 261
Debit cum ATM Cards, Credit card and MB
5 (3%)
17 (4%)
21 (7%)
3 (8%) 0 46
Debit cum ATM Cards, Credit Card, IB and MB
34 (19%)
104 (27%)
72 (26%)
9 (23%)
7 (58%) 226
Total 181 386 282 39 12 900
Source: Result of Primary Data Analysis Using SPSS
Many of the respondents in this study are (28 Per cent) under the
age category of 26-30 and they are using the combination of TEBSS such
as debit cum ATM cards, IB and MB. It is already evidenced that,

Analysis of Purpose and Extent of Usage of TEBSS by Customers
223
respondents in this age group are the major users of TEBSS. The cross-
tabulation analysis further states that, these respondents are mostly using
debit cum ATM cards, IB and MB combination of TEBSS. The analysis
further indicates that, the highly preferred combination of TEBSS is debit
cum ATM cards, IB and MB irrespective of all age groups, following to
the combination of debit cum ATM cards, credit card, IB and MB.
5.2.2.2 Respondents’ Gender-wise Analysis on Type of TEBSS Use
Gender-wise analysis of type of TEBSS use is done to find out the
frequency of males and females in using different types of TEBSS. The
following table displays the result of cross tabulation analysis.
Table 5.6: Respondents’ Gender-wise Analysis on Type of TEBSS Use
Type of TEBSS Gender Male Percentage Female Percentage Total
Debit cum ATM cards and Credit Card
15% 3% 18% 5% 33 44% 56% 100
Debit cum ATM cards and IB
65 13% 80 21% 145 45% 55% 100
Debit cum ATM cards and MB
75 15% 64 16% 139 54% 46% 100
Debit cum ATM cards, Credit card and IB
26 5% 24 6% 50 52% 48% 100
Debit cum ATM cards, IB and MB
160 31% 101 26% 261 61% 39% 100
Debit cum ATM cards, Credit card and MB
31 6% 15 4% 46 67% 33% 100
Debit cum ATM cards, Credit Card, IB and MB
141 27% 85 22% 226 62% 38% 100
Total 513 100 387 100 900 Source: Result of Primary Data Analysis Using SPSS

Chapter 5
224
It is clear that, the male respondents (31 per cent) as well as female
respondents (26 per cent) are mainly preferring to use the combination of
debit cum ATM cards, IB and MB for their banking transactions,
following the combination of debit cum ATM cards, credit cards, IB and
MB by 27 per cent males and 22 per cent females. It is also understood
from the analysis that; only 3 per cent males are using the combination of
debit cum ATM cards and credit cards. This combination is least using by
males, whereas females are less using the combination of ATM cards,
credit cards and MB (4 per cent).
5.2.2.3 Respondents’ Place of Residence -wise Analysis on Type of TEBSS Use
Type of TEBSS use with place of residence of respondents are
analysed to gather the information regarding combination of TEBSS use
based on the place of residence of respondents. The following table
represents the cross-tabulation analysis of place of residence and type of
TEBSS use of respondents.

Analysis of Purpose and Extent of Usage of TEBSS by Customers
225
Table 5.7: Respondents’ Place of Residence-wise Analysis on Type of
TEBSS Use
Type of TEBSS Using
Place of Residence
Urb
an
Perc
enta
ge
Sem
i-U
rban
Perc
enta
ge
Rur
al
Perc
enta
ge
Tota
l
Debit cum ATM Cards and Credit Card
6 2% 15 4% 12 5% 33
18 % 46% 36% 100
Debit cum ATM Cards and IB
43 14% 54 16% 48 18% 145
30% 37% 33% 100
Debit cum ATM Cards and MB
48 16% 49 15% 42 16% 139
35% 35% 30% 100
Debit cum ATM Cards, Credit card and IB
16 5.33% 18 5% 16 6% 50
32% 36% 32% 100
Debit cum ATM Cards, IB and MB
81 27% 93 28% 87 33% 261
31% 36% 33% 100
Debit cum ATM Cards, Credit card and MB
16 5.33% 20 6% 10 3% 46
35% 43% 22% 100
Debit cum ATM Cards, Credit Card, IB and MB
90 30% 87 26% 49 19% 226
40% 38% 22% 100
Total 300 100 336 100 264 100 900
Source: Result of Primary Data Analysis Using SPSS

Chapter 5
226
Table given above (5.7) reveals that, debit cum ATM cards, IB
and MB is the combination of TEBSS largely using by respondents
irrespective of their region of residence such as rural (33 per cent) semi-
urban (28 per cent) and urban (27 per cent). Following debit cum ATM
cards, Credit card, IB and MB (urban 30 per cent, semi-urban 26 per cent
and rural 19 per cent). Very few respondents are using the combination of
debit cum ATM cards and credit cards in rural, urban and semi-urban
area. In urban area, most of the respondents using the combination of
debit cum ATM cards, credit cards, IB and MB (30 per cent). In semi
urban area, and in rural area, most of the respondents are using the
combination of debit cum ATM cards, IB and MB combination of
TEBSS.
5.2.2.4 Respondents’ Occupation-wise Analysis on Type of TEBSS Use
Occupation wise analysis is done on the use of different types of
TEBSS by respondents. In order to know the combination of
TEBSS used by respondents doing different kind of jobs are analysed
through cross tabulation analysis. The following table shows result of
analysis.

Analysis of Purpose and Extent of Usage of TEBSS by Customers
227
Table 5.8: Occupation wise Analysis of Type of TEBSS Use
Type of TEBSS Using
Occupation of Respondents
Gov
t.
Pvt.
Agr
i.
Busin
ess
Self-
Empl
oyed
Stud
ents
Oth
ers
Tota
l
Debit cum ATM cards and Credit Card
7 (6%)
7 (3.3%)
6 (5%)
1 (1%)
4 (4%)
4 (2%)
4 (5%) 33
Debit cum ATM Cards and IB
25 (20%)
22 (10%)
16 (12%)
13 (18%)
7 (8%)
46 (22%)
16 (23%) 145
Debit cum ATM Cards and MB
11 (9%)
26 (12%)
28 (22%)
12 (16%)
16 (18%)
32 (16%)
14 (20%) 139
Debit cum ATM Cards, Credit card and IB
10 (8%) 7 (3.3%) 6
(5%) 3
(4%) 3
(3%) 16
(8%) 5
(7%) 50
Debit cum ATM Cards, IB and MB
43 (35%)
57 (27%)
33 (26%)
24 (32%)
20 (22%)
68 (34%)
16 (23%) 261
Debit cum ATM Cards, Credit card and MB
8 (7%) 10 (5%) 7
(5%) 10
(14%) 6
(7%) 4
(2%) 1
(1%) 46
Debit cum ATM Cards, Credit Card, IB and MB
18 (15%)
83 (39.2%)
32 (25%)
11 (15%)
35 (38%)
32 (16%)
15 (21%) 226
Total 122 212 128 74 91 202 71 900 Source: Result of Primary Data Analysis Using SPSS

Chapter 5
228
Occupation wise analysis of type of TEBSS usage by respondents
evidenced that, government employees are largely using the combination
of debit cum ATM cards, IB and MB 43 per cent of government
employees are using this combination. Whereas, majority of the private
employees (39 per cent) largely use the combination of TEBSS including
debit cum ATM cards, IB, MB and credit cards. It is to be noted that,
professionals/ self-employed persons are the next category of respondents
who uses all types of common TEBSS. Many of them (38 per cent) stated
that they use the combination of debit cum ATM cards, IB, MB and
Credit cards.
5.2.2.5 Respondents’ Monthly Income-wise Analysis on Type of TEBSS Use
Type of TEBSS usage by the respondents in the study is analysed
according to their monthly income to see which combination of TEBSS
being preferred by the respondents in each income category. The following
table gives the details of analysis results.

Analysis of Purpose and Extent of Usage of TEBSS by Customers
229
Table 5.9: Respondents’ Monthly Income-wise Analysis on Type of TEBSS Use
Type of TEBSS Using
Monthly Income of Respondents U
p-to
`.
200
00
`. 2
0001
-30
000
`. 3
0001
-40
000
`. 4
0001
-50
000
`. 5
0001
-60
000
Abo
ve
`. 6
0000
Tota
l
Debit cum ATM Cards and Credit Card
18 (5%)
5 (2%)
4 (3%)
1 (1%)
2 (5%)
3 (4%) 33
Debit cum ATM cards and IB
66 (19%)
33 (17%)
13 (9%)
16 (20%)
5 (12%)
12 (16%) 145
Debit cum ATM Cards and MB
69 (20%)
36 (18%)
13 (9%)
10 (13%)
4 (10%)
7 (9%) 139
Debit cum ATM Cards, Credit card and IB
20 (6%)
7 (3%)
9 (6%)
5 (6%)
2 (5%)
7 (9%) 50
Debit cum ATM cards, IB and MB
110 (31%)
60 (30%)
37 (24%)
14 (17%)
12 (30%)
28 (36%) 261
Debit cum ATM Cards, Credit card and MB
8 (2%)
12 (6%)
12 (8%)
7 (9%)
3 (8%)
4 (5%) 46
Debit cum ATM Cards, Credit Card, IB and MB
62 (17%)
47 (24)
62 (41%)
27 (34%)
12 (30%)
16 (21%) 226
Total 353 200 150 80 40 77 900
Source: Result of Primary Data Analysis Using SPSS

Chapter 5
230
Monthly income wise cross tabulation analysis with type of TEBSS
use of respondents discloses that, debit cum ATM Cards, IB and MB is
the combination of TEBSS largely used by major share of respondents
belongs to the income group of up to ` 20000 (31 Per cent). Majority of
the respondents under the income category of 20001-30000 (30 Per cent)
also use the same combination. But, majority of the respondents in the
group of 30001-40000 (41 Per cent), 40001-50000 (34 Per cent) and
50001-60000 (30 Per cent) use the combination of debit cum ATM Cards,
Credit card, IB and MB. Whereas, many respondents under the highest
category of income that is above 60000 are using the combination of debit
cum ATM Cards, IB and MB. It can be concluded that, the high-income
group largely preferring to use all common types of TEBSS.
5.2.3 Analysis of Years of Use of TEBSS by Respondents
Number of years of use of TEBSS has been classified into five
categories starting from below 2 years to above 10 years. The respondents
were asked to record their years of use of TEBSS. Following table shows
the details of the responses.
Table 5.10: Years of Use of TEBSS by Respondents
Years of use of TEBSS Frequency Percentage Below 2 years 163 18 2-4 Years 337 37 4-6 years 275 31 6-10 years 91 10 Above 10 years 34 4 Total 900 100
Source: Result of Primary Data Analysis Using SPSS

Analysis of Purpose and Extent of Usage of TEBSS by Customers
231
The Table (5.10) showing that the 37 per cent of the respondents are
using the TEBSS for a period of 2-4 years, followed by 31 per cent using
the services for 4-6 years. Around 18 per cent of respondents use the
TEBSS for less than 2 years. Respondents who use TEBSS for 6-10 years
are 10 per cent. Out of the total respondents, only 4 per cent of respondents
are using the TEBSS for a period above 10 years.
5.2.3.1 Age-wise Analysis of Years of Use of TEBSS
Cross tabulation analysis is performed on years of use of TEBSS by
respondents and their age group in order to identify how long the
respondents in each category of age group are using the TEBSS. The
following table represents the result of the analysis.
Table 5.11: Years of Use of TEBSS and Age of Respondents
Years of using TEBSS
Age of Respondents
Below 25
26-30 31-40 41-50 Above 50
Total
Less than 2 Years 65 (36%)
71 (18%)
25 (9%)
2 (5%)
0 163
2-4 Years 89 (49%)
149 (39%)
86 (31%)
10 (26%)
3 (25%)
337
4-6 Years 21 (11%)
128 (33%)
110 (39%)
14 (36%)
2 (17%)
275
6-10 Years 5 (3%) 26 (7%)
46 (16%)
10 (26%)
4 (33%)
91
Above 10 Years 1 (1%) 12 (3%)
15 (5%)
3 (7%)
3 (25%)
34
Total 181 386 282 39 12 900
Source: Result of Primary Data Analysis Using SPSS

Chapter 5
232
Respondents’ age wise analysis of years of use of TEBSS denotes
that, majority of respondents (39 per cent) in the age category of 26-30
(who are the major users of TEBSS) are using the TEBSS for a period of
2-4 years, 33 per cent of respondents belongs to the same age category are
using the TEBSS for a period of 4-6 years. Much of the respondents
(39 per cent) in the age group of 31-40 are stated their years of use of TEBSS
as 4-6 years. Most of the respondents (49 per cent) below 25 years are using
the TEBSS for 2-4 years.
5.2.3.2 Gender-wise Analysis of Years of Use of TEBSS
Gender wise analysis is performed on the years of use of TEBSS,
through cross tabulation in order to know that, how long the males and
females are using TEBSS. Further the analysis indicates the frequency of
males and females in each category of years of use.
Table 5.12: Years of use of TEBSS and Gender
Years of using TEBSS
Gender of Respondents
Males Females Total
Less than 2 Years 93 (18%) 70 (18%) 163
2-4 Years 172 (34%) 165 (43%) 337
4-6 Years 169 (33%) 106 (27%) 275 6-10 Years 54 (10%) 37 (10%) 91
Above 10 Years 25 (5%) 9 (2%) 34
Total 513 387 900 Source: Result of Primary Data Analysis Using SPSS
Most of the males (34%) and females (43%) are in the category of
using TEBSS for 2-4 years. Adding to it, 33 per cent of males and 27 per

Analysis of Purpose and Extent of Usage of TEBSS by Customers
233
cent of females are using TEBSS for 4-6 years. Supporting the earlier
analyses, very few males (5 per cent) as well as females (2 per cent) are
using the TEBSS for more than 10 years.
5.2.3.3 Place of Residence-wise Analysis of Years of Use of TEBSS
Place of residence wise analysis is performed on years of use of
TEBSS by respondents so as to get the information regarding how long
the respondents in each area are using TEBSS. The following table
conveys the results of cross tabulation analysis.
Table 5.13: Years of Use of TEBSS and Place of Residence of Respondents
Years of use of TEBSS
Place of Residence of Respondents
Urban Semi-Urban Rural Total
Less than 2 Years 59 (20%) 64 (19%) 40 (15%) 163
2-4 Years 101 (34%) 127 (38%) 109 (41%) 337
4-6 Years 93 (31%) 101 (30%) 81 (31%) 275
6-10 Years 31 (10%) 33 (10%) 27 (10%) 91 Above 10 Years 16 (5%) 11 (3%) 7 (3%) 34
Total 300 336 264 900 Source: Result of Primary Data Analysis Using SPSS
The result discloses that, most of the respondents in each areas of
residence such as urban (34%), semi-urban (38%) and rural area (41%)
are using the TEBSS for 2-4 years. Out of 300 urban respondents, only
5 per cent are using the TEBSS for more than 10 years. Likewise, out of
336 semi-urban respondents, 3 per cent respondents are using TEBSS for
more than 10 years.

Chapter 5
234
5.2.3.4 Occupation-wise Analysis of Years of Use of TEBSS
Occupation wise analysis is done on the years of use of TEBSS by
respondents to make out the inferences on the frequency of respondents in
different occupational status and their years of use of TEBSS. The table
below shows the result of cross tabulation between occupation and years
of use of TEBSS
Table 5.14: Years of Use of TEBSS and Occupation
Years of using TEBSS
Occupation of Respondents
Gov
t.
Pvt.
Agr
i.
Busin
ess
Self-
Empl
oyed
Stud
ents
Oth
ers
Tota
l
Less than 2 Years
12 (10%)
24 (11%)
30 (23%)
15 (20%)
14 (15.3%)
53 (26%)
15 (21%) 163
2-4 Years 30 (24%)
85 (40%)
49 (38%)
17 (23%)
34 (37%)
92 (46%)
30 (42%) 337
4-6 Years 44 (36%)
78 (37%)
30 (23%)
26 (35%)
35 (39%)
43 (21%)
19 (27%) 275
6-10 Years 26 (21%)
24 (11%)
15 (12%)
9 (12%)
4 (4.3%)
9 (5%) 4 (6%) 91
Above 10 Years
10 (8%)
1 (1%)
4 (3%)
7 (9%)
4 (4.3%)
5 (2%)
3 (4%) 34
Total 122 212 128 74 91 202 71 900
Source: Result of Primary Data Analysis Using SPSS
The cross- tabulation analysis indicates that, majority of private
employees (40 per cent) are using the TEBSS for 2-4 years. Whereas,
much of the government employees (36 per cent) as well as business
respondents (35 per cent) and self-employed persons (39 per cent) are

Analysis of Purpose and Extent of Usage of TEBSS by Customers
235
using the TEBSS for 4-6 years. It is also clear that, large majority of
students use the TEBSS for 2-4 years.
5.2.3.5 Monthly Income-wise Analysis of Years of Use of TEBSS
Years of use of TEBSS is analysed based on the monthly income of
respondents to gather the information regarding how long the TEBSS are
using by respondents in each category of income group. Table provided
below represents the result of analysis.
Table 5.15: Years of Use of TEBSS and Monthly Income
Years of using TEBSS
Monthly Income of Respondents
Up
to
`20
000
` 20
001-
3000
0
` 30
001-
4000
0
` 40
001-
5000
0
` 50
001-
6000
0
Abo
ve `
60
000
Tota
l
Less than 2 Years
93 (26%)
31 (16%)
14 (9%)
10 (13%)
7 (17%)
8 (10%)
163
2-4 Years 155 (44%)
83 (42%)
33 (22%)
23 (29%)
14 (35%)
29 (38%)
337
4-6 Years 82 (23%)
65 (32%)
55 (37%)
31 (39%)
11 (28%)
31 (40%)
275
6-10 Years
14 (4%)
17 (8%)
41 (27%)
9 (11%)
6 (15%)
4 (5%)
91
Above 10 Years
9 (3%)
4 (2%)
7 (5%)
7 (8%)
2 (5%)
5 (7%)
34
Total 353 200 150 80 40 77 900
Source: Result of Primary Data Analysis Using SPSS
Majority of respondents in the income group are below ` 20000
(44 per cent) and ` 20001-30000 (32 per cent) are using the TEBSS for
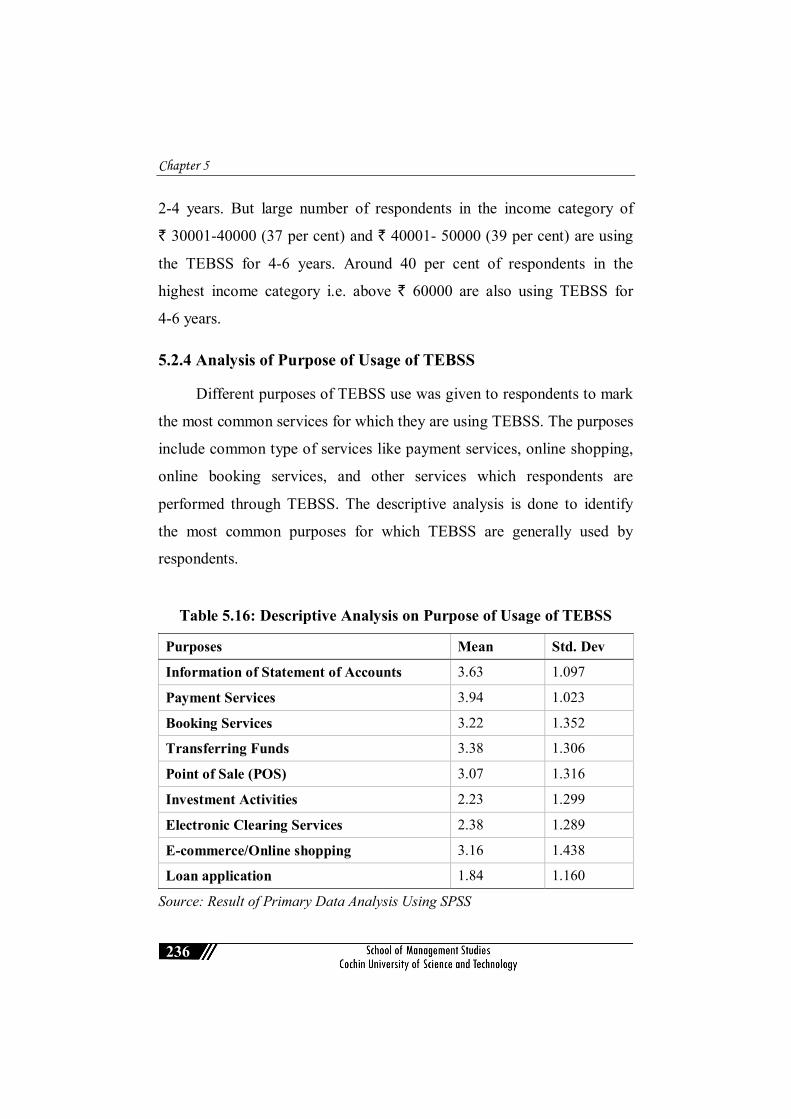
Chapter 5
236
2-4 years. But large number of respondents in the income category of
` 30001-40000 (37 per cent) and ` 40001- 50000 (39 per cent) are using
the TEBSS for 4-6 years. Around 40 per cent of respondents in the
highest income category i.e. above ` 60000 are also using TEBSS for
4-6 years.
5.2.4 Analysis of Purpose of Usage of TEBSS
Different purposes of TEBSS use was given to respondents to mark
the most common services for which they are using TEBSS. The purposes
include common type of services like payment services, online shopping,
online booking services, and other services which respondents are
performed through TEBSS. The descriptive analysis is done to identify
the most common purposes for which TEBSS are generally used by
respondents.
Table 5.16: Descriptive Analysis on Purpose of Usage of TEBSS
Purposes Mean Std. Dev
Information of Statement of Accounts 3.63 1.097
Payment Services 3.94 1.023
Booking Services 3.22 1.352
Transferring Funds 3.38 1.306
Point of Sale (POS) 3.07 1.316
Investment Activities 2.23 1.299
Electronic Clearing Services 2.38 1.289
E-commerce/Online shopping 3.16 1.438
Loan application 1.84 1.160
Source: Result of Primary Data Analysis Using SPSS

Analysis of Purpose and Extent of Usage of TEBSS by Customers
237
The payment services are highly attributable services to respondents
since the mean score of is highest (3.94) among all others. Checking of
information of statement of account and ordering cheque book comes in
the second-place since the mean score is (3.63). Fund transfer service
shows the mean score (3.38) which indicates that it is then next preferable
service followed by booking services; mean score (3.22), and online
shopping or e-commerce activities; mean score (3.16), and point of sale
transactions mean score (3.07).
5.2.5 Analysis of Frequency of Using TEBSS for Various Purposes
Frequency of use of TEBSS for different purposes is also analysed.
The common services are given as purpose of usage, and respondents
were asked to record their frequency of performing such transactions. On
the basis of the data collected, following table (5.17) is generated, and the
detailed percentage analysis is given in the table.
Table 5.17: Classification of the Respondents based on TEBSS Usage Frequency (Values in Percentage)
Frequency
Purpose of using TEBSS
PUR
P1
PUR
P2
PUR
P3
PUR
P4
PUR
P5
PUR
P6
PUR
P7
PUR
P8
PUR
P9
Always 26 35.3 21.7 23.8 16.8 6.8 8 23.3 3.6
Often 28 34.9 23 26.4 23.1 11.7 13 22 5.4
Sometimes 32 20.8 25.6 24.1 25.6 19.1 20 20 15.1
Rare 10 6.4 14.1 13.7 18.6 20.6 25 14 19.7
Never 4 2.6 15.4 11.7 15.9 41.6 34 19 55.4
Source: Result of Primary Data Analysis Using SPSS (PURP-Purpose)

Chapter 5
238
As far as the above Table (5.17) is concerned, responses regarding
the usage and usage frequency is combined for the analysis. As stated
earlier, purpose of usage is listed in a table for marking their performance
frequency. Here, PURP1 stands for ‘Information of statement of accounts/
ordering check book’, PURP2- ‘Payment services’, PURP3- ‘Booking
services like booking of hotels/ air or rail tickets’, PURP4- ‘Transferring
funds’, PURP5- ‘Point of Sale (POS), PURP6- ‘Investment Activities’,
PURP7- ‘Electronic Clearing Services’, PURP8- ‘E-commerce/ Online
shopping’, PURP9- ‘Loan application’. From the table it is known that,
26 per cent of respondents stated they are always using the TEBSS for
Information purposes like statement of accounts, balance enquiry etc.,
28 per cent of respondents stated that they are often using it. Whereas,
32 per cent of respondents stated that they are sometime using that service
and 10 per cent respondents recorded that they are rarely using it and the
rest 4 per cent respondents agreed that they never used the TEBSS for
such a purpose.
While looking at the second purpose ‘Payment services’, nearly
35 per cent of respondents are always using TEBSS for it. Whereas,
34 per cent of respondents revealed that they are often using the services.
The respondents who marked it as sometimes using are 20.8 per cent. The
rest 6.4 per cent agreed that they are using it rarely however 2.6 per cent
are confirmed that they never used it. Booking different services was
another option for which the TEBSS is applying, that include booking
hotels, air / bus rail tickets etc. Among the respondents, 21 per cent
respondents recorded that they always use the TEBSS for booking hotels,

Analysis of Purpose and Extent of Usage of TEBSS by Customers
239
air / bus rail tickets. It is often using by 23 per cent of respondents,
sometimes using by 25 per cent, rarely using by 14 per cent and 15 per cent
of respondents are never used it. Checking the another purpose, transfer
of funds through TEBSS, 23.8 per cent of respondents stated that,
they are using it always, 26 per cent stated that they are using it often,
24 per cent of respondents marked it as sometimes, 13 per cent reported
that they rarely using the same, the rest 11 per cent respondents disclosed
that they never using it.
Considering the Point of Sale transactions through TEBSS, majority
of respondents (25.6) revealed that they are sometime using it. Nearly
16.8 per cent stated that they are always using it and 23 per cent of
respondents also claimed that they are often using it. The remaining
respondents, 18.6 per cent respondents marked as they are rarely using it
but 15.6 per cent of respondents recorded that they never used it.
Regarding the next purpose given, online investment activities through
TEBSS customer responses shows that majority (41 percent) are never
used it and 20 per cent users of TEBSS agreed that they are rarely using
that services. However only 6.8 per cent respondents are utilising TEBSS
always for investment activities. Remaining 19 per cent of users who are
utilising it for sometimes and 11.7 per cent marked as often using this
service.
Considering the other service Electronic Clearing Services, majority
of respondents are not using the same (34 per cent), 25 per cent of
respondents recorded that they are rarely using it. Almost 20 per cent of
respondents are using it for sometimes, and 13 per cent using it often.

Chapter 5
240
Only 8 per cent of respondents are using the services actively. While
observing the purpose of online purchase or E-commerce transactions, it
indicates that 23 per cent of respondents are always using TEBSS for this
purpose. Following by 22 per cent of respondents often using it, 20 per cent
of respondents sometimes using it, 14 per cent opined that they are rarely
using it and 19 per cent stated that they never used it. For the purpose of
loan application, only 3.6 per cent are always using TEBSS. Many
respondents (55 per cent) are never done it through TEBSS. Even if the
large majority are not utilised it, 15 per cent confirmed that they are using
it for sometimes and 5.6 per cent also stated that they are often using the
same.
5.2.6 Analysis of Purpose of Usage of TEBSS Based on Selected Demographic Factors
The following section includes the analysis of some selected
demographic factors of respondents and their use of TEBSS for different
purposes. From the above furnished data, it is clear that, respondents use
TEBSS most commonly for payment services. Following to payment
services, the informational service, transfer of funds, booking service and
online shopping and POS transactions are the frequent services. On the
basis of this order, these services are analysed with different socio-
demographic factors in order to spot detail information on these services’
usage.

Analysis of Purpose and Extent of Usage of TEBSS by Customers
241
5.2.6.1 Respondents’ Age-wise Analysis of TEBSS Usage for Payment Services
Payment service use is the most common largely using services
through TEBSS. It includes payment of bills, taxes, other fees, rent etc. by
using TEBSS. It is analysed based on the age group to know respondents
in which age groups are largely using payment services. The following
table shows the analysis results.
Table 5.18: Age-wise Analysis of TEBSS Usage for Payment Services
Age of Respondents Mean Number Std. Dev
Below 25 3.97 181 1.054
26-30 4 386 1.010
31-40 3.88 282 1.024
41-50 3.72 39 1.050
Above 50 3.92 12 0.753
Total 3.94 900 1.023
Source: Result of Primary Data Analysis Using SPSS
It is evident from the above furnished table (5.18) that; respondents
in the age category of 26-30 are largely carrying out payment services
through TEBSS, since their mean score is high following to the age group
below 25.
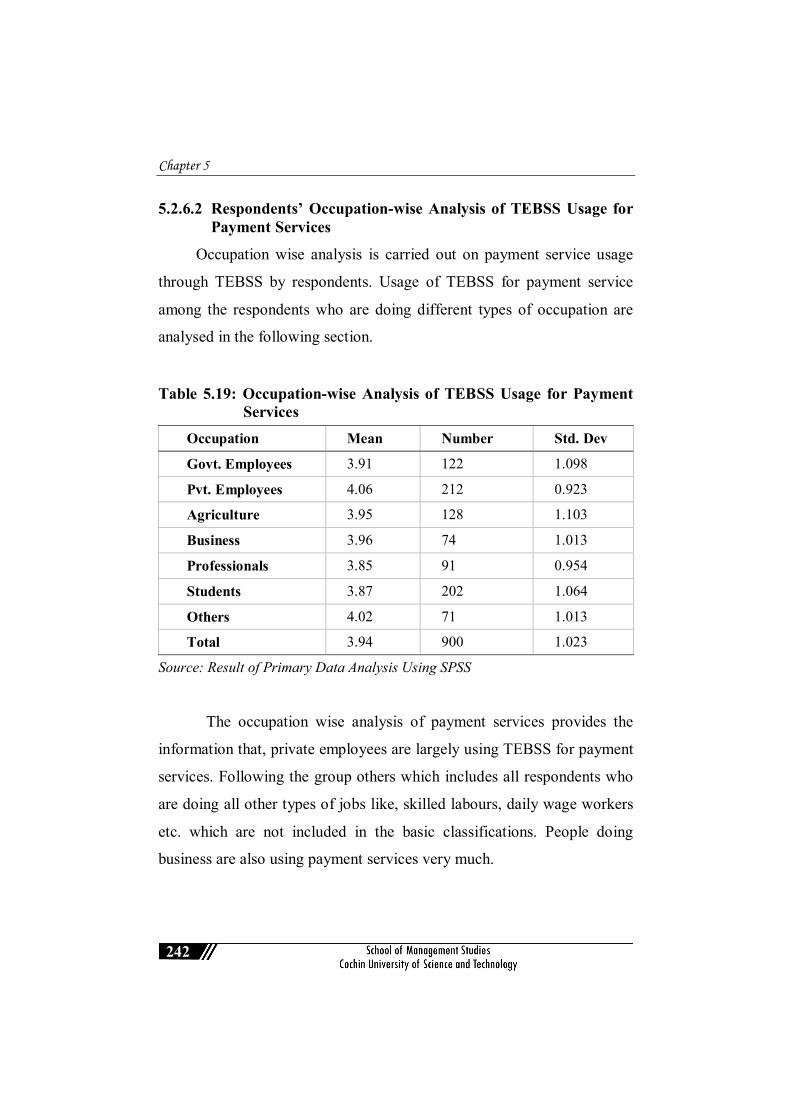
Chapter 5
242
5.2.6.2 Respondents’ Occupation-wise Analysis of TEBSS Usage for Payment Services
Occupation wise analysis is carried out on payment service usage
through TEBSS by respondents. Usage of TEBSS for payment service
among the respondents who are doing different types of occupation are
analysed in the following section.
Table 5.19: Occupation-wise Analysis of TEBSS Usage for Payment Services
Occupation Mean Number Std. Dev
Govt. Employees 3.91 122 1.098
Pvt. Employees 4.06 212 0.923
Agriculture 3.95 128 1.103
Business 3.96 74 1.013
Professionals 3.85 91 0.954
Students 3.87 202 1.064
Others 4.02 71 1.013
Total 3.94 900 1.023
Source: Result of Primary Data Analysis Using SPSS
The occupation wise analysis of payment services provides the
information that, private employees are largely using TEBSS for payment
services. Following the group others which includes all respondents who
are doing all other types of jobs like, skilled labours, daily wage workers
etc. which are not included in the basic classifications. People doing
business are also using payment services very much.

Analysis of Purpose and Extent of Usage of TEBSS by Customers
243
5.2.6.3 Respondents’ Income wise Analysis of TEBSS Usage for Payment Services
Income-wise analysis is done on purpose of usage of TEBSS by
respondents for performing different type of services. Payment service
usage by means of TEBSS is analysed against the monthly income of
respondents, to identify which income groups are majorly using payment
services
Table 5.20: Income wise Analysis of TEBSS Usage for Payment Services
Income Mean Number Std. Dev
Up to ` 20000 3.93 353 1.016
` 20001- 30000 3.95 200 1.028
` 30001-40000 3.85 150 0.925
` 40001-50000 3.94 80 1.095
` 50001-60000 4.08 40 1.185
Above 60000 4.09 77 1.066
Total 3.94 900 1.023
Source: Result of Primary Data Analysis Using SPSS
It is revealed from the Table (5.20) that, respondents who have
high income are greatly using TEBSS. It is known that, respondents
who belong to the monthly income of above ` 40000 are substantially
using the TEBSS for payment services. The use of payment service is
highest among the respondents who have monthly income more than
` 60000.
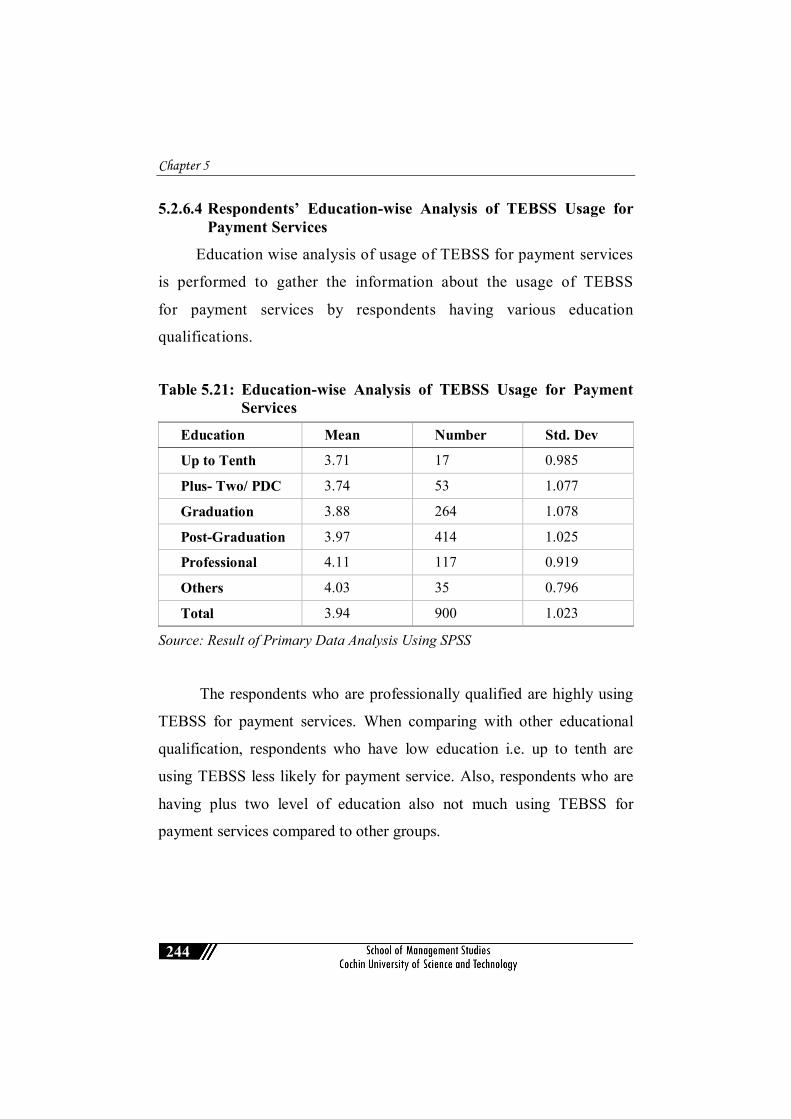
Chapter 5
244
5.2.6.4 Respondents’ Education-wise Analysis of TEBSS Usage for Payment Services
Education wise analysis of usage of TEBSS for payment services
is performed to gather the information about the usage of TEBSS
for payment services by respondents having various education
qualifications.
Table 5.21: Education-wise Analysis of TEBSS Usage for Payment Services
Education Mean Number Std. Dev
Up to Tenth 3.71 17 0.985
Plus- Two/ PDC 3.74 53 1.077
Graduation 3.88 264 1.078
Post-Graduation 3.97 414 1.025
Professional 4.11 117 0.919
Others 4.03 35 0.796
Total 3.94 900 1.023
Source: Result of Primary Data Analysis Using SPSS
The respondents who are professionally qualified are highly using
TEBSS for payment services. When comparing with other educational
qualification, respondents who have low education i.e. up to tenth are
using TEBSS less likely for payment service. Also, respondents who are
having plus two level of education also not much using TEBSS for
payment services compared to other groups.

Analysis of Purpose and Extent of Usage of TEBSS by Customers
245
5.2.6.5 Respondents’ Age-wise Analysis of TEBSS Usage for Informational Services
The most commonly using type of services through TEBSS is
informational services, which includes information of statement of
account, balance enquiry, pin change etc. Age wise analysis is done on
this service specifically to know which age group respondents are mostly
using these types of services. Following table gives the output of the
analysis.
Table 5.22: Age-wise Analysis of TEBSS Usage for Informational Services
Age Mean Number Std. Dev Below 25 3.62 181 1.185
26-30 3.62 386 1.108
31-40 3.67 282 1.040
41-50 3.36 39 1.112
Above 50 3.58 12 0.515
Total 3.63 900 1.097
Source: Result of Primary Data Analysis Using SPSS
The Table (5.22) represents the age wise analysis of informational
service usage through TEBSS. It is clear from the table that, the
respondents in the age category of 31-40 are intensive users of
informational service through TEBSS (Mean score 3.67). In the earlier
analysis it was revealed that; the respondents in the age category below
30 are largely using TEBSS for payment services. But this analysis shows
that, respondents having age below 30 are not much use informational
services through TEBSS.

Chapter 5
246
5.2.6.6 Respondents’ Occupation-wise Analysis of TEBSS Usage for Informational Services
Occupation-wise analysis is done on usage of informational service
through TEBSS, to know the superior users of informational services
among respondents doing different occupations. The following section
includes the analysis of occupation wise classification.
Table 5.23: Occupation-wise Analysis of TEBSS Usage for Informational Services
Occupation Mean Number Std. Dev
Govt. Employees 3.70 122 1.050
Pvt. Employees 3.66 212 1.048
Agriculture 3.55 128 1.241
Business 3.57 74 1.124
Professionals 3.74 91 0.941
Students 3.52 202 1.112
Others 3.76 71 1.165
Total 3.63 900 1.097
Source: Result of Primary Data Analysis Using SPSS
Information service usage analysis on the basis of occupation shows
that, respondents performing different types of jobs like skilled labours,
daily wagers, workers of non-organised sectors, retirees etc. are largely
using information service through TEBSS. Since the information service
like checking of account balance and retrieving of account statements
are the very basic activities and are comparatively less risky, more

Analysis of Purpose and Extent of Usage of TEBSS by Customers
247
respondents used to do this. Next to this group, professionals are highly
using TEBSS for informational services.
5.2.6.7 Respondents’ Income-wise Analysis of TEBSS Usage for Informational Services
Income wise analysis is again applied on ‘getting the information’
services by using TEBSS. Information service usage by respondents in
different income groups are presented in the table given below.
Table 5.24: Income-wise Analysis of TEBSS Usage for Informational Services
Income Mean Number Std. Dev
Up to ` 20000 3.55 353 1.132
` 20001- 30000 3.72 200 1.090
` 30001-40000 3.50 150 0.939
` 40001-50000 3.80 80 1.184
` 50001-60000 3.80 40 1.224
Above 60000 3.71 77 1.050
Total 3.63 900 1.097
Source: Result of Primary Data Analysis Using SPSS
It is observed from the analysis that, respondents who have monthly
income of ` 40000 to ` 60000 are extensively using the TEBSS for
information purpose, followed by the respondents under the income group
of ` 20000- ` 30000, and above ` 60000 respectively.

Chapter 5
248
5.2.6.8 Respondents’ Education-wise Analysis of TEBSS Usage for Informational Services
Education wise analysis is carried out on the usage of TEBSS for
meeting the informational service requirements. The table below shows
the result of analysis.
Table 5.25: Education-wise Analysis of TEBSS Usage for Informational Services
Education Mean Number Std. Dev
Up to Tenth 3.26 17 1.176
Plus- Two/ PDC 3.59 53 1.059
Graduation 3.59 264 1.089
Post-Graduation 3.66 414 1.127
Professional 3.80 117 1.069
Others 3.70 35 0.833
Total 3.63 900 1.097
Source: Result of Primary Data Analysis Using SPSS
It is surprised to see that, respondents having professional education
qualification are highly using TEBSS for informational service. Respondents
in the category of education other than common education streams like
diploma, or technical education, vocational education etc. are included in
the category of others. Respondents having these educational backgrounds
are the next popular users of informational services through TEBSS.
Respondents having educational qualification up to tenth are oddly using
TEBSS for information services.

Analysis of Purpose and Extent of Usage of TEBSS by Customers
249
5.2.6.9 Respondents’ Age-wise Analysis of TEBSS Usage for Fund Transfer Services
Age-wise analysis of respondents is carried out on usage of TEBSS
for fund transfer services. It is the common service used by large number
of respondents after informational services. The following table represents
the result of analysis.
Table 5.26: Age-wise Analysis of TEBSS Usage for Fund Transfer Services
Age Mean Number Std. Dev
Below 25 2.98 181 1.368
26-30 3.34 386 1.310
31-40 3.66 282 1.231
41-50 3.38 39 1.115
Above 50 4.25 12 0.622
Total 3.38 900 1.306
Source: Result of Primary Data Analysis Using SPSS
Age- wise analysis of fund transfer services using TEBSS shows
that, respondents in the age group of above 30 are largely using the fund
transfer services. Among them, respondents in the age group of 31-40 and
above 50 group are highly using this service.

Chapter 5
250
5.2.6.10 Respondents’ Occupation-wise Analysis of Usage of TEBSS for Fund Transfer Services
Fund transfer service by using TEBSS is also analysed based on
occupation type of respondents. Following table shows the analysis
results.
Table 5.27: Occupation-wise Analysis of Usage of TEBSS for Fund Transfer Services
Occupation Mean Number Std. Dev
Govt. Employees 3.64 122 1.179
Pvt. Employees 3.61 212 1.248
Agriculture 3.25 128 1.369
Business 3.42 74 1.303
Professionals 3.21 91 1.418
Students 3.19 202 1.284
Others 3.20 71 1.359
Total 3.38 900 1.306
Source: Result of Primary Data Analysis Using SPSS
It is evident from the analysis that government employees are
extremely using TEBSS for fund transfers followed by private employees
and business man. Since the government employees and private
employees having regular income compared to other occupational
categories, they are using TEBSS largely for transferring funds. It is least
used by students and it might be because of they lack regular income as
their own.

Analysis of Purpose and Extent of Usage of TEBSS by Customers
251
5.2.6.11 Respondents’ Income-wise Analysis of TEBSS Usage for Fund Transfer Services
Usage of TEBSS for fund transfer is also examined with monthly
income of respondents. Fund transfer is one of the common services
largely used by the respondents in this study. It was intended to know
which category of respondents are greatly using this service by analysing
their monthly income.
Table 5.28: Income-wise Analysis of TEBSS Usage Fund Transfer Services
Income Mean Number Std. Dev
Up to ` 20000 3.12 353 1.337
` 20001- 30000 3.42 200 1.281
` 30001-40000 3.51 150 1.157
` 40001-50000 3.75 80 1.207
` 50001-60000 3.50 40 1.320
Above 60000 3.78 77 1.382
Total 3.38 900 1.306
Source: Result of Primary Data Analysis Using SPSS
It is understood from the table that, respondents under the income
group more than ` 60000 and income group ` 40000- ` 50000 are more
frequent to use the TEBSS for fund transfers. Respondents under the
income group of ` 30000 - ` 40000 are also highly using the TEBSS for
fund transfer services.

Chapter 5
252
5.2.6.12 Respondents’ Education-wise Analysis of TEBSS Usage for Fund Transfer Services
Usage of TEBSS for fund transfer services is examined on the basis
of educational qualifications of the respondents to see the use of TEBSS
for fund transfer services by respondents having different educational
qualifications. Analysis results are presented below.
Table 5.29: Education wise Analysis of TEBSS Usage for Fund Transfer Services
Education Mean Number Std. Dev
Up to Tenth 2.94 17 1.144
Plus- Two/ PDC 3.19 53 1.316
Graduation 3.40 264 1.281
Post-Graduation 3.34 414 1.326
Professional 3.71 117 1.246
Others 3.14 35 1.375
Total 3.38 900 1.306
Source: Result of Primary Data Analysis Using SPSS
The education wise analysis result of usage of TEBSS for fund
transfer services evidenced that, respondents who are professionally
qualified are highly using TEBSS for transferring funds from one account
to other accounts. Respondents who belong to low educational qualification
(up to tenth) are least using TEBSS for fund transfers.

Analysis of Purpose and Extent of Usage of TEBSS by Customers
253
5.2.6.13 Respondents’ Age-wise Analysis of TEBSS Use for Booking Services
Booking services including booking of air, rail, or bus tickets,
online ticket booking for movies and plays, hotel booking, and all other
booking services are included in this category. From the analysis results
presented earlier, it is one among the common services of which TEBSS
are largely using by respondents. Following table shows the age-wise
analysis of respondents on their use of TEBSS for the purpose of booking
different services.
Table 5.30: Age wise Analysis of TEBSS Usage for Booking Services
Age Mean Number Std. Dev
Below 25 2.90 181 1.450
26-30 3.20 386 1.331
31-40 3.58 282 1.305
41-50 3.33 39 1.264
Above 50 3.42 12 1.084
Total 3.22 900 1.352
Source: Result of Primary Data Analysis Using SPSS
The age-wise analysis of usage of TEBSS for booking service
revealed that, booking services are high among the group of respondents
who are at the above 30 age. Specifically, booking services are highly
used by respondents in the age group of 31-40.

Chapter 5
254
5.2.6.14 Respondents’ Occupation-wise Analysis of Usage of TEBSS for Booking Services
Booking service by using TEBSS is also analysed against occupation
of respondents to recognise which group of respondents are regularly
using booking services through TEBSS. The analysis result is presented
in the table given below.
Table 5.31: Occupation-wise Analysis of Usage of TEBSS for Booking Services
Occupation Mean Number Std. Dev
Govt. Employees 3.35 122 1.253
Pvt. Employees 3.34 212 1.331
Agriculture 3.28 128 1.458
Business 3.26 74 1.250
Professionals 3.16 91 1.385
Students 3.03 202 1.360
Others 3.08 71 1.401
Total 3.22 900 1.352
Source: Result of Primary Data Analysis Using SPSS
It is seen from the Table (5.31) that, government employees and
private employees are using booking services greatly when comparing
with other groups. It is also least used by the students as well as
respondents in the category of other occupation group. Here also, the
respondents who belong to the occupation group which offered a regular
income are greatly using the TEBSS for booking services.

Analysis of Purpose and Extent of Usage of TEBSS by Customers
255
5.2.6.15 Respondents’ Income-wise Analysis of TEBSS Usage for Booking Services
Income wise analysis of TEBSS for booking service is also
performed to identify which income groups are largely using the TEBSS
for booking bus, air or rail tickets, hotels etc. The following table shows
the analysis result.
Table 5.32: Income-wise Analysis of TEBSS Usage for Booking Services
Income Mean Number Std. Dev
Up to ` 20000 2.96 353 1.375
` 20001- 30000 3.43 200 1.328
` 30001-40000 3.34 150 1.209
` 40001-50000 3.48 80 1.331
` 50001-60000 3.28 40 1.339
Above 60000 3.35 77 1.449
Total 3.22 900 1.352
Source: Result of Primary Data Analysis Using SPSS
It is observed that, respondents in the income group of ` 40000 to
` 50000 are using TEBSS for booking various services, following to the
group ` 20000 to ` 30000. It is hardly found using by low income group
that is up to ` 20000.

Chapter 5
256
5.2.6.16 Respondents’ Education-wise Analysis of TEBSS Usage for Booking Services
Use of TEBSS for booking services also assessed with the level of
education of respondents to understand education wise difference in the
use of TEBSS for booking various services. The following table depicts
the analysis results.
Table 5.33: Education-wise Analysis of TEBSS Usage for Booking Services
Education Mean Number Std. Dev
Up to Tenth 3.22 17 1.213
Plus- Two/ PDC 2.98 53 1.380
Graduation 3.23 264 1.370
Post-Graduation 3.29 414 1.365
Professional 3.37 117 1.310
Others 2.94 35 1.235
Total 3.22 900 1.352
Source: Result of Primary Data Analysis Using SPSS
From the Table (5.33), it is viewed that respondents with high
educational qualification are highly using TEBSS for booking various
services. In the table, it is clear that, usage of TEBSS for booking service
is high among professionals, post-graduates and graduates respectively. It
is less used by the respondents who are in the other education background
including diploma, vocational, or technical and other short-term courses
etc.

Analysis of Purpose and Extent of Usage of TEBSS by Customers
257
5.2.6.17 Respondents’ Age-wise Analysis of TEBSS Usage for Online Shopping / E-Commerce Transactions
TEBSS usage for online shopping/ e -commerce transactions are
also analysed in the study and it was found as one of the commonly using
service. The age wise analysis is hence performed to identify respondents
in which age groups are more using the TEBSS for online shopping.
Analysis result is given in the following table.
Table 5.34: Age-wise Analysis of TEBSS Usage for Online Shopping
/ E-Commerce Transactions
Age Mean Number Std. Dev Below 25 2.76 181 1.554
26-30 3.67 386 1.454
31-40 3.28 282 1.334
41-50 3.05 39 1.234
Above 50 3.26 12 1.073
Total 3.16 900 1.438
Source: Result of Primary Data Analysis Using SPSS
The Table (5.34) given above shows the TEBSS usage for online
shopping by different age group of respondents. It discloses that, the
respondents who are at the age group of 26-30 are more using the TEBSS
for online shopping. The study supports the general trend that the youths
are more engaged with online shopping/ e-commerce transactions.

Chapter 5
258
5.2.6.18 Respondents’ Occupation-wise Analysis of Usage of TEBSS for Online Shopping/ E-Commerce Transactions
Occupation wise analysis is performed on respondents’ online
shopping/ e - commerce activities using TEBSS. This analysis provides
the answer to the question that; which group of respondents based on their
occupation are mostly using these services. The table given under denotes
the analysis results.
Table 5.35: Occupation-wise Analysis of Usage of TEBSS for Online Shopping/ E- Commerce Transactions
Occupation Mean Number Std. Dev
Govt. Employees 3.25 122 1.255
Pvt. Employees 3.27 212 1.367
Agriculture 3.23 128 1.507
Business 3.18 74 1.412
Professionals 3.14 91 1.419
Students 3.03 202 1.553
Others 2.92 71 1.524
Total 3.16 900 1.438
Source: Result of Primary Data Analysis Using SPSS
The Table (5.35) indicates that, private employees are mostly
utilising the TEBSS for online shopping/ e-commerce activities.
Government employees and agriculture people are next to private
employees in using TEBSS for online shopping/ e- commerce activities.

Analysis of Purpose and Extent of Usage of TEBSS by Customers
259
5.2.6.19 Respondents’ Income-wise Analysis of TEBSS Usage for Online Shopping/ E-Commerce Transactions
Income wise analysis is made on the usage of TEBSS for shopping
online/ e-commerce activities, to know which income group respondents
are highly attracted and which income group respondents are less used
TEBSS for such purposes.
Table 5.36: Income-wise Analysis of TEBSS Usage for Online Shopping/ E-Commerce Transactions
Income Mean Number Std. Dev
Up to ` 20000 3.02 353 1.481
` 20001- 30000 3.25 200 1.451
` 30001-40000 3.35 150 1.290
` 40001-50000 3.41 80 1.366
` 50001-60000 3.27 40 1.502
Above 60000 2.88 77 1.451
Total 3.16 900 1.438
Source: Result of Primary Data Analysis Using SPSS
It is observed that, online shopping/ e-commerce activities are
high among the respondents under the income group of ` 40000-
` 50000, following the income group ` 30000- ` 40000. It is least used
by the respondents who have income above ` 60000, and up to
` 20000.

Chapter 5
260
5.2.6.20 Respondents’ Education-wise Analysis of TEBSS Usage for Online Shopping/ E-Commerce Transactions
Use of TEBSS for online shopping/ e-commerce activities is analysed
on the ground of educational qualifications of the respondents. It was
intended to know respondents with which educational background are
highly using TEBSS for online shopping/ e-commerce activities.
Table 5.37: Education-wise Analysis of TEBSS Usage for Online Shopping/ E-Commerce Transactions
Education Mean Number Std. Dev
Up to Tenth 2.41 17 1.417
Plus- Two/ PDC 2.72 53 1.350
Graduation 2.97 264 1.376
Post-Graduation 3.24 414 1.434
Professional 3.53 117 1.489
Others 3.43 35 1.501
Total 3.16 900 1.438
Source: Result of Primary Data Analysis Using SPSS
Table (5.37) reveals that, respondents having professional educational
qualification highly using TEBSS for online shopping/ e-commerce
activities. Respondents who are having low educational qualification (up
to tenth) are less likely in using TEBSS for online shopping/ e-commerce
related activities.

Analysis of Purpose and Extent of Usage of TEBSS by Customers
261
5.2.6.21 Respondents’ Age-wise Analysis of TEBSS Usage for POS Transactions
TEBSS usage for POS transactions is then analysed in the study.
The age wise analysis is carried out to understand the TEBSS usage for
POS transactions by respondents in different category of age groups.
Table 5.38: Age-wise Analysis of TEBSS Usage for POS Transactions
Age Mean Number Std. Dev
Below 25 2.64 181 1.361
26-30 3.16 386 1.271
31-40 3.18 282 1.328
41-50 3.05 39 1.191
Above 50 3.83 12 0.577
Total 3.07 900 1.316
Source: Result of Primary Data Analysis Using SPSS
The Table (5.38) given above shows the TEBSS usage for POS
transactions by respondents at different age groups. It reveals that, the
respondents who are at the age group of above 50 are more using the
TEBSS for POS transactions unlike they do any other transactions
through TEBSS. It is clear that the respondents who are above 50 are
generally reluctant to perform mature banking activities through TEBSS.
Point of Sale transaction is one of the common types of transactions that
generally carried out through TEBSS. No further precautions are required
while performing POS transactions, hence the old age people are more
attracted to these services. Following to them, customers in the age group
of 31-40 are largely using TEBSS for POS transactions.

Chapter 5
262
5.2.6.22 Respondents’ Occupation-wise Analysis of Usage of TEBSS for POS Transactions
Occupation wise analysis is performed on usage of TEBSS for POS
transactions. This analysis provides the information regarding the usage
of TEBSS for POS transactions by customers who are doing different
type of occupation. The table given under represents the analysis results.
Table 5.39: Occupation-wise Analysis of Usage of TEBSS for POS Transactions
Occupation Mean Number Std. Dev Govt. Employees 3.15 122 1.211
Pvt. Employees 3.30 212 1.232
Agriculture 2.99 128 1.400
Business 3.14 74 1.437
Professionals 2.93 91 1.191
Students 2.96 202 1.371
Others 2.77 71 1.365
Total 3.07 900 1.316
Source: Result of Primary Data Analysis Using SPSS
It is seen that; private employees are mostly utilising the TEBSS for
POS transactions. Government employees and business people are next to
private employees in using TEBSS for POS transactions. It indicates that
customers who are having regular income are more likely using TEBSS at
POS transactions.

Analysis of Purpose and Extent of Usage of TEBSS by Customers
263
5.2.6.23 Respondents’ Income-wise Analysis of TEBSS Usage for POS Transactions
Respondents’ income wise analysis is performed on the usage of
TEBSS for POS transactions. The information regarding TEBSS usage
for POS transactions by different income group of respondents is given in
the table presented below.
Table 5.40: Income-wise Analysis of TEBSS Usage for POS Transactions
Income Mean Number Std. Dev
Up to ` 20000 2.84 353 1.340
` 20001- 30000 3.24 200 1.317
` 30001-40000 3.15 150 1.157
` 40001-50000 3.31 80 1.356
` 50001-60000 3.13 40 1.399
Above 60000 3.21 77 1.281
Total 3.07 900 1.316
Source: Result of Primary Data Analysis Using SPSS
It is evidenced from the above Table (5.40) that, TEBSS usage for
POS transactions are high among the respondents under the income group
of ` 40000- ` 50000, following the income group ` 20000- ` 30000. It is
least used by the respondents who have income below ` 20000. It further
supports notion that, the customers who are having fairly good amount of
monthly income are highly using TEBSS at POS.

Chapter 5
264
5.2.6.24 Respondents’ Education-wise Analysis of TEBSS Usage for POS Transactions
TEBSS application in POS transactions are analysed based on the
educational qualifications of the respondents. In order to identify the POS
transactions through TEBSS by respondents with different educational
qualification, the following analysis is performed.
Table 5.41: Education-wise Analysis of TEBSS Usage for POS Transactions
Education Mean Number Std. Dev Up to Tenth 2.53 17 0.943 Plus- Two/ PDC 2.60 53 1.276 Graduation 2.89 264 1.265 Post-Graduation 3.22 414 1.331 Professional 3.32 117 1.292 Others 2.66 35 1.349 Total 3.07 900 1.316
Source: Result of Primary Data Analysis Using SPSS
Table (5.41) given above discloses that, customers who are
professionals are highly using TEBSS for POS transactions. Following
them, the post graduates are largely using TEBSS for POS transactions.
Respondents who are having low educational qualification (up to tenth)
are less using TEBSS at POS transactions. The professionals are
technically qualified and will be having the knowledge about the use of
TEBSS. In the same way the post-graduates as well as graduates may also
proficient in the use of TEBSS. But the customers who are having low
education, may need assistance from others or they might have the fear of

Analysis of Purpose and Extent of Usage of TEBSS by Customers
265
using TEBSS at POS transactions due to their lack of knowledge about
the operations.
5.2.7 Analysis of the Association between Selected Demographic Factors and Purpose of Usage
Use of TEBSS for different purpose was analysed in the study
based on different demographic factors. Relationship analysis is
performed in order to test whether the demographic characteristics of
respondents has any association with their use of TEBSS for different
purposes. Previous studies evidenced that, occupation and monthly
income of the respondents are the two major demographic factors which
are expected to have significant influence on banking decisions. In the
current study also, it is seen that occupation and monthly income are
largely influencing the use of TEBSS. Hence, it is decided to check the
significance of association of these factors on the use of TEBSS for
varying purposes.
5.2.7.1 Analysis of Relationship of Occupation and TEBSS Usage for Payment Services
Occupation wise analysis is performed on the use of TEBSS for
payment services by using one-way ANOVA.
Table 5.42: Occupation of Respondents and TEBSS Usage for Payment Services
Payment Services Sum Squares Df Mean Square F Sig
Between Groups 4.320 6 0.720 0.687 0.661
Within Groups 936.440 893 1.049
Total 940.760 899 Source: Result of Primary Data Analysis Using SPSS

Chapter 5
266
It is observed that, there is no significant difference between
respondents in using TEBSS for payment services on the basis of their
occupation (p value 0.661 which is higher than criterion value p< 0.05). It
indicates that, once the customers started using the TEBSS for payment
services, their occupation status does not significantly affect their TEBSS
usage later. Still they are the adopters of TEBSS, and practiced using the
TEBSS for payment services they will be comfortable in using TEBSs for
payment services. Also, the customers only need to have a smart phone
with internet connection in order to perform the payment services through
TEBSS. Thus, their occupation status does not make any considerable
change in their use of TEBSS for payment services.
5.2.7.2 Analysis of Relationship between Monthly Income of Respondents and Use of TEBSS for Payment Service
Analysis of the relationship between monthly income of
respondents and their use of TEBSS for payment services is carried out.
One-way ANOVA test is applied to test if any significant differences
exist among respondents in using payment services according to their
monthly income.
Table 5.43: Monthly Income of Respondents and Use of TEBSS for Payment Services
Payment Services Sum Squares Df Mean Square F Sig
Between Groups 3.836 5 0.767 0.732 0.599
Within Groups 936.924 894 1.048
Total 940.760 899
Source: Result of Primary Data Analysis Using SPSS

Analysis of Purpose and Extent of Usage of TEBSS by Customers
267
It is found that, there is no significant differences exists among
respondents in using TEBSS for payment services based on their monthly
income since the p value is greater than the acceptance limit (p < 0.05). This
further indicates that, monthly income of respondents does not make any
significant differences in their use of TEBSS for payment services. It means,
there is no significant difference in the use of TEBSS for payment services
between the customers who are having high income or low income. Even if
the frequency of using TEBSS for payment services may vary between these
groups, it does not make any significant differences in the usage.
5.2.7.3 Analysis of Relationship between Occupation and Informational Service Usage
Occupation wise analysis is done on the use of TEBSS for
informational needs to check whether the use of TEBSS for informational
purposes is significantly varying with their occupation status. One-way
ANOVA test is applied, and the table given below shows the details.
Table 5.44: Occupation of Respondents and Informational Service Usage
Informational Service
Sum Squares Df Mean Square F Sig
Between Groups 6.520 6 1.087 0.902 0.493
Within Groups 1076.040 893 1.205
Total 1082.560 899
Source: Result of Primary Data Analysis Using SPSS
The informational service usage through TEBSS is not varying
significantly according to the type of occupation of respondents since the

Chapter 5
268
p value is higher than criterion value (p< 0.05). It can be interpreted that;
informational services are used by customers through TEBSS irrespective
of their occupation. Any customer who are using TEBSS can use it for
information of statement of account, balance enquiry, ordering cheque
book etc. at any time. The occupation wise difference does not make any
influence on their use of TEBSS for such purposes. Respondents can
perform it by sitting in their office, home or at anywhere with the basic
facilities of internet and a smart phone. Hence the occupation wise difference
does not make any difference in using TEBSS for informational purposes.
Thus, it does not anyway depend on whether they are govt. employee,
daily wage worker or private employee.
5.2.7.4 Analysis of Relationship between Monthly Income of Respondents and Use of TEBSS for Informational Services
Monthly income and use of TEBSS for informational service use is
examined in order to see whether there is any income wise difference
exists among respondents’ usage of TEBSS for information services.
One- way ANOVA test is employed for testing the difference in income
groups on their use of TEBSS for informational services.
Table 5.45: Monthly Income and Use of TEBSS for Informational Services
Informational Service
Sum Squares
Df Mean Square
F Sig
Between Groups 10.443 5 2.089 1.742 0.122
Within Groups 1072.117 894 1.199
Total 1082.560 899 Source: Result of Primary Data Analysis Using SPSS

Analysis of Purpose and Extent of Usage of TEBSS by Customers
269
The analysis result discloses that, there is no significant difference
in using TEBSS for informational services by users on the basis of their
monthly income (p>0.05). Anyone using the TEBSS can perform the
informational services irrespective of their account balance. So, the
income of customers does not make any difference in the use of TEBSS
for information services. When the customer feels to check their account
balances or need to know about of the information of statement of
accounts, he can perform it any time without bothering about the balance
or dues in his account. This might be the reason for the insignificant
association between income of respondents and their use of TEBSS for
informational services.
5.2.7.5 Analysis of Relationship between Occupation and Use of TEBSS for Fund Transfer Services
One-way ANOVA test is applied to analyse the relationship
between occupation and usage of TEBSS for fund transfer services in
order to check whether there is any significant association between
respondents’ occupation and their usage of TEBSS for fund transfer
services.
Table 5.46: Occupation of Respondents and Use of TEBSS for Fund Transfer Services
Fund Transfer Services
Sum Squares
Df Mean Square
F Sig
Between Groups 33.648 6 5.608 3.338 0.003
Within Groups 1500.392 893 1.680
Total 1534.040 899
Source: Result of Primary Data Analysis Using SPSS

Chapter 5
270
It is understood that, use of TEBSS for fund transfer service is
significantly varying according to the type of occupation of respondents
since the p<0.05. Post hoc analysis (Appendix 3.1) is further applied to
understand which occupation wise the difference is significant. It is revealed
that government employees and students are significantly varying in the use
of TEBSS for fund transfer services (p<0.05) and it is significantly varying
among private employees and students also (p<0.05). It can be further
justified that govt. employees and private employees may need to perform
more fund transfers compared to students, since they are having a permanent
income, as well as regular banking operations as a part of their official and
personal life. Students lack a regular income and their use of TEBSS must be
based on the availability of funds in the form of stipend, scholarships etc.
Hence, customers having a steady income are most probably use fund
transfer services through TEBSS.
5.2.7.6 Analysis of the Relationship between Monthly Income of Respondents and Use of TEBSS for Fund Transfer Services
One-way ANOVA test is used to test the significance of the
relationship between monthly income and use of TEBSS for fund transfer
services. The following table presents the ANOVA test result.
Table 5.47: Monthly Income of Respondents and Use of TEBSS for Fund Transfer Services
Fund Transfer Services
Sum Squares
df Mean Square
F Sig
Between Groups 50.577 5 10.115 6.096 0.000 Within Groups 1483.463 894 1.659 Total 1534.040 899
Source: Result of Primary Data Analysis Using SPSS

Analysis of Purpose and Extent of Usage of TEBSS by Customers
271
The association between monthly income of respondents and their
use of TEBSS for fund transfer services is significant. The result further
states that, there is significant differences in the usage of fund transfer
services by the respondents who are having high and low income. Post-
hoc analysis is further checked to identify which groups are significantly
differ in use of TEBSS for fund transfer services (Appendix.3.2). It was
observed that; the group who are having income up to ` 20000 and
` 30000- ` 40000 (p<0.05), respondents who are having income up to
` 20000 and ` 40000 - ` 50000 (p<0.05), up to ` 20000 and above
` 60000 (p<0.05) are significantly differ in their use of TEBSS for fund
transfer services. The result supports that the income is one of the
important predictors of the use of TEBSS for fund transfer services.
Customers perform the fund transfer services in accordance with their
monthly income. The significant difference in the use of TEBSS for fund
transfer services is exists among the low-income group with high income
group. It is certain that size of income of respondents should reflect in
their fund transfer services. Only those who have high income usually do
frequent fund transfer services compared to low income groups.
5.2.7.8 Analysis of Relationship between Occupation of Respondents and Use of TEBSS for Booking Services
Relationship analysis of occupation and use of TEBSS for booking
services are performed to analyse the significance of the relationship
between occupation of respondents and their use of TEBSS for booking
various services. The following table shows the one-way ANOVA result.
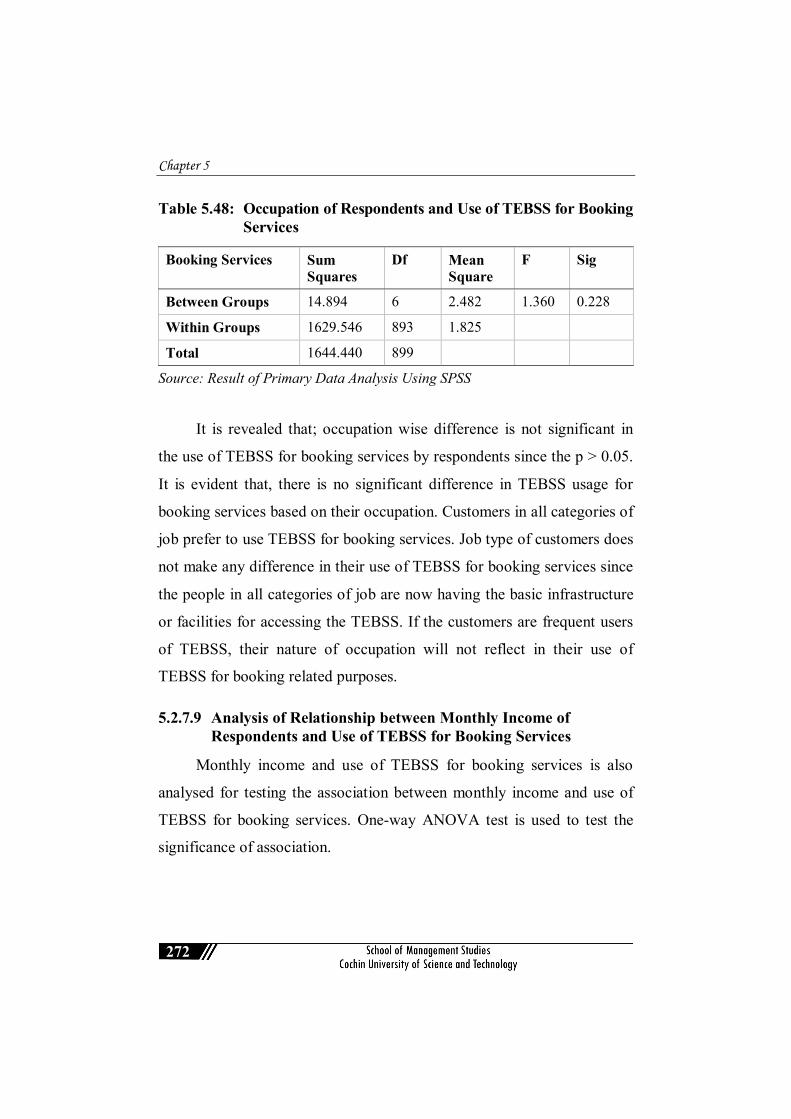
Chapter 5
272
Table 5.48: Occupation of Respondents and Use of TEBSS for Booking Services
Booking Services Sum Squares
Df Mean Square
F Sig
Between Groups 14.894 6 2.482 1.360 0.228
Within Groups 1629.546 893 1.825
Total 1644.440 899
Source: Result of Primary Data Analysis Using SPSS
It is revealed that; occupation wise difference is not significant in
the use of TEBSS for booking services by respondents since the p > 0.05.
It is evident that, there is no significant difference in TEBSS usage for
booking services based on their occupation. Customers in all categories of
job prefer to use TEBSS for booking services. Job type of customers does
not make any difference in their use of TEBSS for booking services since
the people in all categories of job are now having the basic infrastructure
or facilities for accessing the TEBSS. If the customers are frequent users
of TEBSS, their nature of occupation will not reflect in their use of
TEBSS for booking related purposes.
5.2.7.9 Analysis of Relationship between Monthly Income of Respondents and Use of TEBSS for Booking Services
Monthly income and use of TEBSS for booking services is also
analysed for testing the association between monthly income and use of
TEBSS for booking services. One-way ANOVA test is used to test the
significance of association.

Analysis of Purpose and Extent of Usage of TEBSS by Customers
273
Table 5.49: Monthly Income of Respondents and Use of TEBSS for Booking Services
Booking Services Sum Squares Df Mean
Square F Sig
Between Groups 41.003 5 8.201 4.572 0.000
Within Groups 1603.437 894 1.794
Total 1644.440 899
Source: Result of Primary Data Analysis Using SPSS
It is inferred from the analysis that; there exists significant
difference in the use of TEBSS for booking services by respondents
having different monthly income. The post-hoc analysis is further
performed to identify respondents belongs to which income groups are
significantly differ in their usage of TEBSS for booking services
(Appendix.3.3). It is identified that, respondents in the income group up
to ` 20000 and ` 20000 to ` 30000 (p<0.05), up to ` 20000 and ` 30000-
` 40000 (p<0.05), up to ` 20000 and ` 40000- ` 50000 (p<0.05) are
significantly differing in their usage of TEBSS for booking services. It is
inferred from the analysis that, use of TEBSS for booking related services
is significantly associated with the monthly income of respondents. Since
the monthly income of respondents vary from low level to higher level,
their usage of TEBSS for booking services also varies. The respondents
who are having high income are frequently using the TEBSS for booking
services when compared to low income groups. The post hoc analysis
result supports this view that, the use of TEBSS for booking services of
low-income group are vary against all other income groups.

Chapter 5
274
5.2.7.10 Analysis of Relationship between Occupation of Respondents and Use of TEBSS for Online Shopping/ E-Commerce
Online shopping/ e- commerce activities are analysed on the basis
of occupation of respondents to check if any significant association exists
among users in using TEBSS for e-commerce activities corresponding to
their occupation.
Table 5.50: Occupation of Respondents and Online Shopping/ E-Commerce through TEBSS
Online Shopping/ E-Commerce
Sum Squares
Df Mean Square
F Sig
Between Groups 11.742 6 1.957 0.946 0.461
Within Groups 1847.218 893 2.069
Total 1858.960 899
Source: Result of Primary Data Analysis Using SPSS
Online shopping/ e-commerce activities through TEBSS are not
significantly differing between the respondents who are doing different
kind of jobs. The p value is 0.461, implies that the difference is not
significant. It further indicates that, the use of TEBSS for online shopping/
e-commerce activities are not based on their nature of occupation.
Irrespective of the occupation status of respondents, they use TEBSS for
online shopping/ e-commerce activities. Since the respondents are the
users of TEBSS, once they experience the comfort of using the TEBSS
for online shopping or e- commerce activities they will have the tendency
to use it again. Hence the job status or occupation wise differences among
respondents does not make any significant variation in their use of
TEBSS for online e-commerce activities.

Analysis of Purpose and Extent of Usage of TEBSS by Customers
275
5.2.7.11 Analysis of Relationship between Monthly Income of Respondents and Use of TEBSS for Online Shopping/ E-Commerce
Analysis of use of TEBSS by respondents for online shopping/
e- commerce activities based on their monthly income is analysed using
one-way ANOVA. It checks the significance of association between
income and online shopping/ e-commerce activities.
Table 5.51: Monthly Income and Online Shopping/ E-commerce through TEBSS
Online Shopping/ E- Commerce
Sum Squares
Df Mean Square
F Sig
Between Groups 24.862 5 4.972 2.424 0.34
Within Groups 1834.098 894 2.052
Total 1858.960 899
Source: Result of Primary Data Analysis Using SPSS
Analysis of monthly income and use of TEBSS for online shopping
or e-commerce activities shows that, there is no significant differences in
the use of TEBSS for online shopping/ e-commerce activities among the
respondents who belongs to different level of monthly income since the p
value > 0.05. It means that, use of TEBSS for online shopping/ e-
commerce activities are not associated with the monthly income of
respondents.

Chapter 5
276
5.2.7.12 Analysis of Relationship between Occupation of Respondents and Use of TEBSS for POS Transactions
The TEBSS use for POS transactions by respondents are analysed
using one-way ANOVA based on their occupation in order to identify the
association of occupation and their use of TEBSS at POS transactions.
The following table depicts the analysis results
Table 5.52: Occupation and TEBSS Use for POS Transactions
POS Transactions
Sum Squares Df Mean
Square F Sig
Between Groups 23.055 6 3.842 2.238 0.038
Within Groups 1532.945 893 1.717
Total 1556.000 899
Source: Result of Primary Data Analysis Using SPSS
It is evident that, there is significant association between respondents’
occupation and their use of TEBSS at POS transactions since the p<0.05.
It means that, use of TEBSS for POS transactions are varying according
to the type of occupation of respondents. The post-hoc analysis is further
done to identify which groups of respondents are significantly varying in
their TEBSS use for POS transactions. The post-hoc analysis revealed
that private employees and customers doing other categories of job
including daily wages, skilled workers etc. (p < 0.05) are significantly
varying in their use of TEBSS at POS transactions (Appendix 3.4). Private
employees are usually more techno-savvy, doing job under dynamic
conditions of work culture compared to other categories of jobs. So, their
use of TEBSS at POS transactions may not be same as other customers.

Analysis of Purpose and Extent of Usage of TEBSS by Customers
277
5.2.7.13 Analysis of Relationship between Income of Respondents and Use of TEBSS for POS Transactions
In order to identify the association between respondents’ monthly
income and their use of TEBSS for POS transactions, one-way ANOVA
test is employed. The following table shows the analysis result.
Table 5.53: Monthly Income and TEBSS Use for POS Transactions
POS Transactions
Sum Squares
Df Mean Square
F Sig
Between Groups 32.824 5 6.565 3.853 0.002
Within Groups 1523.176 894 1.704
Total 1556.000 899
Analysis of the association between monthly income of respondents
and their use of TEBSS at POS transactions evidenced that, the use of
TEBSS at POS transactions are varying among respondents who are
having different level of monthly income since the p<0.05. Post-hoc
analysis is later performed in order to identify respondents in which group
of income are significantly differing in their use of TEBSS at POS
transactions (Appendix. 3.5). The post-hoc analysis revealed that,
significant difference exists among the respondents who belongs to the
income group up to ` 20000 and ` 20001- ` 30000 (p<0.05), up to
` 20000 and ` 40001 - ` 50000 (p<0.05). It can be interpreted that, usage
of TEBSS at POS transactions are largely varying according to respondents
having low income and high income.

Chapter 5
278
It is revealed from the analysis that, there is significant difference in
the use of TEBSS for some purposes according to their occupation and
income. The fund transfer service is significantly varying among the
respondents who are doing different types of jobs. It mainly varies among
government employees and students as well as private employees and
students. Likewise, use of TEBSS for fund transfer service is significantly
different for the respondents who are having different amount of monthly
income. Similarly, the booking services which includes booking of air,
rail or bus tickets, movies, plays and hotels etc. by using TEBSS is also
varying significantly between respondents who are having different
monthly income. Use of TEBSS at POS transactions is significantly
associated with the occupation status as well as the monthly income of
respondents. But payment service usage and information service usage
are not based on their occupation status of respondents and their monthly
income.
5.3 Analysis of Usage Intensity of TEBSS by Respondents
Intensity of usage is analysed with the scale of usage intensity
which was originally developed by Ellison et.al (2007). Intensity scale is
used along with the frequency and duration of use of internet-based
technologies, when the user uses multiple technologies for different
purposes together (Li, Lau, Mo, & Su, 2016). Apart from measuring the
usage frequency and duration of use and purpose of use of TEBSS, it is
essential to measure the intensity of use since the TEBSS use becomes
more popular among the adopters. The six items scale measured the usage
intensity of TEBSS of respondents and the mean score was obtained. In

Analysis of Purpose and Extent of Usage of TEBSS by Customers
279
addition to descriptive analysis on the scale usage intensity, the difference
in usage intensity among respondents having different demographic
characteristics are also analysed in the following section.
Table 5.54: Analysis of Usage Intensity of TEBSS
Variable N Mean Std. Dev Intensity of Usage 900 3.74 0.780
Source: Result of Primary Data Analysis Using SPSS
Descriptive analysis on usage intensity reveals that, the mean score
of usage intensity is 3.74 with a standard deviation of 0.80, which
indicates that, the respondents are moderately intensive users of TEBSS
(Ellison et.al 2007), (Sigerson & Cheng, 2018). Usage intensity means
that the degree of usage of TEBSS by respondents in their day to day
banking activities. So, the intensive use of TEBSS depicts that the
majority of the respondents in this study are active users of TEBSS. The
result further explains that, customers are regularly using the TEBSS and
the use of TEBSS became a routine banking activity for them.
The difference in intensity of use of TEBSS among different groups
of respondents based on their socio-demographic factors using one-way
ANOVA is ascertained and results are discussed in the following section.
5.3.1 Analysis of Age of Respondents and Usage Intensity of TEBSS
Intensity of usage of TEBSS is analysed against the age of respondents
to identify whether the intensity of usage of TEBSS is significantly differ
among respondents of different age groups. One-way ANOVA test is

Chapter 5
280
applied to test the significance of difference and the result is given in the
table attached below.
Table 5.55: Age of Respondents and Usage Intensity of TEBSS
Usage Intensity Sum Squares Df Mean
Square F Sig
Between Groups 7.771 4 1.943 3.166 0.013
Within Groups 549.186 895 0.614
Total 556.957 899
Source: Result of Primary Data Analysis Using SPSS
It is observed from the table that; significant difference exists in the
intensity of usage of TEBSS by respondents according to their age
groups. The p value at less than 0.05 supports the significance of the
difference. It indicates that, respondents in different age groups are
varying in their intensity of use of TEBSS. Post-hoc analysis is then
carried out for checking which age groups are significantly differing in
their TEBSS usage intensity (Appendix.3.6). It is revealed from the post-
hoc analysis that, significant difference in intensity of usage of TEBSS
exists between respondents at the age group below 25 and 31-40 (p<0.05).
This further indicates that, youths and middle-aged respondents are not
same in their intensity of use of TEBSS. It might be because of their
technical skills, or size of their income etc.

Analysis of Purpose and Extent of Usage of TEBSS by Customers
281
5.3.2 Analysis of Occupation of Respondents and Usage Intensity of TEBSS Occupation status of respondents and intensity of usage of TEBSS
by respondents is also analysed by one-way ANOVA to identify if any
significant difference exists among respondents in their intensity of usage
of TEBSS according to the different types of occupations they are doing.
The following table shows the analysis result.
Table 5.56: Occupation of Respondents and Usage Intensity of TEBSS
Usage Intensity Sum Squares Df Mean
Square F Sig
Between Groups 11.427 6 1.905 3.118 0.005
Within Groups 545.530 893 0.611
Total 556.957 899
Source: Result of Primary Data Analysis Using SPSS
The analysis reveals that, intensity of usage of TEBSS significantly
varies among respondents in the study according to the nature of their
jobs. Since the difference is significant, the post-hoc analysis is further
done to identify which groups are significantly differing in their intensity
of usage. The result of post-hoc analysis pointed out that, the significant
difference exists between government employees and students (p<0.05) in
their usage intensity of TEBSS (Appendix 3.7). Since the govt. employees
are having a permanent job and regular income, they are more favourable
to use banking related activities as routine in their day to day life.
Whereas students might not have such regular monthly income even if
they have income in the form of stipends or scholarships etc. Hence, they

Chapter 5
282
are not doing much banking related activities compared to govt.
employees. Also, the government employees need to perform more
banking transactions since they are availing their salaries, subsidies,
bonus, pension, and all other payment and transfer services through
banks. It might be resulted in the increased use of TEBSS and hence their
intensity is high when compared to students.
5.3.3 Analysis of Monthly Income of Respondents and Usage Intensity of TEBSS
Monthly income of respondents and their usage intensity of TEBSS
was analysed to check whether there is any significant difference in the
usage intensity of TEBSS among respondents having different monthly
income. The one-way ANOVA test is applied and the result of analysis is
given below.
Table 5.57: Monthly Income of Respondents and Intensity of Usage of TEBSS
Usage Intensity Sum Squares
Df Mean Square
F Sig
Between Groups 19.509 5 3.902 6.490 0.000
Within Groups 537.448 894 0.601
Total 556.957 899
Source: Result of Primary Data Analysis Using SPSS
From the one-way ANOVA test, it is clear that respondents belong
to different income groups are significantly varying in their intensity of
use of TEBSS, since the p value is 0.000 (p<0.05). Result further
indicates that, there is significant association between the intensity of use

Analysis of Purpose and Extent of Usage of TEBSS by Customers
283
and the income of respondents. It is obvious that respondents having
fairly high amount of income groups and low-income groups tend to vary
in the use of TEBSS. Post-hoc analysis results are checked for further
information regarding respondents in which groups of income are
significantly different in intensity of use of TEBSS (Appendix.3.8). It
showed that respondents in the first category of income (Up to ` 20000)
and third category (` 30001- ` 40000) of income are significantly differ in
their usage intensity (p<0.05). Also, the usage intensity is different for the
first category (Up to ` 20000) and fourth category (` 40001- ` 50000) of
income group (p<0.05), as well as third category (30001-40000) and fifth
category (Above ` 60000) of income group (p<0.05). It can be summarised
that, the intensity of use of TEBSS by respondents is highly depending on
their income since the respondents in all group of income are varying
with each other in their usage intensity.
It is identified from the analyses that, the usage intensity of TEBSS
significantly vary among respondents who are at various age groups. It is
also varying across respondents who are doing different kind of jobs like
government jobs and students. Additionally, usage intensity of TEBSS is
significantly different for the respondents who are having different scale
of monthly income. Hence it can be concluded that the intensity of usage
of TEBSS is significantly associated with respondents, age, job and
income. Change in their any of these factors may change their usage
intensity of TEBSS also.

Chapter 5
284
5.4 Chapter Summary
This chapter discussed the basic usage analysis of TEBSS under
four sections. The first section of the chapter discussed the analysis of
demographic profile of respondents. Second section of this chapter dealt
with the usage analysis of TEBSS. Analysis of purpose and extent of usage
of TEBSS was concentrated in this section. Analysis of demographical
characteristics and purpose of usage are explained in detail in the
following section. In the last section of this chapter discussed the intensity
of usage analysis of TEBSS.
…..…..

Relationship between Customers’ Perception on Adoptability, Post-Use Experiences and Continuance Intention
285
This chapter discusses about the relationship between customers’ perception on adoptability, post-use experiences and continuance intention of customers to use the TEBSS. It covers the reliability and validity analysis of the constructs under study using measurement model analysis. Analysis of all objectives except first objective are discussed in this chapter.

Chapter 6
286
6.1 Introduction
The decision to continue the use of any technology may be an
extension of acceptance behaviour that co-varies with acceptance
behaviour (Al-Maghrabi & Dennis, 2011). Since the post-adoptive use is
the continuation of pre-adoption behaviour, certain user perceptions about
the adoptability of TEBSS are identified from the earlier studies that
influences the post-use behaviour of customers in banking technologies.
These perceptions are commonly named in the current study as
perceptions on adoptability of TEBSS. These include user perceptions
about accessibility of TEBSS, ease of use of TEBSS, usefulness of
TEBSS and awareness about TEBSS.
Moreover, post-use experience with the use of technology is an
important predictor of users’ continuance decision to use that technology.
Apart from satisfaction, some of the previous studies suggested that,
post-use trust and risk perception also have significant impact in
predicting the user continuance intention in using a new technology.
This study hence includes the analysis of post-use experience of customers
namely satisfaction, post-use trust and risk perception in using TEBSS.
6.2 Customers’ Perception on Adoptability of TEBSS
The second objective of the study is to understand the customers’
perception on adoptability of TEBSS in terms of their awareness,
accessibility, ease of use and usefulness. Descriptive analysis is
performed on the adoptability of TEBSS to get an insight about the
assessment of customers on varying perceptions about the adoptability of

Relationship between Customers’ Perception on Adoptability, Post-Use Experiences and Continuance Intention
287
TEBSS. Descriptive statistics recommended for Likert scale include mean
for central tendency and standard deviations for variability (Boone &
Boone, 2012), (Prasad, 2016) (Likert, 1932). Based on the on the mean
score and standard deviations, the level of perception is ascertained in this
study. Following table shows the descriptive analysis on customers’
perceptions on adoptability of TEBSS.
Table 6.1: Customers’ Perceptions on Adoptability of TEBSS
Variables N Mean Std. Dev.
Awareness 900 3.62 0.846
Accessibility 900 3.88 0.821
Ease of Use 900 3.65 0.819
Usefulness 900 3.98 0.796
Source: Result of Primary Data Analysis Using SPSS
It can be observed that, the mean score of customers’ perceptions on
usefulness of TEBSS is (3.98) with a standard deviation 0.796. It
indicates that, customer perception about the usefulness of TEBSS is
favourable. Customers may have experienced the reduced effort in
carrying out banking transactions once they started using the TEBSS.
Reduced waiting time in long queues as well as increased efficiency of
services might have influenced their higher level of usefulness perception
on TEBSS. Moreover, multiple banking activities can be performed using
TEBSS also may have resulted in the reduced effort in carrying out
banking transactions this might be also resulted in their favourable
perception towards usefulness of TEBSS.

Chapter 6
288
Customers perceive higher level of accessibility (mean score 3.88,
standard deviation 0.821). It indicates that, the TEBSS are easily available
as and when customers need it. It is one of the most important
characteristics of TEBSS and once the customers experienced it, their
perception level of accessibility would be high. Since the TEBSS are
easily available through a smart phone or bank website for carrying out
banking transactions, customers need not to be physically being present at
the banks or banking kiosks for some routine transactions. They can
access their bank account while sitting at their home, office or at
anywhere and anytime. Hence the increased availability without any
limitation of time, domain and place might have resulted in their higher-
level perception of accessibility of TEBSS.
Customers also perceive a higher level of easiness in use of TEBSS
mean score 3.65 with a standard deviation 0.819. It indicates that the
customers are experienced the easiness in learning how to use the TEBSS,
as well as they have the recognition that it is easy to become skilful at
using TEBSS and the interactions with TEBSS are not required a lot of
mental effort. Hence, they will be easily become proficient enough in
using TEBSS. Once the customers become familiar with TEBSS it will
not be any more a hectic task to them to carry out the transactions through
TEBSS. The higher level of ease of use perception might be due to these
reasons.
Awareness of customers about TEBSS is also high. It is understood
that, customers are aware about how to use the TEBSS, the benefits and
risk of using TEBSS as they started using the TEBSS. Since they are

Relationship between Customers’ Perception on Adoptability, Post-Use Experiences and Continuance Intention
289
already having the basic level knowledge about how to use TEBSS, they
become familiar with it and use it. The mean score of awareness is 3.62. it
is not as much high. This might be because the advanced level of
awareness might be low related with technology updates, or improved
features for avoiding transaction failures etc. This might be the reason
that limiting a very high level of awareness. This is consistent with the
findings of Dinev et al. (2007). The result shows that, the customers are
having the basic level of knowledge regarding the use and related issue of
TEBSS.
6.3 Demographic Characteristics and Customers’ Perception on Adoptability of TEBSS Demographic characteristics wise difference is analysed against
customers’ perception on adoptability of TEBSS in this section. It was
important to know that whether the customers’ perceptions on adoptability of
TEBSS is varying across some of the basic demographic factors like age,
education, occupation and monthly income of respondents. One-way
ANOVA test is applied in all the cases to check the differences in
perceptions.
6.3.1 Demographic Characteristics and User Awareness on TEBSS
Awareness is tested according to the basic demographic features of
the respondents in order to check if the awareness level of respondents is
varying according to their demographic characteristics like, age, education,
occupation, and monthly income.

Chapter 6
290
6.3.1.1 Age of Respondents and Awareness on TEBSS
Age of respondents and their awareness about TEBSS is analysed
with the intention of understanding the significance of variance in their
awareness about TEBSS between the respondents of different age groups.
Age of respondents is classified into five groups in this study, starting
from below 25, 26-30, 31-40, 41-50 and above 50. Difference in the
awareness of customers about TEBSS based on these age groups is
ascertained.
Table 6.2: Age of Respondents and Awareness about TEBSS
Awareness Sum Squares
Df Mean Square
F Sig
Between Groups 6.380 4 1.595 2.240 0.063
Within Groups 637.296 895 0.712
Total 643.676 899
Source: Result of Primary Data Analysis Using SPSS
It is noticed from the Table (6.2) that the p value of 0.063, which
denotes there is no significant difference in the awareness about TEBSS
between different age groups. Age of respondents does not make any
significant difference in the user awareness about TEBSS. Since the
respondents are already started using the TEBSS with a minimum level of
knowledge about how to use the TEBSS, benefits and risks of using
TEBSS, security issues and threats in using TEBSS etc., their awareness
about TEBSS not significantly associated with their age.

Relationship between Customers’ Perception on Adoptability, Post-Use Experiences and Continuance Intention
291
6.3.1.2 Education of Respondents and Awareness on TEBSS
One-way ANOVA test is carried out to check whether there is any
difference in the awareness about TEBSS based on the educational
qualification of respondents. The educational qualifications of respondents
in the study are categorised as, Up to tenth, Plus two, Graduation,
Post-Graduation, Professionals and Others. The test result of one-way
ANOVA shows the difference in awareness perception of respondents
according to the level of education of customers.
Table 6.3: Education of Respondents and Awareness on TEBSS
Awareness Sum Squares
Df Mean Square
F Sig
Between Groups 12.107 5 2.421 3.428 0.004
Within Groups 631.569 894 0.706
Total 643.676 899
Source: Result of Primary Data Analysis Using SPSS
The One-way ANOVA test shows that, there is significant difference
in the awareness level of respondents according to their educational
qualification. This means that, awareness of respondents about TEBSS is not
alike for all respondents. It is varying across respondents who are having
different educational qualifications. Since the p value is less than 0.05, it
supports the significance of the difference in awareness exists between
different educational qualifications. Unlike the age, respondents’ education is
closely associated with the awareness about TEBSS. It is certain that the
awareness may depend upon the education of customers. Every customer
may have the basic knowledge regarding the use of TEBSS in their post-use

Chapter 6
292
stage, but the advance level of awareness about technical problems,
performance failures, new updates and recent changes in the TEBSS etc.
might be depending on their education. Post-hoc test (Appendix 3.9) is
further carried out to identify which groups are significantly different in their
awareness. It is revealed that, awareness about TEBSS is significantly
different among graduates and post-graduates (p<0.05).
6.3.1.3 Occupation of Respondents and Awareness on TEBSS
Occupation wise analysis is performed on user awareness to know if
any significant difference exists in the awareness about TEBSS among the
respondents who are doing different kind of jobs. The occupation category of
respondents is classified into seven groups in this study. It includes, Govt.
employee, Private employee, Agriculture, Business, Professionals, Students
and Others. Analysis result is given in the following section.
Table 6.4: Occupation of Respondents and Awareness on TEBSS
Awareness Sum Squares Df Mean
Square F Sig
Between Groups 5.537 6 0.923 1.291 0.258 Within Groups 638.139 893 0.715 Total 643.676 899
Source: Result of Primary Data Analysis Using SPSS
There is no significant difference in the user awareness between the
respondents who are having different types of occupation since the p value is
0.258, which is greater than the acceptance criterion (p<0.05). It supports the
notion that, the type of occupation does not make any significant difference
in their awareness about TEBSS. The customers acquire some basic

Relationship between Customers’ Perception on Adoptability, Post-Use Experiences and Continuance Intention
293
knowledge about TEBSS at their post-use stage of TEBSS or at the initial
stage of use itself. In the post-adoption stage, they acquire the information
regarding the technological updates and technical knowledge etc. It depends
on many other factors but not on their type of occupation.
6.3.1.4. Monthly Income of Respondents and Awareness on TEBSS
Income wise analysis of respondents and awareness of TEBSS by
respondents are examined. Monthly income of respondents was divided
into six groups starting from; up to ` 20000, ` 20001-30000, ` 30001-
40000, ` 40001-50000, ` 50001-60000 and above ` 60000. Significance
of association between awareness and monthly income of respondents is
depicted in the following table.
Table 6.5: Monthly Income of Respondents and Awareness on TEBSS
Awareness Sum Squares
Df Mean Square
F Sig
Between Groups 8.112 5 1.622 2.282 0.05 Within Groups 635.564 894 0.711 Total 643.676 899
Source: Result of Primary Data Analysis Using SPSS
The relationship between monthly income and user awareness
shows as insignificant. The p value is 0.05 which denotes that, there is no
significant difference in the awareness about TEBSS based on their
monthly income. This further states that, monthly income wise difference
does not exist among customers in their awareness about TEBSS. As the
customers are in the post-use stage, their level of income or job status
does not reflect in their awareness since the awareness is evolved from the

Chapter 6
294
user experiences and the information provided by banks regarding the
usage of TEBSS. Customers gain the information regarding the usage,
benefits, risks, threats and safety measures from the experienced users,
friends or colleagues or from their own experiences in the post-use stage.
Thus, it is not associated with the user’s monthly income or job.
6.3.2 Demographic Factors and Accessibility of TEBSS
To find out whether the perception of respondents regarding the
accessibility of TEBSS vary according to some selected demographic
characteristics including age, education, occupation, and monthly income,
the one-way ANOVA test is applied.
6.3.2.1 Age of Respondents and Accessibility of TEBSS
Association between respondents’ age and accessibility of TEBSS
is tested by using one-way ANOVA. It was intended to know the
difference in the perception of users about the accessibility of TEBSS in
accordance with their age. The table below represents the analysis result.
Table 6.6. Age of Respondents and Accessibility of TEBSS
Accessibility Sum Squares Df Mean
Square F Sig
Between Groups 3.128 4 0.782 1.159 0.327
Within Groups 603.607 895 0.674
Total 606.735 899
Source: Result of Primary Data Analysis Using SPSS
Age wise difference in accessibility perception does not exist
among the respondents belongs to different age groups since the p >0.05.

Relationship between Customers’ Perception on Adoptability, Post-Use Experiences and Continuance Intention
295
The accessibility is assessed based on the timely availability, easy access
of TEBSS at anywhere, reduced waiting time for transactions etc.
Irrespective of the age, all the customers who choose the TEBSS expect
the easy accessibility of the same without any hurdles.
6.3.2.2 Education of Respondents and Accessibility of TEBSS
Education wise difference is examined on the accessibility
perception about TEBSS by users. The table provided here shows the
analysis result.
Table 6.7: Education of Respondents and Accessibility of TEBSS
Accessibility Sum Squares Df Mean
Square F Sig
Between Groups 8.214 5 1.643 2.454 0.302
Within Groups 598.521 894 0.669
Total 606.735 899
Source: Result of Primary Data Analysis Using SPSS
Result of analysis of education and customers’ perception on
accessibility of TEBSS indicates that; education wise difference in the
perception of accessibility of TEBSS among respondents is insignificant
since the p>0.05. Which means accessibility perception does not
significantly vary among respondents belongs to different educational
qualifications. Accessibility means that the easiness in accessing the
banking services through TEBSS at anywhere and anytime. Hence, the
level of customers’ perception regarding the accessibility of TEBSS is not
significantly associated with respondents’ educational qualifications.

Chapter 6
296
6.3.2.3 Occupation of Respondents and Accessibility of TEBSS
Occupation of respondents and their perceptions about the
accessibility of TEBSS is examined in order to check if there is any
significant difference exist in their accessibility perception about TEBSS
based on their occupation.
Table 6.8: Occupation of Respondents and Accessibility of TEBSS
Accessibility Sum Squares Df Mean
Square F Sig
Between Groups 10.230 6 1.705 2.553 0.019
Within Groups 596.505 893 0.668
Total 606.735 899
Source: Result of Primary Data Analysis Using SPSS
It is noted that, there exists significant difference in the perception
of customers regarding the accessibility of TEBSS according to their
occupation since the p<0.05. In the post-use stage, accessibility of TEBSS
is one of the important factors for the active use of TEBSS. Accessibility
of TEBSS depends on where the customers are actually present as well as
which types of infrastructural facilities available to them. Hence, it may
depend on the environment where the customer is when he performing
activities through TEBSS. So, there is significant difference in the
accessibility perception of customers based on their occupation. Customers
are under different work environment as well as their banking requirements
are different according to the type of job they are doing. Once the
difference is identified as significant, then post-hoc analysis is needed to
be checked to know which groups of respondents based on their

Relationship between Customers’ Perception on Adoptability, Post-Use Experiences and Continuance Intention
297
occupation are significantly differing in their accessibility perception.
Post-hoc analysis (Appendix.3.10) results shows that there is significant
difference between government employees and private employees (p<0.05)
in the perception on accessibility of TEBSS. Private employees are
having more dynamic working conditions when compared to the govt.
employees. So, the accessibility of TEBSS might be significantly associated
with their working atmosphere.
6.3.2.4 Monthly Income of Respondents and Accessibility of TEBSS
Accessibility of TEBSS is checked with monthly income of
respondents in order to analyse whether an income wise difference exists
in the perception of accessibility of TEBSS. The table furnished here
represents the analysis result.
Table 6.9: Monthly Income of Respondents and Accessibility of TEBSS
Accessibility Sum Squares Df Mean
Square F Sig
Between Groups 6.754 5 1.351 2.013 0.075
Within Groups 599.981 894 0.671
Total 606.735 899
Source: Result of Primary Data Analysis Using SPSS
The analysis result depicts that, there is no significant difference in
the accessibility perception on TEBSS by respondents based on their
monthly income. The p value is 0.075, it denotes that, the income wise
difference is not significant on the perception about accessibility of
TEBSS. It is definite that, easy availability of TEBSS at anytime,

Chapter 6
298
anywhere are not based on the monthly income of the respondents. Hence
there is no significant difference in the accessibility perception of users
according to their monthly income.
6.3.3 Demographic Factors and Ease of Use of TEBSS
Ease of use of TEBSS is analysed against some basic demographic
features of the respondents to identify the difference in the perception of
ease of use among respondents belongs to different category of age,
education, occupation and monthly income.
6.3.3.1 Age of Respondents and Ease of Use of TEBSS
Respondents’ age and their perception on ease of use is examined to
identify whether there exists any significant association between
respondents who belongs to different age groups and their ease of use
perception. One- way ANOVA is applied here also and the following
table represents the result.
Table 6.10: Age of Respondents and Ease of Use of TEBSS
Ease of Use Sum Squares
Df Mean Square
F Sig
Between Groups 10.136 4 2.534 3.817 0.004 Within Groups 594.180 895 0.664 Total 604.316 899
Source: Result of Primary Data Analysis Using SPSS
Significant difference is noticed in the ease of use perception about
TEBSS among the customers who belongs to different age groups since
the p<0.05. It supports the notion that, technology usage is highly

Relationship between Customers’ Perception on Adoptability, Post-Use Experiences and Continuance Intention
299
associated the age group of people. This result also indicating that customers
who are at different age groups are having varying perception regarding
the easiness in usage of TEBSS. Post-hoc analysis (Appendix 3.11) is
performed in order to test which groups of people significantly differ in
their ease of use perception. The post-hoc results revealed that; significant
differences exist between below 25 age group and above 50 age group
(p<0.05) and between 26-30 age group and above 50 age group (p<0.05).
It simply states that, youths and elder generations are significantly
different in their ease of use perception about TEBSS. It is certain for
youngster becoming skilful at using technology are easier and their
technical competence is high compared to elder generations. This result
also reflects the same thing that, the ability of customers to become
experts in the use of TEBSS is more depend on their age.
6.3.3.2 Education of Respondents and Ease of Use of TEBSS
Respondents’ education and their perceived ease of use is analysed
to check whether the significant association exists among respondents in
their ease of use perception on TEBSS, based on their educational
qualifications. The following table discloses the analysis result.
Table 6.11: Education of Respondents and Ease of Use of TEBSS
Ease of Use Sum Squares
Df Mean Square
F Sig
Between Groups 4.763 5 0.953 1.421 0.214
Within Groups 599.553 894 0.671
Total 604.316 899
Source: Result of Primary Data Analysis Using SPSS

Chapter 6
300
It is inferred that, education wise difference in the perceived ease of
use of TEBSS is not significant since the p >0.05. Most of the TEBSS are
designed as customised manner and with good interactivity. Once the user
practiced the use of TEBSS, it is easy for customers to become expert in
the use if they possess very basic technical knowledge. Since the TEBSS
are not designed for a specific group, it can be easily use by a common
man. Hence it can be stated that, educational qualification of respondents
does not make significant difference in the ease of use perception of
TEBSS.
6.3.3.3 Occupation of Respondents and Ease of Use of TEBSS
Occupation of respondents and their perceived ease of use is
examined to assess the occupation wise difference in ease of use
perception among users of TEBSS. The table presented below holds the
analysis results.
Table 6.12: Occupation of Respondents and Ease of Use of TEBSS
Ease of Use Sum Squares
Df Mean Square
F Sig
Between Groups 4.736 6 0.789 1.176 0.317
Within Groups 599.580 893 0.671
Total 604.316 899
Source: Result of Primary Data Analysis Using SPSS
The analysis result conveys that, occupation wise difference is not
significant in ease of use perception of respondents about TEBSS. The p
value is 0.317 indicates that, the respondents’ occupation and their ease of
use perception about TEBSS is not associated. Customers of any type of

Relationship between Customers’ Perception on Adoptability, Post-Use Experiences and Continuance Intention
301
occupation can easily use the TEBSS with a minimum level of
understanding since the TEBSS are designed in such a manner. The only
requirements for performing transactions through TEBSS is to memorise
some password and pin. It is not much a burden to customers; hence their
occupation type does not make any significant difference in their ease of
use perception.
6.3.3.4 Monthly Income of Respondents and Ease of Use of TEBSS
Monthly income wise analysis is employed on customers perception
about the ease of use of TEBSS using one-way ANOVA, in order to
identify the income wise difference in ease of use perception. The table
tagged below represents the analysis result.
Table 6.13: Monthly Income of Respondents and Ease of Use of TEBSS
Ease of Use Sum Squares
Df Mean Square
F Sig
Between Groups 7.267 5 1.453 2.176 0.055
Within Groups 597.049 894 0.668
Total 604.316 899
Source: Result of Primary Data Analysis Using SPSS
It is inferred that; the monthly income does not make any
significant difference in the perceived ease of use of TEBSS since the p
value is 0.05. It is evident that, perception about ease of use of TEBSS is
not varying among high income group respondents and low-income group
respondents.

Chapter 6
302
6.3.4 Demographic Factors and Usefulness of TEBSS
Customers’ perception about usefulness of TEBSS is examined on
the basis some demographic factors like age, education, occupation and
monthly income with the purpose of identifying whether there is
significant variance in the perception of customers about the usefulness of
TEBSS.
6.3.4.1 Age of Respondents and Usefulness of TEBSS
Age wise difference is checked on the usefulness perception of
respondents about TEBSS through one-way ANOVA. The following
table shows the analysis result and the interpretation is given afterwards.
Table 6.14: Age of Respondents and Usefulness of TEBSS
Usefulness Sum Squares
Df Mean Square
F Sig
Between Groups 8.763 4 2.191 3.495 0.008
Within Groups 560.969 895 0.627
Total 569.732 899
Source: Result of Primary Data Analysis Using SPSS
Analysis result discloses that, customers’ perception about
usefulness of TEBSS is significantly varying with their age group. The
p<0.05 which signifies differences in the usefulness perception among
respondents in various age groups. It indicates that, usefulness of TEBSS
regarding the speed of service delivery, their feeling of enhanced
efficiency in the banking transactions by the use of TEBSS are varying
according to their age group. Once the difference is obtained as

Relationship between Customers’ Perception on Adoptability, Post-Use Experiences and Continuance Intention
303
significant, it is necessary to check which groups are significantly
differing in their perceived usefulness. For this, post-hoc analysis later
performed (Appendix.3.12) and the post-hoc results shows the significant
differences between respondents in the age group below 25 and 31-40
(p<0.05). It is because usefulness is high for those who actively dealing
with TEBSS. The middle agers (31-40) should have a job and regular
income. They might be the most active users of TEBSS and are really
benefited with the use of TEBSS, since they need to carry out more
banking transactions when compared to younger customers who are
mostly consists of students.
6.3.4.2 Education of Respondents and Usefulness of TEBSS
Education of respondents and their perception about usefulness of
TEBSS is analysed to know whether the perception of customers about
usefulness of TEBSS is varying with their level of education. The table
displayed below represents the result of analysis.
Table 6.15: Education of Respondents and Usefulness of TEBSS
Usefulness Sum Squares
Df Mean Square
F Sig
Between Groups 3.596 5 0.719 1.136 0.340
Within Groups 566.136 894 0.633
Total 569.732 899
Source: Result of Primary Data Analysis Using SPSS
The result states that; the education wise difference in the usefulness
perception is insignificant since the p value is insignificant (0.340) at the

Chapter 6
304
level of acceptance criterion p< 0.05. It implies that the perception about
usefulness of TEBSS is not varying between customers having high
educational qualification and low educational qualification.
6.3.4.3 Occupation of Respondents and Usefulness of TEBSS
Occupation wise difference in the perception of usefulness of
TEBSS is analysed to know whether there is any significant difference in
the usefulness perception among respondents who are under various
occupation.
Table 6.16: Occupation of Respondents and Usefulness of TEBSS
Usefulness Sum Squares
Df Mean Square
F Sig
Between Groups 12.252 6 2.042 3.271 0.003
Within Groups 557.480 893 0.624
Total 569.732 899
Source: Result of Primary Data Analysis Using SPSS
It is evidenced that; occupation wise difference exists between
respondents in their perception of usefulness since the p<0.05. Result
implies that, the perceived usefulness of respondents about TEBSS who
are doing different types of jobs are significantly varies according to their
job type. The volume of banking transactions done by customers who are
doing different types of jobs are varying significantly. Those who requires
lot of banking related transactions are actually benefited by the use of
TEBSS. Hence their perception regarding usefulness of TEBSS may not
be similar to those who are less required of banking related transactions.
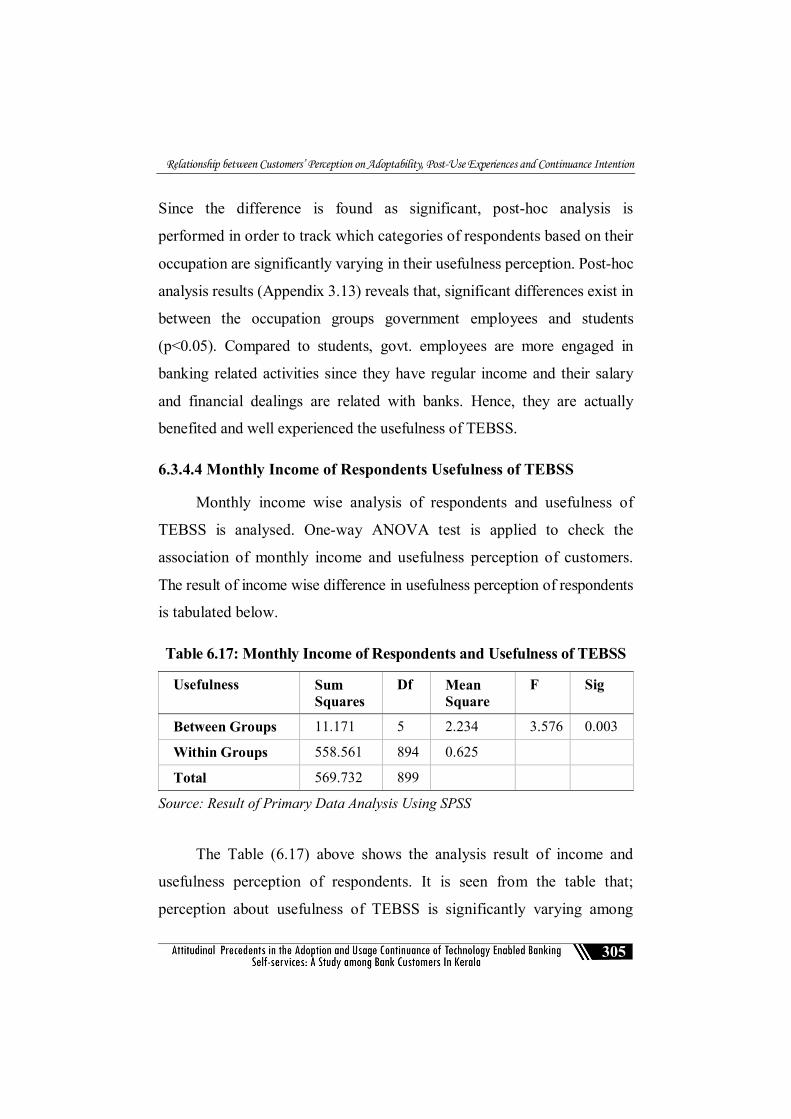
Relationship between Customers’ Perception on Adoptability, Post-Use Experiences and Continuance Intention
305
Since the difference is found as significant, post-hoc analysis is
performed in order to track which categories of respondents based on their
occupation are significantly varying in their usefulness perception. Post-hoc
analysis results (Appendix 3.13) reveals that, significant differences exist in
between the occupation groups government employees and students
(p<0.05). Compared to students, govt. employees are more engaged in
banking related activities since they have regular income and their salary
and financial dealings are related with banks. Hence, they are actually
benefited and well experienced the usefulness of TEBSS.
6.3.4.4 Monthly Income of Respondents Usefulness of TEBSS
Monthly income wise analysis of respondents and usefulness of
TEBSS is analysed. One-way ANOVA test is applied to check the
association of monthly income and usefulness perception of customers.
The result of income wise difference in usefulness perception of respondents
is tabulated below.
Table 6.17: Monthly Income of Respondents and Usefulness of TEBSS
Usefulness Sum Squares
Df Mean Square
F Sig
Between Groups 11.171 5 2.234 3.576 0.003
Within Groups 558.561 894 0.625
Total 569.732 899
Source: Result of Primary Data Analysis Using SPSS
The Table (6.17) above shows the analysis result of income and
usefulness perception of respondents. It is seen from the table that;
perception about usefulness of TEBSS is significantly varying among

Chapter 6
306
respondents who are having varying monthly income (p<0.05). Since the
varying purposes are met through a single TEBSS, they can avoid the
frequent bank visits for each purpose. Thus, the usefulness perception is
significantly varying according to the monthly income of customers. Post-
hoc analysis (Appendix 3.14) then applied and found that, significant
differences in usefulness of TEBSS exists between respondents who
belongs to the income groups Up to ` 20000 and ` 20000-30000
(p<0.05).
It is understood from the analysis that customers perception on
adoptability of TEBSS varies to an extent according to some of
demographic factors. The analysis result disclosed that, user awareness
about TEBSS is significantly varies among respondents who belongs to
different class of education. Mainly the variance is reported in between
graduates and post-graduates. However, awareness does not vary
according to other factors like age, occupation or income. Accessibility of
TEBSS seems to be varying against the occupation status of users.
Specifically, it varies among government employees and private
employees but it does not vary according to any other demographic
factors like age, education or income.
Ease of use and usefulness also showed variance with the user
demographics. Ease of use of TEBSS is significantly different for the
respondents who are at different age groups. Mainly the difference exists
among youngsters and older adults. Similarly, usefulness of TEBSS
shows significant difference according to the age group, occupation, and
monthly income of respondents.

Relationship between Customers’ Perception on Adoptability, Post-Use Experiences and Continuance Intention
307
6.4 Analysis of Post-use Experiences of Customers on TEBSS
The post-use experiences analysis includes the analysis of customer
satisfaction, post-use trust and risk perception about TEBSS. Customer
satisfaction is the feeling of customers regarding the characteristic s of
TEBSS including speed of transactions, scope of services, safety and
security measures, language and support systems in TEBSS etc. Post-use
trust measures the customers’ feeling about security aspect of TEBSS in
terms of safe guards, pass word and pin protection of transactions etc.
Descriptive analysis carried out on post-use experiences and the following
table represents analysis result. Differences in the post-use experiences
was also checked in the study on the basis of different demographical
factors of respondents.
Table 6.18: Analysis of Post-Use Experiences of Customers on TEBSS
Variables N Mean Std. Dev.
Satisfaction 900 3.75 0.711
Post-use trust 900 3.41 0.754
Risk Perception 900 2.83 0.863
Source: Result of Primary Data Analysis Using SPSS
It can be seen that the customer satisfaction is high in TEBSS, mean
score (3.75, Std. Dev. 0.7). Which states that, customers are satisfied
with; the different types of services offered through TEBSS, speed of
services through TEBSS, they are satisfied with digitalisation of their
personal information, satisfied with safety and security measures of
TEBSS etc. Most of all, their perception is high, since they have overall
satisfaction feeling regarding TEBSS usage.

Chapter 6
308
Result of analysis shows that, level of customers’ post-use trust is also
high since the mean score (3.41 with Std. Dev. 0.75). It communicates that,
customers have the feeling that safe guards (encryption, passwords and
PIN etc.) are enough for comfortable use of TEBSS, security system
against un authorised access is appropriate, and TEBSS had the necessary
functionalities needed for performing online transactions. Moreover, one
reason also can be cited for the increased trust in TEBSS that, they might
have a prevalent level of trust in their banks before they assess the TEBSS
of that bank. These are the reasons that can be stated for the higher level
of post-use trust.
The mean value of risk perception shows that risk perception is low
(mean score 2.83) indicates the risk perception is low among majority of
the users. The result indicates that, users are not much concerned about
loss of control over privacy of account information, transaction failure,
losing money via fraud practices, frustration or psychological discomfort
in performing banking activities through TEBSS since they are practically
experienced in their TEBSS transactions. Risk perception generally
affects the behavioural intention negatively hence, it was very high in the
pre-adoption studies found earlier. But when customers are in the post-
adoption stage, their risk perception comes to low. Additionally, another
justification can be given that the respondents are already having adequate
level of trust in TEBSS. Hence their risk perception would be low.
6.4.1 Demographic Characteristics and Customer Satisfaction
In previous studies, some socio- demographic factors evidenced as
having significant effect on customer satisfaction in using banking

Relationship between Customers’ Perception on Adoptability, Post-Use Experiences and Continuance Intention
309
technologies. For the purpose of this study, some selected demographic
factors which are expected to make difference in the level of satisfaction
of customers in using TEBSS are analysed.
Customer satisfaction in using TEBSS is analysed based on some
user specific attributes like age, education, occupation and monthly
income in order to find out whether there is any significant difference in
the satisfaction of respondents according to their demographic features.
6.4.1.1 Age of Respondents and Satisfaction in using TEBSS
Age wise analysis on satisfaction of respondents is performed to
identify if there is any significant difference in the level of satisfaction of
respondents in using TEBSS according to their age. One-way ANOVA
test is applied on satisfaction and age of respondents and the result is
tagged below.
Table 6.19: Age of Respondents and Satisfaction in using TEBSS
Satisfaction Sum Squares
Df Mean Square
F Sig
Between Groups 7.968 4 1.992 3.986 0.003
Within Groups 447.277 895 0.500
Total 455.245 899
Source: Result of Primary Data Analysis Using SPSS
It is revealed from the Table (6.19) that; satisfaction in TEBSS is
varying in accordance with the age group of respondents. It is seen that,
the p<0.05, which implies satisfaction level of respondents with TEBSS is
significantly associated with the age group of respondents. It implies that,

Chapter 6
310
customers belong to different age groups are varying in their satisfaction in
using TEBSS in terms of types of services provided through TEBSS, speed
of services, digitalisation of personal as well as banking details etc. Post-hoc
analysis (Appendix.3.15) then performed to identify which age groups of
people are significantly varying in satisfaction. The analysis result shows that
significant difference exists in between the age group below 25 and 31- 40
(p<0.05), below 25 and above 50 (p<0.05). Since the younger generation is
more familiar with computer and internet, they are more interested to
perform banking activities through TEBSS. It supports the findings of
Yitbarek et al. (2013) that, gradual but steadily decline in the preference of
use of TEBSS leads to difference in their satisfaction as age grows.
6.4.1.2 Education of Respondents and Satisfaction in using TEBSS
Education wise analysis is carried out on user satisfaction with
TEBSS to assess the whether there is variance in user satisfaction in
TEBSS according to the education qualification of respondents. The
following table presents the one-way ANOVA result.
Table 6.20: Education of Respondents and Satisfaction in using TEBSS
Satisfaction Sum Squares Df Mean
Square F Sig
Between Groups 1.758 5 0.352 0.693 0.629 Within Groups 453.487 894 0.507 Total 455.245 899
Source: Result of Primary Data Analysis Using SPSS
It can be inferred from the Table (6.20) that; there is no significant
difference in customer satisfaction based on their education since the

Relationship between Customers’ Perception on Adoptability, Post-Use Experiences and Continuance Intention
311
p>0.05. It means that, educational qualification of respondents does not
make any significant difference in their satisfaction with TEBSS. Since
the customers are already adopted the TEBSS and started using the
TEBSS, they experienced the functionalities of TEBSS. Hence their
satisfaction might be based on their experiences in the quality of the
services they are availing through TEBSS. So, their education does not
have any significant association with their satisfaction.
6.4.1.3 Occupation of Respondents and Satisfaction in using TEBSS
Occupation wise deference is ascertained on respondents’ satisfaction
of TEBSS in order to understand whether there is any association between
satisfaction and the type of occupation they are currently doing. One-way
ANOVA is applied to examine the difference in the satisfaction of
respondents according to their occupation status. The analysis results are
presented below.
Table 6.21: Occupation of Respondents and Satisfaction in using TEBSS
Satisfaction Sum Squares Df Mean
Square F Sig
Between Groups 10.334 6 1.722 3.457 0.002 Within Groups 444.910 893 0.498 Total 455.245 899
Source: Result of Primary Data Analysis Using SPSS
Analysis result reveals that, there exists significant difference in
satisfaction of respondents based on their occupation. The p <0.05,
supports the significant difference in the satisfaction of respondents doing
different kind of jobs. Which means that, satisfaction of customers in

Chapter 6
312
different types of services offered through TEBSS, speed of service
delivery, digitalisation of personal as well as banking details, safety and
security measures are closely associated to their nature of job. The
customers who are having busy schedule of work may more attracted to
TEBSS since the speed of service delivery is high and it matches their job
profile. Post-hoc analysis (Appendix.3.16) then applied to know which
all the groups are significantly differs in their satisfaction. The post-hoc
analysis result reveals that significant difference exists between the
groups private employees and students (p<0.05) and agriculturists and
students (p<0.05). Since the private employees are more busy schedules
of life and work, they may have gained time and effort advantages
through the TEBSS.
6.4.1.4 Monthly Income of Respondents and Satisfaction in using TEBSS
Monthly income of the respondents was grouped in to six groups
starting from up to ` 20000 to above ` 60000. One-way ANOVA test is
employed to identify if there is any significant association satisfaction of
respondents and their monthly income. Given table depicts the analysis
results.
Table 6.22: Monthly Income of Respondents and Satisfaction in using TEBSS
Satisfaction Sum Squares
Df Mean Square
F Sig
Between Groups 11.347 5 2.269 4.570 0.000 Within Groups 443.898 894 0.497 Total 455.245 899
Source: Result of Primary Data Analysis Using SPSS

Relationship between Customers’ Perception on Adoptability, Post-Use Experiences and Continuance Intention
313
Result denotes that, significant difference in the satisfaction exists
between respondents who are having different amount of monthly
income. P value is 0.000 supports the difference between the groups are
significant. Generally, bank customers who are having frequent financial
dealings may depend on the TEBSS since it is very efficient for basic
banking transactions like fund transfer, payment services etc. Thus, for
the people who are having different scale of monthly income may differ
in their satisfaction with TEBSS. The post-hoc analysis (Appendix.3.17)
is executed later to identify which groups are significantly differ in their
satisfaction. The analysis revealed that, significant difference in
satisfaction exists among respondents included in the first category of
income (Up to ` 20000) and third category of income (` 30001-40000)
(p<0.05), first category of income (Up to ` 20000) and fourth category of
income (` 40001-50000) (p<0.05).
6.4.2 Demographic Characteristics and Post-Use Trust of Customers
Post-use trust is analysed based on the perception of customers
regarding the proficiency of security features of TEBSS. The descriptive
analysis performed later shows that, customers have favourable perception
regarding the safety and security options that are available in TEBSS. Trust
is generally a user specific attribute; hence it is checked against some
selected demographic factors to identify whether the post-use trust is varying
according to their demographic characteristics. Respondents’ age, education,
occupation and monthly income are selected for testing the difference in the
post-use trust. Following section deals with the analysis of post-use trust
based on demographical characteristics.

Chapter 6
314
6.4.2.1 Age of Respondents and Post-Use Trust in using TEBSS
Age wise analysis is performed on the post-use trust of respondents
in using TEBSS to analyse difference in the post-use trust of respondents
on TEBSS based on their age groups. The table below shows the one-way
ANOVA test result.
Table 6.23: Age of Respondents and Post-Use Trust in using TEBSS
Post- Use Trust Sum Squares Df Mean
Square F Sig
Between Groups 4.278 4 1.069 1.901 0.108
Within Groups 503.372 895 0.562
Total 507.650 899
Source: Result of Primary Data Analysis Using SPSS
It is evident from the table that; respondents’ age does not make any
significant difference in the post-use trust in using TEBSS since the
p<0.05. The safety and security features are common for all TEBSS, once
the customers are experienced this, their perception regarding trust
become favourable or otherwise un favourable. So, there is no age wise
difference in the perceptions regarding trust specifically about the pin or
password protection of transactions, digitalisation of transactions for un-
authorised access of account and bank details etc. It can be concluded
that post-use trust in TEBSS is not varying significantly among
respondents who are young, middle age or older adults.

Relationship between Customers’ Perception on Adoptability, Post-Use Experiences and Continuance Intention
315
6.4.2.2 Education of Respondents and Post-Use Trust in using TEBSS
Education wise analysis of respondents is carried out on post-use
trust of respondents in using TEBSS. One-way ANOVA test is applied
for the same and the result is discussed below.
Table 6.24: Education of Respondents and Post-Use Trust in using TEBSS
Post-Use Trust Sum Squares Df Mean
Square F Sig
Between Groups 1.322 5 0.264 0.467 0.801
Within Groups 506.327 894 0.566
Total 507.650 899
Source: Result of Primary Data Analysis Using SPSS
It is understood that, post-use trust on TEBSS does not
significantly varying between respondents who are educationally
qualified and not qualified. Since the ANOVA test shows the p value
0.801 (p>0.05), it is inferred that, post-use trust of customers is not
significantly differs according to the educational qualification of
respondents. Customers are started using the TEBSS with a minimum
level of knowledge, so their level of education is no-way related to their
post-use trust in TEBSS.

Chapter 6
316
6.4.2.3 Occupation of Respondents and Post-Use Trust in using TEBSS
Analysis of respondents’ occupation and post-use trust is performed
in order to test the association between post-use trust of respondents and
their type of occupation. One-way ANOVA test is used for the analysis
and the results are discussed below.
Table 6.25: Occupation of Respondents and Post-Use Trust in using TEBSS
Post-Use Trust Sum Squares Df Mean
Square F Sig
Between Groups 5.485 6 0.914 1.626 0.137
Within Groups 502.165 893 0.562
Total 507.650 899
Source: Result of Primary Data Analysis Using SPSS
It is recognised from the analysis that, there is no significant
difference in the post-use trust among the respondents who are doing
different types of jobs since the p>0.05. Which further states that,
occupation wise difference does not reflect in the level of post-use trust in
using TEBSS. Safety and security measures of TEBSS are inbuilt and it is
not particularly beneficial for any groups of customers based on their type
of job.

Relationship between Customers’ Perception on Adoptability, Post-Use Experiences and Continuance Intention
317
6.4.2.4 Monthly Income of Respondents and Post-Use Trust in using TEBSS
Monthly income wise analysis is performed on post-use trust of
customers in using TEBSS. One-way ANOVA test is used to test the
monthly income wise difference in the post-use trust of customers. The
table below discloses the analysis result.
Table 6.26: Monthly Income and Post-Use Trust in using TEBSS
Post-Use Trust Sum Squares Df Mean
Square F Sig
Between Groups 5.364 5 1.073 1.909 0.090
Within Groups 502.286 894 0.562
Total 507.650 899
Source: Result of Primary Data Analysis Using SPSS
It is inferred that; there is no significant difference in the post-use
trust of customers according to their monthly income. The test value of
significance is greater than p< 0.05, that implies monthly income of
respondents does not make any significant difference in post-use trust of
respondents in using TEBSS. The association between post-use trust and
monthly income of respondents is totally insignificant since the customers
are using TEBSS and their frequent practice made them to believe the
technology irrespective of their monthly income.
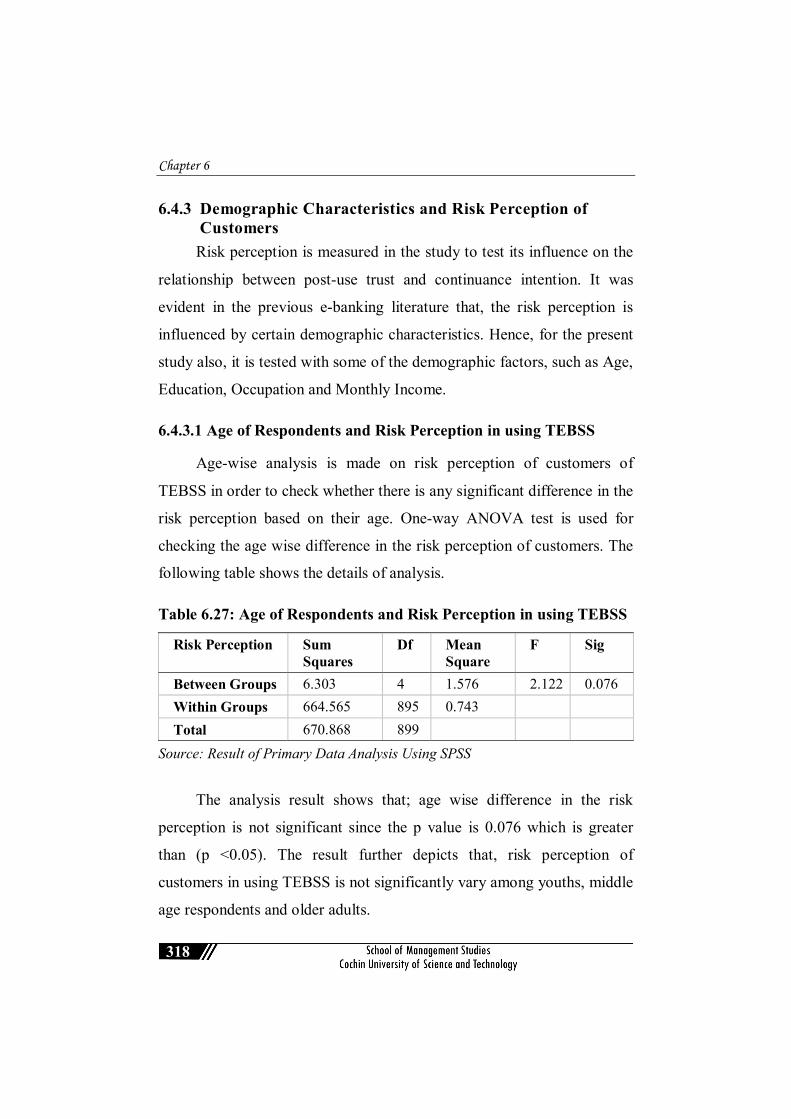
Chapter 6
318
6.4.3 Demographic Characteristics and Risk Perception of Customers Risk perception is measured in the study to test its influence on the
relationship between post-use trust and continuance intention. It was
evident in the previous e-banking literature that, the risk perception is
influenced by certain demographic characteristics. Hence, for the present
study also, it is tested with some of the demographic factors, such as Age,
Education, Occupation and Monthly Income.
6.4.3.1 Age of Respondents and Risk Perception in using TEBSS
Age-wise analysis is made on risk perception of customers of
TEBSS in order to check whether there is any significant difference in the
risk perception based on their age. One-way ANOVA test is used for
checking the age wise difference in the risk perception of customers. The
following table shows the details of analysis.
Table 6.27: Age of Respondents and Risk Perception in using TEBSS
Risk Perception Sum Squares
Df Mean Square
F Sig
Between Groups 6.303 4 1.576 2.122 0.076 Within Groups 664.565 895 0.743 Total 670.868 899
Source: Result of Primary Data Analysis Using SPSS
The analysis result shows that; age wise difference in the risk
perception is not significant since the p value is 0.076 which is greater
than (p <0.05). The result further depicts that, risk perception of
customers in using TEBSS is not significantly vary among youths, middle
age respondents and older adults.

Relationship between Customers’ Perception on Adoptability, Post-Use Experiences and Continuance Intention
319
6.4.3.2 Education of Respondents and Risk Perception in using TEBSS
One-way ANOVA is applied to check if there is any significant
difference in the risk perception of customers regarding the use of TEBSS
based on their level of education. Given below is the table showing one-
way ANOVA result.
Table 6.28: Education of Respondents and Risk Perception in Using TEBSS
Risk Perception Sum Squares Df Mean
Square F Sig
Between Groups 12.575 5 2.515 3.415 0.005
Within Groups 658.293 894 0.736
Total 670.868 899
Source: Result of Primary Data Analysis Using SPSS
The result of ANOVA reveals that risk perception in the usage of
TEBSS is significantly differs with the education level of respondents.
The p<0.05, at 5% confidence level indicates the significance of
association. Risk perception mainly depends on the ability of respondents
to assess the possible risk which may affect the usage of TEBSS. So, it is
clear that, the respondents are having varying level of education are differ
in their risk perception in the use of TEBSS. Post-hoc analysis is
performed as the difference is significant (Appendix 3.18). The post-hoc
analysis states that risk perception is significantly varies between
graduates and post-graduates (p<0.05).

Chapter 6
320
6.4.3.3 Occupation of Respondents and Risk Perception in using TEBSS
In order to check whether the risk perception of respondents in the
use of TEBSS has any significant association with the type of job they are
doing, one-way ANOVA test is applied. Following table shows the result
of analysis.
Table 6.29: Occupation of Respondents and Risk Perception in Using TEBSS
Risk Perception Sum Squares
Df Mean Square
F Sig
Between Groups 16.125 5 3.225 4.403 0.001
Within Groups 654.743 894 0.732
Total 670.868 899
Source: Result of Primary Data Analysis Using SPSS
The result of ANOVA reveals that, the risk perception of customers
is significantly associated with the type of occupation they are doing.
Since the p<0.05, it can be inferred that, the risk perception in using
TEBSS is significantly differs among respondents who are doing different
kind of jobs. It varies significantly between groups. In order to spot the
groups in which the significant difference exists, post-hoc analysis is also
carried out (Appendix 3.19). It is observed from the post-hoc analysis
that, private employees and students (p<0.05), agriculture respondents
and students (p<0.05) are the two groups in which the variance is
significant.

Relationship between Customers’ Perception on Adoptability, Post-Use Experiences and Continuance Intention
321
6.4.3.4 Monthly Income of Respondents and Risk Perception in using TEBSS
Monthly income wise analysis is also performed on risk perception
of customers in order to check whether there is any significant difference
exists among customers who have varying level of monthly income on
their risk perception. The one-way ANOVA test result is given in the
following table.
Table 6.30: Monthly Income of Respondents and Risk Perception in Using TEBSS
Risk Perception Sum Squares
Df Mean Square
F Sig
Between Groups 7.122 5 1.424 1.918 0.089
Within Groups 663.746 894 0.742
Total 670.868 899
Source: Result of Primary Data Analysis Using SPSS
The analysis result can be interpreted in such a way that, there is no
significant difference in the risk perception of customers in using TEBSS
according to their monthly income such that the p value is 0.089, which is
higher than the acceptance criterion (p< 0.05). So, it can be stated that, the
risk perception about TEBSS is not varying based on their monthly
income.
6.5 Analysis of Continuance Intention of Customers in Using TEBSS Customers’ continuance intention in using TEBSS is analysed in the
current study based on the data collected from the users of TEBSS.

Chapter 6
322
Continuance intention is the outcome variable of the study and it is
analysed in detail in the later sections. It is a primacy to know the
continuance intention of customers to use the TEBSS in future. For this
purpose, descriptive analysis is done on continuance intention and the
result is presented below.
Table 6.31: Analysis of Continuance Intention to use the TEBSS
Variable N Mean Std. Dev Continuance Intention 900 3.93 0.78
Source: Result of Primary Data Analysis Using SPSS
The Table (6.31) shows the descriptive analysis on continuance
intention, and it is seen that the mean value is 3.93 with a standard
deviation of 0.78, which indicates that, customers continuance intention
to use the TEBSS in future is high. It reveals, customers are strongly
intent to continue the use of TEBSS in future as well as they are willing to
extent their use of TEBSS for different purposes in future and also ready
to recommend the use of TEBSS to others. Since the customers are
strongly intend to continue the use of TEBSS, it is indeed to look on the
factors which are having significant influence on continuance intention.
In the following section, continuance intention is examined on the basis
of some of the selected socio-demographic factors.
6.5.1 Demographic Characteristics and Continuance Intention of Customers in using TEBSS Continuance intention is analysed based on some selected demographic
factors in order to gather the information on the association between these

Relationship between Customers’ Perception on Adoptability, Post-Use Experiences and Continuance Intention
323
factors and continuance intention. Continuance intention is analysed against
age, education, occupation and monthly income of respondents. One-way
ANOVA test is used for analysing the group wise difference in each case.
The following section involves the discussion of analysis results.
6.5.1.1 Age of Respondents and Continuance Intention to use the TEBSS
Age wise analysis is carried out on continuance intention of respondents
in using TEBSS in future. Aim of analysing the age wise difference in
continuance intention is to check whether there is any significant difference
in the continuance intention of respondents who are belongs to different age
categories. The table tagged below represents the analysis result.
Table 6.32: Age of Respondents and Continuance Intention to use the TEBSS
Continuance Intention Sum Squares
Df Mean Square
F Sig
Between Groups 12.260 4 3.065 5.022 0.001
Within Groups 546.201 895 0.610
Total 558.461 899
Source: Result of Primary Data Analysis Using SPSS
Analysis reveals that, there is significant difference in continuance
intention to use the TEBSS based on the age of respondents such that the
p<0.05. It implies that, customers’ continuance intention to use the TEBSS is
closely associated with their age. Their intention to continue the use of
TEBSS in future, their intention to extent the use of services, their
willingness to recommend the services to others are significantly different
according to their age. Once the difference is found as significant, it is

Chapter 6
324
obvious to know respondents in which age groups significantly differ in their
continuance intention. Thus, post-hoc analysis (Appendix 3.20) is also
carried out and post-hoc result shows that, significant difference exists
among the respondents in the age group below 25 and 26-30 (p<0.05), below
25 and 31-40 (p<0.05), below 25 and above 50 (p<0.05). Which further
states that customers who are youngsters and elder generations are mainly
differ in their continuance intention in using TEBSS.
6.5.1.2 Education of Respondents and Continuance Intention to use the TEBSS
Education wise difference is checked on continuance intention of
customers in using TEBSS by using one-way ANOVA. Respondents are
spread across various educational background; hence it is indeed to check
whether there is any association exists with the continuance intention to
use the TEBSS. The table given below included the result of analysis.
Table 6.33: Education of Respondents and Continuance Intention to use the TEBSS
Continuance Intention
Sum Squares
Df Mean Square
F Sig
Between Groups 3.629 5 0.726 1.170 0.322
Within Groups 554.831 894 0.621
Total 558.461 899
Source: Result of Primary Data Analysis Using SPSS
It is seen from the analysis that; education wise difference in
continuance intention is not significant. The p value is 0.323 indicates that
educational qualification of respondents does not make any significant
difference in their continuance intention in using TEBSS. Which further
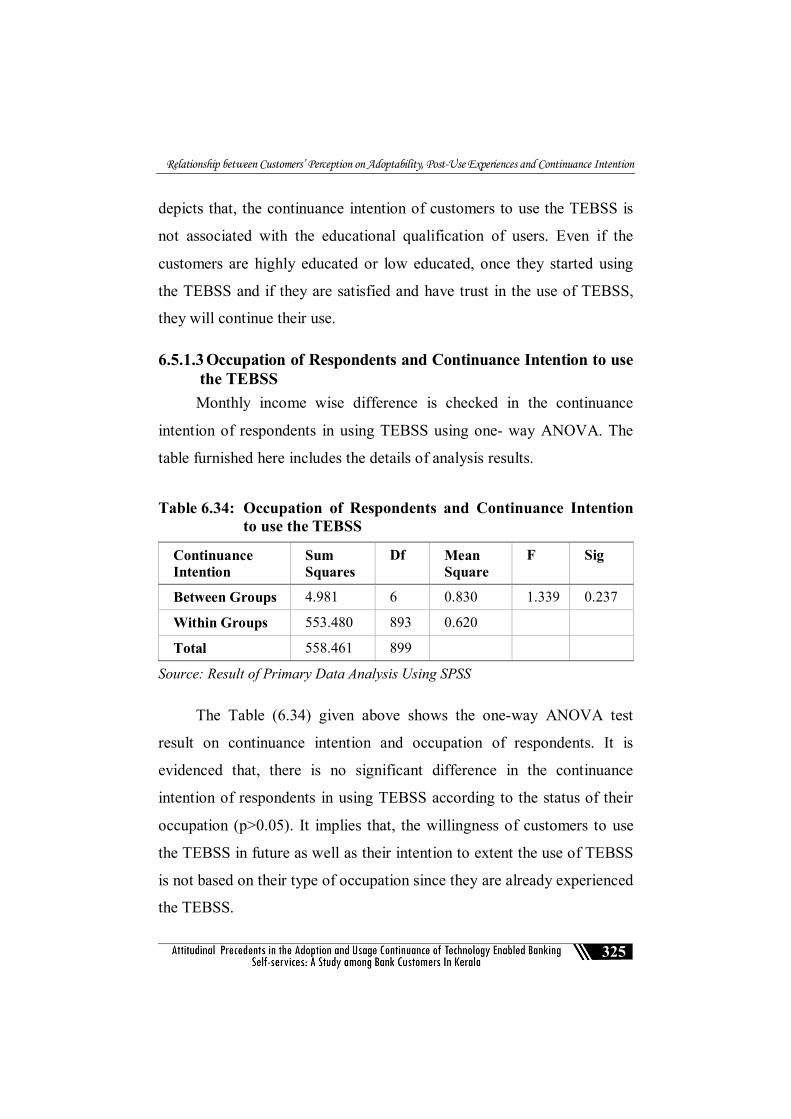
Relationship between Customers’ Perception on Adoptability, Post-Use Experiences and Continuance Intention
325
depicts that, the continuance intention of customers to use the TEBSS is
not associated with the educational qualification of users. Even if the
customers are highly educated or low educated, once they started using
the TEBSS and if they are satisfied and have trust in the use of TEBSS,
they will continue their use.
6.5.1.3 Occupation of Respondents and Continuance Intention to use the TEBSS Monthly income wise difference is checked in the continuance
intention of respondents in using TEBSS using one- way ANOVA. The
table furnished here includes the details of analysis results.
Table 6.34: Occupation of Respondents and Continuance Intention to use the TEBSS
Continuance Intention
Sum Squares
Df Mean Square
F Sig
Between Groups 4.981 6 0.830 1.339 0.237
Within Groups 553.480 893 0.620
Total 558.461 899
Source: Result of Primary Data Analysis Using SPSS
The Table (6.34) given above shows the one-way ANOVA test
result on continuance intention and occupation of respondents. It is
evidenced that, there is no significant difference in the continuance
intention of respondents in using TEBSS according to the status of their
occupation (p>0.05). It implies that, the willingness of customers to use
the TEBSS in future as well as their intention to extent the use of TEBSS
is not based on their type of occupation since they are already experienced
the TEBSS.

Chapter 6
326
6.5.1.4 Monthly Income of Respondents and Continuance Intention to use the TEBSS
Continuance intention in using TEBSS by customers and their
monthly income are analysed by using one-way ANOVA in order to
check if there is any significant difference in continuance intention among
respondents who have varying range of monthly income. Details of
analysis is given below.
Table 6.35: Monthly Income of Respondents and Continuance Intention to use the TEBSS
Continuance Intention
Sum Squares
Df Mean Square
F Sig
Between Groups 13.753 5 2.751 4.514 0.000
Within Groups 544.708 894 0.609
Total 558.461 899
Source: Result of Primary Data Analysis Using SPSS
It is inferred from the analysis that; continuance intention of
respondents in using TEBSS is significantly vary among respondents who
belongs to various income category since the p <0.05. It is clear from the
analysis that, the users’ intention to continue the use of TEBSS in future
as well as their intention to make the extensive use of TEBSS for
different purposes in future are depend on their income. It is quite true
that only those people who need to carry out the banking transactions
regularly are more attracted to TEBSS. The volume of banking
transactions of customers more or less depends on their level of income.
Income wise difference in continuance intention hence means that, those

Relationship between Customers’ Perception on Adoptability, Post-Use Experiences and Continuance Intention
327
customers who are having varying level of monthly income also varies in
their continuance intention to use the TEBSS. The post-hoc analysis
(Appendix 3.21) is performed to spot the respondents which income
category are mostly varying with others. Post-hoc analysis result signifies
that difference in continuance intention is exist among the respondents
who are having monthly income up to ` 20000 and ` 20001-30000
(p<0.05), up to ` 20000 and ` 30001-40000 (p<0.05).
Analysis result reveals that, post-use experiences of customers and
their continuance intention to use the TEBSS are vary across some
demographic factors. It is identified that; customer satisfaction is
significantly associated with the age groups of customers, different
occupation status, and those who are having varying scale of monthly
income. Whereas post-use trust does not vary based on any of these
demographic characteristics. But risk perception of customers in using
TEBSS is vary among respondents who are having different educational
qualifications as well as among those who are doing different types of
jobs.
Continuance intention is also significantly different among
respondents based on their age as well as their monthly income. It can be
summarised as the customers are already experienced the TEBSS and its
different functionalities, the demographic factors like age, education,
occupation and income of customers are not much influencing their post-
use behaviour.

Chapter 6
328
6.6 Confirmatory Factor Analysis of Variables
Confirmatory Factor Analysis is the part of structural equation
modelling, which is used to estimate the relationship between observed
indicators and their underlying constructs. It is also called as measurement
model. Measurement model assess how the latent constructs are measured
by the observed constructs and check the fit of the data to the hypothesised
model. The measurement model analysis explicates the result of the
structure of data to the specified model with reliability and validity
measures. Construct validity is measured in the model with confirmatory
factor analysis. CFA is used when the factor structure is known for the
latent construct and known that each item of the variables is associated to
one factor. CFA is known as the measurement model of the SEM as it
depicts the pattern of the observed variables for the latent constructs in a
hypothesised model. It is used to test the inter-relationship and covariance
with constructs. The main aim of performing the confirmatory factor
analysis is to test whether the data fit the hypothesised model. The
measurement model analysis starts with the identification of the
hypothetical model. Once the model is identified, the same is checked
with the model fit analysis tools. For checking the model fit, most
important factors to be considered are absolute fit, incremental model fit
and parsimonious fit. For each, model fit is identified by different values
of criteria.
6.6.1 Absolute Model Fit
Absolute model fit indicates how well a priori model fits the sample
data as well as demonstrates that which model has superior fit. The
Relationship between Customers’ Perception on Adoptability, Post-Use Experiences and Continuance Intention
329
absolute fit of the measure simply indicates that, how well a proposed
theory fits the data. For the absolute model fit, a model requires the chi-
square value, RMSEA and GFI values.
6.6.2 Chi-square Value
Chi square value is the traditional model fit indices, which explains
the overall fit of the identified model. Even though the chi square statistic
is used for assessing the model fit, more alternate methods of model fit
are used apart from relying on the chi-square statistics. Since the chi-
square test is sensitive to the sample size, the other alternate model fit
indices are taken for consideration. Chi-Square statistic nearly always
rejects the model when large samples are used (Bentler and Bonnet, 1980;
Jöreskog and Sörbom, 1993). On the other hand, where small samples are
used, the Chi-Square statistic lacks power and because of this, may not
discriminate between good fitting models and poor fitting models (Kenny
and McCoach, 2003).
6.6.3 RMSEA
The Root Mean Square Error Approximation (RMSEA) value is
one of the important model fit indices which is considered as one of the
most informative fit indices. The value of RMSEA indicates how well the
chosen parameter estimates would fit the population covariance matrix.
The value is good when it is less than 0.05, acceptable when it comes in
the range of 0.05 and 0.08, and bad if it comes 0.10 or more. It actually
measures the badness of fit, hence the value less than 0.08 is preferred for
good model fit. The RMSEA tells how well the model, with unknown but

Chapter 6
330
optimally chosen parameter estimates would fit the population covariance
matrix (Byrne, 1998).
6.6.4 GFI, AGFI & RMR
Goodness of Fit Index is another measure for absolute model fit.
GFI is the alternative to chi-square test. The model fit is identified by
analysing the Goodness of Fit Indices and the AGFI (Adjusted Goodness of
Fit Indices) values. AGFI tends to increase with sample size. As with the
GFI, values for the AGFI also range between 0 and 1 and it is generally
accepted that values of 0.90 or greater indicate well-fitting models. Given
the often-detrimental effect of sample size on these two fit indices, they are
not relied upon as a stand -alone index (Daire Hooper, 2008). Root Mean
square of Residual (RMR) indicates the square root of the difference
between the residuals of the sample covariance matrix and the
hypothesised covariance model. It is also a badness of fit indicator. If the
items of the questionnaire measured with different scales, like one item in
five -point scale and other in seven- point scale, the RMR value is
difficult to calculate. In this case Standardised RMR (SRMR) is
calculated and the value obtained in RMR is less than 0.05 indicates the
well fit model.
6.6.5 Incremental Fit indices (IFI)
Incremental fit indices are also known as relative fit indices or
comparative fit indices. Comparative fit indices are a group of indices
that do not use the chi-square in its raw form, but compare the chi-square
value to a baseline model (Daire Hooper, 2008). Comparative fit indices

Relationship between Customers’ Perception on Adoptability, Post-Use Experiences and Continuance Intention
331
or incremental fit indices also taken to consider the assessing the model
fit. Most common comparative fit indices are, Comparative Fit Indices,
Normed Fit Indices, and Tucker Lewis Index etc. All the comparative fit
indices of the model should be >0 .90 for better model fit.
6.6.6 Comparative Fit Indices (CFI)
Comparative fit indices of the hypothesised model with some
alternative models such as null or independent models. CFI compares the
fit of the targeted model with the independent model. An independent model
is the model in which, the variables are assumed to be are non- correlated. Fit
refers in this context as the difference between the covariance matrices
and predicted covariance matrices as represented by the chi-square index.
In short, it indicates that to what extent the hypothesised model better
than that of the independent model. Values that approach to 1 are treated
as good for the fit.
6.6.7 Normed Fit indices (NFI)
Normed Fit index shows the comparison of the chi-square value of the
model to the chi-square value of the null model. The null/independence
model is the worst-case scenario as it specifies that all measured variables
are uncorrelated. Value of statistic is ranging from 0 to 1 and the values
greater than 0.90 is treated as a good fit of the model.
6.6.8 Tucker Lewis Index (TLI)
TLI or Non- Normed Fit Index (NNFI) is another comparative
measure of goodness of fit. The TLI fit index is also comparing the
hypothesised model with the null, and the specification is that it is highly

Chapter 6
332
sensitive to the sample size. It may show a poor fit despite other
indicators showing the best fit in the case of small sample size. The
values of TLI also required near to 1 for better model fit.
6.6.9 Parsimony Fit Indices
Parsimony fit indices are another type of fit indices taken into
consideration in a saturated or complex model. In this case, the estimation is
based on the sample data which may lead to falsification or disconfirmation.
In this context, PGFI and PNFI measures are taken into consideration. Both
these measures are seriously penalizing for model complexity which results
in parsimony fit index values that are considerably lower than the other
goodness of fit indices (Daire Hooper, 2008). The structure and the
goodness of fit measures are necessary to analyse for the initial model to
provide the information about changes in the parameters and it gives the
theoretical justification of the theory underlying to the hypothesises
model.
6.7 Measurement Model Analysis
The measurement model in SEM defines the relationship between
the observed and unobserved variables. Measurement model depicts the
relationship between the latent variable and their measures. It is basically
a theoretical model based on which the path model is hypothesised. For
the present study, the measurement model comprises 8 factors, each
factor measured by a minimum of three and a maximum of seven
indicators. Each of these indicators are regressed with the concerned
factors. All these 8 factors shown to be inter-correlated hence the
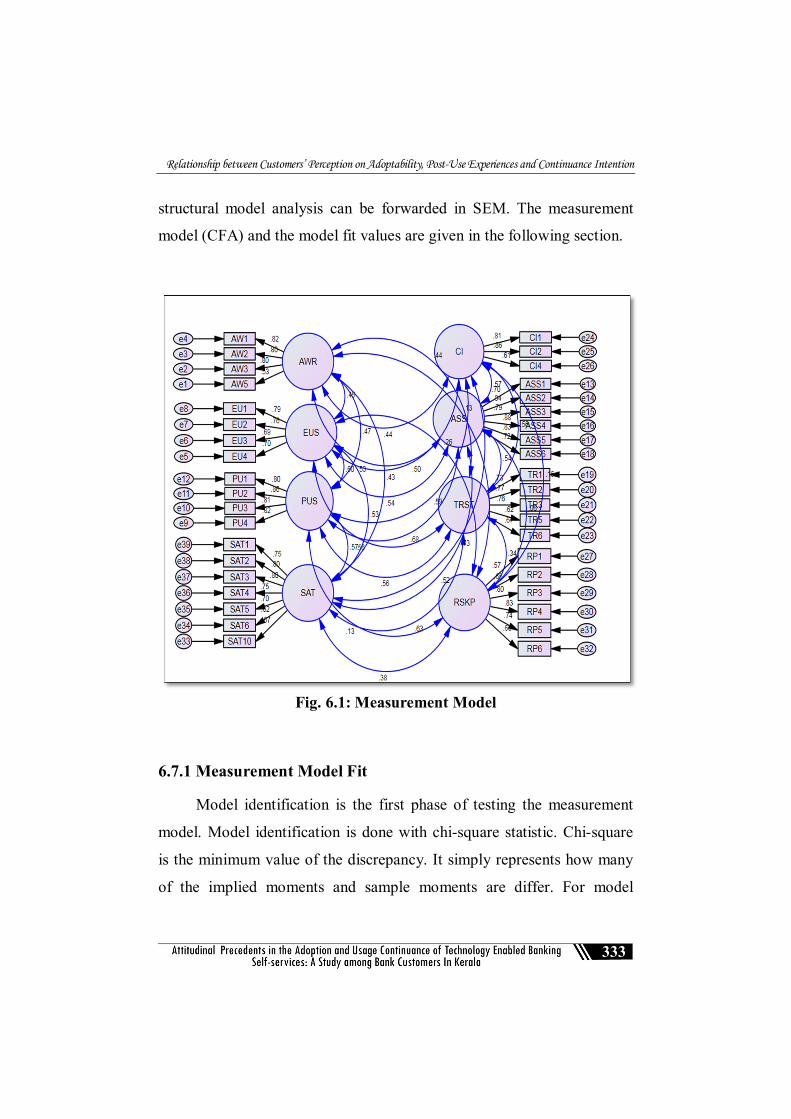
Relationship between Customers’ Perception on Adoptability, Post-Use Experiences and Continuance Intention
333
structural model analysis can be forwarded in SEM. The measurement
model (CFA) and the model fit values are given in the following section.
Fig. 6.1: Measurement Model
6.7.1 Measurement Model Fit
Model identification is the first phase of testing the measurement
model. Model identification is done with chi-square statistic. Chi-square
is the minimum value of the discrepancy. It simply represents how many
of the implied moments and sample moments are differ. For model
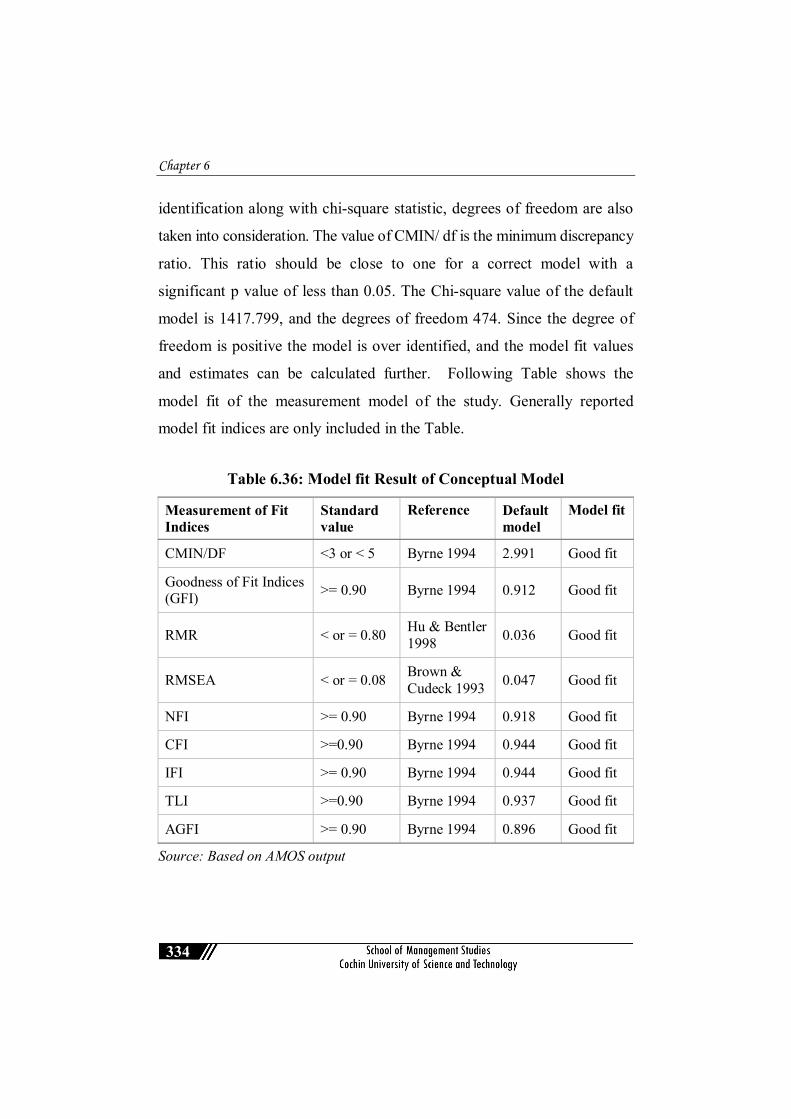
Chapter 6
334
identification along with chi-square statistic, degrees of freedom are also
taken into consideration. The value of CMIN/ df is the minimum discrepancy
ratio. This ratio should be close to one for a correct model with a
significant p value of less than 0.05. The Chi-square value of the default
model is 1417.799, and the degrees of freedom 474. Since the degree of
freedom is positive the model is over identified, and the model fit values
and estimates can be calculated further. Following Table shows the
model fit of the measurement model of the study. Generally reported
model fit indices are only included in the Table.
Table 6.36: Model fit Result of Conceptual Model
Measurement of Fit Indices
Standard value
Reference Default model
Model fit
CMIN/DF <3 or < 5 Byrne 1994 2.991 Good fit
Goodness of Fit Indices (GFI) >= 0.90 Byrne 1994 0.912 Good fit
RMR < or = 0.80 Hu & Bentler 1998 0.036 Good fit
RMSEA < or = 0.08 Brown & Cudeck 1993 0.047 Good fit
NFI >= 0.90 Byrne 1994 0.918 Good fit
CFI >=0.90 Byrne 1994 0.944 Good fit
IFI >= 0.90 Byrne 1994 0.944 Good fit
TLI >=0.90 Byrne 1994 0.937 Good fit
AGFI >= 0.90 Byrne 1994 0.896 Good fit
Source: Based on AMOS output

Relationship between Customers’ Perception on Adoptability, Post-Use Experiences and Continuance Intention
335
All the values of model fit are justifying the good fit of the model.
Most commonly reported model fit indices are Goodness of Fit Index
(GFI), RMSEA and Chi -square value. For the absolute fit, the chi square
value is checked and result indicates the model is over identified. For the
incremental fit, all the comparative fit indices are showing the acceptable
values. The parsimonious fit indices also indicated good fit indices of the
default model. Since the model fit indicators are showing the good model
fit, the estimates can be analysed further.
6.7.2 Factor Structure of the Constructs
Main aim of carrying out the confirmatory factor analysis is to
confirm the underlying factors of the construct being measured. It is a
method of checking the theoretical relationship depicted by the
hypothesised model. The confirmation procedure starts with the analysis
of strength of relationship of indicators with the latent constructs. For the
purpose of examining the results, standardised regression weights are
taken in to consideration with significant p values. The following path
estimates provides further explanation about the relationship of un-
observed variables with observed variables.

Chapter 6
336
Table 6.37: Standardised Estimates of Factor Loadings Constructs Item Estimates Awareness
AW4 0.530 AW3 0.804 AW2 0.802 AW1 0.816
Ease of Use
EU4 0.698 EU3 0.691 EU2 0.763 EU1 0.786
Usefulness
PU4 0.825 PU3 0.805 PU2 0.857 PU1 0.802
Accessibility
ASS1 0.700 ASS2 0.841 ASS3 0.791 ASS4 0.875 ASS5 0.835 ASS6 0.718
Trust
TR1 0.733 TR2 0.769 TR3 0.756 TR4 0.622 TR5 0.666
Continuance Intention
CI1 0.813 CI 2 0.858 CI3 0.614
Risk Perception
RP1 0.567 RP2 0.648 RP3 0.802 RP4 0.826 RP5 0.744 RP6 0.656
Satisfaction
SAT7 0.674 SAT6 0.622 SAT5 0.696 SAT4 0.751 SAT3 0.797 SAT2 0.800 SAT1 0.751
Source: Based on AMOS Output ** AWR- Awareness, EUS- Ease of Use, PUS- Perceived Usefulness, ASS- Accessibility, TRST- Trust, CI- Continuance Intention, RISP- Risk Perception, SAT- Satisfaction

Relationship between Customers’ Perception on Adoptability, Post-Use Experiences and Continuance Intention
337
The standard estimates of the items structure of the underlying
constructs are listed. All the indicators of the variables are loaded
significantly with the p value less than 0.05 in confirmatory factor
analysis. Standardised factor loadings of the construct awareness are
listed in the first. Factor loadings of the variable awareness shows, 0.816,
for the Aw1 item, 0.802 for second item, 0.804 for third item and 0.530
for fourth item. The standardised loading refers the strength of the
relationship of the indicators to the construct. A value above 0.5 is
acceptable but when it reaches the 0.70 or above, it indicates strong
relationship. Here all the values are above 0.70 indicating strongly predict
the construct except one Aw3. The Aw3 item also has the significant
influence on the construct since the value is greater than 0.50.
For the construct ease of use, all the items of indicators are showing
the significant standardised loadings. EUS1 (0.786), EUS2 (0.763), EUS3
(0.691) and EUS4 has 0.698 regression values. All the values are above 0.50
which indicates strength of the relation is good to explain the construct. For
the construct usefulness, the second item is observed as high impact on
predicting the construct (0.857). The fourth item PU4 (0.825), PU3 (0.805),
and for PU1(0.802), all the factor loadings are above the criterion.
The construct accessibility has six indicators and the strength of the
relationship after the CFA analysis shows that all indicators are
significantly predicting the construct. The indicator ASS-4 has the strong
regression weight indicating the maximum strength in explaining the
construct accessibility. The remaining indicators, representing the construct
as ASS5 (0.835), ASS2 (0.841), ASS3 (0.791), ASS6 (0.718), and ASS1

Chapter 6
338
(0. 700). The factor structure of the construct post-use trust is identified
with five indicators. All the indicators are showing as significant in
predicting the construct. The item TR2 shows the estimate of 0.769,
which have the high regression value indicating the robust relationship.
The other indicators also show a significant relationship with standardised
regression values of TR3 (0.756), TR1 (0.733), TR5 (0.666), TR4 (0.622).
All the regression co-efficient are above 0.50 acceptable criterion.
The factor structure of the construct risk perception is confirmed in to
six factors. The identified factor structure and the loadings of the factors are
significant and above the criterion. The indicator RP4 has the highest
regression weight (0.826). The other indicators explain the construct as RP3
(0.802), RP5(0.744), RP6(0.656), RP2 (0.648), and indicator RP1(0.567).
For the variable satisfaction, the indicators were seven. The indicators
of the construct have significant regression co-efficient with significant
p values. All the indicators are having a strong relation with the underlying
construct. The item 2 has highest significant regression value of 0.800, for
the item SAT3 (0.797), SAT1 and SAT4 (0.751), SAT5 (0.696), SAT
7- (0.674), SAT 6 (0.622). From the CFA analysis, it is clear that all the
indicators of constructs significantly explained the respective underlying
constructs in the hypothesised model. The theoretical relationship of the
hypothesised model is established as significant in the confirmatory factor
analysis.
6.7.3 Correlation between Variables
Correlation between the constructs is checked as the second step of
confirmatory factor analysis. Since the regression analysis of the variables

Relationship between Customers’ Perception on Adoptability, Post-Use Experiences and Continuance Intention
339
with indicators was done, correlation between the observed variables should
be ensured for confirming the measurement model. Following Table shows
the standardised estimates of the correlation of CFA analysis in Amos.
Table 6.38: Result of Correlations Between Variables in the Conceptual Model
Correlations Estimates P values AWR<- -> EUS 0.448 *** AWR<--> PUS 0.467 *** AWR <--> ASS 0.526 *** AWR<--> TRST 0.438 *** AWR<--> CI 0.436 *** AWR<--> RISP 0.128 *** AWR<--> SAT 0.429 *** EUS <--> PUS 0.596 *** EUS <--> ASS 0.543 *** EUS <-->TRST 0.560 *** EUS <-->CI 0.502 *** EUS<--> RISP 0.263 *** EUS <--> SAT 0.530 *** PUS <--> ASS 0.676 *** PUS <--> TRST 0.556 *** PUS <--> CI 0.595 *** PUS <--> RSKP 0.126 *** PUS <--> SAT 0.571 *** ASS <--> TRST 0.535 *** ASS<--> CI 0.575 *** ASS<--> RISP 0.075 *** ASS<--> SAT 0.516 *** TRST<--> CI 0.560 *** TRST<--> RISP 0.336 *** TRST<--> SAT 0.627 *** CI <--> RISP 0.155 *** CI <--> SAT 0.726 *** RISP<--> SAT 0.381 ***
Source: Based on AMOS output

Chapter 6
340
The correlations of the constructs were analysed for the best
explanation of the theoretical relationship among the constructs. All the
variables in the study are significantly correlated (p<0.05) among each other.
The association of the variables significantly proved in the measurement
model.
6.7.4 Reliability and Validity of Measurement Constructs
Assessing the uni-dimensionality, reliability and validity of the
measurement model is necessary to ensure before testing the structural
model. For assessing the validity and reliability of the measurement
construct convergent validity, discriminant validity and construct validity
to be ensured along with the measure of reliability. Reliability of model
explains how reliable the hypothesised measurement model in explaining
the intended constructs and indicators. Reliability of the measurement
includes two types of reliability, inter item reliability and construct
reliability. Internal reliability of the measurement constructs indicates
that, how well the measurement items are held together in measuring the
constructs. The internal reliability of items of the construct is measured
using Cronbach’s Alpha, in SPSS. The value > or = 0.5 is needed for
good reliability. A value greater than 0.7 is considered as a better measure
of internal reliability of the items of the construct. Composite reliability is
the measurement of internal consistency of the latent construct. A value
of CR > or = 0.7 is accepted for good reliability.

Relationship between Customers’ Perception on Adoptability, Post-Use Experiences and Continuance Intention
341
Table 6.39: Reliability of Measurement Constructs
Constructs Cronbach’s Alpha Composite Reliability (CR) AWR 0.823 0.832
ASS 0.909 0.912
PUS 0.893 0.893
EUS 0.824 0.825
SAT 0.886 0.888
TRST 0.834 0.836
RISP 0.857 0.859
CI 0.797 0.810
Source: Based on Primary Data Analysis
All the constructs are measured in more than three items scale,
except the continuance intention (it is measured in three items
standardised scale). The values of the Cronbach’s Alpha are above the
criterion for better reliability, hence the internal consistency of the items
of the construct is ensured. Composite reliability of the construct is also
analysed in the CFA the result shows that the composite reliability of all
latent constructs is above the criterion value of 0.70.
6.7.5 Measurement Model Validity
For the validity of measurement model, three types of construct
validity to be ensured, the convergent validity, discriminant validity and
nomological validity. Among the three measures of validity, convergent
and discriminant validity are statistically tested. Average Variance
Extracted (AVE) is the measure of convergent validity, which indicates
the average percentage of variance explained by the indicators on the

Chapter 6
342
constructs measured. An AVE > or equal to 0.5 is required for each
construct. For ensuring the discriminant validity, shared variance of the
construct with others is tested. Maximum Shared Variance is tested for
the discriminant validity. Maximum Shared Variance (MSV) and Average
shared variance should be less than Average Variance Extracted (AVE) to
support the validity. The AVE should be higher than that of MSV because,
the items of the constructs are internally correlated well than the items of
the constructs correlated with other constructs. It is based on the theory that
a latent variable should explain better the variance of its own indicators than
the variance of other latent variables. Once the measurement model validity
has been achieved, the structural model can be tested in the AMOS. The
following table shows the measurement model validity of the constructs.
Table 6.40: Measurement Model Validity
CR AVE MSW MaxR (H) RSKP AWR EUS PUS ASS TRST CI SAT
RSKP 0.859 0.508 0.145 0.877 0.713
AWR 0.832 0.559 0.277 0.857 0.128 0.748
EUS 0.825 0.541 0.355 0.830 0.263 0.448 0.736
PUS 0.893 0.677 0.457 0.895 0.126 0.467 0.596 0.823
ASS 0.912 0.634 0.457 0.921 0.075 0.526 0.543 0.676 0.796
TRST 0.836 0.506 0.393 0.843 0.336 0.438 0.560 0.556 0.535 0.711
CI 0.810 0.591 0.527 0.842 0.155 0.436 0.502 0.595 0.575 0.560 0.769
SAT 0.888 0.533 0.527 0.895 0.381 0.429 0.530 0.571 0.516 0.627 0.726 0.730
Source: Statwiki MS-Excel Validity Master Output
From the above Table (6.40), it is evidenced that, there is no
validity concerns for the model. The value of composite reliability (CR)
for all variables have values above 0.8 establishes the reliability of

Relationship between Customers’ Perception on Adoptability, Post-Use Experiences and Continuance Intention
343
variables since it is greater than the criterion value of 0.70. All the values
of Average Variance Extracted (AVE) are above 0.5 which seems to be
good enough to ensure the convergent validity. Discriminant validity is
also ensured since the MSV values are less than the AVE values and the
square root of AVE of each construct is higher than that of its highest
correlation with any other construct. The discriminant validity indicates the
extent to which a variable is distinct from other variables. To summarise
there is no validity issues with the hypothesised model under study.
6.8 Influence of Customers’ Perception on Adoptability of TEBSS on Continuance Intention to use the TEBSS The fourth objective of this study is to examine the influence of
customers’ perception on adoptability of TEBSS on their continuance
intention to use the TEBSS. Customers’ perception on adoptability is
ascertained in terms of customer awareness, accessibility of TEBSS, ease
of use of TEBSS and usefulness of TEBSS. Hence, four research
hypotheses are formulated based on this objective;
H1 Customers’ awareness of TEBSS has a significant influence on
their continuance intention to use the TEBSS.
H2 Customers’ perception on accessibility of TEBSS has significant
influence on their continuance intention to use the TEBSS.
H3 Customers’ perception on ease of use of TEBSS has significant
influence on continuance intention to use the TEBSS.
H4 Customers’ perception on usefulness of TEBSS has significant
influence on continuance intention to use the TEBSS.

Chapter 6
344
The structural model analysis in AMOS is performed in order to
attain the objective and to test the proposed relationship. The following
figure (6.2) represents the structural model with customers’ perception on
adoptability namely customer awareness, accessibility, ease of use and
usefulness as independent variables and continuance intention as
dependent variable.
Fig. 6.2: Structural Model of Customers’ Adoptability and Continuance
Intention to use the TEBSS
The model fit indices depicted in the Table (6.41) are confirm the fit
of hypothesised model. The fit indices CMIN/DF- 3.127, RMSEA- 0.049,
RMR- 0.033, GFI-0.944, CFI-0.964 are fall under the acceptable range of
values of criterion. Hence, the model fit is supported for the data.

Relationship between Customers’ Perception on Adoptability, Post-Use Experiences and Continuance Intention
345
Table 6.41: Fit Indices of the Model relating Customers’ Perception on Adoptability of TEBSS and Continuance Intention to use the TEBSS
Measurement Standard FIT Default model Model fit CMIN/df <5 3.127 Good fit
RMR <0.08 0.033 Good fit
GFI >0.90 0.944 Good fit
RMSEA <0.08 0.049 Good fit
CFI >0.90 0.964 Good fit
NFI >0.90 0.949 Good fit
RFI >0.90 0.940 Good fit
TLI >0.90 0.958 Good fit
IFI >0.90 0.965 Good fit
Source: Result of Primary Data Analysis using AMOS
Further, the hypotheses are tested using the path analysis in the
structural model. The following table (6.42) represents the hypothesis testing
results
Table 6.42: Result of Hypotheses Test between Customers’ Perception on Adoptability and Continuance Intention to Use the TEBSS
Path Standardised Estimates
P value C.R S. E R square
AWR CI 0.104 0.011 2.55 0.056 0.437 ASS CI 0.241 0.000 4.90 0.051
EU CI 0.148 0.001 3.24 0.049
PU CI 0.299 0.000 5.89 0.054
Source: Result of Primary Data Analysis using AMOS

Chapter 6
346
It is observed that, customer awareness has a significant positive
relationship (p<0.05), accessibility has a significant positive relationship
(p<0.05), ease of use has a positive relationship (p<0.05) and usefulness
has a significant positive relationship (p<0.05) with continuance intention
to use the TEBSS. Hence the hypotheses H1, H2, H3 and H4 are proved.
Customers perceptions on adoptability explains 43.7 per cent of variance
in explaining continuance intention to use the TEBSS (R2 0.437).
Customers continuance intention to use the TEBSS increases when
customers are more aware about the TEBSS. Awareness is not confined
to the simple user awareness about the use and benefits of using the
TEBSS; instead it is persons’ degree of attentiveness towards the new
system and ability to depict the belief in a certain time and space (Islam &
Gronlund, 2011). Since the customers are already started using the
TEBSS, they have the minimum level of knowledge about the use of
TEBSS, benefits and risk of using TEBSS etc.
Similarly, TEBSS ensure time saving, effortless and convenient
way of doing banking transactions. Thus, the user once experienced the
convenience in using these products and services, or when it is easy to use
and when it became more useful to them, they may have the tendency to
continue the use. When customers perceive more on the adoptability, their
intention to continue the use of TEBSS in future also will be strong. The
findings support the views of Wangpipatwong & Chutimaskul (2008);
Hamid & Zaidi (2016); Pikkarainen (2004).

Relationship between Customers’ Perception on Adoptability, Post-Use Experiences and Continuance Intention
347
6.9 Influence of Customer Satisfaction and Post-Use Trust in the Relationship between Adoptability and Continuance Intention to Use the TEBSS The fifth objective of this study was to test the mediating role of
post-use experiences namely customer satisfaction and post-use trust on
the relationship between customers’ adoptability of TEBSS and their
continuance intention. Mediation analysis is performed to examine the
direct and indirect effect of the post-use trust and satisfaction in the
relationship between adoptability of TEBSS and continuance intention.
Since, the AMOS output gives the results of combined indirect effect of
the variables, it was a necessity to look at the individual effect of these
intervening variables on each case. In order to explain the indirect effect
more precisely in each case, mediation analysis was carried out in
PROCESS. PROCESS allows the analysis of indirect effect by
controlling the effect of other variables. So, the specific indirect effect of
each of these variables through the mediators can be tested in PROCESS
MACRO. It is an extension to the statistical software SPSS developed by
Hays (2013), to analyse the indirect effects of the constructs in the model.
It is a tool for path analysis based on mediation and moderation as well as
their combination as conditional process models.
Similar to SEM, bootstrapping method is applied for mediation
analysis in PROCESS also. Bootstrapping is a method of resampling by
creating a sampling distribution to estimate sampling errors and confidence
intervals to confirm the mediation effect. The bootstrapping method was
developed by Preacher & Hays (2008). Additionally, it has the advantage
over Sobel’ test and can help determining the mediation effect with

Chapter 6
348
certainty. The basic assumption of SEM is the data normality but many of
the studies failed to satisfy the normality assumption. In this case the
resampling method has more power than a single sample method. The
original sample size of ‘n’ is treated as a miniature representation of the
population originally sampled (Hays, 2018). Regardless of the inferential
problem the essence of bootstrapping remains constant across applications.
Hence a separate mediation analysis in PROCESS is more specific over
extracting the combined effects in SEM using AMOS, if there is multiple
independent variables and multiple mediators.
Mediation in this study is identified as parallel mediation. For the
purpose of conducting the analysis in PROCESS macro, it included some
sequences of tests after identifying the concerned model templates. Here
the model template is identified as Model 4 and hence for testing the
parallel mediation in PROCESS, model 4 is taken as model template.
Once the model is identified from the templates, the relationships are
tested in following steps;
Step1- Independent variable and mediator 1
In this stage, direct relationship between independent variables and
first mediator (M1) is analysed using regression analysis. Relationship
is analysed by looking on p value.
Step 2- Independent variable and mediator 2
In this stage the regression analysis is again used to test the direct
relationship between independent variable and mediator 2 (M2).
Here also the p value is checked for testing the significance.

Relationship between Customers’ Perception on Adoptability, Post-Use Experiences and Continuance Intention
349
Step3- Mediators (M1, M2) to dependent variable
In this stage, the direct relationship of both the mediators to the
dependent variables are analysing using p value and regression weights.
Bootstrapping/ composition of the effects
Bootstrapping analysis is performed for testing the significance of
indirect effect by analysing the bootstrap confidence intervals of direct,
indirect and total effects. The bootstrap analysis mainly includes;
• Checking direct effect is significant or not
• Bootstrapping analysis on Indirect effect through M1 and M2
on DV
• Contrast analysis for testing the significance of the difference
of indirect effects
6.9.1 Analysis of the Effect of Awareness on Continuance Intention through Satisfaction and Post-use Trust
Mediation result of the relationship between awareness and
continuance intention through customer satisfaction and post-use trust is
interpreted through the procedure explained before. The conceptual model
for mediation analysis is given below.
Fig. 6.3: Mediation Model – Awareness and Continuance Intention (AWR-Awareness, TRST- Post-use trust, SAT- Satisfaction, CI- Continuance Intention)
AWR
TRST
SAT
CI

Chapter 6
350
Analysing the Significance of The Impact of Awareness on Customer Satisfaction and Post-use Trust
Table 6.43: Impact of Awareness on Satisfaction and Post-Use Trust Outcome Model Co-eff S. E T P LLCI ULCI Satisfaction Constant 2.5934 0.0967 26.8300 0.000 2.4037 2.7831
AWR 0.3207 0.0259 12.3619 0.000 2698 0.3716
Trust Model Co-eff S. E T P LLCI ULCI
Constant 2.2169 0.1025 21.6347 0.000 2.0158 2.4180
AWR 0.3308 0.0275 12.0290 0.000 0.2768 0.3848
Source: Result of Mediation Analysis in Process Macro
The Table (6.43) shows that customer awareness significantly
influences customer satisfaction and post-use trust. It examines to what
extend the awareness predicts both the satisfaction and post-use trust.
Since the p value p<0.05) in both cases, it is stated that the awareness
significantly predicts both the mediators.
Analysing the Effect of Satisfaction and Post-use Trust on Continuance Intention
Table 6.44: Impact of Satisfaction and Post-use Trust on Continuance Intention
Outcome- Model Co-eff S. E T P LLCI ULCI CI
Constant 0.9141 0.1211 7.5499 0.000 0.6765 1.1518
SAT 0.5621 0.0344 16.3176 0.000 0.4945 0.6297
TRST 0.1543 0.0325 4.7476 0.000 0.0905 0.2181
AWR 0.1040 0.0260 4.0018 0.001 0.0530 0.1550
Source: Result of Mediation Analysis in Process Macro

Relationship between Customers’ Perception on Adoptability, Post-Use Experiences and Continuance Intention
351
Second stage of mediation analysis is testing the relationship
between mediators and dependent variable. Considering the values in the
table, p values in both cases are significant (p<0.05). Therefore, it
indicates that customer satisfaction and post-use trust have significant
influence on continuance intention. Consequently, it is proceeding to
check the direct and indirect effects of awareness on continuance
intention in the presence of the mediators.
Analysing the Direct and Indirect Effects
Table 6.45: Direct Effect- Awareness on Continuance Intention
Effect S. E T P LLCI ULCI Direct effect 0.1040 0.0260 4.0018 0.001 0.0530 0.1550
Source: Result of mediation Analysis using PROCESS MACRO
The direct effect table (6.45) shows that, awareness on continuance
intention in the presence of satisfaction and post-use trust is significant
with the p<0.05. For analysing the indirect effects, the following analysis
is needed to be checked.
Table 6.46: Indirect Effects- Awareness on Continuance Intention
Effects Boot SE Boot LLCI Boot ULCI TOTAL 0.2313 0.0265 0.1812 0.2854
SAT 0.1803 0.0233 0.1380 0.2278
TRST 0.0510 0.0139 0.0257 0.0812
C1 0.129 0.027 0.076 0.182
Source: Result of Mediation Analysis in PROCESS MACRO

Chapter 6
352
The indirect effect is the influence that the independent variable
exerts on dependent variable through the mediators. The bootstrap
confidence intervals are examined to check the significance of effects.
The indirect effects of awareness on continuance intention through
satisfaction is significant since there is no zero value in between the
bootstrap intervals (0.1380 -0.2278). Similarly, the indirect effect of
awareness on continuance intention through post-use trust is also found as
significant for the reason that no zero included in between the bootstrap
intervals (0.0257-0.0812).
The last section of the table indicates the result of contrast analysis
(C1). It denotes the significance of difference in the indirect effects. It is
seen from the indirect effect analysis that; the influence of satisfaction is
strong when compared to post-use trust. Contrast analysis states that, this
difference in the indirect effect is also significant since there is no zero-
value included in between the bootstrap confidence interval of contrast
analysis (LLCI-0.076- ULCI-0.182).
Thus, it is inferred that customer satisfaction as well as post-use
trust significantly influence the relationship between awareness and
continuance intention. Awareness had significant effect on continuance
intention before adding the mediators whereas, the influence of awareness
through satisfaction and post-use trust is found as strong. Since the
influence of awareness on continuance intention is significant even at the
presence of influences of satisfaction and post-use trust, it indicates the
case of partial mediation. To summarise, the influence of satisfaction and
post-use trust is more crucial to the continuance intention decisions of

Relationship between Customers’ Perception on Adoptability, Post-Use Experiences and Continuance Intention
353
customers to use the TEBSS. Awareness of customers about TEBSS is
needed to continue the TEBSS once the customers are highly satisfied in
TEBSS, since the satisfaction is largely influencing the relationship
between awareness and continuance intention. Here, the hypotheses H5
and H6 are proved as;
H5 There exists a mediating effect of customers’ satisfaction on the
relationship between customers’ awareness and their continuance
intention to use the TEBSS.
H6 There exists a mediating effect of post-use trust of customers on the
relationship between their awareness and continuance intention to
use the TEBSS.
6.9.2 Analysing the Effect of Accessibility on Continuance Intention through Satisfaction and Post-use Trust
Mediation analysis is done with the next independent variable,
accessibility. The indirect effect of accessibility on continuance intention
is assessed through customer satisfaction and post-use trust. The tested
mediation model and results are tagged below.
Fig. 6.4: Mediation Model – Accessibility and Continuance Intention (ASS- Accessibility, TRST-Post-use trust, SAT- Satisfaction, CI- Continuance Intention)
ASS
TRST
SAT
CI

Chapter 6
354
Analysing the Significance of the Relationship of Accessibility on Customer Satisfaction and Post-use Trust
Table 6.47: Impact of Accessibility on Satisfaction and Post-Use Trust
Outcome Model Co-eff S. E T P LLCI ULCI Satisfaction constant 2.190 0.1015 21.588 0.000 1.9913 2.3896
ASS 0.4037 0.0256 15.7830 0.000 0.3535 0.4538
Trust Model Co-eff S. E T P LLCI ULCI
Constant 1.7120 0.1062 16.1188 0.000 1.5035 1.9204
ASS 0.4394 0.0268 16.4117 0.000 0.3868 0.4919
Source: Result of Mediation Analysis in PROCESS MACRO
From the Table (6.47) given above, it is observed that accessibility
significantly predicts both customer satisfaction and post-use trust. The p
values are less than the criterion p<0.05.
Analysing the Effect of Satisfaction and Post-use Trust on Continuance Intention
Table 6.48: Impact of Satisfaction and Post-use Trust on Continuance Intention
Outcome- Model Co-eff S. E T P LLCI ULCI CI
constant 0.7486 0.1175 6.3725 0.000 0.5181 0.9792
SAT 0.5160 0.0339 15.2176 0.000 0.4495 0.5826
TRST 0.1002 0.0324 3.0921 0.002 0.0366 0.1637
ASS 0.2321 0.0279 8.3241 0.000 0.1774 0.2869
Source: Result of Mediation Analysis in PROCESS MACRO
It is clear from the above table that the effect of satisfaction and post-
use trust on continuance intention is significant at p value 0.000 (p<0.05).

Relationship between Customers’ Perception on Adoptability, Post-Use Experiences and Continuance Intention
355
Checking the Direct and Indirect effects
Table 6.49: Direct Effect- Accessibility on Continuance Intention
Effect S. E T P LLCI ULCI Direct effect 0.2321 0.0279 8.3241 0.000 0.1774 0.2869
Source: Result of Mediation Analysis in PROCESS MACRO
The direct effect is significant in the presence of mediators since no
zero-value included in between the bootstrap confidence intervals. To
explain the mediation further, the indirect effect needed to be checked.
Table 6.50: Indirect Effects- Accessibility on Continuance Intention
Effects Boot SE Boot LLCI Boot ULCI TOTAL 0.2523 0.0250 0.2052 0.3030
SAT 0.2083 0.0230 0.1664 0.2562
TRST 0.0440 0.0172 0.0122 0.0793
C1 0.164 0.031 0.102 0.226
Source: Result of Mediation Analysis in PROCESS MACRO
Indirect effect of the construct accessibility on continuance intention
through customer satisfaction and post-use trust is significant. The influence
of satisfaction and post-use trust weakened the existing relationship between
accessibility and continuance intention. Whereas, the direct effect analysis
revealed that, the direct effect is significant at the presence of satisfaction
and post-use trust, hence it is understood as the case of partial mediation.
It is also evident that, the accessibility has strong indirect effect through
satisfaction and the contrast analysis supports the significance of this

Chapter 6
356
difference so that there is no zero value in the bootstrap intervals of
contrast analysis (LLCI 0.102- ULCI 0.226).
To be more specific, customer satisfaction and post-use trust
significantly influences the relationship between customers’ perception on
accessibility and continuance intention. It refers that, easy accessibility of
TEBSS is much needed for continuance intention to use the TEBSS for
those customers who are highly satisfied and have strong trust in TEBSS.
Customer satisfaction is highly influencing the relationship between
awareness and continuance intention. It means that easy accessibility of
TEBSS is more relevant to continue the use of TEBSS in future, once the
customers are satisfied with TEBSS. Here, the hypotheses H7 and H8 are
proved as;
H7 There exists a mediating effect of customers’ satisfaction on the
relationship between customers’ perception on accessibility of
TEBSS and their continuance intention to use the TEBSS.
H8 There exists a mediating effect of post-use trust of customers on the
relationship between their perception on accessibility and continuance
intention to use the TEBSS.
6.9.3 Analysing the Effect of Ease of Use on Continuance Intention through Satisfaction and Post-use Trust
The indirect effect of ease of use on continuance intention satisfaction
and post-use trust is ascertained through mediation analysis. The mediation
model and results are given in the following section.

Relationship between Customers’ Perception on Adoptability, Post-Use Experiences and Continuance Intention
357
Fig. 6.5: Mediation Model – Ease of Use and Continuance Intention (EU- Ease of Use, SAT- Satisfaction, TRST- Post-use trust, CI- Continuance Intention)
Analysing the Significance of the Relationship of Ease of Use on Customer Satisfaction and Post-use Trust
Table 6.51: Effect of Ease of Use to Satisfaction and Post-Use Trust Outcome Model Co-eff S. E T P LLCI ULCI Satisfaction constant 1.6078 0.1105 14.553 0.000 1.3910 1.8246
EU 0.2281 0.0280 8.146 0.000 0.1731 0.2830
Trust Model Co-eff S. E T P LLCI ULCI
Constant 1.1425 0.116 9.8123 0.000 0.914 1.3710
EU 0.275 0.0295 9.33 0.00 0.217 0.333
Source: Result of Mediation Analysis in PROCESS MACRO
It is revealed that ease of use predicts the both satisfaction and post-
use trust significantly since the p <0.05.
EU
TRST
SAT
CI

Chapter 6
358
Analysing the Effect of Satisfaction and Post-use Trust on Continuance Intention
Table 6.52: Influence of Satisfaction and Post-use Trust on Continuance
Intention Outcome- Model Co-eff S. E T P LLCI ULCI CI
constant 0.7094 0.1216 5.8324 0.00 0.470 0.948
SAT 0.5000 0.0350 14.26 0.000 0.431 0.568
TRST 0.0971 0.0332 2.9201 0.003 0.031 0.162
EU 0.0495 0.0291 1.700 0.089 -0.007 0.106
Source: Result of Mediation Analysis in PROCESS MACRO
Since the p values of the effect satisfaction is significant (p<0.05) as
well as post-use trust (p<0.05) is also significant. Hence the next step of
analysis can be applied.
Checking the Direct and Indirect Effects
Table 6.53: Direct effect– Ease of Use on Continuance Intention
Effect S. E T P LLCI ULCI Direct effect 0.049 0.029 1.700 0.089 -0.007 0.106
Source: Result of Mediation Analysis in PROCESS MACRO
The direct effect of ease of use of TEBSS on continuance intention
is found as insignificant at the presence of mediators. To explain the
mediation analysis more, the indirect effect is ascertained.

Relationship between Customers’ Perception on Adoptability, Post-Use Experiences and Continuance Intention
359
Table 6.54: Indirect Effects- Ease of Use on Continuance Intention
Effects Boot SE Boot LLCI Boot ULCI TOTAL 0.140 0.020 0.1022 0.1823
SAT 0.114 0.0182 0.0798 0.1514
TRST 0.026 0.0114 0.0047 0.0499
C1 0.087 0.023 0.043 0.134
Source: Result of Mediation Analysis in PROCESS MACRO
The indirect effect of ease of use on continuance intention through
satisfaction and post-use trust is found as significant since there is no zero
value in between the bootstrap confidence intervals. The direct effect of
ease of use of TEBSS on continuance intention after adding the mediators
was found as insignificant. Ease of use had significant direct effect on
continuance intention before adding the mediators. Hence, it can be
inferred that, satisfaction and post-use trust fully mediates the relationship
between ease of use and continuance intention. Which further implies
that, if the customers are satisfied as well as if they trust the TEBSS, ease
of use of TEBSS does not matter in their continuance use decisions. The
indirect effect of ease of use through satisfaction is high (Effect 0.1140)
while comparing the effect with trust (0.0267). The contrast analysis
provided in the last row (C1) of the above table (6.54) represents that the
difference in the indirect effect is also significant.
The result of analysis can be understood in such a way that, the
easiness of use of TEBSS influences the customers’ decision to continue
the use of TEBSS in future only if they are satisfied or they have trust in
TEBSS. Otherwise it can be stated that, customers may not continue the

Chapter 6
360
use of TEBSS by considering its easiness in usage, unless they trust the
TEBSS and they are satisfied with TEBSS. Satisfaction is more important
to continue the use of TEBSS when users perceive more easiness in use of
TEBSS. Hence, the hypotheses H9 and H10 are proved as follows;
H9 There exists a mediating effect of customers’ satisfaction on the
relationship between customers’ perception on ease of use of
TEBSS and their continuance intention to use the TEBSS.
H10 There exists a mediating effect of post-use trust of customers on the
relationship between their perception on ease of use of TEBSS and
continuance intention to use the TEBSS.
6.9.4 Analysing the Effect of Usefulness on Continuance Intention Through Satisfaction and Post-use Trust
The indirect effect of usefulness through satisfaction and post-use
trust on continuance intention is analysed. The following model depicts
the mediations model.
Fig. 6.6. Mediation Model- Usefulness and Continuance Intention (PU- Usefulness, SAT- Satisfaction, TRST- Post-use Trust, CI- Continuance Intention)
PU
TRST
SAT
CI

Relationship between Customers’ Perception on Adoptability, Post-Use Experiences and Continuance Intention
361
Analysing the Significance of the Relationship Usefulness on Customer Satisfaction and Post-use Trust
Table 6.55: Effect of Usefulness on Satisfaction and Post-Use Trust
Outcome Model Co-eff S. E T P LLCI ULCI Satisfaction Constant 1.6078 0.110 14.553 0.000 1.3011 1.8246
PU 0.330 0.028 11.459 0.000 0.273 0.387 Trust Model Co-eff S. E T P LLCI ULCI
Constant 1.1425 0.116 9.8123 0.000 0.914 1.3710 PU 0.318 0.030 10.480 0.000 0.2589 0.3761
Source: Result of Mediation Analysis in Process MACRO
It is evident that the p values are below 0.05 in each case. It
indicates that the effect of usefulness on customer satisfaction and post-
use trust is significant.
Analysing the Effect of Satisfaction and Post-use Trust on Continuance Intention
Table 6.56: Effect of Satisfaction and Post-use Trust on Continuance Intention
Outcome- Model Co-eff S. E T P LLCI ULCI CI
Constant 0.7094 0.121 5.833 0.000 0.470 0.948 SAT 0.500 0.035 14.268 0.000 0.431 0.568 TRST 0.097 0.033 2.920 0.003 0.031 0.162 PU 0.208 0.030 6.743 0.000 0.147 0.269
Source: Result of Mediation Analysis in PROCESS MACRO
Effect of satisfaction and post-use trust on continuance intention has
been proved as significant since the p values are under the criterion of
acceptance (p<0.05).
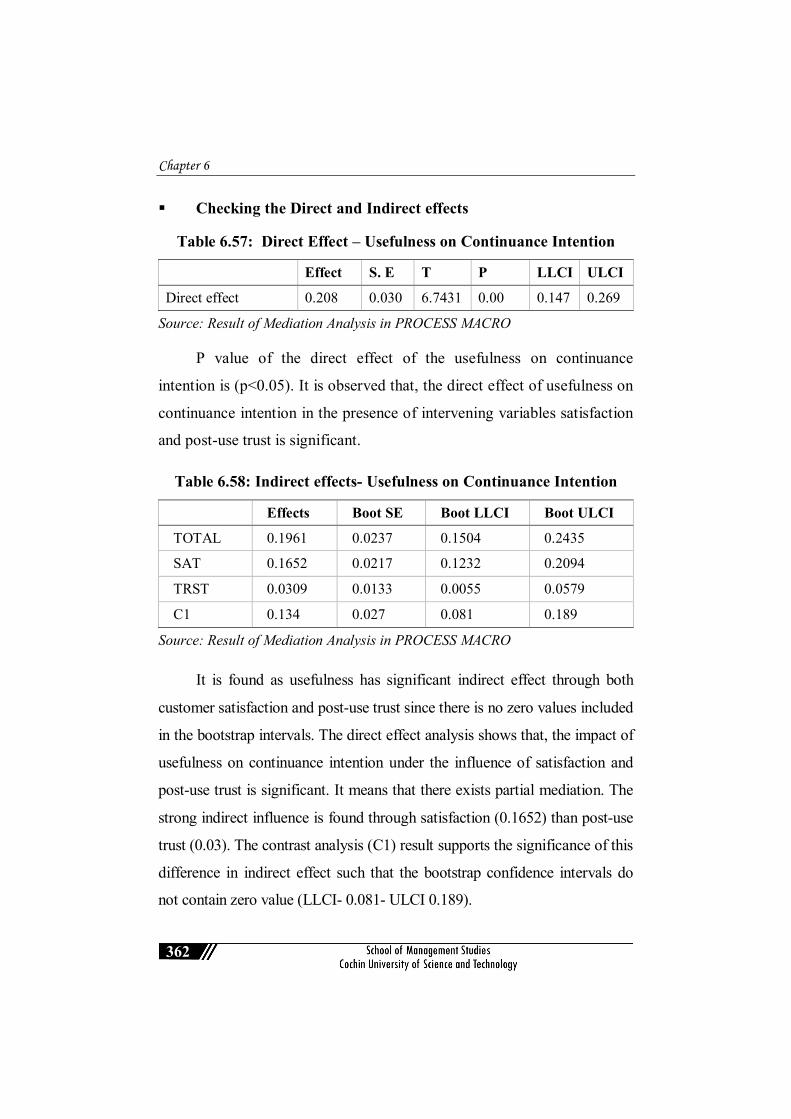
Chapter 6
362
Checking the Direct and Indirect effects
Table 6.57: Direct Effect – Usefulness on Continuance Intention
Effect S. E T P LLCI ULCI Direct effect 0.208 0.030 6.7431 0.00 0.147 0.269
Source: Result of Mediation Analysis in PROCESS MACRO
P value of the direct effect of the usefulness on continuance
intention is (p<0.05). It is observed that, the direct effect of usefulness on
continuance intention in the presence of intervening variables satisfaction
and post-use trust is significant.
Table 6.58: Indirect effects- Usefulness on Continuance Intention
Effects Boot SE Boot LLCI Boot ULCI TOTAL 0.1961 0.0237 0.1504 0.2435
SAT 0.1652 0.0217 0.1232 0.2094
TRST 0.0309 0.0133 0.0055 0.0579
C1 0.134 0.027 0.081 0.189
Source: Result of Mediation Analysis in PROCESS MACRO
It is found as usefulness has significant indirect effect through both
customer satisfaction and post-use trust since there is no zero values included
in the bootstrap intervals. The direct effect analysis shows that, the impact of
usefulness on continuance intention under the influence of satisfaction and
post-use trust is significant. It means that there exists partial mediation. The
strong indirect influence is found through satisfaction (0.1652) than post-use
trust (0.03). The contrast analysis (C1) result supports the significance of this
difference in indirect effect such that the bootstrap confidence intervals do
not contain zero value (LLCI- 0.081- ULCI 0.189).

Relationship between Customers’ Perception on Adoptability, Post-Use Experiences and Continuance Intention
363
The mediation analysis can be interpreted as, users’ intention to
continuance the use of TEBSS by considering its usefulness will be strong
when they are satisfied with the TEBSS as well as when they trust the
TEBSS. The enhanced usefulness perception about TEBSS strongly
favours their continuance intention to use the TEBSS when they are more
satisfied in the TEBSS. Hence, the hypotheses H11 and H12 are proved in
the following way;
H11 There exist a mediating effect of customers’ satisfaction on the
relationship between customers’ perception on usefulness of
TEBSS and their continuance intention to use the TEBSS.
H12 There exists a mediating effect of post-use trust of customers on
the relationship between their perception on usefulness of TEBSS
and continuance intention to use the TEBSS.
Thus, the mediation analysis can be summarised with the finding
that, the impact of customers perception on adoptability of TEBSS such
as awareness, accessibility ease of use and usefulness on continuance
intention have significantly influenced by customer satisfaction and
customer post-use trust. It further implies that once the customers started
using TEBSS, they are more concerned about post-use experiences. That
is why in all the cases, the influence of post-use experiences such that
satisfaction and post-use trust are proved as significant in the mediation
analysis. Additionally, the influence of ease of use on continuance
intention was found as fully mediated through satisfaction and post-use
trust. This might be because of the reason that, once they are adopted the
TEBSS, they will become familiar about the use of TEBSS. The frequent

Chapter 6
364
use makes them skilful at using the TEBSS. Thus, in the post-use stage,
they are not much considered the easiness of usage of TEBSS. Also, the
repeat use makes them comfortable in using TEBSS so their focus has
been shifted towards the post-use experiences.
6.10 Influence of Risk Perception of Customers in the Relationship between Post-use Trust and Continuance Intention to Use the TEBSS
The sixth objective of this study was to examine moderating role of
Risk perception on the relationship between customers’ post-use trust and
their continuance intention to use the TEBSS. Risk perception had
identified as significant factor which influences the behaviour of
respondents in using the technology-oriented banking products and
services. It was identified from the earlier literature that, the level of risk
perception significantly differs from one to another based on the
individual characteristics, belief and confidence they have attained after
the initial usage. Trust belief and the risk perception are connected and
the level of trust is compared with the perceived risk in situations. By the
moderation analysis, it is intended to test the impact of the customer post-
use trust on continuance intention under the influence of risk perception.
The moderation analysis was done in SPSS PROCESS. Risk
perception in the study is measured in continuous scale. So, the moderation
analysis is carried out in PROCESS MACRO. Moderation analysis in
PROCESS includes two steps. Firstly, the significance of interaction effects
is analysed. If there exits any significant interaction effect, then next step is
to identify under which conditions the interaction effect is significant.

Relationship between Customers’ Perception on Adoptability, Post-Use Experiences and Continuance Intention
365
The conceptual model for the moderation analysis of the study is
given below.
Fig. 6.7: Moderation Model (Abbreviations used; TR- Trust, RP- Risk Perception, CI- Continuance Intention)
Template shown above is the identified model for the moderation
analysis of the study. The identified template of model is model 1,
presented as figure 6.8. The statistical model for the study according to
the templates (Hayes, 2013) for moderation analysis in PROCESS is also
given as figure 6.9.
RP
TR CI
M
X Y
X
M
XM
Y
b1
b2
b3
eY 1
Fig. 6.8: Template of Model for Moderation Analysis
Fig. 6.9: Statistical Template for Moderation Analysis

Chapter 6
366
As described earlier, the first step of moderation analysis was to
identify if the interaction effect is existing between the constructs under
study. The following table gives the interaction effect of the risk
perception on the relationship between trust and continuance intention.
Table 6.59: Interaction Effect-Risk Perception
Co. eff S.E t p LLCI ULCI
RP_N 0 .2850 0.1099 2.5922 0.0097 0 .0692 0 .5007
TRST_N 0.6977 0.0925 7.5387 0.0000 0.5160 0.8793
int_1 -0.0761 0.0309 -2.4641 0.0139 -0.1367 -0.0155
R2 Change f df1 df2 p
x*w 0.0052 6.0720 1 0.896 0.0139
Source: Result of Moderation Analysis in PROCESS MACRO
The bootstrap intervals do not include the zero values in between
the interaction effect, so it is found as significant. It is also seen from the
table that; the interaction effect is negative. Which indicates that, risk
perception negatively influences the relationship between post-use trust
and continuance intention. But the R2 change due to interactions is found
as 0.0052, which signifies that the effect of interaction is low on the
relationship. The interaction effect is depicted in the R2 value and the
small R2 change implies the influence of moderator makes only slight
changes in the existing relationship between the independent variable and
the dependent variable. Since the interaction effect is significant, risk
perception of customer makes significant changes in the post-use trust
and continuance intention, but the effect of the moderator will be low as
R2 change is low. In order to analyse in which conditions, the moderation

Relationship between Customers’ Perception on Adoptability, Post-Use Experiences and Continuance Intention
367
effect is significant in the relationship between post-use-trust and
continuance intention, the conditional effect is analysed.
Table 6.60: Conditional Effect of Post- use Trust on Continuance Intention
RP Effect S. E T p LLCI ULCI 1.9698 0.5478 0.0415 13.1941 0.000 0.4663 0.6293 2.8337 0.4821 0.0325 14.8293 0.000 0.4183 0.5459 3.6975 0.4164 0.0426 9.7811 0.000 0.3328 0.5000
Source: Result of Moderation Analysis in PROCESS MACRO
The Table (6.60) shows the direct effect of post-use trust on
continuance intention at different levels of risk perception. The direct
effect of post-use trust on continuance intention is significant at all levels
of risk perception (High, Medium, Low). While looking the size of effects
in each level, it is evidenced that, there is no significant differences in the
effect of post-use trust on continuance intention at different levels of risk
perceptions (0.5478, 0.4821, and 0.4164 at low, medium and high levels
respectively). So, it is stated that the effect is significant at high, medium
and low levels of risk perception but it does not make large variance in the
relationship. To check the direction of effect, following table is provided.
Table 6.61: Direction of Effect of Risk Perception
Level of Risk Perception Effect of Post-use Trust on Continuance Intention
Low 0.5478 Medium 0.4821 High 0.4164
Source: Result of Moderation Analysis in PROCESS MACRO

Chapter 6
368
The moderation effect is negative in direction, which means when
risk perception at low level, the effect of trust on continuance intention is
highest (0.5478). Whereas when risk perception is at medium, the effect
of trust on continuance intention comes lower (0.4821). Once the risk
perception is at high level, the effect of trust on continuance intention
reaches lowest (0.4164). Thus, it can be concluded that, when a customer
perceives high risk; the relationship between trust and continuance
intention weakens. Whereas when the customer perceives low risk, then
the relationship between trust on his continuance intention in using
TEBSS strengthened. The effect of trust on continuance intention tends
to go lower in the case of higher risk perception and vice versa. The
analysis can be better understood from the following matrix.
Table 6.62: Matrix of the Conditional Effects
Level of Risk Perception Low Medium High
Level of Trust
Low 3.5131 3.5841 3.6551 Medium 3.9243 3.9464 3.968 High 4.3365 4.3087 4.2809
Source: Result of Moderation Analysis in PROCESS MACRO
The matrix presented above shows the effect of trust on continuance
intention at different levels of risk perception. It is understood that,
continuance intention is highest (4.3365), when their risk perception is low,
and trust is high. But the continuance intention is lowest (3.5131), even at the
low level of risk perception and customer possess low level of trust.
Customer who have high level of post-use trust, will have strong continuance
intention (4.2809) even at the high level of risk perception. The continuance
Relationship between Customers’ Perception on Adoptability, Post-Use Experiences and Continuance Intention
369
intention is low (3.6551) for those people, who possess low level of post- use
trust when their risk perception is high.
Moderation analysis result can be interpreted in such a way that,
the influence of risk perception significantly effects the customers trust
to continue the use of TEBSS. When customers perceive high level of
risk in the use of TEBSS their trust to continue the use of TEBSS would
be low. Whereas, when the customers perceive low level of risk in the
use of TEBSS, the effect of trust on continuance intention will be
strong. It is already evidenced that, when customers have strong trust in
using TEBSS, their intention to continue the use of TEBSS will also be
high. However, the moderation analysis evidenced that, the risk
perception negatively influencing the relationship as well as this
negative influence of risk perception is significant at all levels such as
low, medium or high level of risk perception. This means that, the risk
perception decreases the customers’ trust to continue the use of TEBSS.
Whether customers perceive low level of risk, or high level of risk it can
lowers the trust to continue the use of TEBSS. Hence, the analysis can
be summarised as the influence of customers’ post-use trust on their
continuance intention in using TEBSS is also depends on their risk
perception of TEBSS. Hence, the hypothesis H13 is proved as follows.
H13 The risk perception of customers has a moderating effect on the
relationship between post-use trust and their continuance intention
to use the TEBSS.

Chapter 6
370
6.11 Validation of the Proposed Model of the Study
The final objective of this study was to validate the conceptual
model proposed for the study. The conceptual model proposed in the
study includes customers’ perception on adoptability of TEBSS as
independent variables; namely customer awareness, accessibility, ease of
use, and usefulness of TEBSS and continuance intention to use the
TEBSS as dependent variable. Customer satisfaction and post-use-trust
portrayed as mediating variables in the model and risk perception of
customers using TEBSS as moderating variable. The empirical validation
of the model is done using Structural Equation Modelling in AMOS 23.
For the empirical validation of the model, measurement model validity
is to be ascertained first before moving to structural model analysis. The
measurement model including all variables in the study is presented in
the earlier part of this chapter and it was evidenced as good fit for the
data.
The conceptual model, including all variables except moderating
variable is tested in AMOS. Interactions among continuous latent
variable require non-liner constraints among the parameters. AMOS
assumes that, latent variables are continuous and does not support
non-liner parameter constraints. If the moderator is categorical variable,
then AMOS can be applied to model the interaction in terms of a multi-
group model (Rigdon & Schumacker, 1998). In this study, the moderating
variable is risk perception and it is measured in the continuous scale.
Hence the moderation analysis is separately done in PROCESS (which is

Relationship between Customers’ Perception on Adoptability, Post-Use Experiences and Continuance Intention
371
explained in the previous part of this chapter), and the proposed model
excluding the moderation effect is tested in AMOS 23.
The proposed relationships between variables are tested and the
integrated conceptual model assessment includes analysis of model fit,
analysis of relationship and hypothesis testing.
Fig. 6.10: Structural Model of the Study
(Abbreviations used in the model AWR; Awareness, ASS; Accessibility, EU; Ease of use, PU; Usefulness, SAT; Satisfaction, TRST; Trust, CI; Continuance Intention)
6.11.1 Assessment of Model Fit
The model is tested for ensuring the model fit. The model fit
summary and model fit indices are given in the following table. The chi-
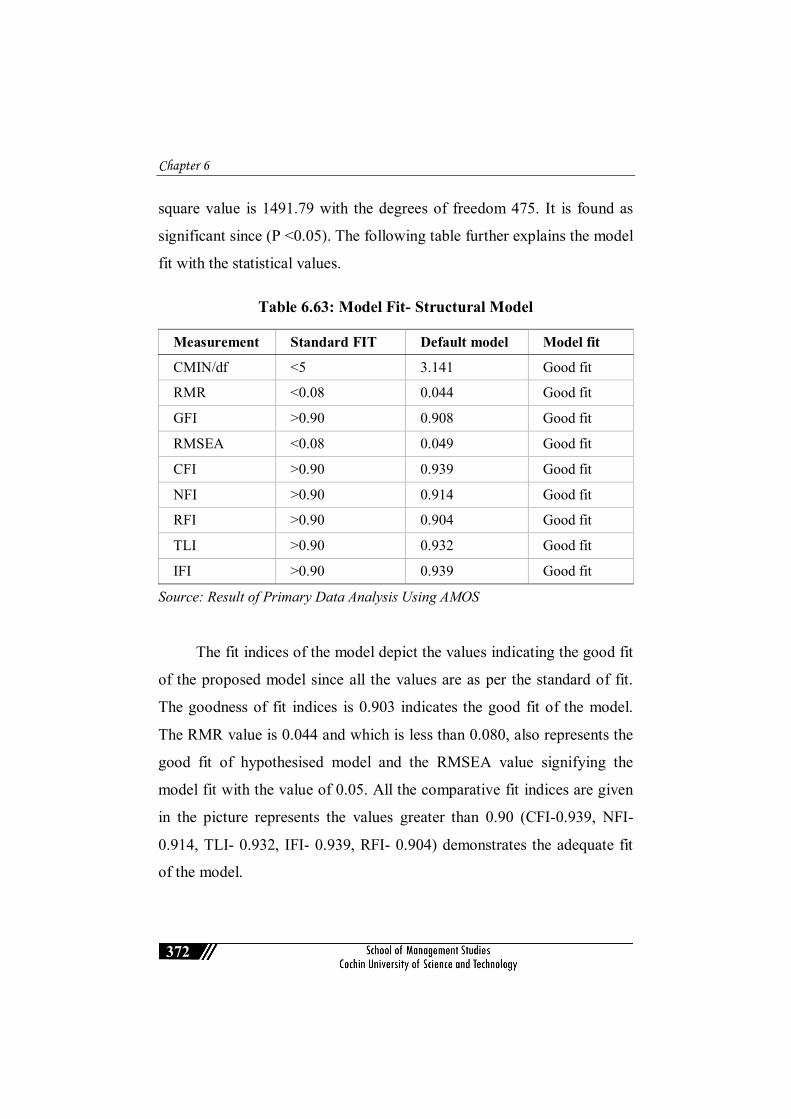
Chapter 6
372
square value is 1491.79 with the degrees of freedom 475. It is found as
significant since (P <0.05). The following table further explains the model
fit with the statistical values.
Table 6.63: Model Fit- Structural Model
Measurement Standard FIT Default model Model fit CMIN/df <5 3.141 Good fit
RMR <0.08 0.044 Good fit
GFI >0.90 0.908 Good fit
RMSEA <0.08 0.049 Good fit
CFI >0.90 0.939 Good fit
NFI >0.90 0.914 Good fit
RFI >0.90 0.904 Good fit
TLI >0.90 0.932 Good fit
IFI >0.90 0.939 Good fit
Source: Result of Primary Data Analysis Using AMOS
The fit indices of the model depict the values indicating the good fit
of the proposed model since all the values are as per the standard of fit.
The goodness of fit indices is 0.903 indicates the good fit of the model.
The RMR value is 0.044 and which is less than 0.080, also represents the
good fit of hypothesised model and the RMSEA value signifying the
model fit with the value of 0.05. All the comparative fit indices are given
in the picture represents the values greater than 0.90 (CFI-0.939, NFI-
0.914, TLI- 0.932, IFI- 0.939, RFI- 0.904) demonstrates the adequate fit
of the model.

Relationship between Customers’ Perception on Adoptability, Post-Use Experiences and Continuance Intention
373
6.11.2 Estimates of the Relationship
Once the model is proved as fit, it is advised to move forward for
testing the hypothesised relationship. Path analysis is used for checking
the significance of the relationship between constructs. The path analysis
is based on the regression analysis. The following table shows the regression
weights and the significance.
Table 6.64: Path Estimates- Structural Model
Regression weights (Default model) Paths Estimates S. E C.R P value R square AWR SAT 0.122 0.048 3.094 0.003
0.423 ASS SAT 0.124 0.047 2.644 0.008 EU SAT 0.254 0.043 5.644 0.000 PU SAT 0.287 0.047 5.834 0.000 AWR TRST 0.120 0.054 2.935 0.003
0.438 ASS TRST 0.162 0.053 3.330 0.000 EU TRST 0.301 0.049 6.364 0.000 PU TRST 0.220 0.052 4.348 0.000 AWR CI 0.036 0.049 0.980 0.327
0.593
ASS CI 0.160 0.049 3.596 0.000 EU CI 0.008 0.047 0.177 0.867 PU CI 0.135 0.049 2.824 0.005 SAT CI 0.502 0.047 11.588 0.000 TRST CI 0.082 0.042 1.983 0.047
Source: Result of Primary Data Analysis Using AMOS
The standardised regression weights of the relationships between
variables are analysed to examine the relationship. The path analysis
result shows that, customers’ awareness has significant relationship with
customer satisfaction (0.122, p<0.05). Knowledge about the benefits and
risks in using TEBSS might have influenced the use of the products and
Chapter 6
374
services in a systematic manner without failures or hurdles. Being aware
and updated with the technological changes will enhances the user
satisfaction through the extended use of the services.
Awareness of customers shows significant influence on customer
post-use trust (0.120, p<0.05), but no direct relationship was found on
customers continuance intention (p>0.05). The trust is developed through
the knowledge regarding specific attributes of the technology or from the
experienced functionalities. Awareness about updates, threats, security
issues are keeping the customers being conscious. Being conscious and
updated with new technology trends and new features, they can avoid
mistakes in performing activities through TEBSS and ultimately, they will
become experts in using the same. This might be a reason for awareness
having a significant influence on post-use trust. Whereas, it has no influence
on continuance intention since the customers are not much bothered about
the advanced level of information and security features of TEBSS once they
started using the TEBSS with their basic level of knowledge.
Similarly, the accessibility of TEBSS was found to have significant
influence on customer satisfaction (0.124, p<0.05), on post-use trust
(0.162, p<0.05) and on continuance intention to use the TEBSS (0.160,
p<0.05). When TEBSS are easily accessible as the customer needs it,
their satisfaction in the TEBSS will be high. Moreover, the technology
enabled banking self-services provide the easy access to the accounts,
customised way of doing activities and eliminates the intermediaries in
between the customer and bank, thereby TEBSS enhances the trust among
customer in technology enabled banking self- services.

Relationship between Customers’ Perception on Adoptability, Post-Use Experiences and Continuance Intention
375
Correspondingly, ease of use of TEBSS is evidenced as having
significant influence on customer satisfaction (0.254, p<0.05), on post-use
trust (0.301, p<0.05), but no direct influence is found on continuance
intention since the p value 0.867. When the customers experienced the
products and services as easy to use, they become easily adapted with the
technology. TEBSS are developed in a customised manner with good
interactivity. It requires only simple user experience to perform transactions.
This might be the reason for significant influence of ease of use on customer
satisfaction. Similarly, ease of use increases the credibility of services. When
the services are easy to perform, user will feel like they have a better
understanding about TEBSS and there is less need of control over the usage,
thus it become more reliable for the users. The more customers become
familiar with the innovation, the more they adhere to the decision of using
the same in future and their trust in that innovation also simultaneously
improves. However, users will not continue the usage of TEBSS only
because of TEBSS are easy to use unless they are satisfied or they have trust
in TEBSS. Once they are satisfied and they have trust in TEBSS, the easiness
of usage influences the continuance intention, otherwise not.
Additionally, usefulness of TEBSS found as having significant
influence on satisfaction (0.287, p<0.05) on post-use trust (0.220, p<0.05)
and on continuance intention (0.135, p<0.05). TEBSS are more sophisticated
since it increases the convenience in conducting banking transactions like
access of accounts for faster transfers, payment services etc. which all are
termed as emergency banking services and the customers are more
satisfied when they experienced increased usefulness of TEBSS. In the
same sense, user may have felt the usefulness in terms of reduced time,

Chapter 6
376
cost and efforts in using them. The cost-benefit analysis of new
technology in terms of performance of tasks may directed the users to
trust on TEBSS. Also, the usefulness is more important in the post-
adoption stage of TEBSS since majority of customers are attracted
towards the TEBSS only because of their increased usefulness perception.
In the model, customers’ perceptions on adoptability of TEBSS
explains 42.3 per cent variance in customer satisfaction. Even though the
satisfaction is significantly influenced by all perceptions, usefulness has
strong influence on satisfaction. Which emphasise that, increased
usefulness of TEBSS boost their satisfaction. Also, the tested model shows
that, the customers’ perceptions on adoptability explains 43.8 per cent
variance in post-use trust. Even if awareness, accessibility of TEBSS and
usefulness influence the post-use trust, the ease of use has strong
influence on post-use trust. As well, the model depicts that, customer
satisfaction and post-use trust has significant influence on continuance
intention with the values (0.502, p<0.05), (0.082, p<0.05) respectively.
It is evidenced that, customers perception on adoptability of TEBSS
namely accessibility and usefulness have significant influence on
continuance intention. User awareness and customers’ perception on ease
of use of TEBSS influence the continuance intention only through
satisfaction and post-use trust. When customers are well aware of the
technological trends, upgrades, improved features etc., it will enhance
their satisfaction as well as post-use trust through improved service
performance. This will result in their continuance intention to use the
TEBSS. In the same way, easiness in usage of TEBSS satisfies the

Relationship between Customers’ Perception on Adoptability, Post-Use Experiences and Continuance Intention
377
customers and improve their post-use trust it will finally reflect in their
future intentions to use the TEBSS. Whereas, the accessibility and
usefulness of TEBSS are more important in the post-adoption stage of
TEBSS in order to retain the customers with these technologies.
6.12 Chapter Summary
The first part of this chapter dealt with analysis of second and third
objective of the study. The demographic character wise analysis of
customers’ perceptions on adoptability, post-use experiences and
continuance intention are also included in this part. The second part of the
chapter discussed the analysis of remaining objectives. The analysis of
fourth objective was done by using structural equation modelling. The fifth
and sixth objectives are analysed using Process Macro 3. The mediation
and moderation analysis were applied to achieve these objectives. The final
objective analysis was explained in the last section and it was achieved
through structural equation modelling using AMOS.
References
[1] Ahmed (2016). Moderating Role of Perceived Risk and Innovativeness between Online Shoping Attitude and Intention . Journal of Basic and Applied Science Research, 310-323.
[2] Al-Maghrabi & Dennis (2011). Determinants of Customer Continuance Intention of Online Shopping. International Journal of Business Science and Applied Management, 42-65.
[3] Boone & Boone (2012) Analysing Likert Data. Retrieved from Journal of Extention: https://www.joe.org/joe/2012april/index.php November 22.11.2019.
[4] Daire Hooper (2008). Structural Equation Modelling: Guidelines for Determining Model Fit. Electronic Journal of Business Research Methods, 53-60.

Chapter 6
378
[5] Hayes (2012). PROCESS: A Versatile Computational Tool for Observed Variable Mediation, Moderation, and Conditional Process Modeling. Guilford Press.
[6] Hays (2018). Introduction to Mediation, Moderation and Conditional Process Analysis- A Regression based Approach. Neyork: The Gulford Press.
[7] Kyu Kim (2000). Initial Trust, Percieved Risk, and Adoption Intention of Internet Banking. 21st International Conference on Informtion System Research, 537-543.
[8] Li & Lau (2016). Validation of the Social Networking Activity Intensity Scale among Junior Middle School Students in China. PLOS one.
[9] Li & Luximon (2018). Understanding Older Adults’ Post-adoption Usage Behavior and Perceptions of Mobile Technology. International Journal of Design , 94-110.
[10] Likert (1932). A Technique For the Measurement of Attitude. Archieves of Psychology, 1-55.
[11] Podsakoff & MacKenzie (2003). Common Method Biases in Behavioral Research: A Critical Review of the Literature and Recommended Remedies. Journal of Applied Psychology, 879-903.
[12] Prasad (2016). Using Likert Type Data in Social Science Research: Confusion, Issues and Challenges. International Journal of Contemporary Applied Sciences , 36-49.
[13] Rigdon, & Schumacker. (1998). A Comparative Review of Interaction and Nonlinear Modeling.
[14] Rojer & Mayer (1995). Integrative Model of Organisational Trust. Academy of Management Review, 709-734.
[15] Sigerson & Cheng (2018). Scales for Measuring User Engagement with Social Network Sites: A Systematic Review of Psychometric Properties. Computer in Human Behaviour, 87-105.
…..…..

Discussion, Findings, Suggestions and Conclusion
379
This chapter deals with the summary of research findings on the basis
of the proposed objectives. The practical and theoretical implications
of the study are discussed followed by suggestions and conclusion.

Chapter 7
380
7.1 Discussion and Findings
7.1.1 Purpose and Extent of Usage of TEBSS
Analysis of purpose and extend of usage of TEBSS was the first
objective of this study. Before moving to the usage analysis, some basic
banking details of the respondents were obtained like with which bank
they are keeping their accounts and what type of account they use etc. It is
identified that, SBI and ICICI bank are the two banks where majority of
respondents keep their accounts. Also, most of the customers are actively
using their saving account for carrying out e-banking transactions.
7.1.1.1 Type of TEBSS Use
As a part of usage analysis, customers were asked to disclose their
years of use, type/ or combination of TEBSS, duration of use for different
purposes and intensity of usage of TEBSS. It is revealed that, many of
the customers have started using the TEBSS for more than 2-4 years
(37 per cent). Apart from that, respondents specified the combination of
TEBSS they are currently using. Almost 29 per cent of respondents affirmed
that they use the combination of debit cum ATM card, Mobile banking and
Internet banking as their most frequent combination of TEBSS. Following to
this, most of the customers use the combination of TEBSS; debit cum ATM
card, IB, MB and Credit Cards (25 per cent). In both of these groups,
majority of users are youths and mainly males. It was also identified that;
private employees are largely using TEBSS compared to other customers
doing different type of occupations.

Discussion, Findings, Suggestions and Conclusion
381
7.1.1.2 Purpose of Using TEBSS
Purpose of usage of TEBSS was analysed in detail and it was found
that payment service is the most common and frequently availing service
through TEBSS by majority of the respondents. Most of the respondents
stated that they generally use TEBSS for payment services including
payment of bills, taxes, service charges like electricity, gas, water, cabs
and other routine services which involves payment. While analysing the
payment services based on age of respondents, it was found that, young
customers are highly using TEBSS for payment services. It is obvious
that, youths are more attracted towards new technology compared to older
adults. Education wise analysis revealed that post-graduates and graduates
are largely using payment services through TEBSS, it might be because
of their understanding about TEBSS performance. Occupation wise
analysis on payment service usage through TEBSS revealed that, private
employees and students are largely utilising TEBSS for payment services.
Unlike any other occupation, private employees are under busy scheduled
conditions of work. In order to avoid the hesitation of standing on long
ques and to reduce the time taken for traditional banking services, they
always depend on new technologies. Similarly, income wise analysis on
payment service disclosed that, high income group customers are mostly
using TEBSS for the same.
Contrasting to any other services, a large majority of respondents
stated that they are sometimes using informational services. But when the
income wise analysis performed on informational service usage, it was
found that customers having monthly income above Rs. 50000 often

Chapter 7
382
using information services through TEBSS. It may be for the reason that,
those customers might have been regularly carrying out e-banking
transactions. Age wise analysis of the use of informational service found
that, youths are very much using it. Occupation and income wise analysis
of informational service usage revealed that, professionals are extensively
using TEBSS for informational purposes and high-income group
customers abundantly using this service through TEBSS. Since the
professionals and high-income group customers may need to carry out a
large volume of financial transaction through their bank account in their
personal as well as professional life, their frequency of use of TEBSS
might be high compared to others.
Usage analysis of TEBSS continued with the analysis of another
purpose, transferring funds. Post-graduates are largely using TEBSS for
transferring funds. However, fund transferring service through TEBSS is
often preferred by majority of respondents doing different category of
occupation except business and professionals. Business and professional
customers largely stated that they are always using TEBSS for
transferring funds. It is obvious that, they are handling huge amount of
cash dealings in their daily life compared to other types of occupation.
The income wise analysis of transferring funds also supports the same
conclusion.
As a part of usage analysis, booking services through TEBSS was
then analysed with different demographic factors. To a great extent, post-
graduates are highly using the TEBSS for booking services. Apart from
this, it is also revealed that, customers having high income are always
Discussion, Findings, Suggestions and Conclusion
383
using TEBSS for booking related purpose. Utilisation of TEBSS for
online shopping/ e-commerce activities observed and noticed that, low
educated customers are not preferring to use TEBSS for online shopping
or e-commerce activities. It might be because of their lack of knowledge
and confidence in handling the mature banking activities through an
unknown platform. They might not have the adequate knowledge about
the technological advancement already took place in the TEBSS even if
they are familiar with basic e-banking services. At the same time,
majority of the post-graduates as well as professionals are always using
the TEBSS for online shopping and e-commerce related activities. Hence
it can be concluded that, the frequency of online shopping/ e-commerce
activities through TEBSS is depend to a great extent of respondents’
education level. Likewise, private employees and students are largely
utilising TEBSS for online shopping/ e-commerce activities. Since the
private employees and students are largely comprising of youths, who are
more techno savvy and regularly updated with new technologies, they
possess the strong intention to use such technology-based services.
Lastly the usage analysis was done on the use of TEBSS for POS
transactions. Unlike other cases, the age wise analysis on use of TEBSS
for POS transactions denotes that, older adults are largely using TEBSS at
POS. Since it is one of the most common services that can be performed
through TEBSS, adults are attracted towards using this service. Income
wise analysis further reveals that, private employees, government
employees and business persons are extensively using TEBSS at POS.
The income wise analysis supports the same thing that customers who are
having fair income are highly using TEBSS at POS.

Chapter 7
384
7.1.1.3 Intensity of Usage of TEBSS
Analysis of intensity of usage of TEBSS revealed that, intensity of
use of TEBSS is high among majority of respondents and it is also
evidenced that, males are more intensive users of TEBSS than females. It
also noticed that, since the TEBSS are customised as user friendly,
respondents’ educational qualification does not make any differences in
the usage intensity of TEBSS. But the usage intensity differs among
customers who are at different age groups and doing different types of
jobs. Additionally, intensity of use of TEBSS mainly varying between
students and government employees. It is case and clear that, the government
employees need more banking related transaction compared to students. So,
their intensity of use of TEBSS may not be similar to students. Similarly,
customers having different monthly income also differs in their usage
intensity. The customers who belongs to the category of high-income group
needs to carry out more banking related transactions than the customers who
are having low income. So, their intensity of usage might be high and they
may have excessive transactions to carry out through TEBSS.
7.1.2 Customers’ Perceptions on Adoptability of TEBSS
Customers’ perception on adoptability of TEBSS in terms of their
awareness about TEBSS, accessibility, ease of use and usefulness of
TEBSS were analysed. Awareness on TEBSS is found as moderately
high. All respondents being the users of TEBSS was having basic level of
understanding about TEBSS and its benefits, risks etc. It was expected to
have excessively high level of awareness among many respondents who
are already practicing the services, but it was not as expected. It might be

Discussion, Findings, Suggestions and Conclusion
385
because of the lack of adequate knowledge about updates and advancement
in technology. In order to improve the usage experiences as well as to
prevent the safety and security threats, the increased level of awareness is
necessary. The analysis result also supports the importance of creating
knowledge about different aspects of TEBSS, since the user awareness
significantly different for customers who are highly educated. No other
factors make significant difference in awareness level of customers other
than education.
Difference in the awareness of customers with different demographic
characteristics have been analysed in this study and revealed that, level of
awareness does not vary across age, occupation and monthly income but
significantly vary between customers having different educational
qualification. A large growing body of literature had investigated the
adoption of technology in banking sector and acknowledged that lack of
awareness as the main barrier to adoption especially in rural areas because of
lack of education and proficiency in using the same.
Customers believe that, TEBSS are available anytime, anywhere
and it ultimately reduced their effort in terms of time and cost in
performing banking activities. They can use the TEBSS by sitting at
home or office and carry out banking transactions if they have a smart
phone and internet connection. This enhanced accessibility feature makes
them believe that, TEBSS is highly accessible to them. Accessibility of
TEBSS seems to be varying against the occupation status of users.
Specifically, it varies among government employees and private employees.
It is because of private employees are more likely to use these types of

Chapter 7
386
services since they are proficient enough for accepting and updating
changes. Accessibility was considered the easy availability of services in
terms of time, place and use dimensions, hence they feel enhanced
accessibility in their dynamic working conditions with efficient system of
networking when compared to government employees.
Additionally, the respondents in this study had the opinion that,
TEBSS are very easy to use. Most of the TEBSS are developed in a
customised manner with good interactivity, so the user can easily become
skill full at performing transactions through TEBSS. This also resulted in
their belief that, easiness in usage of TEBSS is high. Ease of use
perception of users about TEBSS is found as varying according to the age
of customers who are using it. The difference is found significant in
between youngsters and elder generations. It is certain that, younger
generations are ready to use modern technologies than elder generations.
For younger generation, it is very easy to learn and use most modern
technologies and equipment compared to old generations.
Customers perceive usefulness of TEBSS as high, since the use of
TEBSS enhanced their efficiency in carrying out banking transactions.
Speed of service delivery, reduced time and effort in performing
transactions, easy accessibility at anywhere and anytime are the unique
features of TEBSS. These characteristics make customers to choose
TEBSS over the traditional banking even though they exhibited a
significant level of comfort and familiarity in traditional banking. Result of
the analysis on usefulness shows significant variance according to the age,
occupation and income of customers. Based on the nature of job, customers

Discussion, Findings, Suggestions and Conclusion
387
differ in their banking requirements. Those customers who need to carryout
banking transactions as routine can avoid wasting time and effort in
traditional banking by the use of TEBSS. So, they perceive high usefulness
compared to other customers who are not in the similar type of job.
Likewise, the income of customer is another important factor which lead to
use of TEBSS. The customers, who are handling large amount of money,
need TEBSS for performing the routine transactions like payments,
transfer, booking services as well as e- commerce related activities etc.
7.1.3 Customers’ Post- Use Experiences of TEBSS
Post-use experiences of customers in using TEBSS namely
satisfaction, post-use trust and risk perception are analysed in this study.
Satisfaction of respondents is found as high (Mean score 3.75) among the
majority of users of TEBSS. Since TEBSS are characterised with speed,
accuracy, increased efficiency etc., the satisfaction of customers is
influenced by these elements because most of these service expectations
are getting fulfilled through TEBSS. It is also found study that, satisfaction
on TEBSS vary across their age, occupation and income but does not vary
across education. Satisfaction is found as significantly different among
customers who belongs to different age groups mainly younger respondents
and older adults. It also shows variance according to the occupation of
respondents mainly private employees and students and agriculturists and
students. In addition to that, satisfaction is varying across different
income groups and significant difference exists in between low-income
group and high-income group.

Chapter 7
388
In this study, customers’ post-use trust in TEBSS was also found as
high (Mean score 3.41). Unlike the perceived trust in TEBSS, post-use
trust shows a different result. It is good thing that the customers are
having a positive belief regarding trust in using TEBSS. The analysis of
demographic characteristics wise difference on post-use trust showed
invariance across age, education, occupation and monthly income. Since
the post-use trust depends on technological aspects, the demographic
differences found to have insignificant effect on it.
Risk perception in the use of TEBSS was another factor analysed in
the study and it is found as low (Mean score 2.83). Since the post- use
trust in TEBSS already seen as high, it was sure that risk perception
would not go too high. It was also identified perception of ease of use of
TEBSS is high among respondents, once the TEBSS is become easy to
use, customers have the feeling that there is not much complexity in the
use of TEBSS, hence there is no much risk involved in the performance
of transactions. Analysis result showed that, risk perception significantly
varies across education and occupation, but not with age and their
monthly income. It is obvious that, education qualification influences the
risk perception. Previous studies also support the view that education
makes significant difference in risk perception. As higher educational
qualification bringing the attention towards new technological updates,
threats and security issues etc., customers can minimise their risk in using
TEBSS (Muche & Sharma, 2017).

Discussion, Findings, Suggestions and Conclusion
389
7.1.4 Customers’ Continuance Intention in Using TEBSS
The continuance intention in using TEBSS among majority of
respondents is found as high (Mean score is 3.93, Table 6.31). It indicates
that majority of users are willing to continue the use of TEBSS and are ready
to extent the use to maximum possible purposes. Since their satisfaction is
high, post-use trust is high and their level of risk perception is low they are
expected to continue the use of such services in future also. From the current
study, it was evident that, most of the respondents are only using certain
common services regularly through TEBSS. Study also highlighted that they
are satisfied with those services and they are willing to continue the use also.
Thus, the outreach of these services can be further enhanced by creating
more user awareness (technical as well as non-technical) and by developing
customised products and services in order to make them explore additional
services.
Continuance intention has been checked with different demographic
characteristics and found that, continuance intention does not vary across
education and occupation, but vary across users’ age and income. Rather
than senior citizens, youths are more attracted towards technology.
Technical competence, high penetration of latest smartphones with
variety of features and high-speed internet availability etc. might have
its role in their usage behaviour. The income wise analysis supports that,
customers having high income tends to continue the use of TEBSS.
7.1.5 Influence of Adoptability of TEBSS on Continuance Intention
The main aim of this study was to analyse the continuance intention
of the customers on TEBSS. Once the penetration of internet-based

Chapter 7
390
technologies became deeper, it is more relevant to study the long-term
behaviour of the users on these technologies. The long-term behaviour is
determined by many factors in the case of a new technology adoption
context. Hence, the influence of customers’ perception on adoptability of
TEBSS in terms of awareness, accessibility, ease of use and usefulness on
continuance intention had been checked. The first four hypotheses (H1 to
H4) of this study were about to test the influence of adoptability of TEBSS
on continuance intention. All the four hypotheses are proved in the study.
The influence of user awareness on continuance intention in using
TEBSS is revealed that, user awareness has significant impact in
determining continuance intention (β=0.104, p<0.05, Table 6.42). Since
the technologies are getting updated frequently, user awareness is
inevitable for customers’ positive intention to continue the use of TEBSS.
Un awareness to expand the existing knowledge in new technology
adoption context is one of the important issues that was pointed out by
many researchers earlier (Mahatanankoon & Vila-Ruiz, 2007). Hence, for
the long-term user decisions in technology adoption context, awareness is
significant in the post-adoption stage especially for continuance intention.
It was noticed that the accessibility of TEBSS has significant
influence on continuance intention (β=0.241, p< 0.05). When a customer
feels that the products and services are easily accessible, or available at
anywhere anytime, without any limitation of time, place, they will be
probably use it always in future. That might be the reason for the strong
influence of accessibility on continuance intention. It was also observed
in the study that, customers’ perception on ease of use of TEBSS and

Discussion, Findings, Suggestions and Conclusion
391
usefulness had significant influence on continuance intention (β values
0.148, 0.299 at p<0.05). Consistent with TAM, higher perception on ease
of use and usefulness directly enhances the user intention to continue the
use of TEBSS. Perceived usefulness is the strongest predictor of
continuance intention (Regression value 0.29, Table 6.42). This finding
yields the conclusion that, usefulness of TEBSS is more important to
customers to continue the usage of TEBSS.
7.1.6 Mediating Role of Satisfaction and Post-use Trust on the Relationship between Customers’ Adoptability of TEBSS and Continuance Intention
In the context of e- banking, it was identified that, the trust and
satisfaction are mostly varying over the period of time. Hence these
factors might have influenced the post-use behaviour of customers in
technology-oriented products and services. For this reason, the intervening
effect of customer satisfaction and post-use trust is analysed on the
relationship between customers’ perceptions on adoptability of TEBSS and
their continuance intention in this study as fifth objective. The analysis has
resulted in the remarkable insights into the role of satisfaction and the post-
use trust in strengthening the continuance intention. The hypotheses H5 to
H12 are proved through mediation analysis.
7.1.6.1 Influence of Satisfaction on the Relationship between Customers’ Awareness and Continuance Intention to Use the TEBSS
The findings of current study revealed that customer satisfaction
significantly influences the relationship between awareness and
continuance intention. Satisfaction has significant influence on

Chapter 7
392
continuance intention. When the customers are more satisfied with
different aspects of TEBSS, they may have strong intention to continue
the use of TEBSS. Awareness also had significant positive influence on
continuance intention to use the TEBSS. When customers are well aware
about the technology and its performance, he may have high intention to
continue the use in future. However, in the study it is identified that, at the
presence of satisfaction, the influence of awareness on continuance
intention become low. It means that, satisfaction enhances the relationship
between awareness and continuance intention. Awareness had significant
influence on continuance intention, but simply having awareness about
the TEBSS customers are not much influenced in their future use
behaviour. Whereas, if the customers are satisfied with the existing
TEBSS, then only their continuance intention would become strong. Role
of awareness in the post-adoption stage is well established due to the
frequent updates in the technology. Present study argues that user
awareness improves the continuance intention to use the TEBSS, if
customers are satisfied in the use of TEBSS.
7.1.6.2 Influence of Post-use Trust on the Relationship between Customers’ Awareness and Continuance Intention to Use the TEBSS
The post-use trust is also found as influencing the effect of
awareness on continuance intention to use the TEBSS. Customers are
experienced the banking transactions in a protective and systematic
manner in traditional method. A paradigm shift to an entirely different
method, where direct contact is absent and customers are un-aware of
many aspects of the technology necessitated the belief of trust in TEBSS

Discussion, Findings, Suggestions and Conclusion
393
for retention or continue the usage in long term. If the customers have
strong trust in using the TEBSS, their awareness about technology
updates and improved features etc. give a boost to their continuance
intention to use the TEBSS. Since it is a finance related decision, which
involves transmission of highly confidential information passed through
the network, awareness about possible threats is mandatory for users to
trust the TEBSS. This reason might cause the enhancement of the
influence of awareness on continuance intention through trust. Study
proved that, awareness of customers about TEBSS strengthens the
continuance intention if the customers have trust in using TEBSS.
7.1.6.3 Influence of Satisfaction on the Relationship between Accessibility of TEBSS and Continuance Intention to Use the TEBSS
The results of this study depict that the satisfaction has significant
influence on the effect of accessibility on continuance intention.
Accessibility is presented as the easily and timely availability of TEBSS
according to user wish. The effect of accessibility on continuance intention is
significant and positive. It indicates that, when customer perceive more
accessibility of TEBSS, they will have high intention to continue the use
of TEBSS. In addition to that, if the customers are satisfied in the use of
TEBSS, then their continuance intention due to the easy accessibility of
TEBSS will be stronger. It states that, when customers are more satisfied
with TEBSS, the influence of accessibility on continuance intention will
also be strong. It can be stated that, if the customers are satisfied with
TEBSS, their perception about accessibility of TEBSS can strongly
influence their continuance intention to use the same in future.
Chapter 7
394
7.1.6.4 Influence of Post-use Trust on the Relationship between Accessibility of TEBSS and Continuance Intention to use the TEBSS
Intervening effect of post-use trust in the relationship between
accessibility and continuance intention was also tested in the study and it
was found as significant. This means that the real time availability and
easy accessibility of the services can create a significantly high positive
intention towards the long run usage of TEBSS when user trust the
TEBSS. Similarly, the effect of accessibility on continuance intention will
be stronger, when the user have trust after their initial use of TEBSS.
Once the customer positively experienced the easy accessibility of
TEBSS, user may have a positive feeling of trust on the same. That will
then direct towards the formation of a favourable intention to continue the
same. If the customers face any trouble in accessing their account through
TEBSS they may lose their trust in TEBSS, it will badly affect their
future use intentions of the same. Hence this study evidenced that, the
influence of accessibility on continuance intention is high when customers
have strong trust in TEBSS.
7.1.6.5 Influence of Satisfaction on the Relationship between Ease of Use of TEBSS and Continuance Intention to use the TEBSS
It is found in the present study that; customer satisfaction fully
mediates the positive impact of ease of use on continuance intention. Ease
of use had significant positive relationship with continuance intention.
However, study evidenced that, easiness of use of TEBSS is no longer
important for customers, once they are satisfied and they have trust in
TEBSS. This finding further suggests that, ease of use does not necessarily

Discussion, Findings, Suggestions and Conclusion
395
promote their continuance intention unless users are satisfied with TEBSS.
Ease of use has impact in determining the continuance intention if the
customers are highly satisfied with it. Hence, it can be concluded that,
continuance intention of customer to use the TEBSS in future is not solely
depends on the easiness of TEBSS usage. It means that, they may not
continue the use of TEBSS only because of the reason that it is easy to use.
7.1.6.6 Influence of Post-use Trust on the Relationship between Ease of Use of TEBSS and Continuance Intention to use the TEBSS
Analysis revealed that the influence of ease of use on continuance
intention is significantly improved through post-use trust. Ease of use was
the major contributor of post-use trust in the TEBSS according to this
study. When the user feels TEBSS are easy to use, they will have a
positive attitude to continue the use in future. Likewise, if the user has
strong trusting belief in the TEBSS, it will enhance their intention in long
run. Generally, the complexity of TEBSS makes confusion and anxiety
among the customers when interacting with TEBSS. Once the customer
has the feeling that TEBSS is simple and customised for their usage, they
have the feeling of trust in TEBSS and later their intention to continue the
services will be also high. Once the easiness in usage is experienced, their
attention may have shifted towards the trust or satisfaction in the use of
TEBSS. They may no longer concern about the easiness of use of TEBSS
after their usage. This might be the reason for insignificant direct effect of
ease of use in the presence of both satisfaction and trust. Study revealed
that, customers are not much concerned about the easiness of use of
TEBSS to continue the use, once they experienced the TEBSS as trust
worthy.

Chapter 7
396
7.1.6.7 Influence of Satisfaction on the Relationship between Usefulness of TEBSS and Continuance Intention to use the TEBSS
Satisfaction is found as having significant intervening role in the
positive association between the usefulness and continuance intention. It
indicates that effect of usefulness on continuance intention to use the
TEBSS will be high once the customers are more satisfied with TEBSS.
Satisfaction with respect to the enhanced efficiency in carrying out the
transactions, improved way of customer relationships etc. leads to strong
intention to continue the usage of TEBSS. User examines whether their
expectations about TEBSS are matching with their actual experiences or
not, actual performance of the TEBSS was evaluated by users based on
the characteristics of TEBSS. Thus, the influence of usefulness on
continuance intention is significantly improved through satisfaction. The
result can be summarised as the effect of usefulness of TEBSS on
customers’ continuance intention will be stronger when the customers are
satisfied with the TEBSS.
7.1.6.8 Influence of Post-use Trust on the Relationship between Usefulness of TEBSS and Continuance Intention to Use the TEBSS
Study found the effect of usefulness on continuance intention is
enhanced when customers have strong trust in TEBSS. Usefulness has a
noteworthy effect through post-use trust on continuance intention. As
long as customer perceive more usefulness about TEBSS, their
continuance intention to use the TEBSS would be that much strong. If
the post- use trust of customers in the use of TEBSS is high because of
the improved efficiency of transactions, they will have a consistent

Discussion, Findings, Suggestions and Conclusion
397
favourable affect towards the TEBSS. It can be also stated in such a way
that, the influence of usefulness of TEBSS on customers’ continuance
intention to use the TEBSS will be stronger, if the customers have strong
trust in the use of TEBSS.
The findings of mediation analysis support the existing theory of
ECM as mediating role of customer satisfaction on continuance intention
with user perceptions. Further this study extended the theory by adding
the post-use trust as mediator in the relationship. Study provides
evidences that both the satisfaction and post-use trust significantly
improve the effects of customers’ perceptions of adoptability on their
continuance intention to use the TEBSS.
7.1.7 Moderating Role of Risk Perception on the Relationship between Post-use Trust and Continuance Intention
Moderating role of risk perception on the relationship between post-
use trust and continuance intention is tested in the study to know whether
the impact of trust on continuance intention is depend on the level of risk
perception by the customers. The moderating influence of risk perception
is found as significant and it was negatively influencing the trust and
continuance intention relationship (Table.6.59). This suggests that, when
customer perceives high level of risk, the impact of customers’ post-use
trust on continuance intention will be low. When they have low risk
perception on TEBSS, the effect of post-use trust on continuance
intention will be high. The level of trust of customers on TEBSS is
varying according to their level of risk perception. Former researchers are
consistent with the notion that, the risk perception negatively influences

Chapter 7
398
the behaviour intentions. Both the adoption intention and continuance
intention are behavioural intentions measured at different points of time.
Additionally, customers share their highly confidential financial
information in an unknown platform, where the direct personal contact is
absent and users are unaware about the technical and operational aspects
of the same. Risk perception hence have significant negative influence in
their trust to continue the use of services in future.
In the study, risk perception was found as low (Mean Score 2.83)
and post-use trust was found as high (Mean Score 3.41). As far as TEBSS
is concerned, the adopters may have certain level of trust with their banks
even before they assess the perceived risk in TEBSS. This trust can bring
down their risk perception. The feeling of uncertainty regarding the usage
and the future impacts of TEBSS causes the non-adopters to perceive high
risk on TEBSS. Consequently, their perception on trust becomes low. But
the respondents in this study are adopters who are at the maturity stage of
using TEBSS. So, their level of risk perception may come down due to
the frequent use and experience. The interactivity of risk perception and
trust was mentioned in previous studies and a bi-directional causality has
been established as risk creates opportunity for trust, same time trust
influences risk perception. Even though the influence of customers’ trust
on continuance intention is depending on the level of risk perception of
customers, much variations are not reported on the post-use trust and
continuance intention, by changes in the level of risk perception since the
R2 change is very low (0.005).

Discussion, Findings, Suggestions and Conclusion
399
It can be summarised as the risk perception of customers after their
use of TEBSS significantly influences their trust and continuance
intention to use the TEBSS. Continuance intention of users to use the
TEBSS will be high when customers have strong trust in TEBSS. But if
they perceive risk in the use of TEBSS, it will be negatively affecting
their trust to continue the use of TEBSS. In the moderation analysis it was
also proved that, this negative influence of risk perception is significant in
all levels of risk perception. Whether the risk perception is low, medium,
or high, it will negatively affect their trust to continue the use of TEBSS
in future. Study further evidenced that, to what extent their risk perception
goes high, that much their trust to continue the use of TEBSS will
reduces. It supports the findings of (Khattab & Al-Shalab, 2015). The
hypothesis (H13) is proved in the study as customers’ trust to continue the
use of TEBSS is depends on the level of their risk perception.
7.1.8 Validation of the Model Formulated for the Study
The final objective of this study was to empirically test the
conceptual model formulated for the study. Amongst the different
theories and models of post-adoptive use of new technology, one of the
prominent models well established in the previous studies was Expectation
Confirmation Model. The formulated model for this study is based on the
Information System Continuance Model originally based on theory of
Expectation and Confirmation. Since the TEBSS become an important
part of banking activities for few years. Numerous types of technology
enabled banking products and services are now available with multiple
features. Therefore, the factors which explain the adoption and usage
continuance intention of TEBSS are explored in this study.
Chapter 7
400
The extended model formulated for the study postulated customers’
perception on adoptability of TEBSS as independent variables which
includes awareness, accessibility, ease of use and usefulness. Customer
satisfaction and post-use trust as mediating variables, risk perception as
moderating variable and continuance intention as dependent variable. It
was proposed in the study that, customers’ perception on adoptability of
TEBSS has significant influence on continuance intention through
customer satisfaction and post-use trust. Additionally, it was also
proposed that, the trust of customers to continue the use of TEBSS is
influenced by risk perception.
The validation of the conceptual model of the study revealed that
accessibility and usefulness have direct positive influence on continuance
intention in using the TEBSS. Among these, accessibility was found as
strongest predictor of continuance intention (Table.6.64). This result
supports the finding of (Chiang & Dholakia, 2008). Unlike the traditional
banking, the distinct characteristics of TEBSS is its easy accessibility
which has been found to be the major motive for customers in choosing
TEBSS over traditional banking. Easiness of use of TEBSS and customer
awareness increases the continuance intention of TEBSS through
enhancing their satisfaction and post-use trust (Table 6.64). Also, it was
evidenced that, satisfaction and customer trust have significant role in
predicting user intention to continue the TEBSS. It was found that,
formulated conceptual model can be accepted with a good fit (Table.
6.63) and it explained 59.3 per cent variance in the continuance intention.

Discussion, Findings, Suggestions and Conclusion
401
7.1.8.1 Influence of Accessibility of TEBSS on Continuance Intention to Use the TEBSS
Influence of accessibility of TEBSS on continuance intention in the
model evidenced as one of the strong predictors of TEBSS (β= 0.160). It
is more important for the adopters to get the TEBSS as and when they are
actually need the TEBSS. The increased accessibility without any hurdles
may lead them to believe that TEBSS are useful for them. When
customers perceive increased accessibility of TEBSS they may have
strong intention to continue the use of TEBSS in future. If any hurdles
occur in accessing the bank account for performing transactions, their
intention to use will be reduced in future. The positive significant
relationship between accessibility and continuance intention to use the
TEBSS is evidencing that, increased accessibility of TEBSS ensures the
continuance intention to use the TEBSS.
7.1.8.2 Influence of Usefulness of TEBSS on Continuance Intention to Use the TEBSS
Usefulness of TEBSS is found as a good predictor of continuance
intention in this study. It implies that, if the customers consider the
TEBSS as useful and improve their banking transactions, then they will
be more likely to continue the use of TEBSS in future. Before adopting
the TEBSS customers evaluate the TEBSS in such a way that, whether it
is actually useful for them. Once they experience as it is highly useful,
their future intention to use the TEBSS will be high. The findings
support the previous studies in information system research Hamid &
Zaidi (2016).

Chapter 7
402
7.1.8.3 Influence of Customers’ Awareness of TEBSS on Continuance Intention
The relationship between customers’ awareness and continuance
intention went in contrary to the prior expectation by evidencing an
insignificant influence of awareness on continuance intention (Table 6.64).
In the stage of adoption, awareness is most important factor which
influences the users’ intention of adoption, however in the post-adoption
stage, they are experienced users as well as they might be having
minimum level of knowledge about the procedures and methods of using
TEBSS, how to overcome the difficulties in performing transactions etc.
Hence customers are not much concerned about the awareness about
TEBSS to continue the usage if they are satisfied with the TEBSS and if
they have trust in TEBSS.
7.1.8.4 Influence of Ease of Use of TEBSS on Continuance Intention
Ease of use of TEBSS is also found as having insignificant
influence on continuance intention in using TEBSS (Table. 6.64). Unlike
usefulness, ease of use is affecting the user intention at the initial stage of
a new technology itself. Customers are not much concern about the
easiness in using TEBSS once they started using TEBSS. Hence it is not
influencing their future decisions. Moreover, once the customers become
familiar with the TEBSS use, they will be gaining expertise in using these
technologies through the repeated use. So, whether the TEBSS are easy to
use or not, will no longer will be their focus of attention. Hence, their
future intention to use the TEBSS will not likely to be affected by their
ease of use perception. Even if the banks upgrade the system, they will
not be discontinuing the usage of TEBSS for this reason. Additionally, it
Discussion, Findings, Suggestions and Conclusion
403
is found that the effect of ease of use on continuance intention is
enhanced through satisfaction and post-use trust. However, study do not
indicate that, an easy to use TEBSS is unimportant, since the satisfaction
and post-use trust are significantly affected by ease of use of TEBSS.
7.1.8.5 Influence of Customers’ Perceptions on Adoptability of TEBSS on Customer Satisfaction
Awareness or information acquiring process is a never-ending
process in this present scenario, it is not confined with any single
technology. TEBSS are frequently undergoing with vigorous changes.
Being aware about these changes is necessary for each user to experience
the new features. The customer awareness about all aspects of the
technology enabled banking self-services have a deep influence on
customer satisfaction. The findings are in accordance with the previous
author Regina (2015).
Once the user experiences the TEBSS, he or she might be having a
positive or negative feeling based on their earlier usefulness perceptions.
If their expectation is positively confirmed after the use, they become
satisfied otherwise they will not be satisfied. Ample studies have already
supported this finding that the usefulness has significant impact on
customer satisfaction Hada (2018); Kodithuwakku (2018). In addition to
this, novelty of TEBSS and its ability to perform different activities might
be useful for the customers. Simultaneous use of many digital payment
apps, e- wallets etc. are also available under TEBSS, all these are the
reasons for the strong influence of usefulness on satisfaction.

Chapter 7
404
Generally, the customers always prefer to use the products and
services which are easy to use; and when the products and services are
easy to use, they will be satisfied with it. Once the technology enabled
banking self-services are easy to use, customers frequently use it. By the
frequent and repeated use of TEBSS, they become proficient in using the
same and will become more satisfied in TEBSS.
According to the study result, accessibility of TEBSS is significant
predictor of satisfaction. Reason is understood that, the huge penetration
of mobile, internet and digital communication technologies, uninterrupted
4G network and data plans etc. made TEBSS as easily available to one’s
mobile or PC. Thus, the issue of non-accessibility is not greatly affected
the busy scheduled life of customers for the time being.
7.1.8.6 Influence of Customers’ Perceptions on Adoptability of TEBSS on Post-Use Trust
The relationship between customers’ perception on adoptability of
TEBSS and post-use trust has been examined in this study. The result of
the empirical analysis exposed that, adoptability of TEBSS namely
awareness, usefulness, accessibility and ease of use have significant
positive impact on post-use trust.
This study supported the significant influence of awareness on post-
use trust. Although, the awareness has predominant role in adoption
decision, many users are started to use the service after getting a
minimum level of knowledge. For that reason, it may have significant
influence on their trusting belief in post-adoption phase. The post-use
trust is much stronger belief than the pre-use trust and it is developed after

Discussion, Findings, Suggestions and Conclusion
405
the extensive usage of the products and services. Since it is gradually
formed and developed after the usage, it has significant influence on their
personal judgments. The judgment / attitude may depend on prior
knowledge regarding technology and experience.
It was revealed that, ease of use has the highest impact on customer
post-use trust when comparing the other adoptability perceptions. In this
study also, a robust relationship of ease of use on post-use trust nearly
with 30 percentage of variance has been found. Customers feel that the
TEBSS are easy to use hence are less threatening. Post-use trust in any
technology innovation is formed after the user experience the new
technology. If it becomes easy to use after the initial use, then they would
start using the same extensively and the extensive usage makes the user
familiar to that technology/innovation. As far as financial dealings are
concerned, customers always prefer security and safety as most important
factors. Most of the banking service users are common people without
having much knowledge about technology and related terms. So, when it
is easier to cop up with banking technology, greater chance is to win the
heart of the potential users. This finding corroborates the vision of Ortega
(2011); Wen et al. (2011).
Present study evidenced that, consequences of usefulness on trust is
low when it is compared with ease of use. It is because ease of use is
prime for technology acceptance, only if the TEBSS are easy to use, then
only customers starts to use it. But customers start to assess the usefulness
later in the post-adoption stage, based on the beneficial attribute of a
technology/ or product. As stated by Mou & Shin (2016), the actual usage

Chapter 7
406
experiences might have modified the initial usefulness perceptions of the
users, which further directed the user to develop a positive trust feeling in
the TEBSS. In accordance with the present result, the positive association
of usefulness and user trust had been explained by Koufaris & Sosa
(2004).
Main feature of the technology enabled banking self-services are
the real time availability. Since the services are instantly available
customers may have trust in the same. Accessibility is the main
antecedent of the extensive usage of technology enabled services. In the
case of TEBSS, customer can perform multiple banking transactions at
anywhere, any time. This will direct in the repeated use or the intensive
use of TEBSS which will results in enhanced trust among customers. Real
time accessibility of services is one of the unique characteristics of the
TEBSS. It was also reported from the literature that, accessibility has
significant influence on trust in technology enabled services.
7.1.8.7 Mediating Role of Satisfaction
The relationship between customer satisfaction and continuance
intention was tested in the study and the result revealed that satisfaction
has strong significant relationship with continuance intention. Satisfaction
strongly predicts the continuance intention, that explains nearly 50
percentage of variance in continuance intention (Table 6.64). It supports
the views of earlier researchers like Limayem & Cheung (2008), Hadji &
Degoulet (2016); Bhattacherjee & Lin (2015). It is obvious that, when a
customer is more satisfied with a product or service, he will repeat the use
or they may re-use the product in future also. In technology usage also,
Discussion, Findings, Suggestions and Conclusion
407
the studies had proved that satisfaction have strong impact in success and
continued use of the same in future. When the user experiences increased
efficiency, varieties of service offerings, speed and accuracy in performing
transactions, they will be satisfied in TEBSS as a result they will be
continue using (re-use) the same in future.
Here in the case of TEBSS, mediating role of satisfaction is
analysed. It was noticed in the study that, more the customers are satisfied
with the TEBSS more their intention to continue use the same. Even if
many of them are not satisfied with the charges and the cost that is
involved in TEBSS, their overall feeling of satisfaction is high. The
intervening effect of satisfaction is proved as significant in the study such
that, their perception regarding the adoptability of TEBSS is improved
once they experience more satisfaction and it will ultimately boost their
continuance intention to use the TEBSS in future. In the post-adoption
stage of any technology, satisfaction is based on their first-hand
experience. Thus, it is more realistic, un biased and less likely to change.
So, those customers who are more satisfied with TEBSS, may have strong
favourable intention to continue the use of TEBSS.
7.1.8.8 Mediating Role of Post-Use Trust
The surprising element in the finding of the study is that, it explicit
a positive direction of effect of post-use trust to continuance intention
(Table 6.64). Generally, in adoption studies, the perceived trust limiting
the adoption intention, as it is always negative. But in the present study,
post-use trust is positive and having a favourable good impact on
continuance intention. Trust in technology- based products and services

Chapter 7
408
had great deal in determining the continuance intention since it includes
some sort of innovation and improvements in performance that the user is
unfamiliar before. Pre- use trust in adoption was formed based on the
information available to prospective users. Hence the perceived trust is un
biased, un realistic or un-certain. Thus, it seen as a critical factor that
limiting the adoption intention. Whereas, this study showed that the post-
use trust positively related with the continuance intention. Which means
that, when the customers trust more the TEBSS their future intention to
use the TEBSS will also be strong.
Moreover, users in the post-adoption of TEBSS, may possess the
basic idea about the privacy, security and safety measures in using them.
Those who are positively convinced with the safety and security of using
TEBSS after their experience, are more likely to continue using the same.
Additionally, customers receive security alerts, security encrypted OTPs
and other advance security features while using the TEBSS. It will
enhance their trust, reduce the level of risk perception, hence they will
have positive intention to continue the TEBSS.
Here in this study, the mediating role of post-use trust is proved as
significant. Post-use trust might have included trusting beliefs in channel,
trust in service provider and technology trust etc. When the technology
becomes more advance, trust is necessary for long term use of TEBSS,
since the direct personal contact is absent in the service delivery and
financial dealings of the customer in TEBSS. Hence their adoptability
perceptions are strengthened when they have adequate trust in TEBSS
and it will result in the positive intention to continue the use of TEBSS in

Discussion, Findings, Suggestions and Conclusion
409
future. As the trusting belief increases, user will be more willing to
experiment with different features of TEBSS, or use more features of
TEBSS with an intention to continue the usage in future. Additionally, the
technology enabled banking services have to depend on the global
network developed by various communication channels. The use of such
an open communication channel necessitates the scope for security
concerns regarding the efficiency of banks to securely save and protect
the privacy and financial details of customers (Pavlou et al., 2007). So,
the favourable trust is vital to develop a strong intention to continue the
use on the basis of their perception regarding the adoptability of TEBSS.
7.1.8.9 Moderating Role of Risk Perception
It is observed from the study that, risk perception of customers
regarding the use of TEBSS is low (Mean score 2.83, Table 6.18)) among
majority of the customers in this study. The moderating role of risk
perception was analysed in the study on the relationship between post-use
trust and continuance intention. Earlier studies of technology adoption
showed that risk perception influences the perceived trust. The same finding
was emerged in this study as the risk perception negatively influencing the
post-use trust and continuance intention relationship. The moderation
analysis was separately done in PROCESS MACRO by identifying the
separate model template for the relationship (Mentioned in the chapter 6).
Study result revealed that, the influence of post-use trust on
continuance intention is varying according to the degree of risk
perception of customers. It was also found as risk perception weakens the
positive effect of trust to continue the use of TEBSS. It is consistent with

Chapter 7
410
the notion that, risk perception negatively influencing the behaviour
intentions. When customers trust TEBSS more, their intention to continue
the use of TEBSS will also be strong, while if they perceive any risk in using
TEBSS their trust to continue the use of TEBSS will reduces. This result
supports findings of the earlier research (Liu & Zhang, 2018). It can be
further stated as, when the risk perception of customers is low, those
customers who possess the strong trust in TEBSS is highly intend to continue
the use of TEBSS. Similarly, when risk perception of customers is high, then
the person who possess the low trust in TEBSS have very weak intention to
continue the use of TEBSS. The moderation analysis is summarised in the
study that, the presence of risk perception of customers alters the relationship
between their trust and continuance intention. Or it can be said that, risk
perception limits the trust to continue the use of TEBSS.
7.2 Suggestions
Based on the findings of the study, the following suggestions are
put forward, which could be adopted by banks to retain the customers
with TEBSS as well as to attract the new customers in stream of TEBSS
adoption.
7.2.1 Most of the advanced functionalities like payment services,
booking services, fund transfer services are common among the
customers who are having high level of education and income. The
penetration of TEBSS for diversified functions in long-run can be
enhanced if the focus is given to spread the use of TEBSS among
customers who belongs low profile in terms of education and
income. Special attention should be given in this area.

Discussion, Findings, Suggestions and Conclusion
411
7.2.2 Banks who are actively developing the technology enabled banking
services must focus on educating the customers regarding the
technology updates, improvised features of new technologies in
order to keep them aware with technology. The customers can
make extensive use of TEBSS when he or she is informed about the
advancement in technology.
7.2.3 Age wise difference is seen in the ease of use and usefulness
perception on adoptability of TEBSS, satisfaction and continuance
intention. Moreover, study found that, young customers are
extensively using the TEBSS. So, while developing the TEBSS,
due consideration should be given for customising the TEBSS as
user friendly as possible to get the benefit of it to all age groups.
7.2.4 Study revealed that, accessibility of TEBSS is the proximal
predictor of continuance intention. Hence, banks should ensure the
easy accessibility of TEBSS to the customers. Once the customer
feels any discomfort or trouble in accessing the TEBSS it will
badly affect their intention to continue the usage of same.
7.2.5 It is also suggested that banks must diversify their TEBSS to
adopters as well as to non-adopters. Since the study result shows
that ease of use of TEBSS is no longer matters to continue the use
if customers are satisfied and they have trust in TEBSS. Whereas
ease of use is essential in the initial stage of adoption for
satisfaction and to create trust in TEBSS. Hence, while designing
new products and services for adopters and non-adopters, the
service providers should keep in mind these important insights.

Chapter 7
412
7.2.6 Since the usefulness is found as another strong predictors of
continuance intention, the banks should continue developing the
new types of TEBSS which possess competitive advantages in
terms of cost advantages and differentiation advantages over
traditional banking. Apart from this, they should focus on
publicising their competitive advantages in order to attract new
customers towards the TEBSS.
7.2.7 This study showed that, post-use trust is only moderately high
among adopters (Table. 6.18). This emphasise that there exists lack
of adequate security measures in TEBSS to improve the customers
trust. It is vital that, customer should have favourable trust to
continue the use of TEBSS in future. Thus, adequate measures
should be implemented while designing the TEBSS to further
improve the trust of customers. Trust can be enhanced through the
improved customer support from banks regarding the use of
TEBSS. All major commercial banks are spending huge amount
for research and development in technology updates for their
sustainable development. But customer support on the virtual
channels simply might enhance the customer trust in the TEBSS.
Since the financial dealings are highly confidential to customers,
they seek for support from the service providers. But presently
informational service supports are only available for customers.
Keeping the customers informed about the updates in the
technology, possible troubles and problems, etc. are crucial for
developing trust. Instant support system by using voice recognition,
or instant online assistant mechanism etc. are absent in the TEBSS,

Discussion, Findings, Suggestions and Conclusion
413
if the service providers can include these features in their TEBSS it
would have a vigorous change in their post-use trust.
7.2.8 Study suggests that, the banks should give due consideration to
minimise the risk by proper monitoring the risk factors, by
enhancing the efficiency of safety and security features of TEBSS
in order to boost the customers’ trust. As per the study result,
customers’ post-use trust is varying according to the level of their
risk perception. The fact is that, risk perception has negative
influence in the trust to continue the use of TEBSS. Which means
that, even if customer perceives low level of risk, it can weaken
their level of trust. So, the banks should ensure proper measures to
tackle this issue.
7.2.9 Real time supporting system can be enabled with TEBSS like the
user guidance in some technology applications. That will be more
helpful for customers to carry out the transactions and reduces the
trouble in conducting the transactions. Moreover, it can help to
enhance the customers’ trust as well as minimising the risk
perception. Instant Voice Response (IVR) system or support
assistance system by text messages in local contents etc. are the
possible value-added technologies that can be included in TEBSS.
Further it would have resulted in the increased adoption rate
besides the enhancement of trust.

Chapter 7
414
7.3 Implications of the Study
The implication of this research has been presented in two heads,
theoretical contributions of the study and practical contributions of the study.
7.3.1 Theoretical Implications
This study contributes to the stream of literature on the development
of a model explaining the continuance intention in the use of technology
enabled banking self-services. The model was tested empirically and
found that the model has good explanatory power. The main aim of
developing technology-based banking products and services was to make
use of the same at maximum possible extent in the long run. Thus, the
present model provided an integrated framework for the prediction of user
behaviour at post-adoption phase, based on customers’ perceptions on
adoptability of TEBSS. Understanding the need and significance of post-
adoptive use of TEBSS for assessing the long-term success of technology
is more relevant in the present scenario of virtual banking. Study provided
new theoretical insights about important factors that might have direct as
well as indirect influences on the users’ continuance intention of TEBSS
which have been neglected so far.
Post-use trust is added as an antecedent of customer continuance
intention in the model. Trust was found as an influencing factor for
technology acceptance in the previous literature. Continuance intention is
the long-term behaviour; thus, the role of user trust is added to the model
for better prediction of the behaviour. Also, it is postulated as a mediating
variable for predicting the continuance intention. It is more relevant to

Discussion, Findings, Suggestions and Conclusion
415
study the user behaviour after the adoption by considering the effect of
post-use trust in a new technology, which was less explored in the earlier
studies. Study also analysed the parallel mediation effect of post-use trust
of customers and satisfaction in the relationship between customers’
perception on adoptability of TEBSS and continuance intention in using
TEBSS which has been un-identified earlier.
Additionally, risk perception has been found to have influence in
usage behaviour of customers in TEBSS. Previous studies identified its
role of risk perception in the pre-adoption stage. This study checked the
influence of risk perception on continuance intention in the post-adoption
stage of TEBSS. The user effect of trust on continuance intention is
estimated under different level of risk perception and which would have
expected to explain the continuance intention more precisely. The
moderating role of risk perception in the post-adoption stage of TEBSS
was not explored in the previous studies.
Study supported the positive association of accessibility and
awareness with post-use trust of customers of TEBSS, which was less
explored earlier in the e-banking research. Although, there are studies
available on adoption and continuance intention, this study being unique
in the sense that, it has made an attempt to bring all these behavioural
elements in an integrated framework. Altogether, this study contributes
the literature of electronic banking in terms of different factors
influencing the usage and continuance intention of technology enabled
banking self-services.

Chapter 7
416
7.3.2 Practical Implications
From the practical perspective, the findings of the study can be
utilised by banks for providing customised services for customers in order
to increase the penetration of technology enabled banking self-services. It
can help them not only attracting the customers but also retaining them as
loyal.
Findings of the study suggested that, the customers’ perception on
adoptability has significant influence on satisfaction, post-use trust and
continuance intention. Thus, developing positive perceptions by
mitigating the problems of customers in using TEBSS is necessary for
long-term continued usage of TEBSS. In addition to that, favourable
perceptions about TEBSS from the current users is beneficial for the
banks for further improve the adoption intention through positive word of
mouth.
Extended and continued use of TEBSS is essential for both the
service providers as well as the government of the country, since it paves
the way of digital economy. Understanding the continuance intention and
the critical factors influencing the user behaviour is also beneficial for the
industry to further improve their products and services in customised
manner. This would further increase the efficiency by way of reduced
operational costs of banks since they are investing huge amounts in
technology.
Insights of the study can be utilised for development and
implementation of policies by the authorities to further refine the TEBSS,

Discussion, Findings, Suggestions and Conclusion
417
for enhancing the penetration of such services among non-users. In this
highly competitive market place, the technology is pervasive and customers
have numerous choices for selection. Hence this study recommends that,
banks which are specifically handling TEBSS, could retain the customers
with them by keeping them satisfied and trust worthy.
This study identified trust and satisfaction as important factors
which contribute to the continuance intention. Thus, banks should ensure
their customer’s post-use-trust and assure their satisfaction through cost
cutting, changes in charges and fees, developing new security measures
etc. Additionally, it is to be emphasised that, the influence of risk is
negatively affecting the trust to continue the use of TEBSS. So, the
service providers can take this result to keep the risk elements at
minimum level by proper monitoring the TEBSS to retain them as trust
worthy and loyal to their TEBSS.
Technology being disruptive in nature, requires significant amount
of funding and therefore the contributing factors to continuance intention
need to be analysed. By identifying the critical factors, banks can develop
and implement customised products and services by way of efficient and
cost-effective manner to reduce the operational costs.
This research will help to priorities the factors of continuance
intention of technology enabled banking self-services from the
comprehensive data collected from the customer survey. Based on the
results of the study, banks can identify a few most significant factors
which are commonly affecting a major share of customers. By addressing
these factors, the most significant benefits can reach a large number of

Chapter 7
418
customers simultaneously on priority. Thus, it will improve the efficiency
of customer service by meeting their expectations effectively.
By the user survey conducted among the different types of
customers, banks can identify the knowledge gap customers are having
about the efficacy of a technology they are already using. Rather than
using the resources to upgrade the existing system un-necessarily, this
will help the banks to fill the gap only. It will give a clear idea whether
technology limitation lies with the technology or with customers.
Cashless is the emerging global trend and the government after
demonetization is also trying their best to make the country as a digital
economy. The basement of digital economy is stands on the four pillars;
government support, financial and technology infrastructure, availability
digital financial services and the propensity/ willingness of the customers as
well as business to adopt and continue the use of the digital innovations.
Taking the records of the current situation it is evident that, some technology
adoption in banking sector is embraced by customers only due to the policy
compulsion. But for a complete transformation from traditional to digital
economy, the voluntary willingness of customers to use the TEBSS is
necessary. The current research attempted to study the willingness of
customers to continue the use of these services in the long run. Same study
can be replicated among the industry and business groups, for identifying
their propensity and insights of the results can be also applicable for future
policy decisions.
Finally, present study addressed the behaviour of users on internet-
based service continuance. Hence those firms specifically handling online
Discussion, Findings, Suggestions and Conclusion
419
services can also utilise this study to focus on the key elements for their
consumer retention strategies (minimising discontinuance) for maintaining
customer base and market share.
7.4 Conclusion
To maximise the financial transactions through technology enabled
banking self-services, banks ought to assume that, customers will continue
the use of such services in long run after their initial use. This study
evidenced on the factors that will influence the customers’ continuance
intention to use the TEBSS. Study had introduced an integrated model by
linking the customers’ perceptions on adoptability of TEBSS namely
awareness, accessibility, ease of use and usefulness, post-use experiences
like customer satisfaction, customer trust and continuance intention in
technology enabled banking self-services. The model was tested and
validated empirically. The mediating role of satisfaction and post-use trust
was found as significant in the relationship between customers’ perceptions
on adoptability and continuance intention. The influence of risk perception
was also analysed in the study and found there is significant moderating
influence exists in the relationship of post-use trust and continuance
intention. An integrated framework was necessary for explaining the
customer behaviour in the context of TEBSS, since there are only very few
studies previously attempted to analyse the continuance intention on
TEBSS.
Study found that major share of customers is not much explored
TEBSS for different purposes other than common services. Further, it
states that majority of customers are highly satisfied in performing the
Chapter 7
420
services which they are currently using through TEBSS and intend to
continue the same in future also. But they are not highly aware about
advanced technology updates about the TEBSS even after the adoption.
Hence, it can be suggested that, if the customers get proper awareness
from their service providers, they may further explore the TEBSS for
varying purposes.
Reducing the physical banking activities by shifting majority of
activities online will helpful for eradication of corruption, black money,
proper tax collection system, control parallel economy etc. and moving to
long term flourishing economy. Additionally, it is more beneficial to
environment since it paves the way of green banking. Hence it is
important for banks to keep going with the technology.
The current situation in India also demands such a study such that,
the country is in the pathway of transformation of traditional banking into
digital platform. The demonetisation of currency notes in 2016 resulted in
the extensive usage of TEBSS in the country. But the majority of the
customers still reluctant to carry out their complete banking transactions
in virtual platforms. The study on continuance intention of technology has
important role in demonstrating the customer behaviour at this situation
after this policy change. The cash-less transactions emerged at the time of
demonetisation of the currency, lost its momentum gradually when
currency notes crisis got solved by distribution of new currency notes.
Also, relevance of this study got much attention when the demonetisation
happened in between the period of study. The study results had significant
implications for the present context of enhanced digital transactions

Discussion, Findings, Suggestions and Conclusion
421
routed by increased internet penetration, extensive usage of smart phones
and a completely transforming digital world.
7.5 Scope for Future Research
Commercial banks both public sector banks and private sector
banks are significantly differing in developing and maintaining their
TEBSS. Bank wise difference in the usage and continuance intention can
be done in the future studies, which will give more insights about the
customers’ attitude towards the TEBSS. Future, studies can also be
concentrated on specific technologies like digital payments, e-wallets etc.
by using the same model.
References
[1] Bhatacherjee & Lin (2015). A Unified Model of IT Continuance: Three Complementary Perspectives and Crossover Effects. Europian Journal of Information system, 364-373.
[2] Chiang & Dholakia (2008). Factors Driving Consumer Intention to Shop Online: An Empirical Investigation. Journal of Consumer Psychology, 177-183
[3] Hada (2018). "Online Banking and Customer Satisfaction in Public and PrivateSector Banks: Evidence from India. IOSR Journal of Business and Management, 10-20.
[4] Hadji & Degoulet (2016). Information System End-user Satisfaction and Continuance Intention: A Unified Modelling Approach. Journal of Bio Medical Informatics, 185-193.
[5] Hamid & Zaidi (2016). The Effects Of Perceived Usefulness And Perceived Ease Of Use On Continuance Intention To Use E-Government. Procedia Economics and Finance, 644-649.
[6] Khattab, A., & Al-Shalab, H. (2015). The Effect of Trust and Risk Perception on Citizen’s Intention to Adopt and Use E-Government Services in Jordan. Journal of Service Science and Management, 279-290.

Chapter 7
422
[7] Kodithuwakku (2018). Impact of Internet Banking on Customer Satisfaction: A Case Study of State Banks in Kandy District. Academy of Social Science Journal,, 1114-1122.
[8] Koufaris & Sosa (2004). The Development of Initial Trust in an Online Company by new Customers. Information & Management, 377-397.
[9] Limayem & Cheung (2008). Understanding Information Systems Continuance: The Case of Internet-based Learning Technologies. Information & Management, 227-232.
[10] Liu & Zhang (2018). An Empirical Study on Factors Affecting Continuance Intention of Using Yu’e Ba. Technical Gazatee, 1414-1420.
[11] Mahatanankoon & Vila-Ruiz (2007). Why Won't Consumers Adopt M-Commerce? An Exploratory Study. Journal of Internet Commerce, 113-128.
[12] Mou & Shin (2016). Understanding Trust and Perceived Usefulness in the Consumer Acceptance of an E-service: A Longitudinal Investigation . Behavior and Information Technology, 125-139.
[13] Muche & Sharma (2017). Influence on Demographic Factors on Users' Adoption of Electronic Banking in Ethiopia. Journal of INternet Banking and Commerce, 1-17.
[14] Ortega (2011). The Role of Post-use Trust in the Acceptance of Technology; Drivers and Consequences. Technovation, 523-538.
[15] Pavlou & Liang (2007). Understanding and Mitigating Uncertainty in Online Exchange Relationships: A Principal-Agent Perspective. Management Information Systems Quarterly, 1-31.
[16] Regina (2015). A Study on Customer Awareness and Satisfaction towards E banking Services. Indian Journal of Applied Research.
[17] Sun (2010). Sellers’ Trust and Continued Use of Online Marketplaces. Journal of the Association for Information Systems, 182-211.
[18] Wen & Prybutok (2011). An Integrated Model for Customer Online Repurchase Intention. Faculty Research & Creative Activity., 1-10.
…..…..

Bibliography
423
Abdollahi & Saideenia (2012). Factors Affecting Client Trust in Online Banking -A Case Study of SAMAN. International Journal of Economics and Business Modeling, 149-151.
Abdou, John, & Adewunmi (2014). An Investigation of Risk Management Practices in Electronic Banking: The Case of the UK Banks. Banks and Bank Systems, 1-24.
Abdou Thomas & Huang (2015). A Conceptual Model for Mobile Banking Adoption. Journal of Management Information and Decision Sciences, 111-122.
AbdulKadir & Jamaludin (2012). Users’ Satisfaction and Perception on Accessibility of Public Buildings in Putrajaya: Access Audit Study. Procedia - Social and Behavioral Sciences, 429-441.
Abdullah & Som (2015). Internet Service Features and Satisfaction Among Internet Banking Users. Journal of Management Research, 400-410.
Adam Haroun & Omer Khater (2014). Factors Influencing Customers’ Acceptance of Internet Banking Services in Sudan . International Journal of Science and Research (IJSR), 1429-1433.
Affanuddin Ahmed (2013). Moderating Role of Perceived Risk and Innovativeness between Online Shopping Attitude and Intention . Journal of Basic and Applied Scientific Research, 310-323.
Agarwal & Prasad (1998). A Conceptual and Operational Definition of Personal Innovativeness in the Domain of Information Technology. Information system Research, 204-215.
Agarwal & Seth (2014). A Conceptual Framework on Review of E-Service Quality in bBnking Industry. International Journal of Social, Behavioral, Educational, Economic, Business and Industrial Engineering, 3903-3907.

Bibliography
424
Agarwal, Tripathi & Seth (2014). A Conceptual Framework on Review of E-Service Quality in Banking Industry. International Journal of Social, Behavioral, Educational, Economic, Business and Industrial Engineering, 3903-3907.
Aghdaie & Faghani (2012). Mobile Banking Service Quality and Customer Satisfaction (Application of SERVQUAL Model). International Journal of Mnagement and Business Research, 351-361.
Ahmad (2013). The Moderating Effect of Technology Awareness on the Relationship between UTAUT Constructs and Behavioural Intention to Use Technology:A Conceptual Paper. Australian Journal of Business and Management Research , 14-23.
Ahmed & Sheik (2017). Determinents of Continuance Intention to Use Mobile Money Transfer: An Integrated Model . Journal of Internet Banking and Commerce , 1-24.
Ajimon (2013). A Customer Centric Study of Internet Banking in Kerala. Kottayam: Mahathma Gandhi university.
Ajzen (1991). The Theory of Planned Behavior . Organisational Behavior and Human Decision Process, 179-211.
Ajzen & Fishbein (1980). Understanding Attitudes and Predicting Social Behavior. Michigan: Prentice-Hall.
Akhlaq & Ejaz (2013). The Effect of Motivation on Trust in the Acceptance of Internent Banking in a Low Income Country. International Journal of Bank Marketing, 115-125.
Al Hawani & Mouket (2010). The Influance of TAM Factors on Student's E Satisfaction and E-Retention within the Context of UAE E-Learning. Education, Business and Society, Contemperary Middle Eastern Issue, 299-314.
Al- Eddin Mohd Khalaf & Hasan (2011). E-banking Functionality and Outcomes of Customer Satisfaction: An Empirical Investigation. International Journal of Marketing Studies, 50-65.
Bibliography
425
Alalwan & Dwidi (2015). Consumer Adoption of Internet banking in Jordan: Examining the Role of Hedonic Motivation, Habit, Self-efficacy and Trust. Journal of Financial Services Marketing, 145-157.
Albugami & Bellaj (2014). The Continued Use of Internet Banking: Combining UTAUT2 Theory and Service Quality. Journal of Global Management Research, 11-28.
Al-Ghazali & Rasli (2015). Antecedents of Continuous Usage Intention of Mobile Banking Services from the Perspective of DeLone and McLean Model of Information System Success. International Journal of Economics and Financial Issues, 13-21.
Al-Jabri & Ibrahim (2012). Mobile Banking Adoption: Application of Diffusion of Innovation Theory. Journal of Electronic Commerce Research,, 379-391.
Almahamid & Abu (2011). Factors that Determine Continuance Intention to use E-Learning System:An Empirical Investigation. International Conference on Telecommunication Technology and Applications (pp. 242-246). Singapore: IACSIT Press.
AL-Majali (2011). The Use of Theory Reasoned of Action to Study Information Technology in Jordan. Journal of Internet Banking and Commerce, 1-11.
Al-Rahim & Shahizan Othman (2013). Using TAM Model To Measure The Use Of Social Media For Collaborative Learning. International Journal of Engineering Trends and Technology (IJETT), 90-95
Al-Rfou & Nahar (2013). The Usage of Internet Banking - Evidence from Jordan. Asian Economic and Financial Review, 614-623.
Alsamydai & Mahamood (2014). Adaptation of the Technology Acceptance Model (TAM) to the Use of Mobile Banking Services. International Review of Management and Business Research, 2016-2028.
Al-Sharafi, Abdullah, & Herzallah (2017). The Effect of Perceived Ease of Use and Usefulness on Customers Intention to Use Online Banking Services: The Mediating Role of Perceived Trust . International Journal of Innovative Computing , 9-14.

Bibliography
426
Al-Smadi & Mohammad (2012). Factors Affecting Adoption of Electronic Banking: An Analysis of the Perspectives of Bank Customers. International Journal of Business and Social Science, 294-309.
AlSoufi & Ali (2014). Customers Perception of Mobile Banking Adoption in Kingdom of Bahrain-An Empirical Assessement of an Extended TAM Model. International Journal of Managing Information Technology, 1-13.
Alwan & Abdelhalim Issa (2016). Determinants of Internet Banking Adoption Among Customers of Commercial Banks: An Empirical Study in the Jordanian Banking sector. International Journal of Business and Management, 95-104.
Amin (2016). Internet banking Service Quality and Its Implication on E-customer Satisfaction and E-customer Loyalty. International Journal of Bank Marketing,, 280-306.
Amit sankar (2016). Factors Affecting Mobile Banking Adoption Behavior in India. Journal of Internet Banking and Commerce, 1-24.
Ankit Kesharwani (2012). The Impact of Trust and Perceived Risk on Internet Banking Adoption in India: An Extension of Technology Acceptance Model. International Journal of Bank Marketing, 303-322.
Anol Bhattacherjee (2001). Understanding Information System Continuance: An Expectation Confirmation Model. MIS Quarterly, 351-370.
Aries Susanto (2016) Determinants of Continuance Intention To use the Smart Phone Banking Services : An Extention to Expectation Confirmation Theory. Industrial Management and Data Systems, 508-525.
Asadollah & Askaripoor (2013). The Impact of E-Baking Service Quality Dimensions on Customer's Satisfaction and Brand Equity (Case Study: Refah Bank, Tehran). Business and Management Research, 25-37.
Ataur & Mahamudul (2017). Mobile Banking Service Quality and Customer Satisfaction in Bangladesh:An Analysis. Cost Management, 25-32.
Awalluddin (2011). The Role of Technology Acceptance Model in Explaining Effect on E-Commerce Application System. International Journal of Managing Information Technology, 1-14.

Bibliography
427
Bagozzi (2007). The Legacy of the Technology Acceptance Model and a Proposal for a Paradigm Shift. Jornal of the Association of Information System, 244-257
Bahmani & Yaghoubi (2010). Factors Affecting the Adoption of Online Banking An Integration of Technology Acceptance Model and Theory of Planned Behavior. International Journal of Business and Management, 159-165.
Baig & Rehma (2015). Mediating Roles of Customer Satisfaction and Customer Trust in Building Brand Loyalty. An Empirical Study in Pakistan . Business Management Dynamics , 1-29.
Bandura (1982). Self Efficacy Mechanism in Human Agency. American Psychologist, 122-147.
Barona & Blaschke (2016). Explaining Accessibility and Satisfaction Related to Healthcare: A Mixed-Methods Approach. Social Indicators Research, 719-739.
Barry Howcraft (2013). Consumer Attitude and the Usage and Adoption of Home‐based Banking in the United Kingdom. International Journal of Bank Marketing, 111-121.
Bashir & Madhavaiah (2015). Consumer Attitude and Behavioral Intention towards Internet Banking Adoption in India. Journal of Indian Business Research, 67-102.
Beheshti & MdAriffa (2012). E-Service Quality Dimensions and Their Effects on E-Customer Satisfaction in Internet Banking Services. Procedia - Social and Behavioral Sciences, 441-445.
Benamati (2010). Trust and Distrust in Online banking, Their Role in Developing Countries. Information Technology for Development, 161-175.
Bhatacherjee & Lin (2015). A Unified model of IT Continuance: Three Complementary Perspectives and Crossover Effects. Europian Journal of Information System, 364-373.
Bhatt (2012). Theory of Planned Behavior A Perspective in India Internet Banking. International Journal of Management Prudence, 22-31.

Bibliography
428
Bhattacherjee (2001). Understanding Information System Continuance; An Expectation Confirmation Model. MIS Quarterly, 351-370.
Bijith & Yajnik (2017). Enabling Internet Banking Adoption; An Empirical Examination with Augmented Technology Acceptance Model. Journal of Enterprise Information Management, 263-294.
Boshoff & Jacques (2014). The Impact of Cross-Channel Cognitive Evaluation on the Continued Intentions of Mobile Banking. Management Dynamics, 1-18.
Bradly & Sparks (2012). Explanations: If, When, and How They Aid Service Recovery. Journal of Services Marketing, 41-50.
Candra & Sevenpri (2013). Revisit Technology Acceptance Model for Internet Banking (Case Study: Public Banking in Indonesia). International Conference on Computer, Networks and Communication Engineering, 734-735
Cardozo (1965). An Experimental Study of Customer Effort, Expectation, and Satisfaction. Journal of Marketing Research, 244-249.
Carolina & Oliveiraa (2014). Understanding the Internet banking Adoption: A Unified Theory of Acceptance and Use of Technology and Perceived Risk Application. International Journal of Information Management, 1-13.
Cathy & Wu (2005). Integrating Perceived Playfulness into Expectation Confirmation Model Web Portal Context. Information and Management, 683-693.
Celik & Yilmaz (2011). Extending the Technology Acceptance Model for Adoption of E- Shopping by Consumers in Turkey. Journal of Electronic Commerce Research, 152-164.
Chang & Young (2016). Determinants of Continuance Intention to Use the Smartphone Banking Services; An extention to Expectation Confirmation Model. Industrial Management and Data System, 508-525.
Chao Wen (2011). An Integrated Model for Customer Online Repurchase Intention. Texas: Eastern Illinois University the Keep.

Bibliography
429
Chaturvedi (2010). Impact of Customers' Awareness on Their satisfaction; A study on E-banking in Gwaliar city. SIES Journal of Management, 81-93.
Chen & Chang (2013). Exploring the Determinants of E‐learning Systems Continuance Intention in Academic Libraries. Library Management, 40-55.
Chen & Fang (2009). Determinants of Satisfaction and Continuance Intention towards Self-Service Technologies. Industrial Management and Data Systems, 1248-1263.
Chen & Huei-Huang (2011). A Conceptual Model to Understand the Effects of Perceptionon on the Continuance Intention in Facebook. Australian Journal of Business and Management Research, 29-34.
Cherubin & Maria (2017). Awareness of and Satisfaction with Available Treatment Options in Schizophrenia: Results from a Survey of Patients and Caregivers in Europe. European Psychiatry.
Cheung & Limayem (2003). Online Consumer Behavior: A Review and Agenda for Future Research. 16th Bled eCommerce Conference eTransformation, 194-218.
Cheung & Huang (2017). Cognitive Factors in Predicting Continued Use of Information Systems with Technology Adoption Models. Information Research, 1-47.
Cheung & Michael (2002). Internet-Based E-banking and Consumer Attitudes; An Empirical Study. Information and Management, 283-295.
Chiao-Chen & Chang (2010). The Impact of Recommendation Sources on Online Purchase Intentions: The Moderating Effects of Gender and Perceived Risk . International Journal of Economics and Management Engineering, 655-658.
Chiang & Dholakia (2008). Factors Driving Consumer Intention to Shop Online: An Empirical Investigation. Journal of Consumer Psychology, 177-183. Chichchen & Mei-fang (2009). Determinants of Satisfaction and Continuance Intention towards Self‐Service Technologies. Industrial Management & Data Systems, 1248-1263.
Bibliography
430
Chih-Chen & Chen (2009). The Empirical Study of Customer Satisfaction and Continued Behavioural Intention towards Self-Service Banking: Technology Readiness as an Antecedent . International Journal of Electronic Finance.
ChiLee (2010). Explaining and Predicting Users’ Continuance Intention toward E-Learning: An Extension of the Expectation Confirmation Model. Computers & Education, 506-516.
Choudhury (2008). The Relative Advantage of Electronic Channels: A Multi Dimensional View. MIS Quarterly, 179-200
Chulmo & Yulia (2013). A study of Mobile and Internet banking Service- Applying for IS Success Model. Asia Pacefic Journal of Information System, 65-86.
Chung & Kwon (2009). Effect of Trust level on Mobile banking Satisfaction: A Multi-group Analysis of Information System Success Instruments. Behavior and Information Technology, 549-562.
Cicic & Semina (2015). Changes in Beliefs, Satisfaction and Information System Continuance Intention of Experienced Users. Intenational Journal of Business and Information Systems, 509-535.
Collier & Kimes (2013). Only if It is Convenient: Understanding How Convenience Influences Self-Service Technology Evaluation. The Scholarly Commons.
Combs Yuttapong & Sirion (2009). Diffusion of Innovation in Asia: A study of Internet Banking in Thailand and India. Innovative Marketing, 26-31.
Cunningham (1967). The Major Dimensions of Perceived Risk. Risk Taking and Information Handling in Consumer Behavior. MA, USA: Harvard University Press,.
Cynthia & Beverly (2003). On-line Trust: Concepts, Evolving themes, A Model. Internattional Journal of Human-Computer Studies, 737-758.
Cyril Eze & Yaw (2011). Factors Affecting Internet Banking Adoption among Young Adults: An evidence from Malesia. International Conference on Social Science and Humanity, 377-381.

Bibliography
431
Daneshgadeh & Yıldırım (2014). Empirical Investigation of Internet Banking Usage: The Case of Turkey. Procedia Technology, Elsevier, 322-331.
Daniel (1999) Provision of Electronic Banking in the UK and the Republic of Ireland. International Journal of Bank Marketing, 72-83.
Dash & Bhibuti Bhusan (2014). Determinants of Customers’ Adoption of Mobile Banking: An Empirical Study by Integrating Diffusion of Innovation with Attitude. Journal of Internet Banking and Commerce, 1-21.
Daud & Razak (2018). Impact of Customer Trust Toward Loyalty: The Mediating Role of Perceived Usefulness and Satisfaction . Journal of Business and Retail Management Research, 235-242.
David & Elena (2003). Trust and TAM in Online Shoping : An Integrated Model. M I S Quarterly, 51-90.
Davis & Mayer (2007). An Integrative Model of Organisational Trust: Past, Present and Future. Academy of Management Review, 344-354.
Davis (1989). Perceived Usefulness,Perceived Ease of Use, and User Acceptance of Information Technology. MIS Quarterly, 319-340.
Davis (1993). Use Acceptance of Computer Technology: System Charecteristics and User Pereptions. Intertional Journal of Man- Machine Studies, 475-487.
Davis & Bagozzi (1989). User Acceptance of Computer Technology: A Comparison of Two Theoretical Models. Management Science, 982-1003.
Dennis (2006). The Impact of Trust on the Acceptance of Online Banking. Europian Asoociation of Education and Research in Commercial Destribution, 1-19.
Demirdogen & Yilmaz (2010). Customer Risk Perceptıons of Internet Bankıng – A Study In Turkey. The Journal of Applied Business Research, 57-68.
Dimitriadis & Nickolaos (2011). The Effect of Trust, Channel Technology and Transaction Type on the Adoption of Self-Service Bank Channels. The Service Industries Journal, 1293-1310.

Bibliography
432
Dimitrios (2013). An Examination of the Critical Factors Affecting Consumer Acceptance Online banking: A focus on the Dimensions of Percieved Risk. Journal of Systems and Information Technology, 97-116.
Dinev & Hu (2007). The Centrality of Awareness in the Formation of User Behavioral Intention Toward Preventive Technologies in the Context of Voluntary Use. Journal of Association of Information Systems, 387-408.
Dishawa & Strong (1999). Extending the Technology Acceptance Model with Task Technology fit Constructs. Information and Management, 9-21.
Dixit & Datta (2010). Acceptance of E-banking among Adult Customers: An Empirical Investigation in India. Journal of Internet Banking and Commerce, 1-17.
Dlodlo (2014). The Relationships Among Service Quality, Trust, User Satisfaction and Post-Adoption Intentions in M-payment Services. Mediterranean Journal of Social Sciences, 165-175.
Dondolo & Madinga (2016). Ease of Use, Security Concerns and Attitudes as Antecedents of Customer Satisfaction in ATM Banking. Banks and Bank Systems, 122-126.
Dowling (1986). Perceived Risk: The Concept and its Measurement. Psychology and Marketing, 193-210.
Drennan (2010). An Investigation of Consumer Acceptance of Mobile banking. International Journal of bank Marketing , 547-568.
Durodolu (2016). Technology Acceptance Model as a Predictor of Using Information System’ to Acquire Information Literacy Skills. Library Philosophy and Practice, 1-27.
Dzogbenuku (2013). Banking Innovation in Ghana: Insight of Students’ Adoption and Diffusion. Journal of Internet Banking and Commerce, 1-20.
Ebru & Yagmur (2014). The Moderating Effects of Percieved Use and Percieved Risk in Online Shopping. Journal of Global Strategic Management, 71-85.

Bibliography
433
Eckel, & Grossman. (2002). Sex Differences and Statistical Stereotyping in Attitudes toward Financial Risk. Evolution and Human Behavior, 281-295.
Edward & Martey (2016). Contribution of Accessibility & Convenience as Adoption Tool of E-Banking in Ghana. International Journal of Innovative Reseach in Computer Science & Technology (IJIRCST), 159-162.
El- Kasheir & Ashour (2009). Factors Affecting Continued Usage of Internet Banking Among Egyptian Customers. Communication of the IBIMA, 252-263.
Elena Karahanna (1999). Information Technology Adoption Across Time; A Cross Sectional Comparison of Pre-Adoption and Post- Adoption Beliefs. MIS Quarterly, 183-213.
El-Qirem (2013). Critical Factors Influencing E-Banking Service Adoption in Jordanian Commercial Banks: A Proposed Model . International Business Research, 229-236.
Erickson & Kerem (2005). Customer Acceptance of Internet Banking in Estonia. International Journal of Bank Marketing, 200-216.
Ernovianti & Matr (2012). The Usage of Internet Banking Service among Highe Learning Students in Malaysia. American Journal of Economics, 105-108.
Errikson & Nilsson (2005). Customer Acceptance of Internet Banking in Estonia. International Journal of Bank Marketing , 200-216.
Fadare (2016). A Survey on Perceived Risk and Intention of Adopting Internet Banking. Journal of Internet Banking and Commerce, 1-21.
Fang (2006). Effects of Network Quality Attributes on Customer Adoption Intentions of Internet Banking. Total Quality Management & Business Excellence, 61-77.
Farzianpour & Mahsa (2014). Consumers' Perceived Risk and Its Effects on Adoption of Online Banking Services. American Journal of Applied Sciences, 47-56.

Bibliography
434
Fawzy & Esawai (2017). Internet Banking Adoption in Egypt: Extending Technology Acceptance Model. Journal of Business and Retail Management Research, 109-118.
Featherman & Pavlou (2002). Predicting E- service adoption, A Perceived Risk Facets Perspective. Human- Computer Interaction Studies in MIS, 1034-1046.
Firdous & Farooqi (2015). Impact of Internet Banking Service Quality on Customer Satisfaction. Journal of Internet Banking and Commerce.
Florentina Rusu & Shen (2011). An Empirical Study on E-Banking Acceptance in the United Arab Emirates (UAE). Journal of Electronic Banking Systems, 1-9.
Gamal & Gebba (2013). Mobile Banking Adoption: An Examination of TechnologyAcceptance Model and Theory of Planned Behavior. International Journal of Business Research and Development, 35-50.
Ganguli & Kumar (2011). Generic Technology‐based Service Quality Dimensions in Banking: Impact on Customer Satisfaction and Loyalty. International Journal of Bank Marketing, 168-189.
Geetha & Vaithiyanathan (2012). Assessment of a Modified Technology Acceptance Model among E-banking Customers in Coimbatore City. International Journal of Innovation, Management and Technology, 181-187.
Gefen (2000). E-commerce: The Role of Familiarity and Trust. Omega, 725-737.
Gefen & Straub (1997). Gender Difference in the Perception and Use of E-mail: An Extention to the TechnologyAcceptance Model. MIS Quarterly, 389-400.
George & Kumar (2014). Impact of Service Quality Dimensions in Internet Banking on Customer Satisfaction. Springer, 73-85.
George & Kumar (2014). Impact of Service Quality Dimensions in Internet Banking on Customer Satisfaction. Springer, 73-85.

Bibliography
435
Gerrard & Cunningham (2006). Why Consumers are not Using Internet Banking: A Qualitative Study. Journal of Service Marketing, 160-168.
Ghane & Fathian (2011). Full Relationship Among E-Satisfaction, E-Trust, E-Service Quality and E-loayalty; The Case of Iran E-Banking. Journal of Theroatical and Applied Information Technology, 1-6.
Gholamreza & Khaled (2012). Technology of E-banking: Perspective of Costumers’ Perceived Risk and Uncertainty. Indian Journal of Science and Technology, 2200-2208.
Giovanis, & Apostolos. (2012). An Extention of TAM Model with IDT and Security/ Privacy Risk in the Adoption of Internet Banking Services in Greece. Euromed Journal of Business, 24-53.
Goodhue, D., & Straub, D. (1991). Security Concerns of System Users: A study of Perceptions of the Adequacy of Security. Information and Management, 13-27.
Goh & Yeo (2016). Understanding Customer Satisfaction of Internet Banking: A Case study in Malacca. Procedia Economics and Finance, Science Direct, Elsevier, 80-85.
Gounaris & Koritos (2013). Investigating the Drivers of Internet Banking Adoption Decision: A Comparison of Three Alternative Frameworks. International Journal of Bank Marketing, 282-304.
Gubrellia (2008). Usability and Trust in E- banking. China: Psychological Reports.
Guinea & Markus (2009). Why Break the Habit of a Lifetime? Rethinking the Roles of Intention, Habit, and Emotion in Continuing Information Technology Use. MIS Quarterly, 434-444
Gupta & Rakhi (2013). Dimensions Affecting Consumers’ Continued Usage and Frequency of Usage of Internet Banking: Empirical Evidence from India. International Journal of Engineering and Innovative Technology (IJEIT), 21-32.

Bibliography
436
Hada & Singh (2018). "Online Banking and Customer Satisfaction in Public and Private Sector Banks: Evidence from India. IOSR Journal of Business and Management, 10-20.
Hadji & Degoulet (2016). Information System End-user Satisfaction and Continuance Intention: A unified Modeling Approach. Journal of Bio Medical Informatics, 185-193.
Hamid & Zaidi (2016). The Effects Of Perceived Usefulness And Perceived Ease Of Use On Continuance Intention To Use E-Government. Procedia Economics and Finance, 644-649.
Han & Hong (2018). A Model and Empirical Study on the User’s Continuance Intention in Online China Brand Communities Based on Customer-Perceived Benefits. Journal of Open Innovation, Technology Market and Complexity, 1-20.
Hartmut & Hoehle (2012). The Role of Continuous Trust Information System's Continuance. Journal of Computer Information System, 1-9.
Hee-Woong & Xu (2004). A Comparison of Online Trust Building Factors between Potential Customers and Repeat Customers. Journal of the Association for Information Systems, 392-420.
Hernan & Requelme (2010). The Moderating Effect of Gender in the Adoption of Mobile Banking. International Journal of Bank Marketing, 328-341.
Hernandez-Ortega (2011). The Role of Post use Trust in the Acceptance of a Technolgy: Drivers and Consequances. Technovision, 523-538.
Hong (2015). Examining Mobile Payment User Adoption; From the Perspective of Trust. International Journal of Networking and Virtual Organisations, 117-130.
Hossain & Md Yahin (2015). Mobile Banking and Customer Satisfaction: The Case of Dhaka City. World Review of Business Research, 108-120.
Howard & Sheth (1969). The Theory of Buyer Behavior. New York: Willey Marketing Series.
Bibliography
437
Hsieh & Wei Wang (2007). Explaining Employees’ Extended Use of Complex Information Systems. European Journal of Information Systems, 216-227.
Huang (2017). Cognitive Factors in Predicting Continued use of Information Systems with Technology Adoption Models. Information Research, 1-42.
Hui-Min & Lai (2016). Expectation-Confirmation Model of Information System Continuance: A Meta-Analysis . International Scholarly and Scientific Research & Innovation , 2325-2330.
Hung Kit Lui (2003). TRI TAM: A Model for Integrating Trust and Risk Perceptions in Business-to-Consumer ElectronicCommerce. 16th Bled eCommerce Conference Bled, 349-364.
Hung & Hsieh (2012). An Examination of the Determinents of Mobile Shopping Continuance. International Journal of Electronic Business Management, 29-37.
Hussain (2014). Innovation Acceptance Research: A Review of Theories, Contexts, and Approaches. Journal of Internet Banking and Commerce, 1-18.
Ibrahim & Al-Jabri (2012). Mobile Banking Adoption- Application of Diffusion of Innovation Theory. Journal of Electronic Commerce Research, 379-391.
Icek & Fishbein (1975). Understanding Attitudes and Predicting Social Behavior. Michigan: Prentice-Hall.
Iranmanesh & Ali (2012). New Approach to Study of Factors Affecting Adoption of Electronic Banking Services with Emphasis on the Role of Positive Word of Mouth. African Journal of Business Management, 4328-4335.
Islam & Gronlund (2011). Factors Influencing the Adoption of Mobile Phones Among the Farmers in Bangladesh: Theories and Practices. International Journal on Advances in ICT for Emerging Regions, 4-14.

Bibliography
438
Islam & Umme (2014). Customer Satisfaction of Internet Banking in Bangladesh: A Case Study on Citibank N.A. Asian Journal of Applied Science and Engineering, 51-62.
Jacoby, & Kaplan. (1972). The Components of Percieved Risk. Annual Conference of the Association of Consumer Research, 382-393.
Jaism & Hamdi (2012). Factors Influening Consume's Satisfaction and Continuity to deal with E- banking Services. Global Journal of Management and Business Research, 128-142.
Jason & Harrison (2009). The Role of Trust in Post-Adoption IT Exploration: An Empirical Examination of Knowledge Management Systems. IEEE Transactions and Engineering Management, 1-15.
Jason & Thatcher (2017). How and Why Trust Matters in Post-Adoptive Usage: The Mediating Roles of Internal and External Self-efficacy. The Journal of Strategic Informations, 1-21.
Jayasiri & Dharmadasa (2016). Adoption of Internet Banking in Sri Lanka - An extension to Technology Acceptance Model. Asia Pacefic Journal of Contemporary Education and communication Technology, 179-189.
Jen-Hwa & Brown (2009). Determinants of Service Quality and Continuance Intention of Online Services: The Case of eTax. Journal of the American Society for Information Science and Technology, 292-306.
Jeong & Yoon (2013). An Empirical Investigation on Consumer Acceptance of Mobile Banking Services. Business and Management Research, 31-40.
Jham (2016). Customer Satisfaction with Internet Banking: Exploring the Mediating Role of Trust. Journal of Emerging Trends in Economics and Management Sciences , 75-87 .
Jian & Cohen (2017). Understanding Trust and Perceived Usefulness in the Consumer Acceptance of an E-service: A Longitudinal Investigation. Behavior and Information Technology, 125-139.
John (2013). Mobile Banking Products and Rural India: An Evaluation. IOSR Journal of Economics and Finance, 36-40.

Bibliography
439
Joshua & Koshy (2011). Usage Patterns of Electronic Banking Services by Urban Educated Customers: Glimpses from India. Journal of Internet Banking and Commerce, 1-12.
Joubert & Belle (2013). The Role of Trust and Risk in Mobile Commerce Adoption within South Africa . International Journal of Business, Humanities and Technology, 27-38.
Juwaheer & Pudaruth (2012). Factors Influencing the Adoption of Internet Banking: A Case Study of Commercial Banks in Mauritius. World Journal of Science, Technology and Sustainable Development, 204-234.
Jun & Yang (2004). Customers' Perceptions of Online Retailing Service Quality and their Satisfaction. International Journal of Quality & Reliability Management, 817-840.
Kapoor (2015). Customer Satisfaction and E – Banking services: A Case Study of Tricity. International Journal of Innovative Research in Science, Engineering andTechnology, 10270-10277.
Karahanna, & Straub. (2003). Trust and TAM in online shopping; An Integrated Model. MIS Quarterly, 27-34.
Kassim & Ramayah (2015). Measurement Model of Risk Perception in Internet Banking Based on Malysian Context. ARPN Journal of Engineering and Applied Sciences, 17632-17639.
Kaur & Kiran (2014). Customer Satisfaction and Customer Loyalty in E-Banking in India: The Intricacies of Relationship . IOSR Journal of Business and Management, 6-13.
Kaushik & Zillur (2014). Innovation Adoption Across Self-Service Banking Technologies in India. International Journal of Bank Marketing, 96-121.
Kent & Kerem (2005). Customer Acceptance of Internet Banking in Estonia. International Journal of Bank Marketing, 200-216.
Kesharwani & Singh (2011). The Impact of Trust and Perceived Risk on Internet Banking Adoption in India. International Journal of Bank Marketing, 303-322.

Bibliography
440
Khayati (2013). Perceived Usefulness and Use of Information Technology: The Moderating Influences of the Dependence of a Subcontractor towards His Contractor. Journal of Knowledge Management, Economics and Information Technology, 1-28.
Khattab & Al-Shalab (2015). The Effect of Trust and Risk Perception on Citizen’s Intention to Adopt and Use E-Government Services in Jordan. Journal of Service Science and Management, 279-290.
Khedmatgozar (2012). The Mediating Role of the Dimensions of the Perceived Risk in the Effect of Customers’ Awareness on the Adoption of Internet Banking in Iran. Electronic Commerce Research, 151-175.
Kim (2012). An Investigation of the Effect of Online Consumer Trust on Expectation, Satisfaction, and Post-Expectation. Information Systems and E -Business Management, 219-240.
Kim & Hong (2016). Antecedents of Use-Continuance in Information Systems: Toward an Inegrative View. Journal of Computer Information Systems, 61-73.
Kim & Hyo-Joo (2008). The Effects of Perceived Risk and Technology Type on Users’ Acceptance of Technologies. Information and Management, 1-9.
Klaus-Peter & Seegebarth (2010). The Influence of Consumers’ Risk Attitudes and Behavioron the Adoption of Online Banking Services. Journal of Marketing Trends, 7-16.
Klopping & McKinney (2004). Extending the Technology Acceptance Model and the Task-Technology Fit Model to Consumer E-Commerce. Information Technology, Learning, and Performance Journal, 35-48.
Kmaran & Mohammed (2010). A Model for E- banking Trust in Iran's Banking Industry. International Journal of Industrial Engineering and Production Research, 23-33.
Kodithuwakku (2018). Impact of Internet Banking on Customer Satisfaction: A Case Study of State Banks in Kandy District. Academy of Social Science Journal, 1114-1122.

Bibliography
441
Koufaris & Sosa (2004). The Development of Initial Trust in an Online Company by New Customers. Information & Management, 377-397.
Krishna & Ramana (2016). A Study on Customer Awareness and Satisfaction towards Handloom Products with Special Reference to Guntur District – Andhra Pradesh. Acme Intelle International Journal of Research in Management, Social Sciences & Technology, 1-16.
Kumar & Ravindran (2012). An Empirical Study on Service Quality Perceptions and Continuance Intention In Mobile Banking Context in India. Journal of Internet Banking and Commerce, 1-22.
Kumar & Balaji (2017). Predicting Internet banking Adoption in India: A Perceived Risk Perspective. Journal of Strategic Marketing, 418-438.
Kumar & Madhumohan (2014). Internet Banking Adoption in India Structural Equation Modeling Approach. Journal of Indian Business Research, 155-169.
Kumari & Janaka (2014). Impact of Mobile Banking Services on CustomerSatisfaction:A Study on Sri Lankan State Commercial Bank. International Journal of Computer and Information Technology, 546-552.
Kumbhar (2011). Factors Affecting Customer Satisfaction in E- banking- Some Evidence from Indian Banks. Management Research and Practice, 1-14.
Kumbhar (2013). Refinement and Retesting of“eBankQual” Scale in Internet Banking Service Settings. Emerging Trends in Infromation Technology and Management (1-14) Munich Personal RePEc Archive.
Kundu & Kumar (2014). Impact of Trust on the Relationship of E-service Quality and Customer Satisfaction. Euro Med Journal of Business, 21-46.
Kyung & Bipin (2009). Trust, Perceived Risk and Trusting Behavior in Internet banking. Asia Pacefic Journal of Information System, 1-23.
Lacramioara, & Cosmin (2013). An Application of Technology Acceptance Model to Internet Banking Services. International Conference “Marketing – from Information to Decision, (pp. 251-266). Romania.

Bibliography
442
Laforet & Li (2005). Consumers’ Attitudes Towards Online and Mobile Banking in China. International Journal of Bank marketig, 362-380.
Lee & Chi (2009). Factors Influencing the Adoption of Internet Banking: An Integration of TAM and TPB with Perceived Risk and Perceived Benefit. Electronic Commerce Research and Applications, 130-141.
Lee & Kim (2007). Factors Influencing the Adoption Behavior of Mobile Banking : A South Korean Perspective. Journal of Internet Banking and Commerce, 1-9.
Lee & Chen (2014). Perceived Quality as a Key Antecedent in Continuance Inetntion on Mobile Commerce. International Journal of Electronic Commerce Studies, 123-142.
Lee & Wang (2012). The Impact of Task Technology Fit, Perceived Usability and Satisfaction on M-Learning Continuance Intention . International Journal of Digital Content Technology and its Applications(JDCTA), 35-42.
Lele & Maheshkar (2017). A Review of Technology Adoption Models and Research Synthesis of Pre and Post-Adoption Behavior in Online Shopping. IOSR Journal of Business and Management (IOSR-JBM), 37-48.
Leonard (2007). Perceived Usefulness, Service Quality and Loyalty Incentives : Effects on Electronic Service Continuance . South African Journal of Business Management, 39-38.
Liao & Kuanchin (2011). Examining the Impact of Privacy, Trust and Risk Perceptions Beyond Monetary Transactions: An Integrated Model. Electronic Commerce Research and Applications, 702-715.
Liaoa & Yenb (2007). Theory of Planned Behavior (TPB) and Customer Satisfaction in the Continued Use of E-service: An Integrated Model. Computers in Human Behavior, 2804-2822.
Liebana-Cabanillas & Munoz-Leiva (2013). The Determinants of Satisfaction with E-banking. Industrial Management & Data Systems, 750-767.

Bibliography
443
Liébana-Cabanilla & Muñoz-Leiva (2015). Influence of Age in the Adoption of New Mobile Payment Systems. Review of Business Management, 1390-1407.
Lifen & Koenig-Lewis (2010). Adoption of Internet banking Services in China: Is it all about Trust? International Journal of Bank Marketing, 7-26.
Lii (2009). A Model of Customer E-loyalty in the Online Banking. Economics Bulletin, 891-902.
Lingling (2014). An Empirical Study on Mobile Social Networking Services, Integrating IS Success Model, Network Externalities, and Flow Theory. Asia Pacific Journal of Marketing and Logistics, 168-189.
Lingying & Zhang (2012). Dimensions of Consumers’ Perceived Risk and Their Influences on Online Consumers’ Purchasing Behavior. Communication Information Science Management Engineering, 8-14.
Luiz Moutinho (2000). Modelling Bank Customer Satisfaction through Mediation of Attitudes towards Human and Automated Banking. International Journal of Bank Marketing, 124-134.
Luqman & Ismail (2014). A Review on Mobile Commerce Continuance Intention Studies and its Underlying Model . Journal of Basic and Applied Scientific Research , 1-9.
Maditinos & Chatzoudes (2013). An Examination of the Critical Factors Affecting Consumer Acceptance of Online Banking; A Focus on the Dimensions of Risk. Journal of Systems and Information Technology, 97-116.
Maduku & Daniel (2014). Customers’ Adoption and Use of E-banking Services: The South African Perspective. Banks and Bank Systems, 78-88.
Mahatanankoon & Vila-Ruiz (2007). Why Won't Consumers Adopt M-Commerce? An Exploratory Study. Journal of Internet Commerce, 113-128.
Mahmoud & Alsheyyab (2012). Effect of Trust on E-Banking User’s Satisfaction: A Review. Research Journal of Applied Sciences, Engineering and Technology, 1397-1406.

Bibliography
444
Malhotra (2009). An Analysis of Internet Banking Offerings and its Determinants in India. Internet Research, Emerald, 87-106.
Man (2006). Factors Affecting Customer’s Trust in Online banking. Hong Kong: Hong Kong Baptist University.
Mandan & Kheiry (2013). Analysis of the Effects of Electronic Banking on Customer Satisfaction and Loyalty (Case study: Selected Branches of Melli Bank in Tehran). Inter Disciplinary Journal of Contemporary Reseach in Business, 230-241.
Mansour & Ben (2016). An Analysis of Business’ Acceptance of Internet Banking: An Integration of E-trust to the TAM. Journal of Business & Industrial Marketing, 982-994.
Marafon & Basso (2018). Perceived Risk and Intention to use Internet Banking: The Effects of Self-confidence and Risk Acceptance. International Journal of Bank Marketing, 277-289.
Margaret Tan (2000). Factors Influencing the Adoption of Internet Banking. Journal of the Association for Information Systems.
Marous (2018). Five Innovation Trends that Will Define Banking in 2019. Financial Brand
Marzieh zendehdel (2016). The Moderating Effect of Culture on the Construct Factor of Perceived Risk towards Online Shopping Behaviour. Cogent Business Management .
Mathieson (1991). Redicting User Intentions: Comparing the Technology Acceptance Model with the Theory of Planned Behavior. Information Syystem Research, 173-191.
Mayer & Davis (1995). An integrative Model of Organisational Trust. Academy of Management Review, 709-734.
McCloskey (2006). The Importance of Ease of Use, Usefulness and Trust to Online Consumers: An Examination of the Technology Acceptance Model with Older Customers. Journal of Organizational and End User Computing, 47-65.

Bibliography
445
Mckechnie & Sally (2006). Applying the Technology Acceptance Model to the Online Retailing of Financial Services. International Journal of Retail and Destributional Management, 388-410.
Mcknight & Bennet (2013). Incorporating Trust in Technology into Expectation Disconfirmation Theory. Journal of Strategic Information Systems, 128-145.
McKnight & Carter (2009). Trust in Technology: Development of a Set of Constructs and Measures. DIGIT ( 1-10). Association for Information Systems AIS Electronic Library (AISeL) .
Micknight & Carter (2011). Trust in a Specific Technology: An Investigation of its Components and Measures. Transactions on Management Information Systems (TMIS), 1-25.
Md Nor (2010). Adoption of Internet Banking Theory of Diffusion of Innovation. International Journal of Management Studies, 69-85.
Mei-Chun & Wu (2008). An Empirical Investigation of Habitual Usage and Past Usage on Technology Acceptance Evaluations and Continuance Intention. The Data base for Advance Systems, 48-73.
Meuter & Robert (2000). Self-Service Technologies: Understanding Customer Satisfaction with Technology-Based Service Encounters. Journal of Marketing, 50-64.
Mihail & Cocosila (2009). Early Investigation of New Information Technology Acceptance: A Perceived Risk Motivation Model. Communications of the Association for Information Systems, 340-358.
Mirjana & Bacha (2016). Technology Acceptance Model for Business Intelligence Systems:Preliminary Research. Procedia Computer Science, 995 – 1001 .
Mohamad & Salwani (2013). Technology Trust and Mobile Banking Satisfaction: A Case of Malaysian Consumers. International Conference on Innovation, Management and Technology Research (pp. 53-58). Malaysia: Elsevier.

Bibliography
446
Mohammed & Rahman (2017). User Adoption of Mobile Commerce in Bangladesh: Integrating Perceived Risk, Perceived Cost and Personal Awareness with TAM. The International Technology Management Review, 103-124.
Mohd & Md Ariff (2013). The Impacts of Service Quality and Customer Satisfaction on Customer Loyalty in Internet Banking. Procedia - Social and Behavioral Sciences, Elsevier, 469-473.
Mohtar (2018). A conceptual model; Continuance intention on mobile banking among Malaysian Customers. Conference on Technology & Operations Management, 394-402.
Moon & Kim (2001). Extending the TAM for a World-Wide-Web Context. Information & Management, 217-230.
Mou & Shin (2016). Understanding Trust and Perceived Usefulness in the Consumer Acceptance of an E-service: A Longitudinal Investigation. Behavior and Information Technology, 125-139.
Mousa & Luvai (2017). Privacy and Personalisation in Continued Usage Intention of Mobile Banking: An Integrative Perspective. Information System Frontiers, 1-13.
Muneesh & Sareen (2013). Factors Influencing the level of Adoption of Internet Banking: An Integration of TAM and Web Trust Model. Asian Journal of Management Research, 130-145.
Muche & Sharma (2017). Influence on Demographic Factors on Users' Adoption of Electronic Banking in Ethiopia. Journal of Internet Banking and Commerce, 1-17.
Munir (2015). E-Banking Service Quality and Customer Satisfaction of a State Owned Schedule Bank of Bangladesh. Journal of Internet Banking and Commerce.
Musiime & Ramadhan (2011). Internet Banking, Consumer Adoption and Customer Satisfaction. African Journal of Marketing Management, 261-269.

Bibliography
447
Nadim & Noorjahan. (2007). The Role of Perceived Usefulness, Perceived Ease of Use Security and Privacy and Customer Attitude to Engender Customer Adaptation in the Context of Electronic Banking. African Journal of Business Management, 032-040.
Naimat & Poloola (2013). The Effect of Trust in Adoption of Internet Banking: A case study of Nigeria. Academic Research Journals, 20-24.
Naser & Majid (2016). Investigating Effective Factors on Customer Satisfaction of Internet banking ; The Case of Post Bank of Iran. International Journal of Humanities and Cultural Studies, 1706-1718.
Naser & Mohamad (2014). Studying the Impact of E-Service Quality on E-Loyalty of Customers in the area of E- banking Services. Journal of Management and Sustainability, 126-133.
Nasim & Hosein (2009). Internet Banking: An Empirical Study of Adoption Rates Among Midwest Community Banks. Journal of Business & Economics Research , 51-72.
Nasri & Zarai (2014). Emprical analysisin internet banking adoption in Tunisia. Asian Economic and Financial Review, 1812-1825.
Nasrin & Akram (2014). Identify and Rank the Factors Affecting Customer Satisfaction of E-Banking. International Business and Management, 162-168.
Nath & Mukherjee (2003). A Model of Trust in Online Relationship Banking. The International Journal of Bank Marketing, 5-15.
Noreen (2015). Awareness of Electronic Banking and the Customer's Level of Satisfaction in Pakistan. Arabian Journal of Business and Management Review (Nigerian Chapter), 37-47.
Normalini & Ramayah (2015). Perceived Risk Factors Influence on Intention to Continue Using Internet Banking among Malaysians. Global Business Review.
Norshidah Mohamed (2014). Insights into Individual’s Online Shopping Continuance Intention. Industrial Management & Data systems, 1453-1476.

Bibliography
448
NPCI (2018) Electronic Payment System Representative Data , National Payment Corporation of India, Mumbai.
Ofori & Boateng (2017). Examining Customers’ Continuance Intentions towards Internet Banking Usage. Marketing Intelligence & Planning, 756-773.
Oliver (1980). A Cognitive Model of the Antecedents and Consequences of Satisfaction Decisions. Journal of Marketing Research, 460-469.
Oliver (1977). Effect of Expectation and Disconfirmation on Post- Exposure Product Evaluations - An Alternative Interpretation. Journal of Applied Psychology, 480-486.
Oliver (2008). A Cognitive Model of the Antecedents and Consequences of Satisfaction Decisions. Journal of Marketing Research, 460-469.
Ortega. (2011). The Role of Post-use Trust in the Acceptance of a Technology: Drivers and Consequences. Technovation, 523-538.
Parasuraman & Zeithaml. (2005). E-S-QUAL a Multiple-item Scale for Assessing Electronic Service Quality. Journal of Service Research, 213-233.
Parasuraman & Leonard (1985). A Conceptual Model of Service Quality and Its Implication for Future Research (SERVQUAL). International Journal of Marketing, 41-50.
Patricia (2016). When, How, and Why Do We Trust Technology Too Much? Emotions, Technology and Behavior, 85-106.
Pavlou (2001). Integrating Trust in Electronic Commerce with the Technology Acceptance Model: Model Development and Validation. AMCIS 2001 Association for Information Systems AIS Electronic Library, AISeL, 816-822.
Pavlou & Liang (2007). Understanding and Mitigating Uncertainty in Online Exchange Relationships: A Principal-Agent Perspective. Management Information Systems Quarterly, 1-31.

Bibliography
449
Pikkarainen & Kari (2004). Consumer Acceptance of Online Banking: An Extension of the Technology Acceptance Model. Internet Research, 224-235.
Pin & Hsin (2005). Toward an Understanding of the Behavioral Intention to Use Mobile banking. Computers in Human behavior, 873-891.
Piriyakul & Raepepan (2015). Effects of Trust, Satisfaction and Factors Corresponding toTAM on Intention to Reuse Internet Business Transaction. International Review of Management and Business Research, 872-890.
Poon (2008). Users’ Adoption of E-banking Services: The Malaysian Perspective. Journal of Business & Industrial Marketing, 59-69.
Podsakoff, P. M., MacKenzie, S. B., & Lee, J.-Y. (2003). Common Method Biases in Behavioral Research: A Critical Review of the Literature and Recommended Remedies. Journal of Applied Psychology, 879-903.
Pratap & Bhattacharya (2013). Customer Satisfaction in Indian Retail Banking: A Grounded Theory Approach. USA: Nova Southeastern University.
Praveena (2018). Trust and Hedonic Motivation: Predicting the Satisfaction and Continuance Intention to use Facebook. Asian Journal of Management, 317-321.
Praveena & Thomas (2014). Continuance Intention to Use Facebook: A Study of Perceived Enjoyment and TAM. Bonfring International Journal of Industrial Engineering and Management Science, 24-29.
Prybutok & Xu (2011). An Integrated Model for Customer Online Repurchase Intention. Faculty Research and Creative Activity, 1-11.
Rahman & Kaushik (2014). Innovation Adoption Across Self-Service Banking Technologies in India. International Journal of Bank Marketing, 96-120.
Ranjan & Malik (2018). Explaining Customer’s Continuance Intention to Use Mobile Banking Apps with an Integrative Perspective of ECT and Self-Determination Theory. Pacefic Asia Journal of the Association for Information System, 79-112.

Bibliography
450
Rao (2015). The Impact of Brand Awareness on Customer Satisfaction: A Case Study of Godfrey Phillips India Limited, India . Research Journal of Social Science and Management, 38-44.
Rashid & Saleem. (2011). Relationship Between Customer Satisfaction and Mobile Banking Adoption in Pakistan. International Journal of Trade, Economics and Finance, 537-544.
RBI (2018) Report on Trends and Progress of Banking in India, Reserve Bank of India.
Regina (2015). A Study on Customer Awarness and Satisfaction towards E-Banking Services. Indian Journal of Applied Research.
Reichheld & Shefter (2000). E-Loyalty: Your Secret Weapon on the Web. Harward Business Review, 105-114.
Ricardo (2016). Intention of Adoption of Mobile Payment: An Analysis in the Light of the Unified Theory of Acceptance and Use of Technology (UTAUT). RAI Revista de Administração e Inovação, 221-230.
Rice & Shook (1988). Access to Usage of and Outcome from an Electronic Meassaging System. ACM Transactions on Information Systems, 255-276.
Richard (2013). The Influance of Perceived Ease of Use and Perceived Usefulness on Trust and Intention to Use Mobile Service Software. African Journal of Physical Health Education, Recreation and Dance, 258-273.
Richard (1997). Satisfaction: A Behavioural Perspective on the Consumer. NewYork: McGraw Hill.
Rogers (1962). Diffusion of Innovations. Newyork: Free Press of Glencoe.
Rogers (1991). Communication of Innovation A cross Cultural Approach. Newyork: Free Press.
Roselious. (1971). Consumer Ranking of Risk Reduction Methods. Journal of Marketing , 56-61.
Roy & Dewit (2001). The Impact of Interface Usability on Trust in Web Retailers. Internet Research, Electronic Applications and Policy, 388-398.

Bibliography
451
Sabi (2014). Research Trends in the Diffusion of Internet Banking in Developing Countries. Journal of Internet Banking and Commerce, 1-31.
Sadhegi & Hanzaee (2010). Customer Satisfaction Factors (CSFs) with Online Banking Services in an Islamic Country Iran. Journal of Islamic Marketing, 249-267.
Saeedeh & Abolfazl (2017). Effect of Electronic Service Quality on CustomerSatisfaction and Loyalty Saderat Bank’s Customers. International Journal of Scientific study, 407-411.
Safeena & Date (2013). Combination of TAM and TPB in Internet Banking Adoption. International Journal of Computer Theory and Engineering, 146-150.
Safeena & Date (2012). Technology Adoption and Indian Consumers: Study on Mobile Banking . International Journal of Computer Theory and Engineering, 1020-1024.
Saleh & Steve (2014). Using the Technology Acceptance Model in UnderstandingAcademics’ Behavioural Intention to Use Learning Management Systems. International Journal of Advanced Computer Science and Applications, 143-155.
Salomann & Dous (2007). Self-Service Revisited; How to Manage Hi-tech and Hi-touch in Customer Relationships. Europian Management Journal, 310-319.
Sanjeepan & Ragel (2017). A Study on Impact of Switching Cost on Customer Satisfaction for Internet Banking Services at Commercial Banks in Batticaloa. International Journal of Economics and Business Management, 12-23.
Sankar & Kumari (2016). Factors Affecting Mobile Banking Adoption Behavior in India. Journal of Internet Banking and Commerce, 1-24.
Santhanamery (2016). The Effect of Trust in the System and Perceived Risk in Influencing Continuance Usage Intention of an E-Government System . Journal of Applied Environmental and Bilological Science, 7-18.

Bibliography
452
Santouridis & Kyritsi (2013). Investigating the Determinants of Internet Banking Adoption in Greece. The Economies of Balkan and Eastern Europe Countries in the Changed World (EBEEC 2013, Elsevier, 501-510.
Sathye (1999). Adoption of Internet banking by Australian consumers: An Empirical Investigation. International Journal of Bank Marketing, 324-334.
Serkan & Aligan (2004). Adoption of Internet Banking among Sophisticated Consumer Segments in an Advanced Developing Country. International Journal of Bank Marketing, 212-232.
Semina& Halilovic (2015). Changes in Beliefs, Satisfaction and Information System Continuance Intention of Experienced Users. Intenational Journal of Business and Information Systems, 509-535.
Sikdar (2014). Online Banking Adoption; A Factor Validation and Satisfaction Causation Study in the Context of Indian Banking Sector. International Journal of Bank Marketing, 760-785.
Shahimi & Shabudin (2018). Conceptual Model; Continuance Intention of Mobile banking Among Malaysian Customers. Conference on Technology & Operations Management (2ndCTOM). 394-402).
Shanab & Pearson (2008). Internet Banking in Malasisa Based on the Theory of Reasoned Action. The International Journal of Bank Marketing, 3-13.
Shaoyi Liao (1999). The Adoption of Virtual Banking: An Empirical Study. International Journal of Information Management, 63-74.
Sharma & Purushotham (2014). Technology Acceptance Perspective on User Satisfaction and Trust of E-Governement Adoption . Journal of Applied Sciences , 860-872.
Sharma & Madhumohan (2015). Predicting Determinants of Internet Banking Adoption; A two-Staged Regression-Neural Network Approach. Management Research Review, 750-766.
Sharman (2006). Understanding Consumer Adoption of Internet Banking: An Intrepretive Study in the Australian Banking Context. Journal of Electronic Commerce Research, 50-66.

Bibliography
453
Shih & Fang (2004). The Use of a Decomposed Theory of Planned Behavior to Study Internet Banking in Taiwan. Internet Research; Bradford, 213-223.
Shin & Yahya (2015). Consumers’ Perception towards the Extent of Internet Banking Usage in Malysia. Problems and Perspectives in Management, 288-295.
Shish- Chich Chen (2013). Integrating Technology Readiness into Expectaion Confirmation Model- An Empirical Study of Mobile Service. Cyber Pschology Behavior and Social Networking.
Shih-Chih Chen (2011). A Conceptual Model to Understand the Effects of Perceptionon the Continuance Intention in Facebook. Australian Journal of Business and Management Research, 29-34.
Shish- Chich Chen (2011). Recent Related Research in Technology Acceptance Model- A Literature Review. Australian Journal of Business and Management Research, 124-127.
Shish & Lien lin (2015). Perceived Quality Factors of Location-based Apps on Trust, Perceived Privacy Risk, and Continuous Usage Intention. Behavior and Information Technology, 2-10.
Shin Ho & Yahya (2015). Consumers’ Perception Towards the Extent of Internet Banking Usage in Malysia. Problems and Perspectives in Management, 288-295.
Shish & Lien (2015). Perceived Quality Factors of Location-based Apps on Trust, Perceived Privacy Risk, and Continuous Usage Intention. Behavior and Information Technology, 2-10.
Shunbo Yuan (2016). An Investigation of Users’ Continuance Intention towards Mobile Banking in China. Information Development, 20-34.
Simon Gyasi Nimako (2013). Customer Satisfaction with Internet Banking Service Quality In The Ghanaian Banking Industry. International Journal of Scientific & Technology Research, 165-175.
Simpe & Boateng (2016). Examining Customers’ Continuance Intentions towards Internet Banking Usage. Marketing Intelligence & Planning, 756-773.

Bibliography
454
Singh (2014). Factors Influencing E-Banking Adoption in India: An Amalgamation of TAM and TPB. International Journal of Computer Science and Technology, 91-96.
Singh (2015). Customer Perception of Mobile Banking: An Empirical Study in National Capital Region Delhi. Journal of Internet Banking and Commerce.
Singh (2017). Adoption of Internet Banking Services in India: An Empirical Study. Global Journal of Management and Business Research E-Marketing, 36-42.
Soheila Ghaane (2011). Full Relationship among E- satisfaction, E-service quality E- trust and E-loyalty; The case of Iran E-banking. Journal of Theoratical and Applied Information Technology, 1-6.
Stacie Petter (2008). Measuring Information Systems Success: Models, Dimensions and Inter Relationships. European Journal of Information Systems, 236-263.
Stikin, & Pablo. (1992). Reconceptualising the Determinants of Risk Behavior. The Academy of Management Review, 9-38.
Straub (1991). Security Concerns of System Users; A Study of Perceptions of the Adequacy of Security. Information and Management, 13-27.
Subrangshu, S. (2016). Technological Innovations in Indian banking Sector- A Trend Analysis. Journal of Commerce and Management Thought, 171-185.
Sumeet Gupta (2010). Examining the Relative Influence of Risk and Control on Intention to Adopt Risky Technologies. Journal of Technology Management & Innovation, 22-37.
Sun (2010). Sellers’ Trust and Continued Use of Online Marketplaces. Journal of the Association for Information Systems, 182-211.
Susan Brown (2008). Expectation Confirmation: An Examination of Three Competing Models. Management Information System, 52-66.
Susanto & Chang (2016). Determinants of Continuance Intention to Use the Smartphone Banking Services. Industrial Management & Data Systems, 508-525.

Bibliography
455
Susanto & Park (2012). The Role of Trust and Security in Smartphone Banking Continuance. IEE International Conference on Systems, Man, and Cybernetics, Research Gate, 2133-2138.
Swanson (1982). Measurig User Attitudes in MIS Research- A Review. Omega International Journal of Mangement Science, 157-165.
Syed & Qureshi (2011). Trust and Initial Acceptance of Mobile Banking in Pakistan. International Journal of Scientific & Engineering Research, 1-14.
Taherdoost & Shamsul (2012). Smart Card Technology; Awareness and Satisfaction. Journal of Computing, 128-132.
Tahir & Abdollah (2013). The Impact of Technology CSFs on Customer Satisfaction and the Role of Trust : An Empirical Study of the Banks in Malaysia. International Journal of Bank Marketing, 429-447.
Tamara Dinev (2007). The Centrality of Awareness in the Formation of User Behavioral Intention toward Protective Information Technologies. Journal of the Association of the Innovation System, 386-408.
Tams Bennet, & Craig (2018). How and Why Trust Matters in Post-Adoptive Usage: The Mediating Roles of Internal and External Self-Efficacy. Journal of Strategic Information Systems, 170-190.
Tanakinjal (2012). Exploring Technical Knowledge, Perceived Risk and the Innovative Characteristics in the Adoption of Mobile Marketing. American International Journal of Contemporary Research, 69-80.
Tavishi & Kumar (2013). An Empirical Study on Technology Adoption by Indian Banks. Global Journal of Management and Business Studies, 1169-1172.
Taylor (1995). Understanding Information Technology Usage; A test of Competeing Models. Information System Research, 144-176.
Taylor & Todd (1995). Assessing IT usage: The Role of Prior Experience. MIS Quarterly, 561-570.

Bibliography
456
Teng & Cheng (2013). Perceptions of Satisfaction, Usefulness, and Ease-of-use in the Use of Health Education Website. International Journal of Education and Information Technologies , 194.
Thakur (2012). Adoption Readiness, Personal Innovativeness, Perceived Risk and Usage Intention across Customer Groups for Mobile Payment Services in India. Internet Research, 369-392
Thompson & Teo (2004). Consumer Trust in E-Commerce in the United States,Singapore and China. OMEGA, International Journal of Management Science, 24-38.
Thong & Tum (2006). Understanding Continued Information Technology Usage Behavior: A Comparison of three Models in Context of Mobile Internet. Decision Support Systems , 1819-1834.
Thong (2006). The Effects of Post-adoption Beliefs on Expectation Confirmation Model for Information Technology Continuance. International Journal of Human Computer Studies, 799-810.
Thulani & Collins (2011). Adoption And Use of SMS/Mobile Banking Services in Zimbabwe: An Exploratory Study. Journal of Internet Banking and Commerce, 1-14.
Trong & Minh (2019). E-Satisfaction and Continuance Intention: The Moderator Role of Online Ratings. International Journal of Hospitality Management, 311-322.
Tsai- Jui & Ming-Tien (2014). The Influences of System Usability and User Satisfaction on Continued Internet Banking Services Usage Intention Empirical Evidence from Taiwan. Electronic Commerce Research, 137-169.
Valvi & West (2013). E-Loyalty is not at all about Trust, Price also Matters: Extending Expectation- Confirmation Theory in Book Selling Websites . Journal of Electronic Commerce Research, 99-123.
Vasileiadis (2014). Security Concerns and Trust in the Adoption of M.Commerce. Alexios Vasileiadis, 179-191.

Bibliography
457
Vasileios Terzis (2013). Continuance Acceptance of Computer based Assessment through the Integration of User’s Expectations and Perceptions. Computers & Education, 50-61.
Vatanasombuta & Styliano (2008). Information Systems Continuance Intention of Web-Based Applications Customers: The Case of Online Banking . Information & Management, 419-428.
Venkatesh & Davis (2000). A Theoretical Extension of the Technology Acceptance Model: Four Longitudinal Field Studies. Management Science, 186-204.
Venkatesh & Morris (2003). User Acceptance of Information Technology: Toward a Unified View. MIS Quarterly, 425-478.
Venkatesh & Thong (2011). Extending the Two-Stage Information Systems Continuance Model: Incorporating UTAUT Predictors and the Role of Context. Information system Journal, 527-555.
Vuong & Quan (2017). Perceived Risk and the Intention to use Credit Cards. International Research Journal of Finance and Economics, 77-89.
Wagner & Oliveiria (2017). Apps for Mobile Banking and Customer Satisfaction: A Cross-Cultural Study. International Journal of Bank Marketing, 1133-1153.
Wahab & Yousuf (2017). The Role of Trust in the Relationship between Quality Factors and Customer Satisfaction in Mobile Banking: A Conceptual Framework. The Social Scinece, 712-718.
Waleed & Sandhu (2010). Factors Influencing the Adoption and Usage of Online Services in Saudi Arabia. The Electronic Journal of Information Systems in Developing Countries, 1-32.
Wangpipatwong & Chutimaskul (2008). Understanding Citizen’s Continuance Intention to Use e-Government Website: A Composite View of Technology Acceptance Model and Computer Self-Efficacy. Electronic Journal of e-Government, 55-64.

Bibliography
458
Wang & Han Yaojun (2015). Modeling and Empirical Study of Users’ Continuance Intention Toward Location Based Service. International Business and Management, 8-15.
Wang & Yu- Min (2003). Determinenets of User Acceptance of Internet Banking: An Empirical Study. International Journal of Service Industry management, 501-519.
Wang Zhao & Zhang (2015). Conceptual Framework for Risk Propensity, Risk Perception, and Risk Behaviour of Construction Project Managers. Procs 31st Annual ARCOM Conference, UK: Association of Researchers in Construction Management, 165-174.
Watson & Goodhue (2002). WEBQUAL: A Measure of Web site Quality. American Marketing Association, 432-438.
Wei Wang (2008). Explaining the Role of User Commitment in Extented use of Information System; An Empirical Investigation. Washington: Washington State University.
Wen & Prybutok (2011). An Integrated Model for Customer Online Repurchase Intention. Faculty Research & Creative Activity. 1-10.
William & Delone (1992). Information Systems Success: The Quest for the Dependent ariable. Information Systems Research, 60-95.
Williamson & Kirsty (2006). Understanding Consumer Adoption of Internet Banking: An Intrepretive Study in the Austrelian Banking Context. Journal of Electronic Commerce Research, 50-66.
Wu & Lin (2010). A Study of Bank Customer's Perceived Usefulness of Adopting Online Banking. Global Journal of Business Research, 101-108.
Wu & Kuo (2008). An Investigation of Habitual Usage and Past Usage on Technology Acceptance Evaluations, and Continuance Intention. The Database for Advances in Information Systems, 48-73.
Xu (2007). An Extended Expectation Confirmation Model for Information Systems Continuance. Wireless Communication and Networking. China: IEEE.

Bibliography
459
Yadav (2014). A Study on Innovative Banking User’s Awareness Towards Mobile Banking in South Gujarat Region. Indian Journal of Applied Research, 93-97.
Yang & Lee (2014). The Adoption of Mobile Self-Service Technologies: Effects of Availability in Alternative Media and Trust on the Relative Importance of Perceived Usefulness and Ease of Use . International Journal of Smart Home , 165-178 .
Yashasvi & Mistry (2012). Level of Customer Satisfaction While Using Internet Banking: A Study of Anand City. International Journal of Marketing & Business Communication, 58-65.
Yee & Chong (2013). Online Banking Adoption- An Empiricl Analysis. International Journal of Bank Marketing, 267-287.
Yi-Luen & -Shyong Ong (2015). Security Risk and Trust in Individual's Internet Banking Adoption; An Integrated Model. International Journal of Electronic Commerce Studies, 343-356.
Yong-Hui Li (2009). Applying Theory of Perceived Risk and Technology Acceptance Model in the Online Shopping Channel. International Journal of Economics and Management Engineering, 505-511.
Yoon, & Cheolho. (2010). Antecedents of Customer Satisfaction with Online Banking in China: The Effects of Experience. Computers in Human Behavior, Elsevier, 1296-1304.
Yousafzai & Pallister (2003). A Proposed Model of E-Trust for Electronic Banking. Technovation, Elsevier, 847-860.
Yousuf & Ali (2017). Determenents of Continuance Intention to Use Mobile Money Transfer: An Integrated Model. Journal of Internet Banking and Commerce, 1-24.
Yuan & Yao (2014). An Investigation of Users’Continuance Intention towards Mobile Banking in China. Information Development, 1-15.
Yue-Yang & Hsu (2010). Confirmation of Expectations and Satisfaction with the Internet Shopping: The Role of Internet Self-efficacy. Computer and Information Science, 14-22.

Bibliography
460
Zeithaml & Parasuraman & (2002). Service Quality Delivery Through Web Sites: A Critical Review of Extant Knowledge. Journal of the Academy of Marketing Science, 362-375.
Zhengiveli Ma (2013). The Role of Trust and Ease of Use in the Development of Internet Banking. African Journal of Business Management, 4336-4343.
Zhou (2012). Examining Continuance Usage of Mobile Internet Services from the Perspective of Resistance to Change. Information Developmen, 22-31.
Zhou & Tsiga (2017). What Influence users’ E-finance Continuance Intention? The Moderating Role of Trust. Industrial Management & Data Systems, 1647-1670.
…..…..

Appendices
461
Appendix 1
QUESTIONNAIRE
Dear Respondent,
Thank you for taking part in this study. This questionnaire is intended to collect data for my Ph. D research work being carried out on the topic ‘Attitudinal Precedents in the Adoption and Usage Continuance of Technology Enabled Banking Self-Services: A study among Bank Customers in Kerala’. The data provided by you will be kept strictly confidential and used only for academic purpose.
Rajisha T Research scholar
School of Management studies, CUSAT [email protected]
Please put a tick mark (√) in the appropriate boxes I. PERSONAL PROFILE 1. Name (Optional) : 2. Age : …………….. 3. Gender : Male Female 4. Marital status : Married Unmarried Widower/ widowed Separated 5. Place of Residence : Urban Semi-urban Rural 6. Education : Up to Xth Plus two/PDC Graduation Post - graduation Professional Others --- 7. Occupation : Govt. Employee Business. Pvt. Employee Professionals/ self-employed Agriculture Others (Specify) …… 8. Monthly income : Up to Rs.20000 ` 20001-40000 ` 40001-60000 ` 60001- 80000 ` 80001-100000 Above ` 100000

Appendices
462
II. GENERAL BANKING INFORMATION
9. Name of your most frequent bank (with maximum number of transactions)
10. Please tick the type of dealings you have with above bank (Put a tick mark in the respective columns)
Saving Account Current Account
11. How long have you been using the Technology Enabled Banking Self-Services
Less than 1 year 2-4 years 5-7 years 8-10 years Over 10 years
12. Which of the following technology enabled banking services are you using? Put a tick (√) mark in the respective columns
ATM/Debit Card Credit Card Internet Banking Mobile Banking
13. State your level of agreement to the following statements regarding the Awareness on TEBSS (Technology Enabled Banking Self-Services (Internet banking, Mobile banking, Bank Cards)). Put a tick mark (√) in the respective columns (1= Strongly Disagree, 2= Disagree, 3= Neutral, 4= Agree, 5= Strongly Agree)
1 2 3 4 5 13.1 I am aware of how to use the Technology
Enabled Banking Self-services.
13.2 I am aware of the risk and how to handle those risks in using the TEBSS.
13.3 I am aware of the benefits of using technologyenabled banking self-services.
13.4 I am frequently getting updated with TEBSS technology. Thus, I can extend my usage of TEBSS and manage if any transaction failure happens.

Appendices
463
14. Please state your common transactions by using TEBSS (Internet banking, Mobile banking, Bank Cards). Put a tick mark (√) in the respective columns.
I use the TEBSS for- Always Often Sometimes Rare Never 14.1 Information of statement of
accounts / ordering check book’.
14.2 Payment services (Bills, taxes, duties, rent etc.).
14.3 Booking hotels/ air or rail ticket.
14.4 Transferring funds 14.5 Point of Sale (POS/E-
Commerce).
14.6 Investment Activities (Online share trading).
14.7 Viewing the status of cheque and present bill/ ECS.
14.8 Shopping online 14.9 Loan application
15. Please state your level of agreement to following statements regarding the
Usage Intensity of TEBSS. Put a tick mark (√) in the respective columns. (1= Strongly Disagree2= Disagree, 3= Neutral, 4= Agree 5= Strongly Agree).
1 2 3 4 5 15.1 Using TEBSS have become a part of my routine
banking activity.
15.2 I feel sorry if any of TEBSS failed, due to technical problems, while using them.
15.3 I always use the TEBSS in as many occasions as possible.
15.4 While using the TEBSS I feel I am connected to Innovative banking technology.
15.5 I am proud to tell people that, I am using the TEBSS
15.6 I feel it is important to keep up with latest banking technology

Appendices
464
16. Please state your level of agreement regarding the adoptability of TEBSS (Internet banking, Mobile banking, Bank Cards). Put a tick mark (√) in the respective columns. (1=Strongly Disagree, 2=Disagree, 3= Neutral, 4=Agree, 5= Strongly Agree)
1 2 3 4 5 16.1 TEBSS are available at 24 hours of the day. 16.2 TEBSS helps me to avoid irritation of standing on
long queues in branches of banks
16.3 Banking transactions can be performed anywhere 16.4 TEBSS helps to save the time compared to
transactional banking.
16.5 TEBSS helps me to perform multiple banking purposes 16.6 Instant access of the websites of the bank helps me
to do what I want to do
17.1 It is easy for me to learn how to use TEBSS 17.2 It is easy for me to become skilful at using TEBSS 17.3 I don’t make any errors while using TEBSS 17.4 I think interacting with technology enabled banking
self-services do not require a lot of mental efforts
18.1 TEBSS make me easier to do my banking transactions. 18.2 TEBSS enables me to perform my banking needs
more quickly than traditional way of doing banking.
18.3 TEBSS allows me to manage my banking activities efficiently.
18.4 TEBSS are more useful to me in conducting banking transactions.
19. Please state your level of agreement to following statements regarding Post-use Trust in using TEBSS. Put a tick mark (√) in appropriate columns. (1= Strongly Disagree, 2= Disagree, 3= Neutral, 4=Agree, 5= Strongly Agree,)
1 2 3 4 5 19.1 I feel that, TEBSS had enough safe guards (such as
encryption of passwords & pin) to make me feel comfortable in using.
19.2 I feel that, the security system of the TEBSS were suitable against the un authorized access of my account.
19.3 I feel that, TEBSS are reliable and trust worthy 19.4 I feel that Technology enabled banking self-
services had all the functionalities that I needed.
19.5 I feel that, the TEBSS provided error free transactions for me each time I am using it.

Appendices
465
20. Indicate your level of agreeableness to the following statements regarding your Risk Perception. Please put a tick mark (√) in the respective columns (1= Strongly Disagree, 2= Disagree, 3= Neutral, 4= Agree, 5= Strongly Agree)
1 2 3 4 5 20.1 I think using TEBSS for performing financial
activities is risky
20.2 There is possibility of harm resulting from mis-use of my personal information while using TEBSS
20.3 There are chances for losing money due to fraud practices when carrying out financial transactions through TEBSS
20.4 There are chances for losing control over privacy of account information when transactions take place over TEBSS
20.5 There are chances for failure of performance of transactions when using TEBSS
20.6 There is a scope for feeling of frustration/ psychological discomfort when something goes wrong in the use of the TEBSS
21. The following statements indicate your level of Satisfaction in TEBSS; Put a tick mark (√) in the respective columns (1=Very Dissatisfied, 2= Dissatisfied. 3= No Opinion, 4= Satisfied, 5= Very Satisfied)
1 2 3 4 5 21.1 I am satisfied with the different types of services
offered through TEBSS (Internet banking, Mobile banking and Bank cards).
21.2 I am satisfied with digitalization of personal information and account information.
21.3 I am satisfied with the speed of services such as clearing, deposits, transfers and response to enquiries.
21.4 I am satisfied with the procedures and formalities for using TEBSS.
21.5 I am satisfied with the security& privacy measures against Password & PIN theft, hacking etc.
21.6 I am satisfied with the language and information support in using technology enabled banking self - services
21.7 Overall, I am satisfied with technology enabled bankingself – services.

Appendices
466
22. Please state your level of agreement to following statements regarding the Continuance Intention to use the technology enabled banking self-services in future. Put a tick mark (√) in appropriate columns. (1=Strongly Disagree, 2= Disagree, 3= Neutral, 4=Agree, 5= Strongly Agree)
1 2 3 4 5 22.1 I intend to continue in using Mobile Banking,
Internet Banking and Card banking for doing my banking transactions in future.
22.2 I intend to continue in using Mobile Banking, Internet Banking and Card banking to the extent of services offered through it.
22.3 I will strongly recommend the innovative banking products and services to others
Thank you very much for your patience and time.

Appendices
467
Appendix 2
RESULTS OF FACTOR ANALYSIS
2.1. Awareness of Customers Total Variance Explained
Component
Initial Eigenvalues Extraction Sums of Squared Loadings
Total % of
Variance Cumulative
% Total % of
Variance Cumulative
% 1 2.639 65.965 65.965 2.639 65.965 65.965 2 .669 16.725 82.690 3 .363 9.072 91.762 4 .330 8.238 100.000
Extraction Method: Principal Component Analysis.
Component Matrix Component
1 AW1 .857 AW2 .851 AW3 .855 AW4 .669
Extraction Method: Principal Component Analysis a. 1 components extracted
2.2. Accessibility of TEBSS Total Variance Explained
Component Initial Eigenvalues Extraction Sums of Squared
Loadings
Total % of Variance
Cumulative % Total % of
Variance Cumulative
% 1 4.150 69.172 69.172 4.150 69.172 69.172 2 .529 8.817 77.989 3 .449 7.485 85.475 4 .354 5.908 91.383 5 .308 5.131 96.514 6 .209 3.486 100.000
Extraction Method: Principal Component Analysis.
Component Matrix Component
1 ASS1 .768 ASS2 .863 ASS3 .839 ASS4 .885 ASS5 .861 ASS6 .767
Extraction Method: Principal Component Analysis a. 1 components extracted
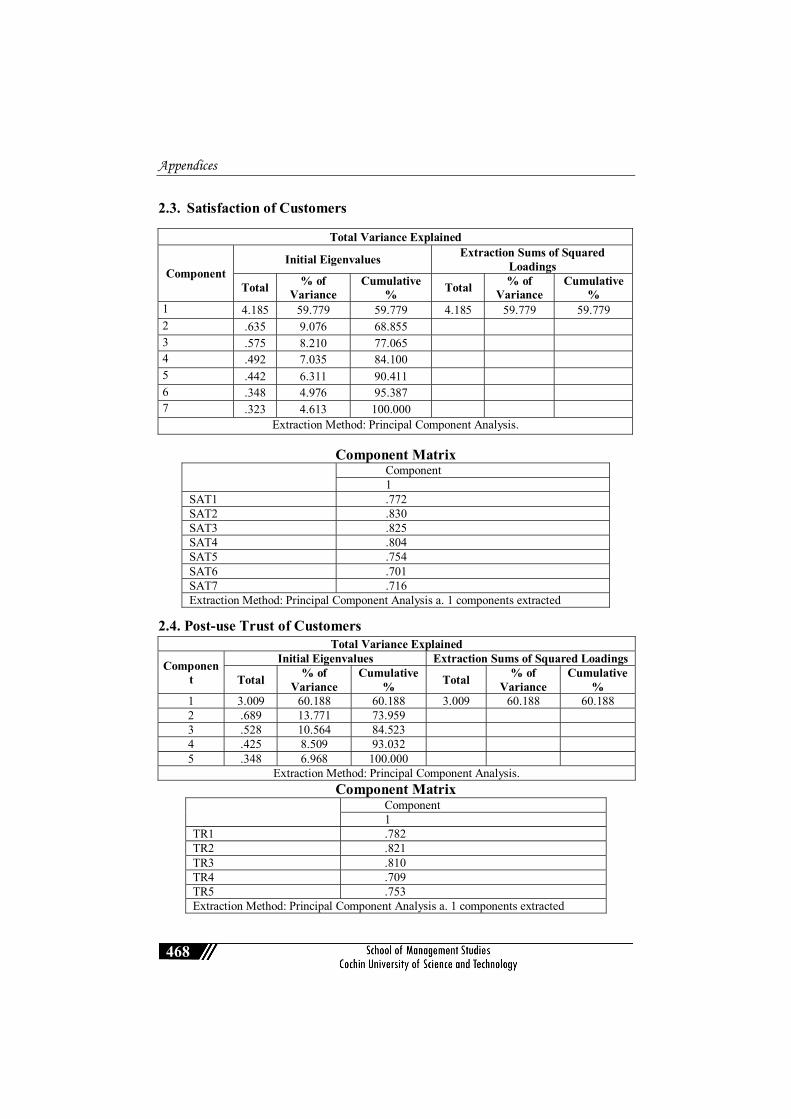
Appendices
468
2.3. Satisfaction of Customers
Total Variance Explained
Component Initial Eigenvalues Extraction Sums of Squared
Loadings
Total % of Variance
Cumulative % Total % of
Variance Cumulative
% 1 4.185 59.779 59.779 4.185 59.779 59.779 2 .635 9.076 68.855 3 .575 8.210 77.065 4 .492 7.035 84.100 5 .442 6.311 90.411 6 .348 4.976 95.387 7 .323 4.613 100.000
Extraction Method: Principal Component Analysis.
Component Matrix Component
1 SAT1 .772 SAT2 .830 SAT3 .825 SAT4 .804 SAT5 .754 SAT6 .701 SAT7 .716 Extraction Method: Principal Component Analysis a. 1 components extracted
2.4. Post-use Trust of Customers Total Variance Explained
Component
Initial Eigenvalues Extraction Sums of Squared Loadings
Total % of Variance
Cumulative % Total % of
Variance Cumulative
% 1 3.009 60.188 60.188 3.009 60.188 60.188 2 .689 13.771 73.959 3 .528 10.564 84.523 4 .425 8.509 93.032 5 .348 6.968 100.000
Extraction Method: Principal Component Analysis. Component Matrix
Component 1
TR1 .782 TR2 .821 TR3 .810 TR4 .709 TR5 .753 Extraction Method: Principal Component Analysis a. 1 components extracted

Appendices
469
2.5 Risk Perception of Customers Total Variance Explained
Component Initial Eigenvalues Extraction Sums of Squared Loadings
Total % of Variance
Cumulative % Total % of
Variance Cumulative
% 1 3.516 58.606 58.606 3.516 58.606 58.606 2 .869 14.490 73.096 3 .565 9.423 82.519 4 .408 6.796 89.315 5 .369 6.153 95.468 6 .272 4.532 100.000 Extraction Method: Principal Component Analysis.
Component Matrix Component
1 RP1 .669 RP2 .741 RP3 .827 RP4 .837 RP5 .791 RP6 .715 Extraction Method: Principal Component Analysis a. 1 components extracted

Appendices
470
Appendix 3 POST-HOC ANALYSIS RESULT OF ANOVA
3.1. Occupation and Fund Transfer Service
Multiple ComparisonsDependent Variable: PURP4 Tukey HSD
(I) Occupation (J) Occupation Mean
Difference (I-J)
Std. Error Sig.
95% Confidence Interval
Lower Bound
Upper Bound
Govt.employee Private employee .031 .147 1.000 -.40 .47 Agreculture .389 .164 .211 -.10 .87 Business .220 .191 .911 -.34 .78 Professionals/ Self employed .431 .180 .200 -.10 .96 Students .446* .149 .044 .01 .89 Others .442 .193 .252 -.13 1.01
Private employee Govt.employee -.031 .147 1.000 -.47 .40 Agreculture .358 .145 .171 -.07 .79 Business .190 .175 .933 -.33 .71 Professionals/ Self employed .400 .162 .175 -.08 .88 Students .415* .127 .020 .04 .79 Others .411 .178 .238 -.11 .94
Agreculture Govt.employee -.389 .164 .211 -.87 .10 Private employee -.358 .145 .171 -.79 .07 Business -.169 .189 .974 -.73 .39 Professionals/ Self employed .041 .178 1.000 -.48 .57 Students .057 .146 1.000 -.38 .49 Others .053 .192 1.000 -.51 .62
Business Govt.employee -.220 .191 .911 -.78 .34 Private employee -.190 .175 .933 -.71 .33 Agreculture .169 .189 .974 -.39 .73 Professionals/ Self employed .210 .203 .946 -.39 .81 Students .226 .176 .860 -.29 .75 Others .222 .215 .947 -.41 .86
Professionals/ Self employed
Govt.employee -.431 .180 .200 -.96 .10 Private employee -.400 .162 .175 -.88 .08 Agreculture -.041 .178 1.000 -.57 .48 Business -.210 .203 .946 -.81 .39 Students .016 .164 1.000 -.47 .50 Others .012 .205 1.000 -.59 .62
Students Govt.employee -.446* .149 .044 -.89 -.01 Private employee -.415* .127 .020 -.79 -.04 Agreculture -.057 .146 1.000 -.49 .38 Business -.226 .176 .860 -.75 .29 Professionals/ Self employed -.016 .164 1.000 -.50 .47 Others -.004 .179 1.000 -.53 .52
Others Govt.employee -.442 .193 .252 -1.01 .13 Private employee -.411 .178 .238 -.94 .11 Agreculture -.053 .192 1.000 -.62 .51 Business -.222 .215 .947 -.86 .41 Professionals/ Self employed -.012 .205 1.000 -.62 .59 Students .004 .179 1.000 -.52 .53
*. The mean difference is significant at the 0.05 level.

Appendices
471
3.2. Monthly Income and Fund Transfer Service
Multiple Comparisons Dependent Variable: PURP4 Tukey HSD
(I) Monthly income
(J) Monthly income
Mean Difference
(I-J) Std.
Error Sig.
95% Confidence Interval Lower Bound
Upper Bound
upto20000
20001-30000 -.301 .114 .089 -.63 .02 30001-40000 -.388* .126 .025 -.75 -.03 40001-50000 -.631* .160 .001 -1.09 -.18 50001-60000 -.381 .215 .484 -.99 .23 Above 60000 -.660* .162 .001 -1.12 -.20
20001-30000
upto20000 .301 .114 .089 -.02 .63 30001-40000 -.087 .139 .989 -.48 .31 40001-50000 -.330 .170 .380 -.82 .16 50001-60000 -.080 .223 .999 -.72 .56 Above 60000 -.359 .173 .299 -.85 .13
30001-40000
upto20000 .388* .126 .025 .03 .75 20001-30000 .087 .139 .989 -.31 .48 40001-50000 -.243 .178 .748 -.75 .27 50001-60000 .007 .229 1.000 -.65 .66 Above 60000 -.273 .181 .658 -.79 .24
40001-50000
upto20000 .631* .160 .001 .18 1.09 20001-30000 .330 .170 .380 -.16 .82 30001-40000 .243 .178 .748 -.27 .75 50001-60000 .250 .249 .917 -.46 .96 Above 60000 -.029 .206 1.000 -.62 .56
50001-60000
upto20000 .381 .215 .484 -.23 .99 20001-30000 .080 .223 .999 -.56 .72 30001-40000 -.007 .229 1.000 -.66 .65 40001-50000 -.250 .249 .917 -.96 .46 Above 60000 -.279 .251 .876 -1.00 .44
Above 60000
upto20000 .660* .162 .001 .20 1.12 20001-30000 .359 .173 .299 -.13 .85 30001-40000 .273 .181 .658 -.24 .79 40001-50000 .029 .206 1.000 -.56 .62 50001-60000 .279 .251 .876 -.44 1.00
*. The mean difference is significant at the 0.05 level.

Appendices
472
3.3. Monthly Income and Booking Service
Multiple Comparisons Dependent Variable: PURP3 Tukey HSD
(I) Monthly income
(J) Monthly income
Mean Difference
(I-J) Std.
Error Sig.
95% Confidence Interval
Lower Bound
Upper Bound
upto20000
20001-30000 -.465* .119 .001 -.80 -.13 30001-40000 -.380* .131 .043 -.75 -.01 40001-50000 -.515* .166 .024 -.99 -.04 50001-60000 -.315 .223 .722 -.95 .32 Above 60000 -.390 .168 .188 -.87 .09
20001-30000
upto20000 .465* .119 .001 .13 .80 30001-40000 .085 .145 .992 -.33 .50 40001-50000 -.050 .177 1.000 -.56 .46 50001-60000 .150 .232 .987 -.51 .81 Above 60000 .074 .180 .998 -.44 .59
30001-40000
upto20000 .380* .131 .043 .01 .75 20001-30000 -.085 .145 .992 -.50 .33 40001-50000 -.135 .185 .978 -.66 .39 50001-60000 .065 .238 1.000 -.62 .75 Above 60000 -.011 .188 1.000 -.55 .53
40001-50000
upto20000 .515* .166 .024 .04 .99 20001-30000 .050 .177 1.000 -.46 .56 30001-40000 .135 .185 .978 -.39 .66 50001-60000 .200 .259 .972 -.54 .94 Above 60000 .124 .214 .992 -.49 .73
50001-60000
upto20000 .315 .223 .722 -.32 .95 20001-30000 -.150 .232 .987 -.81 .51 30001-40000 -.065 .238 1.000 -.75 .62 40001-50000 -.200 .259 .972 -.94 .54 Above 60000 -.076 .261 1.000 -.82 .67
Above 60000
upto20000 .390 .168 .188 -.09 .87 20001-30000 -.074 .180 .998 -.59 .44 30001-40000 .011 .188 1.000 -.53 .55 40001-50000 -.124 .214 .992 -.73 .49 50001-60000 .076 .261 1.000 -.67 .82
*. The mean difference is significant at the 0.05 level.

Appendices
473
3.4. Occupation and Point of Sale Service
Multiple Comparisons Dependent Variable: PURP5 Tukey HSD
(I) Occupation (J) Occupation Mean
Difference(I-J)
Std. Error Sig.
95% Confidence Interval
Lower Bound
Upper Bound
Govt.employee
Private employee -.150 .149 .953 -.59 .29 Agriculture .155 .166 .966 -.33 .65 Business .012 .193 1.000 -.56 .58 Professionals/ Self employed .213 .181 .903 -.32 .75 Students .187 .150 .876 -.26 .63 Others .373 .196 .476 -.21 .95
Private employee
Govt.employee .150 .149 .953 -.29 .59 Agriculture .305 .147 .366 -.13 .74 Business .162 .177 .970 -.36 .68 Professionals/ Self employed .363 .164 .290 -.12 .85 Students .337 .129 .123 -.04 .72 Others .523 .180 .057 -.01 1.05
Agreculture
Govt.employee -.155 .166 .966 -.65 .33 Private employee -.305 .147 .366 -.74 .13 Business -.143 .191 .990 -.71 .42 Professionals/ Self employed .058 .180 1.000 -.47 .59 Students .032 .148 1.000 -.41 .47 Others .218 .194 .921 -.36 .79
Business
Govt.employee -.012 .193 1.000 -.58 .56 Private employee -.162 .177 .970 -.68 .36 Agriculture .143 .191 .990 -.42 .71 Professionals/ Self employed .201 .205 .958 -.40 .81 Students .175 .178 .958 -.35 .70 Others .360 .218 .646 -.28 1.00
Professionals/ Self employed
Govt.employee -.213 .181 .903 -.75 .32 Private employee -.363 .164 .290 -.85 .12 Agriculture -.058 .180 1.000 -.59 .47 Business -.201 .205 .958 -.81 .40 Students -.026 .165 1.000 -.52 .46 Others .159 .207 .988 -.45 .77
Students
Govt.employee -.187 .150 .876 -.63 .26 Private employee -.337 .129 .123 -.72 .04 Agriculture -.032 .148 1.000 -.47 .41 Business -.175 .178 .958 -.70 .35 Professionals/ Self employed .026 .165 1.000 -.46 .52 Others .186 .181 .948 -.35 .72
Others
Govt.employee -.373 .196 .476 -.95 .21 Private employee -.523 .180 .057 -1.05 .01 Agriculture -.218 .194 .921 -.79 .36 Business -.360 .218 .646 -1.00 .28 Professionals/ Self employed -.159 .207 .988 -.77 .45 Students -.186 .181 .948 -.72 .35

Appendices
474
3.5. Monthly Income and Point of Sale Service
Multiple ComparisonsDependent Variable: PURP5 Tukey HSD
(I) Monthly income
(J) Monthly income
Mean Difference
(I-J) Std.
Error Sig. 95% Confidence
Interval Lower Bound
Upper Bound
upto20000
20001-30000 -.409* .116 .006 -.74 -.08 30001-40000 -.318 .127 .126 -.68 .05 40001-50000 -.477* .162 .038 -.94 -.02 50001-60000 -.289 .218 .769 -.91 .33 Above 60000 -.372 .164 .209 -.84 .10
20001-30000
upto20000 .409* .116 .006 .08 .74 30001-40000 .092 .141 .987 -.31 .49 40001-50000 -.067 .173 .999 -.56 .43 50001-60000 .120 .226 .995 -.53 .77 Above 60000 .037 .175 1.000 -.46 .54
30001-40000
upto20000 .318 .127 .126 -.05 .68 20001-30000 -.092 .141 .987 -.49 .31 40001-50000 -.159 .181 .951 -.68 .36 50001-60000 .028 .232 1.000 -.64 .69 Above 60000 -.054 .183 1.000 -.58 .47
40001-50000
upto20000 .477* .162 .038 .02 .94 20001-30000 .067 .173 .999 -.43 .56 30001-40000 .159 .181 .951 -.36 .68 50001-60000 .188 .253 .977 -.53 .91 Above 60000 .105 .208 .996 -.49 .70
50001-60000
upto20000 .289 .218 .769 -.33 .91 20001-30000 -.120 .226 .995 -.77 .53 30001-40000 -.028 .232 1.000 -.69 .64 40001-50000 -.188 .253 .977 -.91 .53 Above 60000 -.083 .254 1.000 -.81 .64
Above 60000
upto20000 .372 .164 .209 -.10 .84 20001-30000 -.037 .175 1.000 -.54 .46 30001-40000 .054 .183 1.000 -.47 .58 40001-50000 -.105 .208 .996 -.70 .49 50001-60000 .083 .254 1.000 -.64 .81
*. The mean difference is significant at the 0.05 level.

Appendices
475
3.6. Age and Usage Intensity of TEBSS
Multiple Comparisons Dependent Variable: INTEN_N Tukey HSD
(I) Age (J) Age
Mean Difference
(I-J) Std.
Error Sig.
95% Confidence Interval Lower Bound
Upper Bound
Below 25
26-30 -.11914 .07057 .442 -.3120 .0738 31-40 -.23893* .07461 .012 -.4429 -.0350 41-50 -.25530 .13829 .348 -.6333 .1227
Above 50 -.39526 .23351 .439 -1.0335 .2430
26-30
Below 25 .11914 .07057 .442 -.0738 .3120 31-40 -.11980 .06136 .291 -.2875 .0479 41-50 -.13617 .13162 .839 -.4959 .2236
Above 50 -.27612 .22962 .750 -.9037 .3515
31-40
Below 25 .23893* .07461 .012 .0350 .4429 26-30 .11980 .06136 .291 -.0479 .2875 41-50 -.01637 .13383 1.000 -.3822 .3494
Above 50 -.15632 .23089 .961 -.7874 .4748
41-50
Below 25 .25530 .13829 .348 -.1227 .6333 26-30 .13617 .13162 .839 -.2236 .4959 31-40 .01637 .13383 1.000 -.3494 .3822
Above 50 -.13996 .25859 .983 -.8468 .5669
Above 50
Below 25 .39526 .23351 .439 -.2430 1.0335 26-30 .27612 .22962 .750 -.3515 .9037 31-40 .15632 .23089 .961 -.4748 .7874 41-50 .13996 .25859 .983 -.5669 .8468
*. The mean difference is significant at the 0.05 level.

Appendices
476
3.7. Occupation and Usage Intensity of TEBSS
Multiple Comparisons Dependent Variable: INTEN_N Tukey HSD
(I) Occupation (J) Occupation Mean
Difference (I-J)
Std. Error Sig.
95% Confidence Interval
Lower Bound
Upper Bound
Govt.employee
Private employee .12833 .08882 .777 -.1341 .3908 Agreculture .04177 .09889 1.000 -.2505 .3340 Business .25978 .11516 .267 -.0805 .6001 Professionals/ Self employed .09874 .10826 .971 -.2212 .4187 Students .29903* .08962 .015 .0342 .5639 Others .29649 .11667 .146 -.0483 .6413
Private employee
Govt.employee -.12833 .08882 .777 -.3908 .1341 Agreculture -.08655 .08749 .956 -.3451 .1720 Business .13146 .10553 .876 -.1804 .4433 Professionals/ Self employed -.02959 .09795 1.000 -.3190 .2599 Students .17071 .07685 .285 -.0564 .3978 Others .16816 .10717 .702 -.1485 .4849
Agreculture
Govt.employee -.04177 .09889 1.000 -.3340 .2505 Private employee .08655 .08749 .956 -.1720 .3451 Business .21801 .11414 .474 -.1193 .5553 Professionals/ Self employed .05696 .10717 .998 -.2597 .3737 Students .25726 .08830 .056 -.0037 .5182 Others .25471 .11566 .295 -.0871 .5965
Business
Govt.employee -.25978 .11516 .267 -.6001 .0805 Private employee -.13146 .10553 .876 -.4433 .1804 Agreculture -.21801 .11414 .474 -.5553 .1193 Professionals/ Self employed -.16105 .12235 .844 -.5226 .2005 Students .03925 .10621 1.000 -.2746 .3531 Others .03670 .12984 1.000 -.3470 .4204
Professionals/ Self employed
Govt.employee -.09874 .10826 .971 -.4187 .2212 Private employee .02959 .09795 1.000 -.2599 .3190 Agreculture -.05696 .10717 .998 -.3737 .2597 Business .16105 .12235 .844 -.2005 .5226 Students .20030 .09868 .396 -.0913 .4919 Others .19775 .12376 .684 -.1680 .5635
Students
Govt.employee -.29903* .08962 .015 -.5639 -.0342 Private employee -.17071 .07685 .285 -.3978 .0564 Agreculture -.25726 .08830 .056 -.5182 .0037 Business -.03925 .10621 1.000 -.3531 .2746 Professionals/ Self employed -.20030 .09868 .396 -.4919 .0913 Others -.00254 .10784 1.000 -.3212 .3161
Others
Govt.employee -.29649 .11667 .146 -.6413 .0483 Private employee -.16816 .10717 .702 -.4849 .1485 Agreculture -.25471 .11566 .295 -.5965 .0871 Business -.03670 .12984 1.000 -.4204 .3470 Professionals/ Self employed -.19775 .12376 .684 -.5635 .1680 Students .00254 .10784 1.000 -.3161 .3212
*. The mean difference is significant at the 0.05 level.

Appendices
477
3.8. Monthly Income and Intensity of Usage of TEBSS
Multiple Comparisons Dependent Variable: INTEN_N Tukey HSD
(I) Monthly income
(J) Monthly income
Mean Difference
(I-J) Std.
Error Sig.
95% Confidence Interval
Lower Bound
Upper Bound
upto20000
20001-30000 -.19447 .06862 .053 -.3904 .0015 30001-40000 -.34697* .07557 .000 -.5628 -.1311 40001-50000 -.32447* .09601 .010 -.5987 -.0503 50001-60000 -.30364 .12935 .176 -.6731 .0658 Above 60000 .01217 .09752 1.000 -.2663 .2907
20001-30000
upto20000 .19447 .06862 .053 -.0015 .3904 30001-40000 -.15250 .08375 .453 -.3917 .0867 40001-50000 -.13000 .10257 .803 -.4229 .1629 50001-60000 -.10917 .13430 .965 -.4927 .2744 Above 60000 .20663 .10399 .350 -.0903 .5036
30001-40000
upto20000 .34697* .07557 .000 .1311 .5628 20001-30000 .15250 .08375 .453 -.0867 .3917 40001-50000 .02250 .10734 1.000 -.2841 .3291 50001-60000 .04333 .13798 1.000 -.3507 .4374 Above 60000 .35913* .10870 .013 .0487 .6696
40001-50000
upto20000 .32447* .09601 .010 .0503 .5987 20001-30000 .13000 .10257 .803 -.1629 .4229 30001-40000 -.02250 .10734 1.000 -.3291 .2841 50001-60000 .02083 .15015 1.000 -.4080 .4496 Above 60000 .33663 .12378 .072 -.0169 .6901
50001-60000
upto20000 .30364 .12935 .176 -.0658 .6731 20001-30000 .10917 .13430 .965 -.2744 .4927 30001-40000 -.04333 .13798 1.000 -.4374 .3507 40001-50000 -.02083 .15015 1.000 -.4496 .4080 Above 60000 .31580 .15112 .294 -.1158 .7474
Above 60000
upto20000 -.01217 .09752 1.000 -.2907 .2663 20001-30000 -.20663 .10399 .350 -.5036 .0903 30001-40000 -.35913* .10870 .013 -.6696 -.0487 40001-50000 -.33663 .12378 .072 -.6901 .0169 50001-60000 -.31580 .15112 .294 -.7474 .1158
*. The mean difference is significant at the 0.05 level.

Appendices
478
3.9. Education and Awareness of Customers
Multiple Comparisons Dependent Variable: AWR_N Tukey HSD
(I) Education (J) Education Mean
Difference (I-J)
Std. Error Sig.
95% Confidence Interval
Lower Bound
Upper Bound
Upto tenth
Plus two / PDC .12791 .23428 .994 -.5412 .7970 Graduation -.02128 .21031 1.000 -.6219 .5794 Post-graduation -.22141 .20800 .895 -.8154 .3726 Professional -.02376 .21816 1.000 -.6468 .5993 Others -.26387 .24848 .896 -.9735 .4458
Plus two / PDC
Upto tenth -.12791 .23428 .994 -.7970 .5412 Graduation -.14919 .12651 .847 -.5105 .2121 Post graduation -.34932 .12262 .051 -.6995 .0009 Professional -.15167 .13917 .886 -.5491 .2458 Others -.39178 .18307 .268 -.9146 .1310
Graduation
Upto tenth .02128 .21031 1.000 -.5794 .6219 Plus two / PDC .14919 .12651 .847 -.2121 .5105 Post graduation -.20013* .06620 .031 -.3892 -.0111 Professional -.00248 .09335 1.000 -.2691 .2641 Others -.24259 .15120 .596 -.6744 .1892
Post graduation
Upto tenth .22141 .20800 .895 -.3726 .8154 Plus two / PDC .34932 .12262 .051 -.0009 .6995 Graduation .20013* .06620 .031 .0111 .3892 Professional .19765 .08800 .218 -.0537 .4490 Others -.04246 .14796 1.000 -.4650 .3801
Professional
Upto tenth .02376 .21816 1.000 -.5993 .6468 Plus two / PDC .15167 .13917 .886 -.2458 .5491 Graduation .00248 .09335 1.000 -.2641 .2691 Post graduation -.19765 .08800 .218 -.4490 .0537 Others -.24011 .16193 .675 -.7026 .2224
Others
Upto tenth .26387 .24848 .896 -.4458 .9735 Plus two / PDC .39178 .18307 .268 -.1310 .9146 Graduation .24259 .15120 .596 -.1892 .6744 Post graduation .04246 .14796 1.000 -.3801 .4650 Professional .24011 .16193 .675 -.2224 .7026
*. The mean difference is significant at the 0.05 level.

Appendices
479
3.10. Occupation and Accessibility of TEBSS
Multiple Comparisons Dependent Variable: ACCESS_N Tukey HSD
(I) Occupation (J) Occupation Mean
Difference (I-J)
Std. Error Sig.
95% Confidence Interval Lower Bound Upper Bound
Govt.employee
Private employee .30249* .09288 .020 .0280 .5769 Agreculture .09495 .10341 .970 -.2106 .4005 Business .02850 .12042 1.000 -.3274 .3844 Professionals/ Self employed .18148 .11321 .680 -.1530 .5160 Students .20757 .09371 .288 -.0694 .4845 Others .25281 .12200 .370 -.1077 .6133
Private employee
Govt.employee -.30249* .09288 .020 -.5769 -.0280 Agreculture -.20755 .09148 .260 -.4779 .0628 Business -.27399 .11035 .167 -.6001 .0521 Professionals/ Self employed -.12101 .10243 .901 -.4237 .1817 Students -.09492 .08036 .901 -.3324 .1425 Others -.04968 .11207 .999 -.3808 .2815
Agreculture
Govt.employee -.09495 .10341 .970 -.4005 .2106 Private employee .20755 .09148 .260 -.0628 .4779 Business -.06644 .11935 .998 -.4191 .2863 Professionals/ Self employed .08654 .11207 .988 -.2446 .4177 Students .11262 .09233 .887 -.1602 .3855 Others .15786 .12094 .850 -.1995 .5153
Business
Govt.employee -.02850 .12042 1.000 -.3844 .3274 Private employee .27399 .11035 .167 -.0521 .6001 Agreculture .06644 .11935 .998 -.2863 .4191 Professionals/ Self employed .15298 .12793 .896 -.2251 .5310 Students .17907 .11106 .674 -.1491 .5072 Others .22431 .13578 .648 -.1769 .6255
Professionals/ Self employed
Govt.employee -.18148 .11321 .680 -.5160 .1530 Private employee .12101 .10243 .901 -.1817 .4237 Agreculture -.08654 .11207 .988 -.4177 .2446 Business -.15298 .12793 .896 -.5310 .2251 Students .02609 .10319 1.000 -.2788 .3310 Others .07133 .12942 .998 -.3111 .4538
Students
Govt.employee -.20757 .09371 .288 -.4845 .0694 Private employee .09492 .08036 .901 -.1425 .3324 Agreculture -.11262 .09233 .887 -.3855 .1602 Business -.17907 .11106 .674 -.5072 .1491 Professionals/ Self employed -.02609 .10319 1.000 -.3310 .2788 Others .04524 .11276 1.000 -.2880 .3785
Others
Govt.employee -.25281 .12200 .370 -.6133 .1077 Private employee .04968 .11207 .999 -.2815 .3808 Agreculture -.15786 .12094 .850 -.5153 .1995 Business -.22431 .13578 .648 -.6255 .1769 Professionals/ Self employed -.07133 .12942 .998 -.4538 .3111 Students -.04524 .11276 1.000 -.3785 .2880
*. The mean difference is significant at the 0.05 level.

Appendices
480
3.11. Age and Ease of Use of TEBSS
Multiple Comparisons Dependent Variable: EAS_N Tukey HSD
(I) Age (J) Age Mean
Difference (I-J)
Std. Error Sig.
95% Confidence Interval
Lower Bound
Upper Bound
Below 25
26-30 -.06768 .07340 .888 -.2683 .1330 31-40 -.19772 .07760 .081 -.4098 .0144 41-50 -.19022 .14384 .677 -.5834 .2030 Above 50 -.74471* .24288 .019 -1.4086 -.0808
26-30
Below 25 .06768 .07340 .888 -.1330 .2683 31-40 -.13004 .06383 .249 -.3045 .0444 41-50 -.12254 .13690 .899 -.4967 .2517 Above 50 -.67703* .23884 .038 -1.3299 -.0242
31-40
Below 25 .19772 .07760 .081 -.0144 .4098 26-30 .13004 .06383 .249 -.0444 .3045 41-50 .00750 .13920 1.000 -.3730 .3880 Above 50 -.54699 .24016 .153 -1.2034 .1095
41-50
Below 25 .19022 .14384 .677 -.2030 .5834 26-30 .12254 .13690 .899 -.2517 .4967 31-40 -.00750 .13920 1.000 -.3880 .3730 Above 50 -.55449 .26897 .238 -1.2897 .1807
Above 50
Below 25 .74471* .24288 .019 .0808 1.4086 26-30 .67703* .23884 .038 .0242 1.3299 31-40 .54699 .24016 .153 -.1095 1.2034 41-50 .55449 .26897 .238 -.1807 1.2897
*. The mean difference is significant at the 0.05 level.

Appendices
481
3.12. Age and Usefulness of TEBSS
Multiple Comparisons
Dependent Variable: USEF_N Tukey HSD
(I) Age (J) Age Mean
Difference (I-J)
Std. Error Sig.
95% Confidence Interval
Lower Bound
Upper Bound
Below 25
26-30 -.15987 .07132 .165 -.3548 .0351
31-40 -.24545* .07540 .010 -.4516 -.0393
41-50 -.07926 .13976 .980 -.4613 .3028
Above 50 -.55041 .23600 .136 -1.1955 .0946
26-30
Below 25 .15987 .07132 .165 -.0351 .3548
31-40 -.08558 .06202 .641 -.2551 .0839
41-50 .08061 .13302 .974 -.2830 .4442
Above 50 -.39054 .23207 .445 -1.0249 .2438
31-40
Below 25 .24545* .07540 .010 .0393 .4516
26-30 .08558 .06202 .641 -.0839 .2551
41-50 .16619 .13526 .735 -.2035 .5359
Above 50 -.30496 .23335 .687 -.9428 .3329
41-50
Below 25 .07926 .13976 .980 -.3028 .4613
26-30 -.08061 .13302 .974 -.4442 .2830
31-40 -.16619 .13526 .735 -.5359 .2035
Above 50 -.47115 .26135 .373 -1.1855 .2432
Above 50
Below 25 .55041 .23600 .136 -.0946 1.1955
26-30 .39054 .23207 .445 -.2438 1.0249
31-40 .30496 .23335 .687 -.3329 .9428
41-50 .47115 .26135 .373 -.2432 1.1855
*. The mean difference is significant at the 0.05 level.

Appendices
482
3.13. Occupation and Usefulness of TEBSS
Multiple Comparisons Dependent Variable: USEF_N Tukey HSD
(I) Occupation (J) Occupation Mean Difference (I-J)
Std. Error Sig.
95% Confidence Interval Lower Bound
Upper Bound
Govt.employee
Private employee .23767 .08979 .113 -.0277 .5030 Agreculture .05632 .09997 .998 -.2391 .3517 Business .04497 .11642 1.000 -.2991 .3890 Professionals/ Self employed .19830 .10944 .540 -.1251 .5217 Students .31949* .09060 .008 .0518 .5872 Others .24786 .11794 .352 -.1007 .5964
Private employee
Govt.employee -.23767 .08979 .113 -.5030 .0277 Agreculture -.18135 .08844 .384 -.4427 .0800 Business -.19270 .10668 .544 -.5079 .1226 Professionals/ Self employed -.03937 .09902 1.000 -.3320 .2532 Students .08182 .07769 .941 -.1477 .3114 Others .01020 .10834 1.000 -.3100 .3303
Agreculture
Govt.employee -.05632 .09997 .998 -.3517 .2391 Private employee .18135 .08844 .384 -.0800 .4427 Business -.01135 .11538 1.000 -.3523 .3296 Professionals/ Self employed .14198 .10834 .847 -.1782 .4621 Students .26317 .08926 .051 -.0006 .5269 Others .19154 .11692 .657 -.1540 .5370
Business
Govt.employee -.04497 .11642 1.000 -.3890 .2991 Private employee .19270 .10668 .544 -.1226 .5079 Agreculture .01135 .11538 1.000 -.3296 .3523 Professionals/ Self employed .15333 .12368 .878 -.2122 .5188 Students .27452 .10736 .141 -.0427 .5918 Others .20289 .13126 .717 -.1850 .5908
Professionals/ Self employed
Govt.employee -.19830 .10944 .540 -.5217 .1251 Private employee .03937 .09902 1.000 -.2532 .3320 Agreculture -.14198 .10834 .847 -.4621 .1782 Business -.15333 .12368 .878 -.5188 .2122 Students .12119 .09975 .888 -.1736 .4160 Others .04957 .12511 1.000 -.3201 .4193
Students
Govt.employee -.31949* .09060 .008 -.5872 -.0518 Private employee -.08182 .07769 .941 -.3114 .1477 Agreculture -.26317 .08926 .051 -.5269 .0006 Business -.27452 .10736 .141 -.5918 .0427 Professionals/ Self employed -.12119 .09975 .888 -.4160 .1736 Others -.07163 .10901 .995 -.3938 .2505
Others
Govt.employee -.24786 .11794 .352 -.5964 .1007 Private employee -.01020 .10834 1.000 -.3303 .3100 Agreculture -.19154 .11692 .657 -.5370 .1540 Business -.20289 .13126 .717 -.5908 .1850 Professionals/ Self employed -.04957 .12511 1.000 -.4193 .3201 Students .07163 .10901 .995 -.2505 .3938
*. The mean difference is significant at the 0.05 level.

Appendices
483
3.14. Income and Usefulness of TEBSS
Multiple Comparisons Dependent Variable: USEF_N Tukey HSD
(I) Monthly income
(J) Monthly income
Mean Difference
(I-J) Std.
Error Sig.
95% Confidence Interval
Lower Bound
Upper Bound
upto20000
20001-30000 -.23902* .06996 .009 -.4388 -.0392 30001-40000 -.21485 .07704 .060 -.4349 .0052 40001-50000 -.23152 .09788 .170 -.5110 .0480 50001-60000 -.26277 .13187 .347 -.6394 .1138 Above 60000 -.18898 .09942 .402 -.4729 .0949
20001-30000
upto20000 .23902* .06996 .009 .0392 .4388 30001-40000 .02417 .08538 1.000 -.2197 .2680 40001-50000 .00750 .10456 1.000 -.2911 .3061 50001-60000 -.02375 .13691 1.000 -.4147 .3672 Above 60000 .05003 .10601 .997 -.2527 .3528
30001-40000
upto20000 .21485 .07704 .060 -.0052 .4349 20001-30000 -.02417 .08538 1.000 -.2680 .2197 40001-50000 -.01667 .10943 1.000 -.3292 .2959 50001-60000 -.04792 .14066 .999 -.4496 .3538 Above 60000 .02587 .11081 1.000 -.2906 .3423
40001-50000
upto20000 .23152 .09788 .170 -.0480 .5110 20001-30000 -.00750 .10456 1.000 -.3061 .2911 30001-40000 .01667 .10943 1.000 -.2959 .3292 50001-60000 -.03125 .15307 1.000 -.4684 .4059 Above 60000 .04253 .12619 .999 -.3179 .4029
50001-60000
upto20000 .26277 .13187 .347 -.1138 .6394 20001-30000 .02375 .13691 1.000 -.3672 .4147 30001-40000 .04792 .14066 .999 -.3538 .4496 40001-50000 .03125 .15307 1.000 -.4059 .4684 Above 60000 .07378 .15406 .997 -.3662 .5138
Above 60000
upto20000 .18898 .09942 .402 -.0949 .4729 20001-30000 -.05003 .10601 .997 -.3528 .2527 30001-40000 -.02587 .11081 1.000 -.3423 .2906 40001-50000 -.04253 .12619 .999 -.4029 .3179 50001-60000 -.07378 .15406 .997 -.5138 .3662
*. The mean difference is significant at the 0.05 level.

Appendices
484
3.15. Age and Satisfaction of Customers
Multiple Comparisons Dependent Variable: SAT_N Tukey HSD
(I) Age (J) Age Mean
Difference (I-J)
Std. Error Sig.
95% Confidence Interval
Lower Bound
Upper Bound
Below 25
26-30 -.14356 .06368 .161 -.3176 .0305 31-40 -.20312* .06733 .022 -.3872 -.0191 41-50 -.08372 .12480 .963 -.4248 .2574 Above 50 -.65424* .21073 .017 -1.2302 -.0782
26-30
Below 25 .14356 .06368 .161 -.0305 .3176 31-40 -.05956 .05538 .819 -.2109 .0918 41-50 .05984 .11878 .987 -.2648 .3845 Above 50 -.51067 .20722 .100 -1.0771 .0557
31-40
Below 25 .20312* .06733 .022 .0191 .3872 26-30 .05956 .05538 .819 -.0918 .2109 41-50 .11940 .12077 .861 -.2107 .4495 Above 50 -.45111 .20837 .194 -1.0207 .1184
41-50
Below 25 .08372 .12480 .963 -.2574 .4248 26-30 -.05984 .11878 .987 -.3845 .2648 31-40 -.11940 .12077 .861 -.4495 .2107 Above 50 -.57051 .23337 .105 -1.2084 .0674
Above 50
Below 25 .65424* .21073 .017 .0782 1.2302 26-30 .51067 .20722 .100 -.0557 1.0771 31-40 .45111 .20837 .194 -.1184 1.0207 41-50 .57051 .23337 .105 -.0674 1.2084
*. The mean difference is significant at the 0.05 level.

Appendices
485
3.16. Occupation and Satisfaction of Customers
Multiple ComparisonsDependent Variable: SAT_N Tukey HSD
(I) Occupation (J) Occupation Mean
Difference (I-J)
Std. Error Sig.
95% Confidence Interval
Lower Bound
Upper Bound
Govt.employee
Private employee .00325 .08021 1.000 -.2338 .2403 Agreculture -.06839 .08931 .988 -.3323 .1955 Business .02554 .10400 1.000 -.2818 .3329 Professionals/ Self employed .09828 .09777 .953 -.1906 .3872 Students .22698 .08093 .076 -.0122 .4661 Others .19692 .10536 .502 -.1144 .5083
Private employee
Govt.employee -.00325 .08021 1.000 -.2403 .2338 Agreculture -.07164 .07901 .972 -.3051 .1618 Business .02229 .09530 1.000 -.2593 .3039 Professionals/ Self employed .09504 .08846 .936 -.1664 .3564 Students .22373* .06940 .022 .0186 .4288 Others .19367 .09678 .415 -.0923 .4797
Agreculture
Govt.employee .06839 .08931 .988 -.1955 .3323 Private employee .07164 .07901 .972 -.1618 .3051 Business .09393 .10308 .971 -.2107 .3985 Professionals/ Self employed .16667 .09678 .601 -.1193 .4527 Students .29537* .07974 .004 .0597 .5310 Others .26531 .10445 .146 -.0433 .5740
Business
Govt.employee -.02554 .10400 1.000 -.3329 .2818 Private employee -.02229 .09530 1.000 -.3039 .2593 Agreculture -.09393 .10308 .971 -.3985 .2107 Professionals/ Self employed .07274 .11049 .995 -.2538 .3992 Students .20144 .09591 .353 -.0820 .4849 Others .17138 .11726 .768 -.1751 .5179
Professionals/ Self employed
Govt.employee -.09828 .09777 .953 -.3872 .1906 Private employee -.09504 .08846 .936 -.3564 .1664 Agreculture -.16667 .09678 .601 -.4527 .1193 Business -.07274 .11049 .995 -.3992 .2538 Students .12870 .08911 .778 -.1346 .3920 Others .09864 .11177 .975 -.2316 .4289
Students
Govt.employee -.22698 .08093 .076 -.4661 .0122 Private employee -.22373* .06940 .022 -.4288 -.0186 Agreculture -.29537* .07974 .004 -.5310 -.0597 Business -.20144 .09591 .353 -.4849 .0820 Professionals/ Self employed -.12870 .08911 .778 -.3920 .1346 Others -.03006 .09738 1.000 -.3178 .2577
Others
Govt.employee -.19692 .10536 .502 -.5083 .1144 Private employee -.19367 .09678 .415 -.4797 .0923 Agreculture -.26531 .10445 .146 -.5740 .0433 Business -.17138 .11726 .768 -.5179 .1751 Professionals/ Self employed -.09864 .11177 .975 -.4289 .2316 Students .03006 .09738 1.000 -.2577 .3178
*. The mean difference is significant at the 0.05 level.

Appendices
486
3.17. Monthly Income and Satisfaction of Customers
Multiple Comparisons Dependent Variable: SAT_N Tukey HSD
(I) Monthly income
(J) Monthly income
Mean Difference
(I-J) Std.
Error Sig. 95% Confidence
Interval Lower Bound
Upper Bound
upto20000
20001-30000 -.16756 .06236 .079 -.3457 .0105 30001-40000 -.27303* .06868 .001 -.4692 -.0769 40001-50000 -.28970* .08725 .012 -.5389 -.0405 50001-60000 -.11827 .11756 .916 -.4540 .2175 Above 60000 -.13636 .08863 .639 -.3895 .1168
20001-30000
upto20000 .16756 .06236 .079 -.0105 .3457 30001-40000 -.10548 .07611 .736 -.3228 .1119 40001-50000 -.12214 .09322 .779 -.3884 .1441 50001-60000 .04929 .12205 .999 -.2993 .3978 Above 60000 .03120 .09450 .999 -.2387 .3011
30001-40000
upto20000 .27303* .06868 .001 .0769 .4692 20001-30000 .10548 .07611 .736 -.1119 .3228 40001-50000 -.01667 .09755 1.000 -.2953 .2619 50001-60000 .15476 .12539 .820 -.2033 .5129 Above 60000 .13667 .09879 .737 -.1455 .4188
40001-50000
upto20000 .28970* .08725 .012 .0405 .5389 20001-30000 .12214 .09322 .779 -.1441 .3884 30001-40000 .01667 .09755 1.000 -.2619 .2953 50001-60000 .17143 .13645 .809 -.2183 .5611 Above 60000 .15334 .11249 .749 -.1679 .4746
50001-60000
upto20000 .11827 .11756 .916 -.2175 .4540 20001-30000 -.04929 .12205 .999 -.3978 .2993 30001-40000 -.15476 .12539 .820 -.5129 .2033 40001-50000 -.17143 .13645 .809 -.5611 .2183 Above 60000 -.01809 .13734 1.000 -.4103 .3741
Above 60000
upto20000 .13636 .08863 .639 -.1168 .3895 20001-30000 -.03120 .09450 .999 -.3011 .2387 30001-40000 -.13667 .09879 .737 -.4188 .1455 40001-50000 -.15334 .11249 .749 -.4746 .1679 50001-60000 .01809 .13734 1.000 -.3741 .4103
*. The mean difference is significant at the 0.05 level.

Appendices
487
3.18. Education and Risk Perception of Customers
Multiple Comparisons Dependent Variable: RP_N Tukey HSD
(I) Education (J) Education Mean
Difference(I-J)
Std. Error Sig.
95% Confidence Interval
Lower Bound
Upper Bound
Upto tenth
Plus two / PDC .51110 .23918 .269 -.1720 1.1942 Graduation .31748 .21472 .678 -.2957 .9307 Post graduation .52608 .21235 .132 -.0804 1.1325 Professional .55623 .22273 .126 -.0799 1.1923 Others .58936 .25368 .186 -.1351 1.3138
Plus two / PDC
Upto tenth -.51110 .23918 .269 -1.1942 .1720 Graduation -.19362 .12916 .665 -.5625 .1752 Post graduation .01498 .12519 1.000 -.3425 .3725 Professional .04513 .14208 1.000 -.3606 .4509 Others .07826 .18690 .998 -.4555 .6120
Graduation
Upto tenth -.31748 .21472 .678 -.9307 .2957 Plus two / PDC .19362 .12916 .665 -.1752 .5625 Post graduation .20861* .06759 .025 .0156 .4016 Professional .23875 .09530 .124 -.0334 .5109 Others .27188 .15436 .492 -.1690 .7127
Post graduation
Upto tenth -.52608 .21235 .132 -1.1325 .0804 Plus two / PDC -.01498 .12519 1.000 -.3725 .3425 Graduation -.20861* .06759 .025 -.4016 -.0156 Professional .03014 .08985 .999 -.2264 .2867 Others .06327 .15105 .998 -.3681 .4947
Professional
Upto tenth -.55623 .22273 .126 -1.1923 .0799 Plus two / PDC -.04513 .14208 1.000 -.4509 .3606 Graduation -.23875 .09530 .124 -.5109 .0334 Post graduation -.03014 .08985 .999 -.2867 .2264 Others .03313 .16532 1.000 -.4390 .5053
Others
Upto tenth -.58936 .25368 .186 -1.3138 .1351 Plus two / PDC -.07826 .18690 .998 -.6120 .4555 Graduation -.27188 .15436 .492 -.7127 .1690 Post graduation -.06327 .15105 .998 -.4947 .3681 Professional -.03313 .16532 1.000 -.5053 .4390
*. The mean difference is significant at the 0.05 level.

Appendices
488
3.19. Occupation and Risk Perception of Customers Multiple Comparisons
Dependent Variable: RP_N Tukey HSD
(I) Occupation (J) Occupation Mean
Difference (I-J)
Std. Error Sig.
95% Confidence Interval
Lower Bound
Upper Bound
Govt.employee
Private employee -.20712 .09729 .336 -.4946 .0804 Agreculture -.16455 .10832 .733 -.4846 .1555 Business -.07654 .12614 .997 -.4493 .2962 Professionals/ Self employed .01120 .11858 1.000 -.3392 .3616 Students .14574 .09816 .754 -.1443 .4358 Others .07677 .12779 .997 -.3009 .4544
Private employee
Govt.employee .20712 .09729 .336 -.0804 .4946 Agreculture .04257 .09583 .999 -.2406 .3257 Business .13058 .11559 .919 -.2110 .4722 Professionals/ Self employed .21832 .10729 .393 -.0987 .5354 Students .35286* .08418 .001 .1041 .6016 Others .28389 .11739 .192 -.0630 .6308
Agreculture
Govt.employee .16455 .10832 .733 -.1555 .4846 Private employee -.04257 .09583 .999 -.3257 .2406 Business .08801 .12502 .992 -.2814 .4575 Professionals/ Self employed .17575 .11739 .747 -.1711 .5226 Students .31030* .09672 .023 .0245 .5961 Others .24133 .12668 .477 -.1330 .6157
Business
Govt.employee .07654 .12614 .997 -.2962 .4493 Private employee -.13058 .11559 .919 -.4722 .2110 Agreculture -.08801 .12502 .992 -.4575 .2814 Professionals/ Self employed .08774 .13401 .995 -.3083 .4837 Students .22228 .11633 .474 -.1215 .5660 Others .15331 .14222 .935 -.2670 .5736
Professionals/ Self employed
Govt.employee -.01120 .11858 1.000 -.3616 .3392 Private employee -.21832 .10729 .393 -.5354 .0987 Agreculture -.17575 .11739 .747 -.5226 .1711 Business -.08774 .13401 .995 -.4837 .3083 Students .13454 .10808 .876 -.1849 .4539 Others .06557 .13556 .999 -.3350 .4662
Students
Govt.employee -.14574 .09816 .754 -.4358 .1443 Private employee -.35286* .08418 .001 -.6016 -.1041 Agreculture -.31030* .09672 .023 -.5961 -.0245 Business -.22228 .11633 .474 -.5660 .1215 Professionals/ Self employed -.13454 .10808 .876 -.4539 .1849 Others -.06897 .11811 .997 -.4180 .2801
Others
Govt.employee -.07677 .12779 .997 -.4544 .3009 Private employee -.28389 .11739 .192 -.6308 .0630 Agreculture -.24133 .12668 .477 -.6157 .1330 Business -.15331 .14222 .935 -.5736 .2670 Professionals/ Self employed -.06557 .13556 .999 -.4662 .3350 Students .06897 .11811 .997 -.2801 .4180
*. The mean difference is significant at the 0.05 level.

Appendices
489
3.20. Age and Continuance Intention to use the TEBSS
Multiple Comparisons Dependent Variable: CI_N Tukey HSD
(I) Age (J) Age
Mean Difference
(I-J) Std.
Error Sig.
95% Confidence Interval
Lower Bound
Upper Bound
Below 25
26-30 -.19738* .07038 .041 -.3897 -.0050 31-40 -.27792* .07440 .002 -.4813 -.0746 41-50 -.16381 .13791 .758 -.5408 .2132 Above 50 -.73005* .23287 .015 -1.3666 -.0935
26-30
Below 25 .19738* .07038 .041 .0050 .3897 31-40 -.08054 .06120 .681 -.2478 .0867 41-50 .03357 .13126 .999 -.3252 .3923 Above 50 -.53267 .22899 .138 -1.1586 .0932
31-40
Below 25 .27792* .07440 .002 .0746 .4813 26-30 .08054 .06120 .681 -.0867 .2478 41-50 .11411 .13346 .913 -.2507 .4789 Above 50 -.45213 .23026 .285 -1.0815 .1773
41-50
Below 25 .16381 .13791 .758 -.2132 .5408 26-30 -.03357 .13126 .999 -.3923 .3252 31-40 -.11411 .13346 .913 -.4789 .2507 Above 50 -.56624 .25789 .182 -1.2711 .1387
Above 50
Below 25 .73005* .23287 .015 .0935 1.3666 26-30 .53267 .22899 .138 -.0932 1.1586 31-40 .45213 .23026 .285 -.1773 1.0815 41-50 .56624 .25789 .182 -.1387 1.2711
*. The mean difference is significant at the 0.05 level.

Appendices
490
3.21. Monthly Income and Continuance Intention to use the TEBSS
Multiple Comparisons Dependent Variable: CI_N Tukey HSD
(I) Monthly income
(J) Monthly income
Mean Difference
(I-J) Std.
Error Sig.
95% Confidence Interval
Lower Bound
Upper Bound
upto20000
20001-30000 -.25291* .06908 .004 -.4502 -.0556 30001-40000 -.27624* .07608 .004 -.4935 -.0590 40001-50000 -.21208 .09666 .241 -.4881 .0640 50001-60000 -.30791 .13022 .170 -.6798 .0640 Above 60000 -.14265 .09818 .694 -.4230 .1377
20001-30000
upto20000 .25291* .06908 .004 .0556 .4502 30001-40000 -.02333 .08431 1.000 -.2641 .2175 40001-50000 .04083 .10326 .999 -.2541 .3357 50001-60000 -.05500 .13520 .999 -.4411 .3311 Above 60000 .11026 .10469 .900 -.1887 .4092
30001-40000
upto20000 .27624* .07608 .004 .0590 .4935 20001-30000 .02333 .08431 1.000 -.2175 .2641 40001-50000 .06417 .10807 .991 -.2445 .3728 50001-60000 -.03167 .13890 1.000 -.4284 .3650 Above 60000 .13359 .10943 .827 -.1789 .4461
40001-50000
upto20000 .21208 .09666 .241 -.0640 .4881 20001-30000 -.04083 .10326 .999 -.3357 .2541 30001-40000 -.06417 .10807 .991 -.3728 .2445 50001-60000 -.09583 .15116 .988 -.5275 .3359 Above 60000 .06943 .12462 .994 -.2865 .4253
50001-60000
upto20000 .30791 .13022 .170 -.0640 .6798 20001-30000 .05500 .13520 .999 -.3311 .4411 30001-40000 .03167 .13890 1.000 -.3650 .4284 40001-50000 .09583 .15116 .988 -.3359 .5275 Above 60000 .16526 .15214 .887 -.2692 .5997
Above 60000
upto20000 .14265 .09818 .694 -.1377 .4230 20001-30000 -.11026 .10469 .900 -.4092 .1887 30001-40000 -.13359 .10943 .827 -.4461 .1789 40001-50000 -.06943 .12462 .994 -.4253 .2865 50001-60000 -.16526 .15214 .887 -.5997 .2692
*. The mean difference is significant at the 0.05 level.
…..…..

491
1. Rajisha T. (2019). Digital Payment System: A Technology Enabled Banking Self-Services in India. Zenith International Journal of Multidisciplinary Research, 9, pp. 537-548 (e-ISSN: 2231-5780).
2. Rajisha T. (2019). History of Banking in India and Emergence of New Generation Banks International Journal of Research in Social Science. 9 (7) pp.463-474 (ISSN: 2249-2496).
3. Rajisha T. (2019). Analysing the Role of Post-use Trust in Predicting Customer Satisfaction- A Study from Mobile Banking Perspective. Think India Journal, 22 (10) pp. 4781-4792 (ISSN: 0971-1260).
4. Rajisha T. (2014). Rupay Card- An Innovative Domestic Solution to Plastic Money in India, FINNOVA-15 (ISBN: 978-81-89085-95-7).
Paper Presentations 1. “Rupay Card- An Innovative Domestic Solution to Plastic Money in
India” in a UGC sponsored National seminar on Financial engineering in India, growth prospects and challenges on 23rd Nov 2014 at N.S.S College, Nemmara, Palakkad (Best Paper Award)
2. “Role of Banking Sector in Entrepreneurship Development” at National seminar on Education, Innovation, and Entrepreneurship sponsored by Collegiate education Kerala, on 4th Feb 2015 at C.K.G.M. Govt. college Perambra.
3. “Innovative Products and Services of New Generation Banks in Kerala” at a UGC Sponsored National seminar on Emerging trends in banking and finance: opportunities challenge and Responses at Newman college Thodupuzha on 31st July 2015
4. “Payment Banking in India, Its Scope and Objectives” at a UGC sponsored National seminar on Financial services Market in India: Opportunities and challenges at Govt. Brennen College Thalasseri on 20th October 2015.
5. Customer Satisfaction in Virtual Banking Services – A Study with TAM Ugc sponsored National seminar on “Role of Technology in banking and financial services industry in India: Imperatives and Impediments” at Department of Applied Economics- Cochin University of Science and Technology on 24-25th May 2018.
6. Analysing the Role of Post-use Trust in Predicting Customer Satisfaction- A Study from Mobile Banking Perspective: International Conference on “Entrepreneurship in the era of Innovation and Disruption at John Mathai Centre, Thrissur on12th November 2019.
…..…..