sri lanka the economy report 2016 - policy analysis · 2009-2015; transfers and subsidies to...
TRANSCRIPT

Sri Lanka
State of the Economy Report 2016
Chapter 9 Improving Efficiency and Mobilizing Resources
for Poverty Reduction Initiatives in Sri Lanka
by
Ganga Tilakaratne & Chinthani Sooriyamudali

STATE OF THE ECONOMY 2016
164
Sri Lanka's performance with regard to
poverty reduction over the years has
been commendable, with the poverty
headcount ratio (PHC) falling to 6.7 per cent in
2012/13 and successfully achieving the MDG
of halving poverty before the deadline.
Government expenditure related to poverty and
vulnerability has shown a remarkable increase
in recent years. Government spending on
transfers to households has more than doubled
during 2009-2015, accounting for about 3.1 per
cent of GDP in 2015. The reduction in poverty
should ideally lead to a decrease in expenditure
on the poor. However, this has not been the
case for Sri Lanka. A closer inspection of the
existing government poverty and vulnerability
initiatives shows that there are many inherent
inefficiencies leading to the ineffective
implementation of programmes.
The focus of this chapter is to assess possible
improvements in cost-efficiency of current
poverty reduction programmes -- primarily, the
Divineguma programme as it is the single
largest -- while lessening their fiscal burden.
The chapter further explores the potential of
mobilizing private sector participation as a
complementary measure of financing poverty
reduction. In this context, section 9.2 analyses
government spending patterns on poverty and
vulnerability, par ticular ly looking at the
Samurdhi/Divineguma programme. The three
key components of Divineguma, i.e., the welfare
programme (section 9.3), livelihood programme
(section 9.4) and microfinance programme
(section 9.5) are then discussed in detail,
highlighting the issues and weaknesses while
reflecting on how efficiency can be improved to
ensure further poverty reduction, and make the
Divineguma programme sustainable overall.
Section 9.6 examines the possibil ity of
encouraging private sector participation in
poverty reduction via Corporate Social
Responsibility (CSR) initiatives, while section
9.7 includes some concluding remarks.
9.2 Expenditure Patt-erns for Poverty andVulnerabilityExpenditure related to poverty and vulnerability,
in particular transfers and subsidy expenditure
has shown a remarkable increase in recent
years. Government spending on transfers to
households has more than doubled during
2009-2015; transfers and subsidies to
households accounted for about 3.1 per cent of
GDP in 2015. Pensions for public servants and
Samurdhi cash transfers are the two main items
among household transfers. Government
expenditure on pensions accounts for nearly a
9. Improving Efficiency and MobilizingResources for Poverty ReductionInitiatives in Sri Lanka9.1 Introduction

STATE OF THE ECONOMY 2016
165
half of the total spending on transfers and
subsidies to households. The expenditure on
pensions has increased from around Rs. 85
billion in 2009 to Rs. 155 billion in 2015, despite
its decline as a percentage of GDP from 1.8 per
cent to 1.4 per cent during this period.
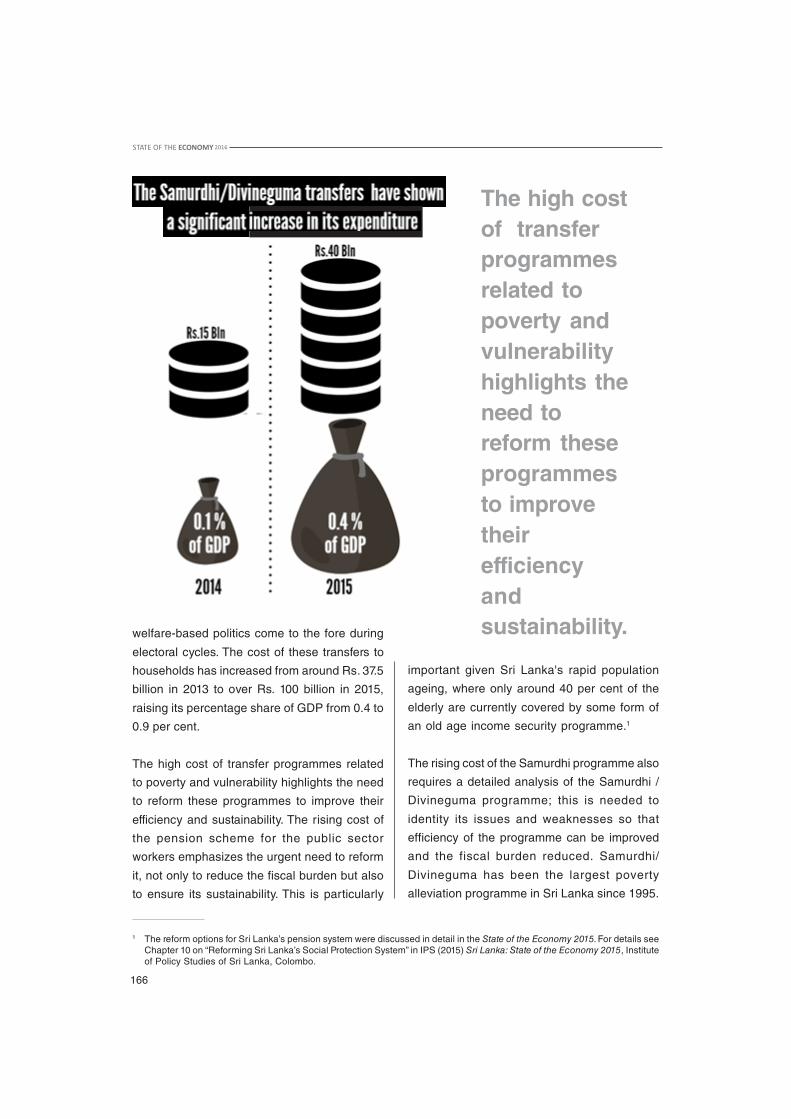
The Samurdhi transfers - the largest transfer
programme for the poor in Sri Lanka - has
shown a significant increase in its expenditure
from around Rs. 15 billion in 2014 to nearly Rs.
40 billion in 2015. In 2015, Samurdhi transfers
accounted for about 0.4 per cent of GDP - a
substantial increase from 0.1 per cent of GDP
in 2014. Expenditure on other transfers and
subsidies to households that include school
welfare programmes, assistance to elderly and
disabled persons, etc., too has shown a notable
increase. Some of the increased expenditures
arise from political-economy factors where
Table 9.1Expenditure on Transfers and Subsidies
Rs. million Item 2009 2010 2011 2012 2013 2014 2015 2016a
Current transfers 190,168 196,216 216,602 234,692 248,549 317,674 419,420 439,065 and subsidies
O/w to households 148,993 156,194 171,438 187, 895 195,288 251,665 345,483 371,392 and other sectors
Samurdhi 9,267 9,241 9,044 10,553 15,256 15,042 39,994 43,950
Pensions 85,139 90,995 99, 936 111,682 122,813 126,136 155,320 167,845
Fertilizer subsidy 26,935 26,028 29, 802 36,456 19,706 31,802 49,571 35,000
Other 27,652 29,931 32, 656 29,203 37,512 78,685 100,598 124,597
As a Percentage of GDP
Current transfers 3.9 3.5 3.3 3.1 2.9 3.0 3.8 3.5 and subsidies
O/w to households 3.1 2.8 2.6 2.5 2.3 2.4 3.1 3.0 and other sectors
Samurdhi/ 0.2 0.2 0.1 0.1 0.2 0.1 0.4 0.4
Pensions 1.8 1.6 1.5 1.5 1.4 1.2 1.4 1.3
Fertilizer subsidy 0.6 0.5 0.5 0.5 0.2 0.3 0.4 0.3
Other 0.6 0.5 0.5 0.4 0.4 0.8 0.9 1.0
Notes: a: Approved estimates for 2016.
Source: CBSL, Annual Report, various years.
STATE OF THE ECONOMY 2016
166
The high costof transferprogrammesrelated topoverty andvulnerabilityhighlights theneed toreform theseprogrammesto improvetheirefficiencyandsustainability.welfare-based politics come to the fore during
electoral cycles. The cost of these transfers to
households has increased from around Rs. 37.5
billion in 2013 to over Rs. 100 billion in 2015,
raising its percentage share of GDP from 0.4 to
0.9 per cent.
The high cost of transfer programmes related
to poverty and vulnerability highlights the need
to reform these programmes to improve their
efficiency and sustainability. The rising cost of
the pension scheme for the public sector
workers emphasizes the urgent need to reform
it, not only to reduce the fiscal burden but also
to ensure its sustainability. This is particularly
important given Sri Lanka's rapid population
ageing, where only around 40 per cent of the
elderly are currently covered by some form of
an old age income security programme.1
The rising cost of the Samurdhi programme also
requires a detailed analysis of the Samurdhi /
Divineguma programme; this is needed to
identity its issues and weaknesses so that
efficiency of the programme can be improved
and the fiscal burden reduced. Samurdhi/
Divineguma has been the largest poverty
alleviation programme in Sri Lanka since 1995.
1 The reform options for Sri Lanka’s pension system were discussed in detail in the State of the Economy 2015. For details seeChapter 10 on “Reforming Sri Lanka’s Social Protection System” in IPS (2015) Sri Lanka: State of the Economy 2015, Instituteof Policy Studies of Sri Lanka, Colombo.

STATE OF THE ECONOMY 2016
167
It has multiple components that include a
welfare programme, a livelihood development
programme and a microfinance programme.
Until 2014, the Samurdhi welfare programme
was administered by the Department of the
Commissioner General of Samurdhi (DCGS),
while the livelihood development and
microfinance programmes were administered
by the Samurdhi Authority of Sri Lanka (SASL).
Since 2014, all the components were taken
under the purview of the Department of
Divineguma Development (DDD), established
by amalgamating the DCGS, SASL and three
other institutions under the Divineguma Act,
No.1 of 2013.
The government spends a large sum of money
annually on the Divineguma programme. As per
the budget estimates for 2016, the cost (which
includes that of transfers, personal emoluments
like salaries and allowances and capital
expenditure) is around Rs. 57 billion. This
accounts for about 80 per cent of the total budget
estimate of the Ministry of Social Empowerment
and Welfare (MOSEW) for 2016.
The (estimated) budget of the DDD has
increased in 2016 from its 2015 level - both in
terms of the value and as a share of the total
budget estimate for the Ministry. The increase
in the Divineguma budget is mainly due to the
increase in the estimated cost of transfers under
the welfare programme, and the cost of personal
emoluments such as salaries, wages and
personal allowances. As shown in Table 9.2,
the welfare programmes accounts for over 75
per cent of the overall budget of the DDD, while
the personal emoluments account for about 20
per cent of the Divineguma budget. The
budgetary allocations for the welfare
programmes (primar ily, the cash transfer
programme) is over Rs. 43 billion in 2016, while
allocations for the other components like
livelihood development and microfinance
programmes are relatively low. For example,
the budget for the livelihood development
programme was Rs 1.2 billion in 2015 while the
same amount has been estimated for 2016.
Sections 9.3-9.5 examine the three key
components of the Divineguma programme -
Table 9.2Divineguma Department - Budget Estimates 2016 (Rs '000)
2016Estimate
Total Recurrent Expenditure 55,990,320 Personal Emoluments 11,678,000
Salaries and wages 5,208,000Overtime and holiday payments 10,000Other allowances 6,460,000
Transfers 43,970,000Welfare programme 43,950,000Public institutionsProperty loan interest to public servants 20,000
Other 342,320
Total Capital Expenditure 1,247,600 Livelihood development programme 1,200,000 Other 47,600
Total Expenditure 57,237,920
Source: MOF, Budget Estimates 2016; Interviews with the Department of Divineguma Development.
STATE OF THE ECONOMY 2016
168
welfare programme, microfinance programme
and the livelihood development programme.
9.3 Divineguma Wel-fare ProgrammeThe Divineguma (or Samurdhi) welfare
programme comprises a monthly cash transfer
programme, social security/insurance
programme and a housing assistance
programme for low income groups. It aims at
addressing consumption shortfalls and reducing
vulnerability among the poor. It is the main
component of the Divineguma programme in
terms of its budgetary allocations, accounting
for over 75 per cent of the total Divineguma
budget.
The cost of the welfare programme increased
substantially in 2015 with an increase granted
in the monthly benefits to families - twice during
the year, in January and in April 2015. Since
April 2015, the identified families receive a
monthly grant between Rs. 420 and Rs. 3500.
The amount received depends on the family
size, except for the so-called 'empowered
family' category that is given the minimum
amount of Rs. 420. There are deductions from
the monthly grant to three different funds: (i)
compulsory savings - that can generally be
withdrawn after the beneficiary reaches the age
of 60, (ii) the social security fund that provides
cover for the beneficiaries in the event of illness,
death, marriage and childbirth; and (iii) the
housing fund to provide housing assistance to
low-income families. The net cash transfer
amount (after the deductions) is transferred to
the beneficiary's account at a Divineguma bank.
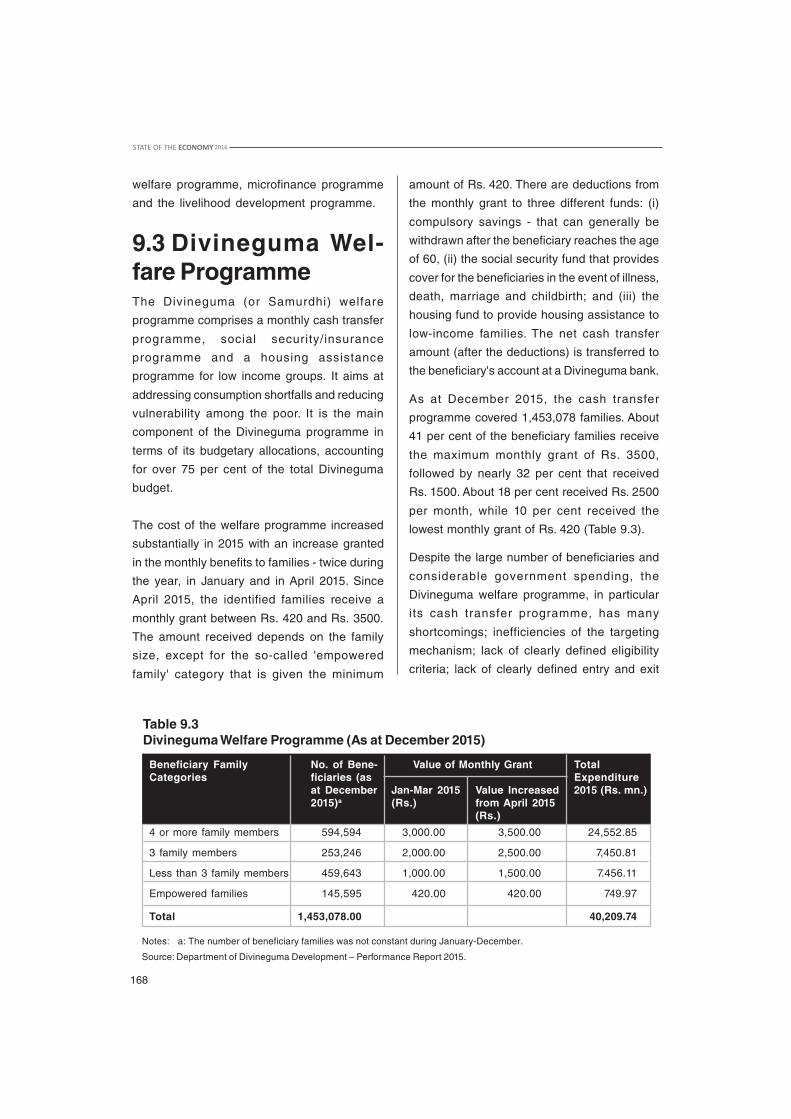
As at December 2015, the cash transfer
programme covered 1,453,078 families. About
41 per cent of the beneficiary families receive
the maximum monthly grant of Rs. 3500,
followed by nearly 32 per cent that received
Rs. 1500. About 18 per cent received Rs. 2500
per month, while 10 per cent received the
lowest monthly grant of Rs. 420 (Table 9.3).
Despite the large number of beneficiaries and
considerable government spending, the
Divineguma welfare programme, in particular
its cash transfer programme, has many
shortcomings; inefficiencies of the targeting
mechanism; lack of clearly defined eligibility
criteria; lack of clearly defined entry and exit
Table 9.3Divineguma Welfare Programme (As at December 2015)
Beneficiary Family No. of Bene- Value of Monthly Grant TotalCategories ficiaries (as Expenditure
at December Jan-Mar 2015 Value Increased 2015 (Rs. mn.)2015)a (Rs.) from April 2015
(Rs.)
4 or more family members 594,594 3,000.00 3,500.00 24,552.85
3 family members 253,246 2,000.00 2,500.00 7,450.81
Less than 3 family members 459,643 1,000.00 1,500.00 7.456.11
Empowered families 145,595 420.00 420.00 749.97
Total 1,453,078.00 40,209.74
Notes: a: The number of beneficiary families was not constant during January-December.
Source: Department of Divineguma Development – Performance Report 2015.
STATE OF THE ECONOMY 2016
169
mechanisms; issues related to the quality of
benefits; and the polit icization of the
programme.2
Poor targeting is one of the main weaknesses
of the Divineguma welfare programme.3
Estimates based on DCS HIES (2012/13) show
that 16.4 per cent of households in the country
are receiving Samurdhi cash transfers with
some households having multiple Samurdhi
recipients.4 This is around three times higher
than the percentage of poor households in the
country (5.3 per cent). The targeting errors are
substantial - 14.4 per cent of the 16.4 per cent
of Samurdhi recipient households (accounting
for about 88 per cent of beneficiary
households) are non-poor households, while
only a smaller share of the beneficiaries are
from poor households as defined by the
national poverty line. By contrast, there is a
substantial share of poor households who are
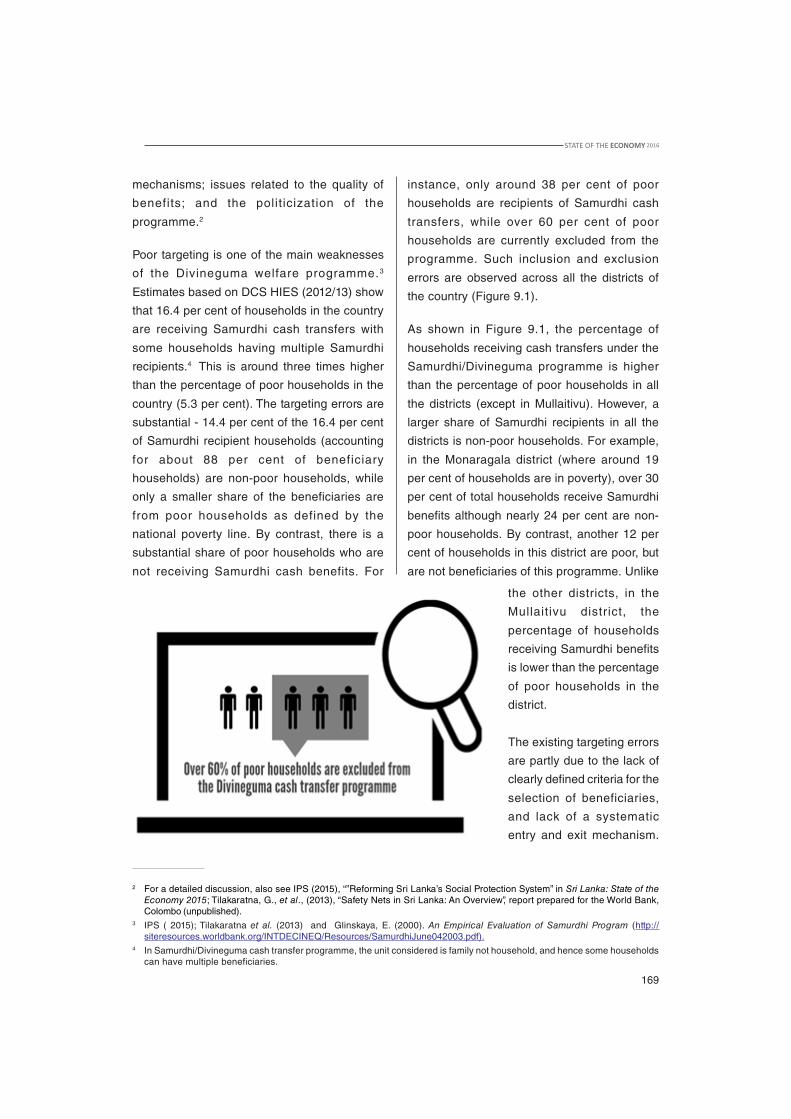
not receiving Samurdhi cash benefits. For
instance, only around 38 per cent of poor
households are recipients of Samurdhi cash
transfers, while over 60 per cent of poor
households are currently excluded from the
programme. Such inclusion and exclusion
errors are observed across all the districts of
the country (Figure 9.1).
As shown in Figure 9.1, the percentage of
households receiving cash transfers under the
Samurdhi/Divineguma programme is higher
than the percentage of poor households in all
the districts (except in Mullaitivu). However, a
larger share of Samurdhi recipients in all the
districts is non-poor households. For example,
in the Monaragala district (where around 19
per cent of households are in poverty), over 30
per cent of total households receive Samurdhi
benefits although nearly 24 per cent are non-
poor households. By contrast, another 12 per
cent of households in this district are poor, but
are not beneficiaries of this programme. Unlike
2 For a detailed discussion, also see IPS (2015), “”Reforming Sri Lanka’s Social Protection System” in Sri Lanka: State of theEconomy 2015; Tilakaratna, G., et al., (2013), “Safety Nets in Sri Lanka: An Overview”, report prepared for the World Bank,Colombo (unpublished).
3 IPS ( 2015); Tilakaratna et al. (2013) and Glinskaya, E. (2000). An Empirical Evaluation of Samurdhi Program (http://siteresources.worldbank.org/INTDECINEQ/Resources/SamurdhiJune042003.pdf).
4 In Samurdhi/Divineguma cash transfer programme, the unit considered is family not household, and hence some householdscan have multiple beneficiaries.
the other districts, in the
Mullaitivu district, the
percentage of households
receiving Samurdhi benefits
is lower than the percentage
of poor households in the
district.
The existing targeting errors
are partly due to the lack of
clearly defined criteria for the
selection of beneficiaries,
and lack of a systematic
entry and exit mechanism.

STATE OF THE ECONOMY 2016
170
Figure 9.1Percentage of Samurdhi Beneficiary Households by Poverty Status and District
Source: Estimated based on data from DCS HIES 2012/13.
Bolsa Família is the world's largest conditional cash transfer programme, providing benefits to poor andextremely poor families in Brazil. The programme was established in 2003, scaling up and coordinatingscattered existing social protection initiatives. Within a decade of its establishment, the programme hasbenefited over 14 million households (amounting to 50 million people) and cut poverty by 28 per cent inBrazil within a decade for just 0.5 per cent of GDP.
Bolsa Família's cash transfers are conditional on participants meeting health and education targets thatfocus on human capital formation. Basic benefit structure includes the provision of monthly cash paymentsthrough a debit card to the beneficiary families.
Bolsa Família uses the Means Testing targeting method to identify beneficiaries for the programme.Municipal agents use a standardized questionnaire to collect information on income and input thisinformation to Brazil's database on the beneficiaries of all targeted social programmes called CadastroÚnico (CadÚnico). This database is considered a prominent feature of the Bolsa Família programme asit facilitates the effective monitoring and management of all participants in every social assistanceprogramme in the country. The database is screened annually to ensure eligibility of all families participatingin Bolsa Família.
Families within the programme continue to receive cash transfers as long as they are eligible, with re-certification occurring every two years. Over the course of two years, municipal workers verifycompliance with conditionalities on a bi-weekly basis for education, and on a bi-annual basis for healthcare.
Sources: World Bank. (2016), "Bolsa Família: Brazil's Quiet Revolution", available at: http://www.worldbank.org/en/ news/opinion/ 2013/ 11/04/bolsa-familia-Brazil-quiet-revolution; The Economist, (2015), "Helpingthe Poorest of the Poor, available at: http://www.economist .com/news/international/21638333-developing-countries-have-started-weave-social-safety-nets-heres-how-they-should-do-it; Coady,D., et al., (2004), Targeting of Transfers in Developing Countries: Review of Lessons and Experience,World Bank, Washington, D.C., Mostafa, J. and K. da Silva, K. (2007), Brazil's Single RegistryExperience: A Tool for Pro-poor Social Policies, available at: http://www.ipc-undp.org/doc_africa_brazil/Webpage/ missao/ Artigos/ CadastroUnicoJoanaMostafa.pdf.
Box 9.1Conditional Cash Transfer (CCT) Programmes: Bolsa Família (Brazil)
% of non-poor recipients
% of poor recipients
% of non-receiving poor
% of total poor households

STATE OF THE ECONOMY 2016
171
Currently, there is no clearly defined eligibility
criteria for selecting beneficiary families. The
majority of families that were selected for the
Samurdhi programme in the mid-late 1990s
have simply continued as beneficiaries, with a
relatively small number of 'new entrants' and
'exits' over the years. There is no systematic
mechanism to identify the 'new poor' families
who deserve to be included or to remove the
non-poor families who are not entitled to receive
benefits. The Divineguma cash transfer
programme also does not have a stipulated
assessment timeline in which the beneficiaries
are to be (re)assessed for their eligibility to
remain, or enter/exit the programme.
In this context, Sri Lanka can learn from the
experience of a successful cash transfer
programmes such as Brazil's Bolsa Familia
conditional cash transfer programme (Box 9.1).
Bolsa Familia's clearly defined entry and exit
mechanism serves as a good example;
beneficiaries are selected methodically after
collecting information on their income via a
standardized questionnaire; after selection,
beneficiaries need to be re-certified every two
years. Such a systematic selection can provide
a solution to politicization of beneficiary
selection in the Divineguma programme.
Additionally, if the targeting mechanism is fine-
tuned to ensure that only the deserving can
enter the programme, the quality of the benefits
provided can also be raised (as the number of
beneficiaries will automatically decrease with
the exit of non-deserving beneficiaries).
Moreover, in the Bolsa Familia, receiving the
cash grant is conditional on beneficiaries
meeting certain health and education targets
set by the government. The conditional nature
has also contributed to ensuring that basic
health and education standards are met among
the Brazilian poor.
Furthermore, the availability of a database on
all the beneficiaries of all the targeted social
programmes in Brazil has also facilitated the
effective management and monitoring of all
beneficiaries across the country's various social
assistance programmes.
9.4 Divineguma Liveli-hood ProgrammeThe livelihood development programme is
another component of the Divineguma
programme that aims at addressing poverty by
empowering low-income families via enhancing
their capacity to generate income. This
programme targets a variety of sectors including
agriculture, fisheries, animal husbandry and
micro-industry. Since the establishment of the
DDD in 2014, over 150,000 livelihood
development projects have been carried out
under this; the projects were mostly aimed at
assisting beneficiaries to acquire certain
machinery/equipment that could help enhance
their earning potential. The projects were at least
par tially funded by the government. The
proportion of the project cost that should be
borne by the beneficiary depends on the level
of pover ty/vulnerability of the family. For
example, in 2015, low-income families with a
member who suffers from chronic illness or
long-term disability could receive up to 90 per
cent of the project cost as a grant while
contributing only 10 per cent. In addition to
providing individual project assistance, the
livelihood programme has also carried out some
village/region based projects during 2014-15.
The projects carried out are funded via three
sources: Treasury grants, beneficiary
contribution, and the Livelihood Revolving Fund
(LRF). For the most part, livelihood projects are
funded from Treasury grants that are allocated

STATE OF THE ECONOMY 2016
172
for the livelihood development programme.
Whenever these Treasury grants are given to
beneficiaries in the form of a loan (as opposed
to a grant), it is re-collected to the LRF which is
then used to finance livelihood projects when
the Treasury grants are not sufficient.
In 2014, there were instances where the whole
cost was borne by the DDD. In fact, over 60 per
cent of projects carried out in 2014 were funded
fully by the department.5 However, provision of
full financial support was abandoned in 2015
to better ensure beneficiary commitment. In
2015, almost 30,000 of the projects (i.e., 53 per
cent of total projects) were funded under the
scheme which requires the least contribution
from DDD, where only 40 per cent of the project
cost is provided as a grant (see Table 9.4).
Furthermore, it is under this scheme that the
highest amount of beneficiary capital has been
mobilised (i.e., Rs. 474 million or 82 per cent of
total beneficiary contribution). However, another
26,692 projects were provided with 90 per cent
of the project cost as a grant by the DDD with a
total cost of Rs. 712 million. The DDD spent
approximately Rs. 2 billion to support a total of
56,777 projects in 2015. The highest
expenditure has been incurred on projects
related to industries/small enterprises. In 2015,
26,774 industrial projects were supported under
the Divineguma livelihood development
programme incurring a total cost of Rs. 590
million (Figure 9.2).
In 2016, there was a significant shift in the
livelihood development policy of the DDD.
Before 2016, it mostly aided beneficiaries to
acquire machinery and equipment required for
income generating activities. However, since
2016, the DDD is now concentrating its efforts
to help finance business/project proposals of
selected beneficiaries. Earlier, the focus was
on aiding the maximum possible number of
beneficiaries; now, the strategy is to identify
Figure 9.2Project Breakdown Based on the Sector and Contributory Source - 2015
Source: Department of Divineguma Development, “Livelihood Division Performance Report 2015”,
5 Department of Divineguma Development, “Livelihood Division Performance Report 2015”,
Rs.
mn.
No.
of p
roje
cts
Agriculture Animal Fisheries Industries Marketing Job oriented husbandry training

STATE OF THE ECONOMY 2016
173
Under this new strategy, each distr ict is
authorized to identify a certain number of
beneficiaries: this number will be decided by
the number of Samurdhi beneficiaries in the
district as well as its poverty level. Similar to the
previous years, it is not necessary for the
beneficiaries to be Samurdhi subsidy
recipients; any low-income family member can
submit their project proposal for consideration.
The selection will be done by the grass-root
level officers including the Divineguma
Development Officers and Grama Niladaris.
Project proposals are evaluated on their
feasibility to be self-sustaining within a given
period of time. In this case, the minimum
beneficiary contribution is 50 per cent. The
balance 50 per cent is provided by the DDD as
a grant. The beneficiary can either invest his
own capital, or he can apply for a loan from
Divineguma banks.
Before 2016, the livelihood programme
provided assistance for individual beneficiaries
as well as for village/region based projects. In
the latter case, the DDD worked in tandem with
existing societies in the vil lage or with
Divineguma community based organizations
(CBOs). The assistance provided was generally
in the form of machinery/equipment. However,
with the change in the livelihood development
strategy to provide financial assistance to those
with entrepreneurship potential to realize their
business plan, there will be no more village/
region based machinery/equipment procuring
projects.
Another change in the livelihood programme
in 2016 is the introduction of a special project
scheme for the estate sector, aimed at helping
estate sector workers to earn an additional
income. In this case, the minimum beneficiary
contribution required is 10 per cent with the
DDD providing up to 90 per cent of the capital
required as a grant. However, the size of the
projects will be smaller compared to the other
projects because the estate sector families
have been identified as having comparatively
less financial capacity.
9.4.1 Improving Efficiency of the9.4.1 Improving Efficiency of the9.4.1 Improving Efficiency of the9.4.1 Improving Efficiency of the9.4.1 Improving Efficiency of theLivelihood Development Pro-Livelihood Development Pro-Livelihood Development Pro-Livelihood Development Pro-Livelihood Development Pro-grammegrammegrammegrammegrammeSince the Divineguma livelihood development
programme was introduced in 2014, there has
been a trend towards increasing the beneficiary
contribution to the livelihood programme. The
2014 practice of fully financing projects was
terminated in 2015 and the programme
succeeded in mobilizing around Rs. 578 million
as beneficiar y contribution (Table 9.4).
Decreasing the grant component was also taken
as a step to ensure beneficiary commitment
because there have been cases where, after
receiving the machinery/equipment free of
charge, the beneficiary has not actively used it
to generate income.
When formulating poverty reduction policies it
is important to ensure that they are conducive
to communities/beneficiaries becoming self-
sustaining in the long run. Government hand-
outs can induce a culture of dependency.
Therefore, the DDD's stance to increase the
beneficiary contribution of livelihood assistance
(as opposed to the grant component which does
not have to be paid back) can be considered as
a progressive step.
beneficiaries with entrepreneurship potential
and viable project proposals with financial
feasibility.

STATE OF THE ECONOMY 2016
174
Agr
icul
ture
6,79
714
1.9
628
.17
290.
500.
408,
691
94.4
710
8.7
01
5,5
17
23
6.9
313
7.2
7
Ani
mal
hus
band
ry4,
488
14
3.1
522
.79
30.
090.
072,
587
49.5
649
.76
7,07
81
92
.79
72.6
1
Fis
he
rie
s65
922
.58
3.17
30.
080.
2957
611
.02
12.3
41,
238
33.6
715
.80
Indu
stri
es a
nd e
ntre
pren
eurs
hip
11,9
46
337.
86
40.5
340
1.15
1.13
14
,78
82
51.
722
48
.20
26
,774
59
0.7
32
89
.86
Mar
ketin
g d
evel
opm
ent
2,70
463
.46
5.62
140.
370.
183,
111
45.1
850
.37
5,82
910
9.01
56.1
7
Job
orie
nted
tra
inin
g95
3.64
1.80
--
-24
35.
264.
7333
88.
906.
53
Tota
l26
,692
712.
6610
2.08
892.
182.
0629
,996
457.
2047
4.10
56,7
771,
172.
0357
8.24
Pr
ojec
t Cos
t (90
% a
s a
gran
t,
Pro
ject
Cos
t (50
% a
s a
gran
t, P
roje
ct C
ost (
40%
as
a gr
ant
Tot
al
10%
ben
efic
iary
con
trib
utio
n)
50%
ben
efic
iary
con
trib
utio
n)
10%
ben
efic
iary
con
tri-
b
utio
n 50
% f
rom
LR
F)
No. of projects
Sec
tor
Dept.contribution
(Rs. mn.
No. of projects
Beneficiarycontribution
(Rs. mn.)
Dept.contribution
(Rs. mn.
Beneficiarycontribution
(Rs. mn.)
No. of projects
Dept.contribution
(Rs. mn.)
Beneficiarycontribution
(Rs. mn.)
No. of projects
Dept.contribution
(Rs. mn.)
Beneficiarycontribution
(Rs. mn.)
Tab
le 9
.4P
roje
ct B
reak
dow
n b
ased
on
the
Sec
tor
and
the
Co
ntr
ibu
tory
Sch
eme
- 201
5
Not
es:
The
se fi
gure
s do
not
incl
ude
the
2,60
3 sp
ecia
l pro
ject
s un
dert
aken
by
the
DD
D in
201
5 w
hich
wer
e ai
med
at
a va
riet
y of
pur
pose
s in
clud
ing
the
deve
lopm
ent
ofm
inor
irri
gatio
n w
orks
and
pro
visi
on o
f dri
nkin
g w
ater
faci
litie
s.
Sou
rce:
Dep
artm
ent o
f Div
ineg
uma
Dev
elop
men
t, “L
ivel
ihoo
d D
ivis
ion
Per
form
ance
Rep
ort 2
015”
,
STATE OF THE ECONOMY 2016
175
The stance taken since 2016 of providing
financial assistance to execute selected
business plans can also be considered as an
improvement in the strategy which up to this
point focused on maximising the number of
beneficiaries, rather than ensuring the financial
viability of the projects carried out. This is
especially evident in the lack of an evaluation
mechanism capable of measuring the actual
economic outcome (e.g., the additional income
received by the beneficiary) of the projects.
However, the new strategy is capable of
naturally addressing this shortcoming due to
two main reasons; the number of beneficiaries
will be significantly reduced, which will simplify
the monitoring mechanism; and the nature of
the new strategy is such that there is a heavy
emphasis on evaluating the results and the
progress of the projects since the project
proposals are selected on the basis of their
capability to become self-sustaining within a
given period of time.
The Divineguma livelihood programme could
be further improved by taking an Asset Based
Community Development (ABCD) approach
(discussed in detail in Box 9.2) where particular
attention is paid to linking micro-assets of the
community to the macro-environment of the
community through an endogenous
mechanism, instead of the current, apparently
ad-hoc nature of livelihood assistance based
on beneficiary requests financed by injecting
external resources to communities.
ABCD has been globally identified as an
approach that is appropriate in an increasingly
diverse world where there is no one-size fits all
approach to community development. Any
national level poverty reduction strategy in Sri
Lanka should take into account regional
disparities; even within the same districts, there
exists areas that require different approaches
to development.
The DDD is already poised to make such an
approach to community development possible.
CBOs and the Divineguma community based
banks (or 'Divineguma banks' which comprises
of over 1,000 banks) that have already been
established around Sri Lanka can easily
facilitate such an approach. Furthermore, the
Divineguma Development Officers who
represent the DDD at the grass-root level can
also play a key role in guiding this process.
Whenformulatingpoverty re-ductionpolicies itis importantto ensurethat they areconducive tocommunities/beneficiariesbecomingself-sustainingin thelong run.
STATE OF THE ECONOMY 2016
176
In fact, it can be argued that the DDD is already
moving towards an ABCD approach by
examining the modifications made to the
Divineguma livelihood development
programme. First, it took steps to curb the
charitable nature of its assistance by making
beneficiary contribution compulsory. This is
important because ABCD focuses on mobilizing
existing resources, as opposed to continuously
injecting new resources to the community which
would be less sustainable and would lead to a
culture of dependency. Then in 2016, the
assistance provided was made more tailor-
made. The DDD can further facilitate ABCD by
prioritising project proposals that are centred
on utilizing the existing resources within the
Asset Based Community Development (ABCD) is a "strategy for sustainable communitydriven development. The appeal of ABCD lies in its premise that communities can drive thedevelopment process themselves by identifying and mobilizing existing, but oftenunrecognized assets, and thereby responding to and creating local economic opportunity." Ithas been identified as an innovative alternative to need-based approaches to developmentand relies on the existing strengths of communities instead of injecting external resources tothe community.
Thus, ABCD focuses on existing resources within a certain community and linking micro-assets to the macro environment, thereby ensuring social mobilization and sustainablecommunity development. ABCD recognizes five types of assets: individuals, associations,institutions, physical assets and, connections. Individuals are the residents in a communityand possess various skills. Associations are small informal groups of people who have cometogether around a common interest. Institutions are paid groups of people who areprofessionals and are structurally organized. Physical assets are assets such as land, building,space and funds. Connections are the relationships between people. ABCD builds on theseassets that are already found in the community and mobilizes the individuals, associationsand institutions to come together to build on their assets.
Source: www.abcdinstitue.org; Mathie, A. and G. Cunningham (2003), "From Clients to Citizens: Asset-Based Community Development as a Strategy for Community-Driven Development",Development in Practice, 13(5).
Box 9.2Asset Based Community Development (ABCD)
community, instead of simply providing
beneficiaries with financial assistance.
9.5 Divineguma Micro-finance ProgrammeThe Divineguma microfinance programme aims
at promoting savings habits among low-income
families and providing them with access to loan
facilities to enhance their investment potential
and support their income generation activities.
This programme is implemented through the
Divineguma banks; the banks also play an
important role in implementing the Divineguma
cash transfer and livelihood development
programmes.

STATE OF THE ECONOMY 2016
177
At the inception of the Divineguma programme
(then called the Samurdhi programme), the
benefits of its welfare component (cash stamps
and food stamps) were channelled via the
cooperative shops and the compulsory savings
were deposited at state banks like the Bank of
Ceylon and the People’s Bank. However, with
the establishment of the Samurdhi banks in the
late 1990s, these banks came to play a major
role in the implementation of the overall
Samurdhi/Divineguma programme. Currently,
the Divineguma monthly cash transfer is
directly transferred to the beneficiary’s bank
account at a Divineguma bank. The banks are
also involved in the selection of beneficiaries
for the livelihood development programme.
As shown in Figure 9.3, the structure of the
Divineguma community based banking system
is based on small groups (generally comprised
of five members) at the village level. In order to
be eligible for a loan from a Divineguma bank,
it is necessary to be a member of a small group
and have a group account at the Divineguma
bank. Village level societies are created from
all the small groups in a village. Currently there
are around 40,000 village level societies. These
societies fall under a Divineguma bank in the
area. The banks are managed by a manager
and a governing board (Palaka Mandalaya). In
a given Divisional Secretariat (DS) divisional
level, all the Divineguma banks fall under the
Divineguma Community Based Banking
Society of the DS division. At present, there are
331 such societies and 1,074 Divineguma
banks. At the distr ict level, the Distr ict
Divineguma Director oversees the Divineguma
programme while at the national level, the
Board of Management oversees the activities
of the banks and the banking societies.
Under the Divineguma microfinance
programme, low income families have access
to a range of loan products including
consumption loans, l ivelihood loans,
agriculture loans and housing loans. As shown
Figure 9.3Structure of the Divineguma Banking System
Source: Compiled by the IPS.
Divisional Level-Divineguma
Community Based Banking
Societies (331)
Divineguma Community
Based Banks (1,074)
Village Level Societies
Small Groups

STATE OF THE ECONOMY 2016
178
in Table 9.5, a bulk of the loans has been
granted for self-employment and livelihood
activities. Over 3.3 million loans with a total
value of Rs. 80 billion have been granted for
self-employment activities during 1998-2015.
This is followed by over 1.1 million loans for
consumption (with a value of Rs. 6 billion). The
number of housing loans granted, although
lower than the number of consumption loans,
amounts to around Rs, 20.5 billion during 1998-
2015.
In order to promote savings habits among low
income earning families, Divineguma banks
also offer various savings products to their
members and non-members from low income
groups. These include member deposits,
shares, non-member deposits, children's
deposits, deposits designed for female
members ('Diriyamatha'), group deposits,
compulsory savings, and deposits for school
children ('Sisuraka'). Currently, Divineguma
banks have over 4 million savers including
around 3.4 million members. Total savings of
the banks amounted to around Rs. 63 billion by
end of 2014. There were over 12 million bank
accounts in total, including 3.4 million member
deposits, 1.1 million children's savings accounts
Table 9.5Progress of Some of the Divineguma Credit Programmes 1998-2015
Type of loan From 1998 to 2015
No. of Loans Granted Financial Value (Rs. bn.)
Self-employment loans 3,386,475 80.03
Livelihood loans 191,146 4.44
Cultivation loans 886,544 11.96
Fishermen loans 15,616 0.33
Swa Shakthi loans 90,697 2.82
Divi Neguma Diriya Saviya loans 33,767 2.87
Consumer loans 1,108,384 6.36
Distress loans 140,275 0.48
Housing loans 460,037 20.56
Yovun Diriya loans 517 0.02
Jana Pubudu loans 377,625 11.50
Mihijaya loans 17,615 0.87
Kirula development loans 2,766 0.63
Rata Viruwo loans 12,105 3.65
Divi Neguma Sahana Aruna loans 313,057 6.37
Total 7,036,626 152.89
Source: Department of Divineguma Development, “Annual Progress Report 2015”.

STATE OF THE ECONOMY 2016
179
and 2.3 million compulsory savings accounts.
However, the compulsory savings (made of the
deductions from the cash transfer) account for
nearly 40 per cent of total savings of the
Divineguma banks.
The main source of funding for the Divineguma
banks is internal - i.e., savings deposits of their
members and non-members. The loans from a
Divineguma bank are primarily funded by the
bank's savings.6 A Divineguma bank can give
up to 80 per cent of the deposits held at the
bank as loans. If a bank exceeds the maximum,
it has the option of obtaining a loan from the
DDD. However, the salar ies and other
allowances of the permanent employees of
Divineguma banks are paid by the government
and are included under the budget of the DDD
(see Table 9.2).
Table 9.6Divineguma Savings Products as at 31.12.2014
Savings Product No. of A/Cs Amount (000')
Member deposits 3,452,413 14,445,613
Shares 3,676,389 8,499,497
Children’s deposits 1,155,734 2,461,307
Diriyamatha deposits 998,132 1,713,336
Non-member deposits 577,469 2,778,047
Group deposits 458,012 7,690,748
Compulsory savings 2,312,173 25,194,058
Sisuraka deposits 180,649 347,048
Total 12,810,971 63,129,654
Source: Department of Divineguma Development.
6 There are few exceptions such as the loans funded by the Livelihood Revolving Fund, created through government funds.
9.5.1 Addressing Weaknesses9.5.1 Addressing Weaknesses9.5.1 Addressing Weaknesses9.5.1 Addressing Weaknesses9.5.1 Addressing Weaknessesand Improving Efficiencyand Improving Efficiencyand Improving Efficiencyand Improving Efficiencyand Improving EfficiencyGiven the large number and volume of savings
deposits and loans of the Divineguma banks, it
can be argued that these banks have played
an important role in improving access to financial
services among low income groups, particularly
among females. Nevertheless, the Divineguma
banking system has a number of issues and
weaknesses that need to be addressed to
ensure its sustainability, protect the clients and
to ensure sustainable access to financial
services among low income groups.
Inadequate regulation and supervision of the
Divineguma banks is an issue of concern,
particularly given the large volume of savings it
has mobilized from low income groups. Until

STATE OF THE ECONOMY 2016
180
Value Capital on Treasury
(Rs. mn.)
9.6 Beyond Govern-ment Initiatives - CSRInitiatives for PovertyReductionSri Lanka's significant progress in poverty
reduction has been helped by overall economic
growth in the country, but various government
poverty reduction policies and programmes
have also contributed. Despite this,
approximately 1.3 million individuals are still
mired in poverty according to HIES 2012/13
estimates. Moreover, there are considerable
regional disparities and 'pockets of poverty' with
PHCR as high as 35-45 per cent in some
districts like Batticaloa and Mullaitivu.7
Lowlendingratesof theDivinegumabanks is aconcernthat affectstheir financialsustainability.
2013, the Samurdhi banking societies came
under the regulation of the Samurdhi Authority
of Sri Lanka (SASL), established under the
Samurdhi Authority of Sri Lanka Act No. 30 of
1995. Since the establishment of the DDD in
2014, a proper regulatory framework for
Divineguma banks is yet to be formed. Currently,
the Board of Management of the DDD oversees
the activities of the Divineguma banks but it
lacks regulatory powers.
Low lending rates of the Divineguma banks is a
concern that affects their financial sustainability.
The lending rates charged by the Divineguma
banks have decreased in recent years while
the interest paid for savings have not changed
significantly. For example, the lending rates
have dropped from around 12 per cent (reducing
balance) in 2013/14 to around 8 per cent, which
is relatively low compared to other microfinance
institutions in the country. However, the interest
rates for savings have remained around 5-7 per
cent, making it difficult for the banks to make a
profit. Moreover, introduction of ad-hoc loan
schemes by the government on concessionary
terms and conditions at times, also affects loan
repayments and the profitabil ity of the
Divineguma banks.
In addition, inadequate use of new technology
and lack of computerized systems in banks, and
inadequate training for bank staff and
Divineguma Development Officers on
microfinance principles, banking and
accountancy are other constraints to improving
the efficiency of the Divineguma banking
system.
7 DCS and CBSL, Annual Report 2015.

STATE OF THE ECONOMY 2016
181
There is room to improve the efficiency of
government poverty reduction programmes; the
targeting mechanism can be perfected to
ensure that all the poor and deserving
(including all these pockets of poverty) are
provided coverage. However, while improving
these, it is also important to explore
complementary sources of financing poverty
reduction and reaching pockets of poverty in
the country. One such viable option is to
mobilize private sector participation in poverty
reduction initiatives through encouraging and
directing the Corporate Social Responsibility
(CSR) related activities of private sector
organizations.
CSR can be defined as the continuing
commitment by businesses to behave ethically
and contribute to economic development while
improving the quality of life of the workforce
and their families as well as of the local
community and society at large.8
There is great untapped potential in using CSR
expenditure as a means of financing poverty
reduction in Sri Lanka. According to 2012
estimates, Rs. 4 billion are spent annually on
CSR through various avenues.9 However, this
money is spent on ad hoc projects carried out
by various organizations, prioritized at the
discretion of individual companies. Box 9.3
discusses two different initiatives undertaken
by John Keel's Holdings (JKH) and Ceylon
Biscuits Limited (CBL). These highlight the
potential of such initiatives to address pockets
of poverty.
The two projects highlighted here differ in terms
of their scale and the vision: The Munchee
Samaga Gamata Sarana project by CBL has
so far undertaken 92 infrastructure development
projects with the aim of helping the rural and
marginalized communities to meet their basic
needs; the Village Adoption project by JKH has
so far involved five villages with the aim of
providing an integrated plan for their
sustainable development.
However, both these projects are aimed at
contributing to community development via
community participation. Such initiatives
undertaken by private sector companies
illustrate the willingness of the private sector to
take part in national development and their
potential to contribute to the development of
pockets of poverty spread around the island.
There isgreatuntappedpotential inusing CSRexpenditureas a meansof financingpoverty re-duction inSri Lanka.
8 World Business Council for Sustainable Development, Stakeholder Dialogue on CSR, The Netherlands, Sept 6-8, 1998.9 Csrsrilanka.lk. (2016). CSR Sri Lanka (Gurantee) Limited. [online] Available at: http://www.csrsrilanka.lk/profile.php [Accessed
9 May 2016].

STATE OF THE ECONOMY 2016
182
Case Study 01: Village Adoption Project by John Keells Holdings (JKH)
This project, launched in 2005, is aimed at uplifting the lives and living standards of
disadvantaged persons and groups by empowering them to build and develop themselves
and their communities in a sustainable and entrepreneurial manner. For this project, JKH has
adopted an integrated development scheme asserting that developing just one aspect of a
poor community is insufficient to ensure sustainable development as the causes of poverty
are interlinked. For example, low employment is linked to low levels of education, so simply
improving income generation activities will not be adequate to pull the village out of poverty
in the long run. As such, the project includes facilitating access to basic needs like water and
sanitation, as well as providing electricity and educational infrastructure facilities, and
developing sustainable and diversified livelihoods to improve income generation, while also
conducting gender and youth empowerment activities.
JKH takes a tailor-made approach to the development of each adopted village. The scope of
the village adoption project (in terms of the number of villages) is deliberately kept limited to
prevent finances and attention given to each village from being diluted. The choice of village
to be adopted is subject to such considerations as the ground level presence of JKH and the
capacity of JKH employees to volunteer their own time for such projects. Currently five villages
have been adopted under this project: Halmillewa (Anuradhapura district), Mangalagama
(Ampara district), Iranaipalai (Mullaitivu district), Puthumathalan (Mullaitivu district) and
Morawewa North (Trincomalee district).
Case Study 02: Munchee Samaga Gamata Sarana by Ceylon Biscuits Limited (CBL)
The CBL initiative, launched in 2006, aims at identifying marginalized areas of the country
and assisting those communities in meeting their basic needs via village infrastructural
development. CBL emphasizes the importance of community participation in carrying out
these projects and requires the villagers to participate in the projects carried out for the
development of the village. Under Munchee Samaga Gamata Sarana, mainly infrastructure
related projects are undertaken. The projects (i.e., villages) are identified based on the
information gathered by the CBL field personnel who are spread all around the country. The
scope of these infrastructure development projects are subject to time and cost concerns as
the CBL employees work on them on a voluntary basis. The villages are provided assistance
based on their requirements. Projects vary from the construction of mini-bridges, suspension
bridges, roads, community facilities and health facilities, most of which are also maintained
by CBL to ensure sustainability. The 92 projects carried out thus far have directly benefitted
over 100,000 Sri Lankans at a cost of around Rs. 30 million.
Source: Interviews with JKH and CBL/Annual Reports.
Box 9.3CSR Initiatives for Poverty Reduction and Community Development

STATE OF THE ECONOMY 2016
183
In such a context, it is important to explore the
potential of mobilizing private sector
participation in poverty reduction via CSR. To
this end, an important initiative was undertaken
in 2013 with the encouragement of United
States Agency for International Development
(USAID) which resulted in the establishment of
CSR Lanka (Guaranteed) Limited. This is an
initiative piloted and managed collectively by a
group of private sector companies in Sri Lanka
with the aim of providing strategic guidance and
necessary resources to bridge the gap between
ad hoc CSR projects and creating sustainable
value. A key factor for its coming together is a
belief that a majority of companies would like
to put in more effort in relation to CSR and are
willing to obtain services from a third party for
CSR development.
Currently, the CSR related activities of the private
sector are not aligned with national priorities
nor are they particularly encouraged by the Sri
Lankan government. These issues need to be
addressed in order to fully utilize the potential
of CSR activities to reduce poverty. Box 9.4
discusses in detail the CSR model adopted by
With the introduction of the Company Act 2013, India became the first country in the world tolegally compel companies to undertake CSR initiatives: every company with an annual turnoverexceeding US$ 161 million or a net worth of over US$ 80 million or a net profit over US$800,000 are legally obliged to spend at least 2 per cent of their average net profit over thethree previous years on CSR activities.
This is a rather controversial policy initiative which sparked global debate about the nature ofCSR. It has been portrayed as a backward step for India, one that is incapable of promotinggenuine business responsibility and societal trust in business. The policy has been furthercriticised as one that treats the corporate sector as wealthy contributors and expects them tobe partners in ensuring equality in income distribution instead of seeing corporations aseconomic powerhouses who are responsible for their impact on a large number of stakeholdersand thus should be mindful of this impact throughout the course of their business operations(and not simply by allocating a portion of their profits after it is earned).
As such, the applicability of a similar policy measure in Sri Lanka is debatable. However,there are certain other components of the Indian CSR model that could be beneficial in termsof improving the state of CSR in Sri Lanka. One such policy measure is that the Indiangovernment has clearly stated the areas where the private sector should focus their energy.Many Sri Lankan private sector companies interviewed are of the opinion that it would bevery helpful if the government could guide them by identifying the areas/sectors which are inneed of development. Additionally, the Indian CSR policy necessitates the establishment of aCSR committee in every eligible company to guide and monitor the company's CSR policy.Even without adopting a mandatory CSR policy, the government could encourage Sri Lankancompanies to set up such CSR committees for more effective outcomes.
Source: Singh, A. and Verma, P. (2014), "CSR@ 2%: A New Model of Corporate Social Responsibility inIndia", International Journal of Academic Research in Business and Social Sciences, 4(10);Maira, A. (2013), "India's 2% CSR Law: The First Country to Go Backwards", Economic &Political Weekly, 48(38); Venkatesan, R. (2013), "Ordering Corporate Responsibility: A MisplacesFaith?", Economic & Political Weekly, 48(38).
Box 9.4India's Mandatory CSR Model
STATE OF THE ECONOMY 2016
184
10 Based on interviews with various private sector organizations.
the Indian government whereby all companies
are legally compelled to spend a defined
percentage of their profit on CSR activities. This
is the first and only mandatory CSR model in
the world and has led to much debate; its
applicability in Sri Lanka is debatable.
However, it does suggest that there is scope for
Sri Lanka to take a more proactive stance
towards encouraging CSR. Many private sector
organizations would welcome direction and
guidance from the government in identifying
the areas in need of development.10
There is much that could be done to improve
the existing government initiatives to achieve
the goal of poverty eradication. Nevertheless,
while improving government programmes it is
also important to appreciate the potential of the
private sector to contribute to the national
development agenda and address pockets of
poverty which seem impervious to the national
level policies of the government.
9.7 ConclusionGovernment expenditure related to poverty and
vulnerability, especially the transfers and
subsidies have shown an increase in recent
years. The cost of the Divineguma/ Samurdhi
programme in particular is substantial. Despite
its operations for two decades and considerable
coverage of population, the Divineguma
programme and its key components, namely
the welfare, l ivelihood and microfinance
components have many weaknesses.
Currently, over 75 per cent of the total budget of
the DDD is spent on the cash transfer
programme, the cost of which has increased
substantially in recent years. Although Sri
Lanka's poverty level has declined significantly
in recent years, with the percentage of the poor
households falling to 5.3 per cent (and the
poverty headcount ratio to 6.7 per cent in 2012/
13), the number of cash transfer recipients has
not reduced significantly over the years.
Moreover, substantial targeting errors continue
to persist with a notable share of the poor being
excluded from the programme. In this context, it
is pivotal to revisit the Divineguma programme
to assess the right balance between its key
components and improve its efficiency.
It is important to limit the coverage of the cash
transfer programme to the most needy
households (e.g., poor or extreme poor with no
other income source, with special attention to
families with disabled persons and more
dependents like small children and elderly) with
some mechanism to absorb those who fall in to
poverty due to various shocks. While this would
help reduce the cost of the cash transfer
programme substantially, it is important to put
more emphasis on the livelihood development
and microfinance components of the
Divineguma programme, which will assist low
income households to improve their income
generating activities and thereby increase their
income in the long run. This in turn will help
them to earn a sufficient income to fulfil their
consumption needs, without having to depend
on the government monthly cash transfer. It is
imperative for the Divineguma programme to
have the right balance between safety nets (like
cash transfers) and safety ropes (e.g., livelihood
support and access to finance) in order to
alleviate poverty and to reduce the strain on
the government budget.

STATE OF THE ECONOMY 2016
185
It is pivotalto revisit theDivinegumaprogrammeto assessthe rightbalance be-tween itskey compo-nents andimprove itsefficiency.
While improving the efficiency in the design and
focus of the Divineguma programme, it is also
important to find ways to mobilize resources to
finance its different components like
microfinance and livelihood programmes, in the
form of beneficiary contributions, savings, etc.
This is key to ensure sustainability of
government initiatives to alleviate poverty in the
country.
Moreover, while improving the existing
government poverty reduction programmes, it
is vital to explore alternative ways of addressing
poverty and vulnerability and reach pockets of
pover ty, without fur ther pressure on the
government budget. A complementary
mechanism would be to encourage private
sector participation in poverty reduction through
CSR activities. However it is crucial that the
private sector initiatives are aligned with
national priorities/ national agendas to fully
utilize the potential of the private sector to
reduce Sri Lanka's poverty and vulnerability.