sri lanka exports up 9.4-pct in april, imports down 5.3-pct
DESCRIPTION
Sri Lanka exports up 9.4-pct in April, imports down 5.3-pctTRANSCRIPT

1
Communications Department 30, Janadhipathi Mawatha, Colombo 01, Sri Lanka.
Tel : 2477424, 2477423, 2477311
Fax: 2346257, 2477739
E-mail: [email protected], [email protected]
Web: www.cbsl.gov.lk
Press Release Issued By
Date 20.06.2014
External Sector Performance – April 2014
Overview
Sri Lanka’s external sector strengthened further in April 2014, with continued
foreign currency inflows in the form of earnings from exports, tourism, workers’
remittances, as well as inflows to the financial account. The trade deficit continued to
narrow during the first four months of 2014 as a result of healthy growth in exports.
The contraction of the trade deficit and higher inflows to services and income
accounts contributed to reducing the current account deficit. These developments,
together with inflows to the financial account have resulted in a higher surplus in
the BOP by end April 2014, compared to the corresponding period of 2013.
Trade Account of the BOP
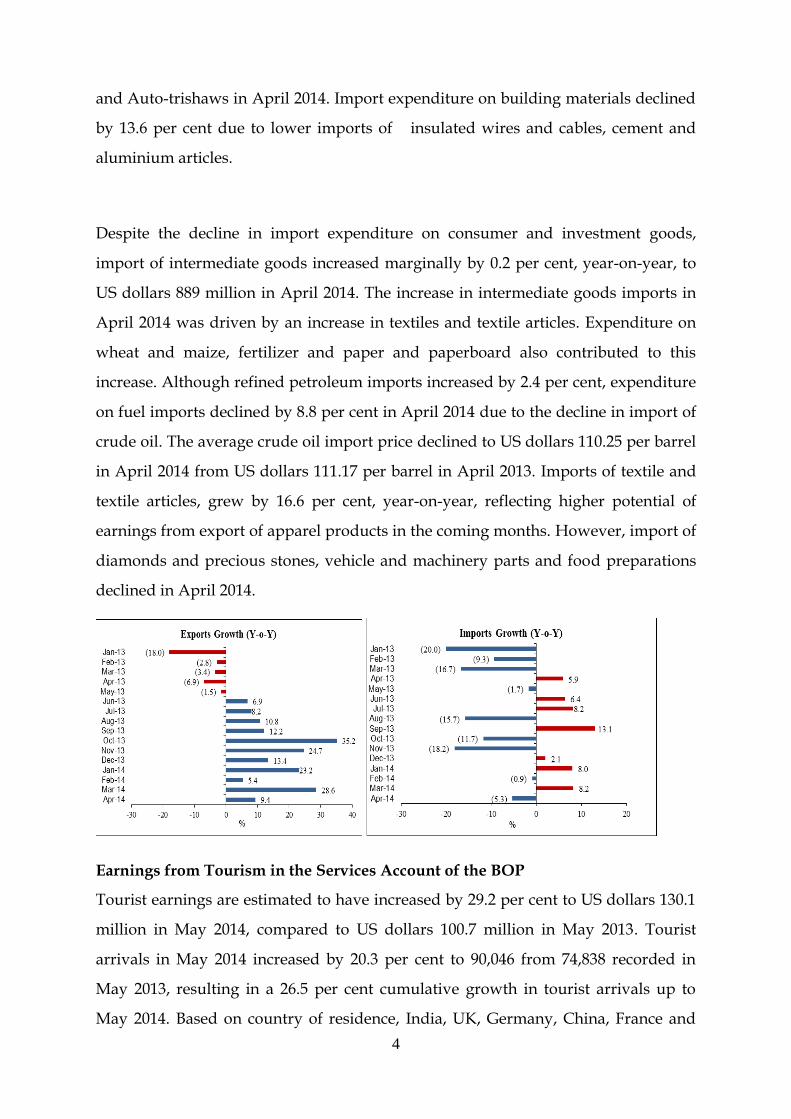
On a year-on-year basis, earnings from exports in April 2014 increased by 9.4 per
cent to US dollars 762 million, while expenditure on imports declined by 5.3 per cent
to US dollars 1,444 million. Accordingly, the trade deficit contracted by 17.7 per cent
to US dollars 682 million. The cumulative trade deficit for the first four months of
2014 contracted by 12.1 per cent, as the growth in export earnings of 16.9 per cent
outpaced the 2.6 per cent increase in import expenditure.
Economic Research Department
24.04.2014
2
Export Performance
The growth in earnings from exports was led by improved performance in industrial
exports which grew by 8 per cent, year-on-year, in April 2014 to US dollars 559
million. Industrial exports led by the earnings from export of textiles and garments,
increased by 22.5 per cent, contributing 94 per cent to the total increase in exports.
Industrial exports accounted for more than 73 per cent of total exports. During the
month, earnings from export of garments to the EU and to the USA increased by 22.3
per cent and 21.2 per cent, respectively, while a notable increase of 50.5 per cent was
observed in export of garments to non-traditional markets such as China, Hong
Kong, Japan and Russia reflecting further diversification of export markets. Earnings
from the export of machinery and mechanical appliances and leather products also
contributed to the growth in exports of industrial products. Exports of machinery
and mechanical appliances, comprising of electrical and electronic equipment such
as transformers, static converters, accumulators and home appliances, increased by
20.7 per cent while exports of leather products increased by 86.6 per cent owing to a
more than two fold increase in footwear exports. On the other hand, the export of
petroleum products, gems, diamonds and jewellery, transport equipment declined
in April 2014.
Healthy performance in tea and coconut product exports mainly contributed to the
growth in agricultural exports by 13.7 per cent to US dollars 200 million. Export
earnings from tea increased by 9.8 per cent to US dollars 117 million as a result of the
increase in both the price and volume of tea exported. The average export price of
tea increased by 2.8 per cent, to US dollars 5.01 per kg in April 2014 from US dollars
4.87 per kg in April 2013, while export volumes increased by 6.8 per cent, year-on-
year. Earnings from coconut product exports increased by 66.1 per cent to US dollars
24 million, due to improved performance in both kernel and non-kernel coconut
products in terms of both price and volume. Export earnings from minor agricultural
products and vegetables also increased significantly by 106.3 per cent and 134.3 per
cent, respectively, in April 2014. However, earnings from export of spices declined

3
by 37.3 per cent, mainly due to the decline in export of pepper, cinnamon and cloves,
owing to unavailability of stocks during the non-harvesting period. Further,
earnings from rubber exports declined by 17.5 per cent, year-on-year, in April 2014,
due to significant declines in both export volumes and prices.
Import Performance
Expenditure on imports declined in April 2014 driven by reductions in both
consumer and investment goods. Expenditure on consumer good imports declined
by 3.2 per cent in April 2014, reflecting a decline in expenditure on most of food
categories. With respect to food imports, import expenditure on sugar and
confectionery and vegetables declined significantly. Import expenditure on sugar
and confectionery declined by 52.2 per cent mainly due to significant decline in
sugar prices in the international market owing to large global supplies. Meanwhile,
import expenditure on vegetables declined by 12.6 per cent due to lower imports of
onions and leguminous vegetables. However, expenditure on cereals and milling
industry products and dairy products increased in April 2014 due to significant
domestic demand. Imports of non-food consumer goods, increased by 6.3 per cent,
mainly due to the significant increase in clothing and accessories imports by 72.7 per
cent to US dollars 22 million. Further, expenditure on personal motor vehicle
imports increased by 15.8 per cent in April 2014 to US dollars 48 million.
Expenditure on telecommunication devices and rubber products also increased.
However, home appliances, household and furniture items and medical and
pharmaceuticals declined in April 2014.
Expenditure on imports of investment goods declined by 20.4 per cent, to US dollars
289 million in April 2014, mainly due to the decline in all major categories in
investment goods. Expenditure on machinery and equipment imports declined by
17.7 per cent, due to the decline in import of textile industry machinery, electric
motors and generating sets and office machines. Transport equipment declined by
42.1 per cent due to a reduction in import of almost all sub categories except buses
4
and Auto-trishaws in April 2014. Import expenditure on building materials declined
by 13.6 per cent due to lower imports of insulated wires and cables, cement and
aluminium articles.
Despite the decline in import expenditure on consumer and investment goods,
import of intermediate goods increased marginally by 0.2 per cent, year-on-year, to
US dollars 889 million in April 2014. The increase in intermediate goods imports in
April 2014 was driven by an increase in textiles and textile articles. Expenditure on
wheat and maize, fertilizer and paper and paperboard also contributed to this
increase. Although refined petroleum imports increased by 2.4 per cent, expenditure
on fuel imports declined by 8.8 per cent in April 2014 due to the decline in import of
crude oil. The average crude oil import price declined to US dollars 110.25 per barrel
in April 2014 from US dollars 111.17 per barrel in April 2013. Imports of textile and
textile articles, grew by 16.6 per cent, year-on-year, reflecting higher potential of
earnings from export of apparel products in the coming months. However, import of
diamonds and precious stones, vehicle and machinery parts and food preparations
declined in April 2014.
Earnings from Tourism in the Services Account of the BOP
Tourist earnings are estimated to have increased by 29.2 per cent to US dollars 130.1
million in May 2014, compared to US dollars 100.7 million in May 2013. Tourist
arrivals in May 2014 increased by 20.3 per cent to 90,046 from 74,838 recorded in
May 2013, resulting in a 26.5 per cent cumulative growth in tourist arrivals up to
May 2014. Based on country of residence, India, UK, Germany, China, France and

5
Russia account for over 50 per cent of total tourist arrivals. With the end of the peak
tourist season from November to April, tourist arrivals are expected to be lower
from May onwards, albeit remaining above the levels recorded in the corresponding
period of the previous year.
Current Transfers in the BOP
Workers’ remittances grew moderately by 7.5 per cent to US dollars 554 million
during April 2014, compared to US dollars 515 million recorded in April 2013. On a
cumulative basis, workers’ remittances during first four months of this year grew by
11.0 per cent to US dollars 2,217.4 million from US dollars 1,998.4 million in the
corresponding period in 2013, with the contribution of the highest ever inflows being
recorded in March, which traditionally attracts higher inflows prior to the New Year
festivals.
Financial Account of the BOP
Long term loans obtained by the government during the first four months of 2014
amounted to US dollars 734.6 million, compared to US dollars 543.1 million recorded
during the corresponding period in 2013. Net cumulative inflows to the government
securities market other than international sovereign bonds during January to April
2014 amounted to US dollars 180.5 million. Sri Lanka has successfully launched two
issuances of international sovereign bonds amounting to US dollars 1.5 billion, with
the latest of US dollars 500 million issued in April 2014 at a yield of 5.125 per cent
per annum, the lowest US dollar benchmark offering of international sovereign
bonds. Meanwhile, the Colombo Stock Exchange (CSE) recorded a net foreign
investment outflow of US dollars 2.6 million in April 2014. Foreign direct
investments, including foreign loans to BOI companies, for the first quarter of 2014
amounted to US dollars 442 million, compared to US dollars 219 million received
during the corresponding period of 2013. Major inflows were to the aviation, ports,
telecommunications and mixed development projects.

6
Overall BOP Position
High inflows to the current account, issuance of international sovereign bonds and
other inflows to the financial account during the first four months of the year have
resulted in the overall BOP recording a significant surplus of US dollars 1,544.6
million compared to a surplus of US dollars 352.5 million recorded during the
corresponding period of 2013.
International Reserve Position
Sri Lanka’s gross official reserves amounted to US dollars 8.9 billion by end April
2014, while total international reserves, which include foreign assets of the banking
sector, amounted to US dollars 10.2 billion. In terms of months of imports, gross
official reserves and total reserves were equivalent to 5.9 and 6.8 months of imports,
respectively, at end April 2014. The levels of reserves were maintained significantly
above the international standard benchmark of 3 months of imports throughout the
year so far, despite outflows on account of foreign debt service payments, and IMF-
SBA payment.
Exchange Rate Behaviour
The rupee has remained relatively stable against the US dollar marginally
appreciating by 0.40 per cent during the year up to 19 June 2014. Based on cross
currency exchange rate movements, the Sri Lanka rupee has appreciated against
several other major international currencies such as the euro by 1.97 per cent and the
Chinese renminbi by 3.12 per cent, while depreciating against the pound sterling by
2.59 per cent, the Japanese yen by 2.49 per cent and the Indian rupee by 2.39 per cent.

7
Table 1. A Summary of External Sector Performance – January - April 2014 (a)
Category
April 2013
US$ mn
April 2014
US$ mn
Growth April
(%)
Jan-Apr 2013
US$ mn
Jan- Apr 2014
US$ mn
Growth Jan- Apr
(%)
Exports 696.5 762.2 9.4 3,054.9 3,571.1 16.9
Of which
Agricultural Products 175.6 199.7 13.7 726.8 860.8 18.4
of which, Tea
106.4 116.8 9.8 440.0 503.8 14.5
Industrial Products 517.9 559.5 8.0 2,318.1 2,666.2 15.0
of which, Textiles and Garments
275.0 336.8 22.5 1,325.0 1,601.6 20.9
Rubber Products 58.2 57.9 -0.6 260.1 282.3 8.5
Food, Beverages and Tobacco 16.8 18.6 10.5 69.6 98.8 41.9
Mineral Products 1.9 1.9 0.2 6.0 39.5 562.7
Imports 1,525.6 1,444.5 -5.3 6,035.9 6,192.4 2.6
Of which
Consumer Goods 272.7 263.9 -3.2 983.9 1,044.3 6.1
of which, Food and Beverages 126.8 108.8 -14.2 456.9 446.7 -2.2
Other Consumer Goods 145.9 155.1 6.3 527.1 597.6 13.4
Intermediate Goods 887.9 889.3 0.2 3,528.3 3,872.6 9.8
of which, Fuel 347.0 316.3 -8.8 1,440.9 1,761.7 22.3
Textiles and Textile Articles 154.1 179.8 16.6 650.4 708.0 8.9
Investment Goods 363.4 289.2 -20.4 1,520.0 1,271.1 -16.4
of which, Machinery and Equipment 186.5 153.5 -17.7 778.7 700.8 -10.0
Transport Equipment 60.3 34.9 -42.1 247.9 163.6 -34.0
Building Materials 116.3 100.5 -13.6 491.8 405.7 -17.5
Deficit in the Trade Account -829.0 -682.2 -17.7 -2,980.9 -2,621.3 -12.1
Workers’ Remittances 515.3(b) 554.0 7.5 1,998.4 2,217.4 11.0
Earnings from Tourism 108.7(b) 162.7 49.8 563.2 771.7 37.0
Portfolio Investments (Net) 27.7 -2.6 72.2 -50.7
Inflows to the Government (c) 246.2 776.2 215.3 2,132.1 3,022.1 41.7
of which,
Treasury Bills and Bonds 144.9 212.3 46.5 1,581.9 782.1 -50.6
International Sovereign Bonds 500.0 1,500.0
Long term Loans 99.7 63.0 -36.8 543.1 734.6 35.3
Foreign Direct Investment (d) 442.3 219.0
(a) Provisional (b) Revised (c) Inflows to the government include capital and current transfers to the government, inflows from the
sale of Treasury bills and Treasury bonds, International Sovereign Bonds and long-term loans of the government.
(d) Data available for the 1st quarter of each period and includes foreign loans to BOI companies.