srate of utah no. hydroi.mic remnnaissance …data collection for this study included a canplter and...
TRANSCRIPT
srATE OF UTAHDEPAR'IMENI' OF NATURAL RESClJRCES
Technical Publication No. 96
HYDROI.mIC REmNNAISSANCE OF
'IRE SEVIER LAKE AREA,
WEsr-eENIRAL UTAH
By
Dale E. Wilberg
Prepared by theUni ted States Geological SUrvey
in cooperation with theUtah Deparbnent of Natural Resources
Division of Water Rights

CCNl'ENI'S
AbstractIntroduction
Purp:>se, scope, and method of studyAcknowledgments •••••.••...•••.•.•.•.Numbering system for hydrologic-data sitesGeographic settingClirratevegetationGeologic setting
Hydrology .•.•.•••.•••Surface-water resources
Sevier RiverEPherreral streamsSevier Lake ..•.•.O1anical quaE ty
Ground-water resourcesConsolidated rocks
OCCUrrenceRechargeMovanentDischargeAquifer characteristics
Basin fillOCCUrrenceRechargeMovanentDischargeTransmissivity ••
O1anical quali tyTanperatureDissolved solidsWater composition
Approximation of ground-water budget componentsStJ.rR'nary ••.•..••..References cited
ILWsrRATICNS
Page
112244779
1111111314151922222222232323252529293132323233333538
Utah,clirratic
Figure 1.
2.
3.
Map showing geographic features of west-centrallocation of the Sevier Lake area, location ofstations, aoo selected laoo-surface altitudes ••••••
Diagram showing numbering system for hydrologic-datasites in utah
Map showing location of the local Sevier Lakedrainage basin and other selected features wi thinthe interior drainage of the Great Basin •••••••••••
iii
3
5
6
ILLUS'IRATIO~-eontinued
Page
Figure 4. Grams shCMing nonnal monthly precipitation for sevenclimatic stations near the sevier Lake area, 1951-80 8
5. Block diagram showing generalized geomorphic setting,structural framework, and relation betweenconsolidated rocks and basin-fill deposits in theSevier l.iike area Cl • • • • • • • • • • • 10
6. Map showing location of hydrologic-data sites in andadjacent to the Sevier Lake area .............•..... 12
7. Hydrograph shCMing rrean annual discharge of SevierRiver at Deseret or Oasis, 1913-87 ••••...••••••.•.• 13
8. Hydrograph sho,ving altitude of sevier Lake level,1982-88 18
9. Block diagram showing local, intennediate, andr~ioI'la.l fl~ systerrs ............•.•..•...•..•••••. 19
10. Block diagram showing generalized local and regionalflow system of the sevier Lake area ........•.••.•.. 21
11. Map showing location of wells in the sevier Lake areaand altitude of hydraulic heads ..•........••••.•.•. 26
12. Diagram showing awroximated water-budget c~nentsof the ground~ater system ...•.•.....•....•......•. 34
TABLES
Table 1. selected climatic data for seven climatic stationsnear the study area, 1951-80 ....•......•••...•.••.•. 9
2. O1emical analyses of water from selected wells,springs, and surface~ater sites ..•......•..•••••... 16
3. Lake levels, brine density, dissolved concentration ofmajor constituents, and salinity of sevier Lake franJanuary 1987 to July 1988; Great Salt Lake duringJune 1987; and the average cClllp)si tion of seawater .• 20
4. Aquifer characteristics of consolidated rocks in theBasin and Range province, southwestern United States 24
5. water levels, density, SLnU of constituents, altitude ofhydraulic head, and altitude of equivalent freshwaterhydraulic head for wells in the sevier Lake area .•.• 27
6. Estimated average annual precipitation and ground-waterrecharge to basin-fill deposits and consolidatedrocks in the Sevier Lake area 28
7. Drillers' lithologic logs of selected wells ........•.. 418. Records of selected wells, springs, and surface-water
si tes 47
iv

CDNVERSICN FAC'IORS, ABBREVIATED WATER-{}JALITY UNITS,
AND VERI'ICAL D~
Rlltiply
acreacre-footcubic foot per secondfoot squared per daylfootfoot per dayfoot per milefoot per footfoot per yeargallon per minuteind1
milesquare mile
By
4,0471,233
0.028320.09290.30480.30480.18940.30480.30480.06308
25.40.02541.6092.59
'lb obtain
square metercubic rretercubic rreter per seoooorreter squared per dayrreterrreter per dayrreter per kiloneterrreter per rreterrreter per yearliter per seoooomillimeterrreterkilaretersquare kilometer
Water temperature is given in degrees Celsius (OC) and air temperature isgiven in degrees Fahrenheit (OF). The conversion formulas are:
°C = 0.56 (OF - 32)
OF = 1.8 (OC) + 32.
Chemical ooncentration and water temperature are given only in metricunits. Chemical concentration is given in milligrams per liter (rng/L) ormicrograms per liter (l-lg/L). MilligranE per liter is a unit expressing thesolute per unit volurre (liter) of water. Q1e thousaoo micrograms per liter isequivalent to 1 milligram per liter. For concentrations less than 7,000milligrams per liter, the numerical value is about the same as forconcentrations in parts per million. Specific conductance is given inmicrosierrens per centirreter (l.l.S/an) at 25 degrees Celsius.
IAn alternative way of expressing transmissivity is cubic foot per dayper square foot, per foot of aquifer thickness.
v

Classification of Natural Water
[After Feltis, 1966, p. 8; fram RObinove and others, 1958, p. 3]
Class Dissolved-solidsconcentrations
(rrUlligrams per liter)
Specific conductance(rnicrosienens per centimeter
at 25 ocelsius)
Fresh 0 to 1,000
Slightly saline 1,000 to 3,000
Moderately saline 3,000 to 10,000
Very saline 10,000 to 35,000
Briny Greater than 35,000
o to 1,400
1,400 to 4,000
4,000 to 14,000
14,000 to 50,000
Greater than 50,000
sea level: In this rePOrt, "sea level" refers to the National GeodeticVertical Datwn of 1929--a geodetic datwn derived fram a general adjustment ofthe first-order level nets of the United States and Canada, formerly calledsea Level ratwn of 1929.
Vl
HYIROLCXnC RElXNNPJSSAOCE OF THE SEVIER IAKE AREA,
WEsr-eENIRAL UTAH
By Dale E. Wilberg
u.S. Geological Survey
ABS'IRJlCT
The hydrologic system of the Sevier Lake area, at the terminus of thesevier Lake drainage basin in west-central Utah, was studied during 1987-88 todetermine baseline hydrologic conditions prior to anticipated development.sevier Lake was reestablished during 1983-87 on the normally dry playa as aresult of record volumes of surface-water runoff, but the lake was recedingduring the study. In June 1985, the lake reached a maxinurn depth of about 13feet, with a water-surface altitude of 4,527 feet above sea level.
The basin-fill aquifer includes a coarse-grained facies at higheraltitudes of the alluvial slopes,and a fine-grained facies at lower altitudesarourrl sevier lake. Water levels indicate a potential for lateral groundwater IIOverrent away fran the lake and toward the northwest, west, and south.
Transmissivity of the coarse-grained facies, determined from one well,was 4,120 feet squared per day. Transmissivity values for the fine-grainedfacies ranged fran 1 X 10⁻³ to 5 X 10⁻² foot squared per day, determined fromslug tests of shallow wells near the shoreline of the lake, and 5.2 feetsquared per day determined from a well in the lakebed.
The pr~nant constituents of water sampJed in the sevier Lake area aresodium, sulfate, and chloride. '!he ooncentration of dissolved solids rangesfran 480 to 120,000 milligrams per liter. Smaller concentrations of dissolvedsolids were determined for water from wells completed in the coarse-grainedfacies, and larger concentrations were determined for water from wellscompleted in the fine-grained facies.
INI'ROCUcrION
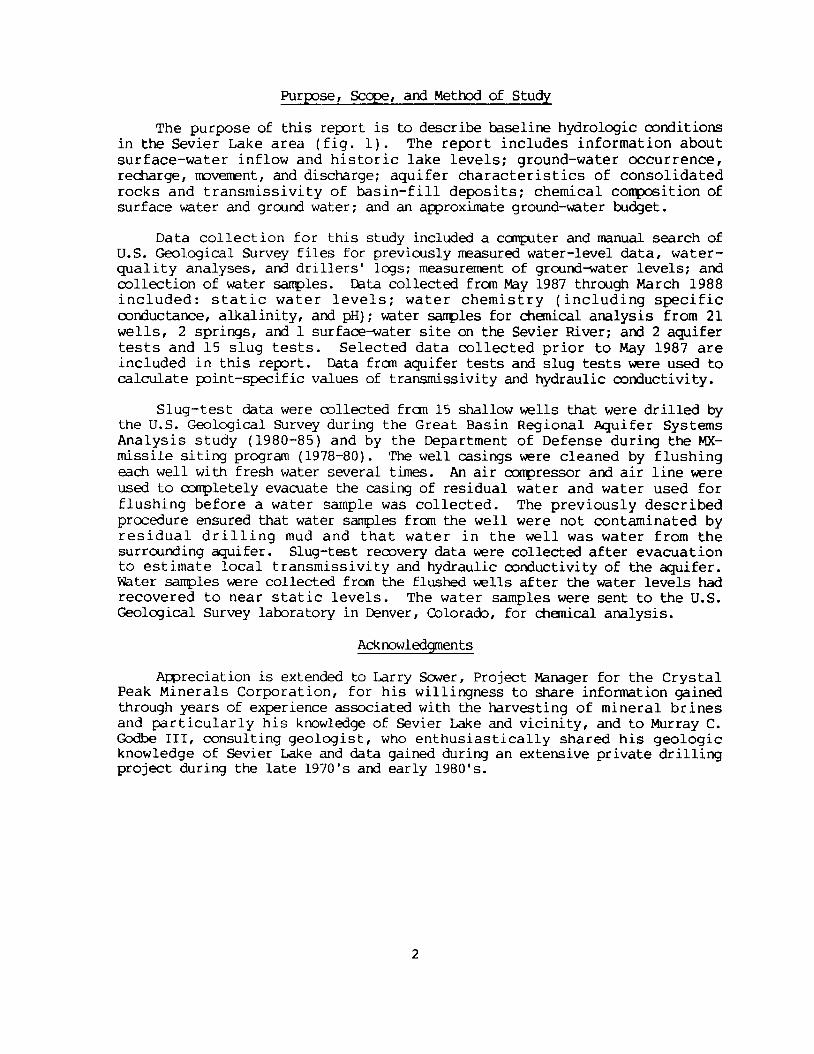
Sevier Lake is about 35 miles southwest of Delta and about 25 milesnorthwest of Milford, in west-central Utah (fig. 1). '!he water resources ofthe sevier Lake area, which is defined by the local drainage basin in theimmediate vicinity of ephemeral Sevier lake, were assessed by the U.S.Geological Survey (US:;S), in cooperation with the utah Department of NaturalResources, Division of Water Rights, as part of a continuing program todescribe the availability and quality of water within the State. '!he need fora water-resources assessment to establish baseline hydrologic oonditions priorto potential mineral or industrial develcprent is apparent from the lack ofprevious hydrologic studies for the area. 'Ihe infonnation provided in thisstudy will allow land, water, mineral, and industrial managers to betterunderstarrl the water resources of the area.
1
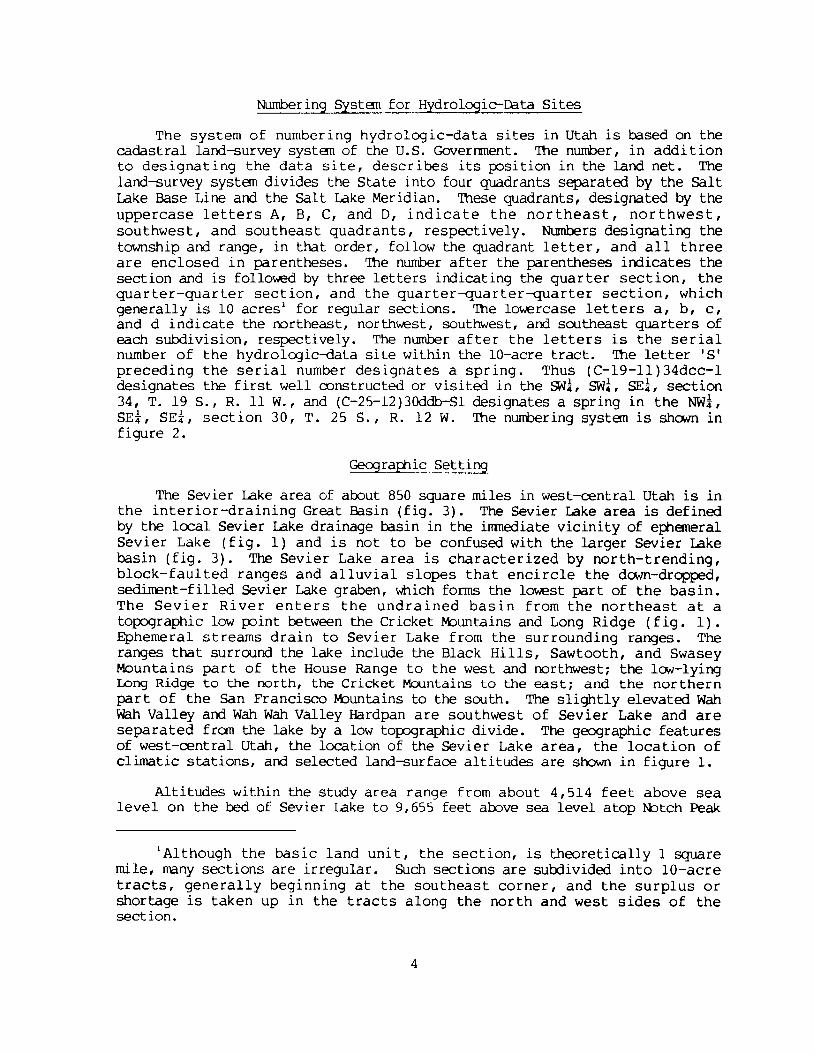
Purp?se, SCope, and Method of Study
The purpose of this rep?rt is to describe ba.seline hydrologic oonditionsin the Sevier Lake area (fig. 1). The report includes information aboutsurface-water inflow and historic lake levels; ground-water occurrence,recharge, movement, and discharge; aquifer characteristics of consolidatedrocks and transmissivity of basin-fill deposits; chemical composition ofsurface water and ground water; and an awroximate ground-water budget.
Data collection for this study included a canplter and manual search ofU.S. Geological SUrvey files for previously rreasured water-level data, waterquality analyses, and drillers' logs; measurement of ground-water levels; andoollection of water sarrples. ~ta collected from May 1987 through March 1988included: static water levels; water chemistry (including specificoonductance, alkalinity, and pH); water sarrples for dlenical analysis from 21wells, 2 springs, and 1 surface-water site on the Sevier River; and 2 aquifertests and 15 slug tests. Selected data collected prior to May 1987 areincluded in this rep?rt. Data fran aquifer tests and slug tests were used tocalculate point-specific values of transmissivity and hydraulic oonductivity.
Slug-test data were oollected fran 15 shallow wells that were drilled bythe U.s. Geological SUrvey during the Great Basin Regional Aquifer SystemsAnalysis study (1980-85) and by the Department of Defense during the MXmissile siting program (1978-80). The well casings were cleaned by flushingeach well with fresh water several times. An air corrpressor and air line wereused to corrpletely evacuate the casing of residual water and water used forflushing before a water sample was collected. The previously describedprocedure ensured that water samples from the well were not contaminated byresidual drilling mud and that water in the well was water from thesurrounding aquifer. Slug-test reoovery data were collected after evacuationto estimate local transmissivity and hydraulic oonductivity of the aquifer.water sarrples were collected from the flushed wells after the water levels hadrecovered to near static levels. The water samples were sent to the U.S.Geological Survey laboratory in Denver, Colorado, for chemical analysis.
Acknowledgments
Appreciation is extended to Larry Sower, Project Manager for the CrystalPeak Minerals Corporation, for his willingness to share information gainedthrough years of experience associated with the harvesting of mineral brinesand particularly his knowledge of sevier Lake and vicinity, and to Murray C.Godbe III, consulting geologist, who enthusiastically shared his geologicknowledge of sevier Lake and data gained during an extensive private drillingproject during the late 1970's and early 1980's.
2
T.14S.
T.15S.
T.20S.
T.22S.
T.21
Jacobs Well 0 S.
\ Fumarole utle
R. 12 W.
R.7 WI10 /20 MILES1----..1_--IIL-..."r-- ...JI
10 20 KILOMETERS
NUMBER IS ALTITUDE OF LANDSURFACE, IN FEET ABOVE SEA LEVEL
EXPLANATION• CLIMATIC STATION
4,518
I~
Sawtooth •......--Peak--
IR. 19 W. R. 18 W.
Partoun..--~----r-WP--~--,--~-~ -----
Great~a t LiJke D sert
38 0 45/- t--Lr+---J~~--f----I----=.o.~·-+-_'1'!"!.--1-"=::""'-.,.d----T!--A-.-.,.J~ii;L+-j:>--1+-----=-'-'-tt--j------,fFf---T~:-;?"'--f-
."
Figu re 1.--Geographic featu res of west-central Utah, location of the Sevier Lake area, locationof climatic stations, and selected land-surface altitudes.
3
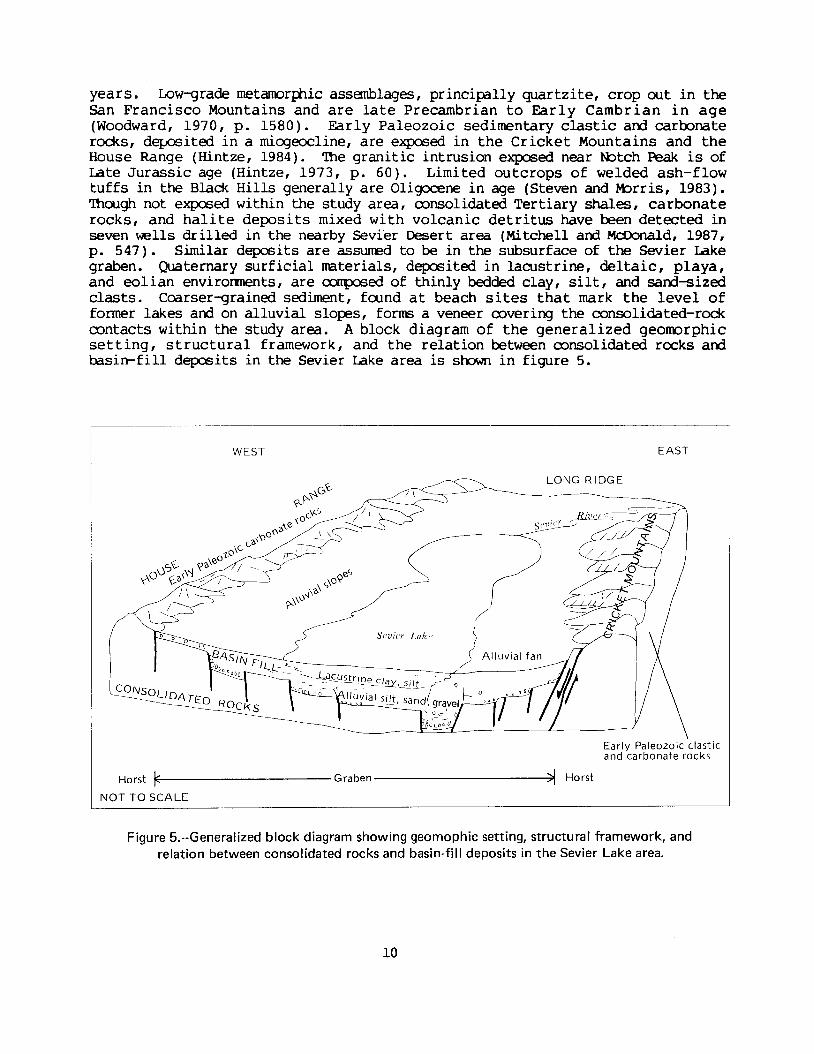
Nwnbering System for Hydrologic-Data Sites
The system of number ing hydrologic-data sites in Utah is based on thecadastral land-survey system of the U. S. Government. '!he number, in additionto designating the data site, describes its JXlsition in the land net. Theland-survey system divides the State into four quadrants separated by the saltLake Base Line and the salt Lake Meridian. '!hese quadrants, designated by theuppercase letters A, B, C, and D, indicate the northeast, northwest,southwest, and southeast quadrants, respectively. Numbers designating thetownship and range, in that order, follow the quadrant letter, and all threeare enclosed in parentheses. '!he number after the parentheses indicates thesection and is followed by three letters indicating the quarter section, thequarter-quarter section, and the quarter-quarter-quarter section, whichgenerally is 10 acres l for regular sections. '!he lowercase letters a, b, c,and d indicate the northeast, northwest, southwest, and southeast quarters ofeach subdivision, respectively. The number after the letters is the serialnumber of the hydrologic-data site within the 10-acre tract. '!he letter'S'preceding the serial number designates a spring. Thus (C-19-11)34dcc-ldesignates the first well oonstructed or visited in the ~L swL SEL section34, T. 19 S., R. 11 W., and (C-25-12)3Oddb-Sl designates a spring in the NWt,SEt, SEt, section 30, T. 25 S., R. 12 W. '!he numbering system is shown infigure 2.
Geographic Setting
The Sevier Lake area of about 850 square miles in west-central utah is inthe interior-draining Great Basin (fig. 3). The Sevier Lake area is definedby the local Sevier Lake drainage basin in the immediate vicinity of ephemeralSevier Lake (fig. 1) and is not to be confused with the larger Sevier Lakebasin (fig. 3). The Sevier Lake area is characterized by north-trending,block-faulted ranges and alluvial slopes that encircle the down-dropped,sedirrent-filled sevier Lake graben, which fonns the lowest part of the basin.The Sevier River enters the undrained basin from the northeast at atOIXXJraphic low JXlint between the Cr icket M:::>untains and Long Ridge (f ig. 1).Ephemeral streams drain to Sevier Lake from the surrounding ranges. Theranges that surround the lake include the Black Hills, Sawtooth, and SwaseyMountains part of the House Range to the west and northwest; the la¥-lyinglong Ridge to the north, the Cricket Mountains to the east; and the northernpart of the San Francisco M:::>untains to the south. The slightly elevated Wahwah Valley and Wah Wah Valley Hardpan are southwest of Sevier Lake and areseparated from the lake by a low top:>graphic divide. The geographic featuresof west-central Utah, the location of the sevier Lake area, the location ofclimatic stations, and selected land-surfaoe altitudes are shown in figure 1.
Altitudes within the study area range from about 4,514 feet above sealevel on the bed of Sevier Lake to 9,655 feet above sea level atop tibtch Peak
lAlthough the basic land unit, the section, is theoretically 1 squaremile, rrany sections are irregular. Such sections are subdivided into 10-acretracts, generally beginning at the southeast corner, and the surplus orshortage is taken up in the tracts along the north and west sides of thesection.
4

Sections within a township Tracts within a section
R. 11 W. Section 34
b a
t-7'---7""''---:---'''-----1 M ile-----------1
a
d
b
IIIII_________ I
--I---~------
b I a II I
/' --c----1I I
C I d IeWell
c
(C-19-11 )34dcc-1
6 5 ~ ~ 2 I
7 8 9 10\ II 12
18 17 16 15 1\, 13
~ 20 21 22 2~ 2~
~~
~ ~530 29 27 26
31 32 33 ~~~\Wei:'
I 6 Miles ~~_l\
T19S.
SALT
B
LAKE
II
A L _BASE LINEI
II
IT19S'R~~
zc
....~
c
'"
"Salt Lake City \
II,
D II
\II
_____ JFigure 2.--Numbering system for hydrologic-data sites in Utah.
5

r
UTAH
.. lOgO
L--'--__----,L
j'..:J'v' 1
---.(
o 50 100 MILESr "I' I I
o 50 100 KILOMETERS
1Great Salt (:Lake Basin .
\ Old Rivel./··". ~(8ed' .~ I. I LOCAL :
,. j~~~~~E R (
("\i DRAINAGE .J.. BASIN •
) Sevier 1-- Drainage basin.' Lake • boundary
Basin ;'
.. ...",.... ..~ ..
..
NEVADA
Figure 3.--Location of the local Sevier Lake drainage basin and other selectedfeatures within the interior drainage of the Great Basin.
6

in the Sawtooth Mountain part of the House Range. Intennediate high pointsare 7,231 feet above sea level in the Cricket Mountains and 6,332 feet abovesea level in the Black Hills part of the House Range near Steamboat Pass.
The central feature of the study area, Sevier Lake, is a flat,vegetation-free, playa (fig. 1) at the terminus of the sevier Lake basin.Since the late 19th century, surface-water inflow from the Sevier River toSevier Lake has progressively diminished because of the expansion ofirrigation in the area upstream. Presently (1988), surface-water flows rarelyexceed upstream demands and provide inflow to the lake. This inflow occursonly during periods of excessive precipitation or upstream reservoir spillage.Since the early 1900's, substantial inflow from the sevier River to sevierLake has occurred only in 1914, 1923, and in the early 1980's. For most ofthe 20th century, sevier Lake probably has been dry.
Sevier Lake, which has been referred to as a lake, a dry lake, or aplaya, is often dry except for efi1aueral inflow. The tenn Sevier Lake is usedin this report because that term is widely used in Utah and in previouslypublished reports.
Climate
The climatic zones in the study area include desert (arid) on the playafloor and steppe (semiarid), p::>ssibly on the alluvial slq>es and at the higheraltitudes of the mountains. Stands of conifers indicate that limited areas ofundifferentiated highland clbnate (subhumid to humid) might occur above analtitude of 7,000 feet. Desert climatic zones occur in areas where theaverage annual precipitation, usually about 5 to 8 inches, is less than onehalf of the annual potential evapotranspiration. Most of the area receivesless than 8 inches of annual precipitation. Steppe climatic zones areat higher altitudes perifi1eral to the margins of the desert zone where averageannual precipitation, which generally ranges from 8 to 14 inches (Murphy,1981, p. 55), is greater than one-half of the annual potentialevapotranspiration. The undifferentiated highland climatic zone occurs whereaverage annual precipitation generally exceeds potential evapotranspiration.The annual potential evapotranspiration varies from about 30 inches at thelower altitudes of the study area to about 18 inches at the higher altitudes(Richardson and others, 1981, p. 65).
During the summer, the study area primarily is affected by a warm,relatively dry Pacific air mass. Beginning in mid-July and continuing throughAugust, warm masses of moist, tropical air circulate clockwise around theBennuda High, intrude into the Pacific air mass, and bring infrequent butintense thundershowers to the study area.
The annual distribution and magnitude of precipitation directly affectsthe water budget of the area. Normal monthly precipitation for 1951-80 atseven stations near the study area is shown in figure 4. Selected clbnaticdata for 1951-80 for the same stations are listed in table 1.
Vegetation
Within the study area, there are five vegetation zones, in order ofgreater altitude: salt flats, salt desert scrub, sagebrush-grassland, desert
7

1.25Black Rock
. TTl ITI r r 1 ITl TDeseret
1'1-'1--'1"'-'-'.-,"rrn .
Desert ExperimentalRange
iTTTTTTTTTl ITEs kda Ie
·TTTTTTTTTTTTT1
1.00
J r ~ A M J J A SON 0
J F W j W J J • SOH D
Partoun"-,,.-..-r,.,.,.·TTTTT
J r M A M J J A 5 0 ~ 0
Milford WSO-nTT1-nT
J f N • W J J A S 0 ~ 0
J r ~ A ~ J J A SON 0
-
:; /~
J r M A M J J A 5 0 ~ 0
Garrisonl-fTTTTT1TTTTT
J F W • W J J • SOH 0o
o
1.75
1.00 I
0.75
0.25
0.25
0.75j:, J:
'/
r::
0.50 rc:
0.50 f-.
zo~I-a..UL.Ua:0..
~IIZo:2:
Cf)
L.U:::I:UZ
Z
Figure 4.--Normal monthly precipitation for seven climatic stations near the Sevier Lake area, 1951-80.
8

Table 1. --Selected climatic data for seven climatic stationsnear the study area, 1951-80
[Data are fran u.s. Dep3.rtrrent of Conrnerce, 1982;Stevens and others, 1983]
AnnualNornal N::>nnal Est inated freeze-
Climatic armual annual annual pan freestation Altitude tanperatures precipitation evaporation period
(feet above (degrees Fahrenhei t) (inches) (inches) (days)sea level) Maxinum MiniITD.lIl\ ~an
Black Rock 4,895 66.9 31.8 49.4 8.60 80.00 108Deseret 4,585 65.6 32.7 49.2 7.33 72.04 128DesertExperimentalRange 5,252 65.7 32.4 49.0 6.12 75.41 123
Eskdale 4,980 67.6 33.4 50.5 5.51 78.54 138Garrison 5,275 66.2 34.7 50.4 7.30 73.36 135Milford WSO 5,028 65.2 32.9 49.1 8.59 87.41 131Partoun 4,750 66.7 33.1 49.9 6.19 76.84 123
~land, and rrontane forest (Shultz and Shultz, 1984, p. 262). The salt-flatszone, which includes pickleweed, iodine bush, salt grass, and other halophyteassociations, is next to the mudflats and playa and is characterized by highlysaline soils and abundant soil moisture. Tamarisk and other phreatophytes arelirrUted to the river bottoms along the downstream p3.rt of the sevier River and tolocal si tes on the shoreline of sevier Lake where the zone of saturation is nearthe land surface. The salt-desert scrub zone, which includes greasewood,shadscale, and kochia plant associations, is on slightly higher ground and ischaracterized by well-drained soils that have large salt and alkali content andsmall organic-natter content. The armual precipitation for this zone is between 6and 10 inches per year (Shultz and Shultz, 1984, p. 263). The sagebrush-grasslandzone, which includes the grassland association and numerous sagebrush associationsas well as rabbitbrush, is at higher altitudes where armual precipitation rangesfrom 10 to 16 inches per year, winters are cold, and soils generally arenoderately deep, moderately alkaline, and well drained (Shultz and Shultz, 1984,p. 264). The desert~oodland zone, dominated by the pinyon-juniper association,typically is found where average armual precipitation is greater than 12 inchesand altitudes range from 5,000 to 8,000 feet (Shultz and Shultz, 1984, p. 265).The rrontane-forest zone, which prinarily consists of pine and fir conifer trees,is limi ted to the highest parts of the san Francisco M:>untains that have northfacing slopes.
Geologic setting
Metamorphic, sedimentary, and igneous rocks that range in age fromPrecambrian to Quaternary crop out in the sevier Lake area. These rocks representcomplex tectonic events and depositional environments that span nearly 1 billion
9
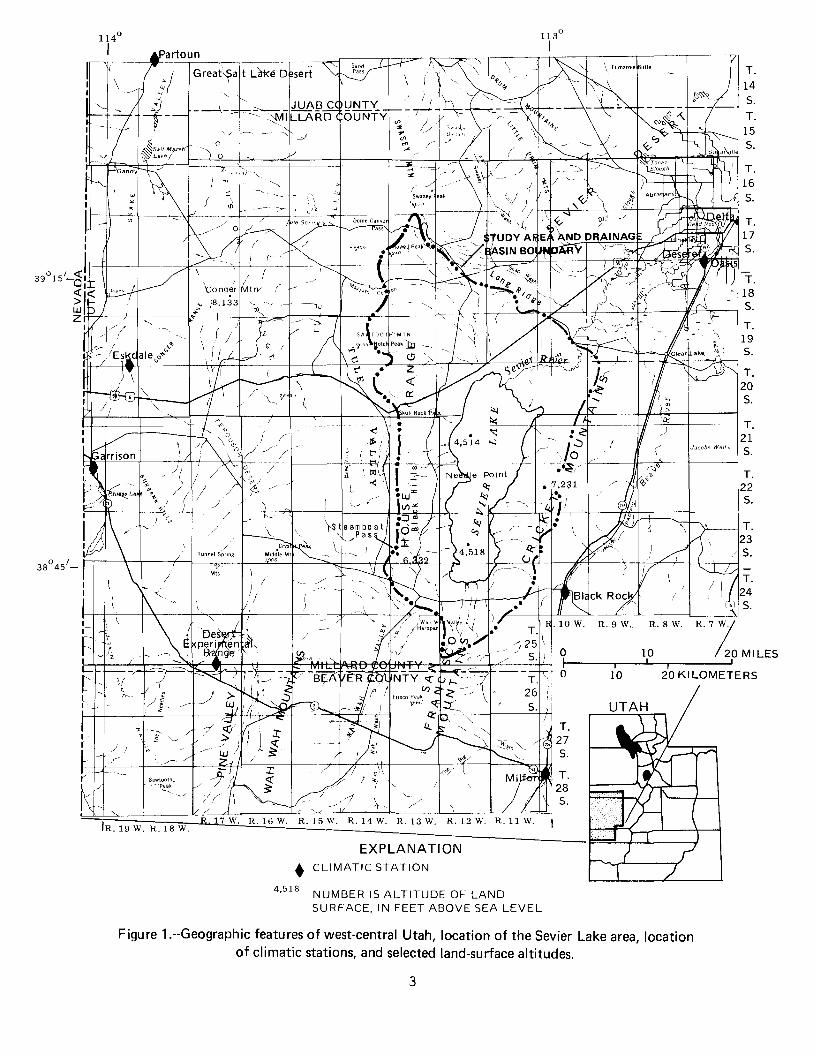
years. Low-grade metarooq:hic assanblages, principally quartzite, crop out in thesan Francisco Mountains and are late Precambrian to Early Cambrian in age(Woodward, 1970, p. 1580). Early Paleozoic sedimentary clastic and carbonaterocks, deposited in a miogeocline, are exposed in the Cr icket Mountains and theHouse Range (Hintze, 1984). '!he granitic intrusion exposed near N:>tch Peak is ofLate Jurassic age (Hintze, 1973, p. 60). Limited outcrops of welded ash-flowtuffs in the Black Hills generally are Oligocene in age (Steven and Morris, 1983).'!hough not exposed within the study area, consolidated Tertiary shales, carbonaterocks, and halite deposits mixed with volcanic detritus have been detected inseven wells drilled in the nearby sevier Desert area (Mitchell and McDonald, 1987,p. 547). Similar deposits are assl..lIIed to be in the subsurface of the Sevier Lakegraben. Quaternary surficial materialS, deposited in lacustrine, deltaic, playa,and eolian envirorments, are cxxrposed of thinly bedded clay, silt, and sand-sizedclasts. Coarser-grained sediment, found at beach sites that mark the level offormer lakes and on alluvial slo~s, forms a veneer covering the consolidated-rockcontacts within the study area. A block diagram of the generalized georoorphicsetting, structural framework, and the relation between consolidated rocks andbasin-fill deposits in the Sevier Lake area is shown in figure 5.
WEST
Sevier Lakl'
EAST
LONG RIDGE
Early Paleozoic clasticand carbonate rocks
Horst ~:'-----------Graben--------------,:>1 Horst
NOT TO SCALE
Figure 5.--Generalized block diagram showing geomophic setting, structural framework, andrelation between consolidated rocks and basin-fill deposits in the Sevier Lake area.
10

Basin-fill deposits of Tertiary and younger age consist of unoonsolidatedalluvium on the alluvial slopes and consolidated, semiconsolidated, andunoonsolidated sediments (possibly interbedded with volcanic rocks) as much as4,600 feet thick in the Sevier Lake graben. Our ing the Q..laternary Period, theSevier Lake graben was the catchment for all sediments and dissolvedoonstituents transported by the Sevier River. Periodic evaporation of thelake water has concentrated and precipitated the dissolved oonstituents andhas deposited potentially marketable quantities of brines and soluble salts inthe basin-fill deposits.
Within the study area, structural features include the fault-boundedSevier Lake graben, the Cricket tot:>untains and House Range oorsts (fig. 5), andeast-west-oriented linearrents and offsets. The eastward-tilted, asynmetricgraben is bounded by two north-trending, en echelon fault zones having amaximum vertical displacement of approximately 4,000 feet on the east andabout 2,300 feet on the west (Case and Cook, 1979, p. 55, 63). Southward, thegraben is bounded by a proposed east-trending offset (Crosby, 1973), indicatedby the right-lateral tq;>ograftlic offset between the oorthern part of the SanFrancisco tot:>untains and the southern part of the Cr icket Mountains, and thegeophysical changes in lines of equal gravity in the area (Case and Cook,1979, p. 57, 63).
Gravity data indicate that the Sevier Lake graben contains a maximum ofnearly 4,600 feet of basin-fill deposits along its dee};:er eastern margin (Caseand Cook, 1979, p. 64). Faults of late Pleistocene to Holocene age foon theeastern boundary of the graben (Oviatt, 1987, p. 40). To the west, the grabenis bounded by relatively small, normal faults that displace the eastwarddiWing back slo};:e of the Black Hills. Depths to oonsolidated rock are moreshallow west of the lake. Information fran drillers I logs indicates that the&1reau of Land Manage:nent (BIM) Black Hills well (site 37, fig. 6) penetratedconsolidated rock at a depth of about 560 feet (table 7 at back of report).N:> other wells in the area are koown to penetrate the basin-fill deposits tooonsolidated rock.
Surface-Water Resources
Sources of surface-water inflow to the study area are the Sevier Riverand local, ephemeral streams that flow in response to SI'lO\'melt or rainfall.Unusually wet climatic conditions during the early to mid-l980' s resulted inrecord runoff of 2.27 million acre-feet fran 1983-87 in the Sevier River andreestablished Sevier Lake, which reached a maximum lake level of 4,527 feetabove sea level in June 1985.
Sevier River
Sevier River is the principal source of surface-water inflow to SevierLake. Headwaters of the Sevier River are in the plateaus of south-centralutah. The Sevier Lake basin (fig. 3) encompasses 16,184 square miles and hasnearly 485,000 acre-feet of reservoir storage capacity. The nearly completeutilization of available surface-water supplies by u:r;:stream water users or instorage-retention facilities effectively limits the volume of water that flowsinto Sevier Lake.
11

------~-----_r_
T.20S.
T.19S.
[Site number, location, and additionalinformation found in figure 8 andtables 2.3,5, and 7]
DATA-COLLECTION SITESAND SITE NUMBER
EXPLANATION
23• Well
s~• Spring
SW13• Streamflow
T.25S.
T.23S.
T.22 - •• - BOUNDARY OF STUDY AREAS. AND DRAINAGE DIVIDE
T.21
_--'-- ---1 S.R.9 W.I
.•
•.••
, R. 10 W.
T.L... -.,,_------, 18
S.
.... /
/
e47
e48
e49
.j .J T.
•• l....--_-3..9 1 24S.
R.ll W.
32,33
e40
26e
T.17S.
25
./01")"..g.•
SEVIER LAKE
R. 12 W.
23e e24
••
R. 13 W.
<: •):;> w·I ~)I
~ 0·.I
27e.
Vl•) I
• ..l<::· u
\C1J
CO
·I 3'11
••(
R. 14 W.,
39015~
/••
--IUJ.~C •
) ZI «(Tl
39007~•• 0:
o 1 2 3 4 5 MILESI \ 1\ I \1\ ' I
o 1 2 3 4 5 KILOMETERS
Figure 6.--Location of hydrologic-data sites in and adjacent to the Sevier Lake area.
12
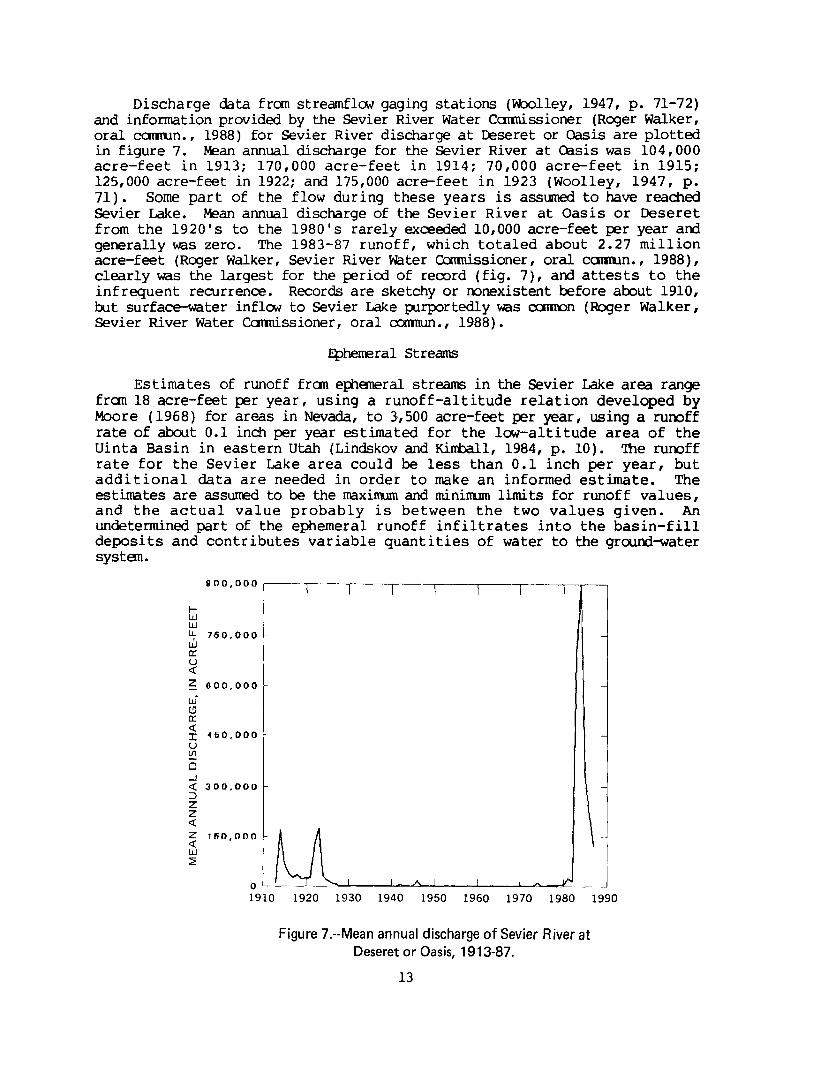
Discharge data from streamflow gaging stations (Woolley, 1947, p. 71-72)and infonnation provided by the sevier River Water Carmissioner (Roger Walker,oral commun., 1988) for sevier River discharge at Deseret or oasis are plottedin figure 7. M?an annual discharge for the sevier River at CBsis was 104,000acre-feet in 1913; 170,000 acre-feet in 1914; 70,000 acre-feet in 1915;125,000 acre-feet in 1922; and 175,000 acre-feet in 1923 (Woolley, 1947, p.71). Some part of the flow during these years is assumed to have reachedsevier Lake. M?an annual discharge of the Sevier River at Oasis or Deseretfrom the 1920 I s to the 1980 I S rarely exceeded 10,000 acre-feet per year arrlgenerally was zero. The 1983-87 runoff, which totaled about 2.27 millionacre-feet (Roger Walker, Sevier River water camussioner, oral camun., 1988),clearly was the largest for the perico of rerord (fig. 7), arrl attests to theinfrequent recurrence. Records are sketchy or oonexistent before about 1910,but surface-water inflow to sevier Lake p..1rportedly was c:x::moon (Roger Walker,sevier River Water Ccmnissioner, oral cxxmnm., 1988).
Epherreral Streams
Estimates of runoff fran eIilaneral streams in the sevier Lake area rangefran 18 acre-feet per year, using a runoff-altitude relation developed byMoore (1968) for areas in Nevada, to J,500 acre-feet per year, using a ruooffrate of about 0.1 inch per year estimated for the low-altitude area of theUinta Basin in eastern Utah (Lindskov and Kimball, 1984, p. 10). '!he ruooffrate for the Sevier Lake area could be less than 0.1 inch per year, butadditional data are needed in order to make an infonned estimate. Theestimates are assurced to be the maximJrn and mininum limits for runoff values,and the actual value probably is between the two values given. Anundetermined part of the ephemeral runoff infiltrates into the basin-filldeposits and contributes variable quantities of water to the grourrl-watersysten.
900.000 r--.....---~---r---,----,---,---,.-.---,
f-wWIJ.. 700.000Wa::u«z 600.000w·(!)a::«
450.000IUtil
0.J« 300.000::JZZ«z lliO,OOO«w:2:
OL-.:-_--'-_"""'-..l..-_--.l._.L:\-...J.-_---J:..-.._....l-..L'>._¥.....:-.-_---!
1910 1920 1930 1940 1950 1960 1970 1980 1990
Figure 7.·-Mean annual discharge of Sevier River atDeseret or Oasis, 1913-87.
13

Sevier Lake
Sevier Lake is a remnant of one or several pluvial lakes that formedduring the Pleistocene Ep:lch and culminated with the final highstand of lakeBonneville about 15,000 years ago (Currey and CNiatt, 1985, p. 13). Followingthe catastrophic lowering of Lake Bonneville during the geologicallyinstantaneous Bonneville Flood, the remnant Lake Bonneville receded to GreatSalt Lake basin as a result of increasing aridity (fig. 3). Drainage fran thesevier Lake basin was northward to the Great salt Lake basin via the low pointat the Old River Bed, which is north of the sevier Lake area (fig. 3). Oviatt(1987, p. 56), has called the lake that existed in the Sevier Lake area afterLake Bonneville and before Sevier Lake, Lake Gunnison, in nerrory of the U.S.Army TopograP1ic Engineer who was killed near the shores of Sevier Lake inOctober 1853 while exploring the region. Radiocarbon-dated wood andstratigraphic and geamorP1ic analysis of a persistent beach deposit found atlevels above the present-day lake indicate that Lake Gunnison existed franabout 10,000 to 12,000 years ago as a shallow, freshwater lake at an altitudeof about 4,560 feet above sea level (Oviatt, 1987, p. 57).
The late Holocene lacustrine chronology is more canplete for Great SaltLake basin, but the general details are assurred to be applicable to the sevierLake basin (fig. 3). The sevier Lake chronology during the Holocene Epoch(roughly 10,000 years ago to the present) has been detailed by CNiatt (1987).Radiocarbon dates fran gastrq:ojs and alluvial deposits indicate that fromabout 10,000 years ago to the present, the lake(s) in the Sevier Lake basindid not exceed the Lake Gunnison level (CNiatt, 1987, p. 59). The fluctuatingwet-dry cycles typical of the Holocene Epoch undoubtedly have created acomplex record of alternation between playa and lake conditions, but thenurroer and duration of playa-lake oscillations is not yet known.
Historic infonnation about sevier Lake was acquired from early explorers'journals, government reports, and observations by local water officials. In1776, the Dominguez-Escalante expedition recorded infonnation furnished by theindigenous people of the Sevier Desert area about a body of water into whichthe sevier River flowed. Gilbert (1890, p. 224) suggested that governmentexplorers of the region, including Fremont in 1845, Gunnison in 1853, andBeckwith and Slinpson in 1853 and 1859, knew of the existence of the lake.Wheeler, in 1869, approached the lake from the west and determined its truegeographic position (Gilbert, 1890, p. 224).
The first hydrologic details of Sevier Lake and surroundings wereprovided by Gilbert during the Wheeler Survey of 1871-74 and the Powell Surveyof 1875-79. In 1872, Sevier Lake had an area of 188 square miles, a salinityweight percent of 8.64 consisting chiefly of sodium chloride and sodiumsulfate, and a maximum depth of about 15 feet, with the northern p:irt beingdeeper than the southern part (Gilbert, 1890, p. 225). Gilbert reported thelake was nearly dry in January 1880 and had been for the previous one or tooyears. By August 1880, the surface of the lakebed was a mixture of saltcrystals and mud, and snowshoes were required to cross the rrud to reach thewater I s edge (Hunt, 1981, p. 186). Coincidentally, during the surmer of 1987,the lake was similar in P1ysical characteristics and chemical composition tothe lake that Gilbert described in 1872.
14

Lake-level data for Sevier Lake were not rollected until the ~t periodof the early to mid-1980's because of the intermittent occurrence of water onthe lakebed. Water probably was present in 1913-15 and 1922-23, the onlyyears of substantial runoff in the Sevier River at Deseret or oasis until1983-87 (fig. 7). Water undoubtedly was present on the lakebed in otheryears, but the quantity of inflow was small and the duration limited to aseason or less. The level of Sevier Lake reached a rnaxbmum of 4,527 feetabove sea level in June 1985 (fig. 8) and resulted in a rnaxirrum depth of aoout13 feet. The location of the lake-level rreasurement site varied as the levelrose; the measurements were rollected by Larry Sower (Crystal Peak MineralsCorporation). Since January 1987, the lake levels have been measured at asurveyed site near the southern shore (site 52, fig. 6).
The annual evaporation for a free-water surface at the latitude of SevierLake is about 50 to 55 inches per year (Farnsworth and others, 1982, map 3),and approximates the 45 inches of lake-level decline measured in 1987 (LarrySower, Crystal Peak Minerals Corporation, oral cornrnun., 1988). The totalfree-water-surface evaporation fram the lake in 1987 was about 460,000 acrefeet. Assuming that no ITOre surface water were to flow to the lake, it wouldtake about 4 years to evaporate the volume of water that entered the lake fran1983 to 1987 but the evaporation rate Y.Ould diminish as the concentration ofthe brine increased.
An unknown quantity of the surface water that flows onto the lakebedprobably recharges the local shalloo ground-water system, but the infiltrationrate could be small because of the small permeability of the lakebed and thecontrast in density between the surface water in the lake and the shallowground water. In addition, the depth to the ground water is shallow, whichlimi ts the space available for accepting and storing recharge.
Chemical quality
Chemical analysis of a water sample fran the Sevier River rollected atthe infloo to Sevier Lake is listed in table 2 (site SW14, fig. 6). Thesample, collected on December 4, 1987, when the measured discharge of theriver was 17.9 cubic feet per second, was assumed to represent the waterquality of basefloo. At the time of rollection, water was not being releasedfran the up:;trearn reservoirs (Roger walker, Sevier River Water Conmissioner,oral cornrnun., 1987), and the combined discharge of the Sevier River nearDeseret and the only drain west of Hinckley that was flowing was estimated tobe less than 5 cubic feet per seoond.
The chemical composition of water in Sevier Lake varies in response tosurface-water inflow, evaporation rates, and composition of the lakebedmaterial, which affect the equilibrium concentration (solubility) of CClTlI;x:>undsa:xmon to the lake. When large infloos of surface water entered the lake fran1983 to 1987, the water quality of the lake initially was fresh to slightlysaline but became increasingly briny as the constituents ~re concentrated byevaporation and dissolution of the lakebed material. Eventually, thecompounds in the brine reached a point of supersaturation, depending ontemperature, salinity, and interference by other solutes, and the mineralsprecipitated sequentially. For most saline lakes, the progressiveroncentration of brines causes a decrease in solubility· and classically leadsto sequential precipitation of carbonate ronstituents follo~ by sulfate and
15

Table 2.-Crlt:mical analyses of water from selected
Site nuntler: Refers to hydrologic-data site number in figure 6.LDcation: See text for explanation of mllt>ering system for hydrologic-data sites.
g/rnl, grams perUnits: ~/cm, microsiemens per centimeter at 25 °Celsius; °C, degrees Celsius; ftl/s, cubic feet per second;Pdditional data: F, value for specific conductarce detenninoo onsite; < indicates less than value slllwn; -- indicates no
Spe-cific Alka- Alka-
conduct- T~er- Density Hard- linity, linity,Date Altitude ance, ature, Dis- (g/ml ness field lab
Site of of lam lab water charge at (IIY:l/L (mg/L (IIY:l/LIlJrmer Location sarrple surface ()JS/em) I1i (0C) (ftl/s) 2D °C) as as as
(feet) (units) CaCC3) caC°3) CaCC3)
Wells
2 (C-18-10~25Cad- 1 07-16-81 4,558 34,900 7.40 14.0 6,300 1903 ~C-l9- 9 29cbc- 1 08-14-86 4,553 1,040 7.90 20.0 0.000 210 1576 C-19-1O 7bda- 1 09-22-87 4,692 3,2al 7.50 14.5 9J 125 1279 ~C-19-11~34dCC- 1 09-22-87 4,523 118,000 7.70 19.5 U88 lO,ooo 120 115
lO C-19-11 34dcc- 2 09-22-87 4,525 00,000 7.20 15.0 1.046 9,000 135 134
12 (C-19-12)36bca- 1 09-22-87 4,607 9,4al 7.90 16.0 300 238 21515 ~C-2Q-12~ 1aac- 1 07-15-81 4,544 51,400 7.50 15.0 11,000 11016 C-2Q-12 lOdcd- 1 09-23-87 4,523 127,000 7.20 17 .5 1.048 lO,OOO 729 58117 ~C-2Q-12~lOdcd- 2 09-23-87 4,524 126,000 7.40 18.0 1.007 8,400 175 17418 C-2Q-12 lOdcd- 3 09-23-87 4,525 00,400 7.20 17 .5 1.051 6,100 163 161
19 (C-2Q-12)32aaa- 1 09-23-87 4,525 65,700 7.30 13.5 1.036 5,500 80 8221 ~C-2Q-12~32abd- 1 09-23-87 4,550 ~,600 7.40 15.5 1.024 3,300 123 12127 C-22-14 1cOO- 1 01-14-76 4,779 1,GOOF 250 244
do. 12-02-87 l,OlO 7.70 19.5 1!ll 19328 (C-23-11) 7bbc- 1 10-06-87 4,525 105,000 7.70 18.5 1.075 15,000 206 206
29 (C-23-11) 7bbc- 2 10-06-87 4,530 g),900 7.30 15.0 1.060 9,700 58 59:J) ~C-23-11~ 7bdb- 1 10-06-87 4,550 91,000 7.60 13.0 1.054 12,000 86 8735 C-23-12 5cdd- 2 09-24-87 4,525 66,800 7.80 16.0 1.039 5,600 125 12736 ~C-23-12~ 5cdd- 3 09-24-87 4,525 76,800 7.40 16.0 1.044 6,300 74 7437 C-23-12 6ccd- 1 12-02-87 4,632 9al 8.40 19.0 !ll 82
:ll (C-23-12) 6dac- 1 09-24-87 4,560 56,500 7.60 16.5 1.071 4,300 lO2 10239 ~C-24-10~21aoo- 1 12-02-87 4,850 6,320 7.60 12.0 740 15043 C-24-12 15cdc- 1 11-11-87 4,568 8al 7.90 23.5 1!ll 108 11044 ~C-24-13~13aac- 1 09-24-87 4,555 35,000 7.70 16.0 1.020 2,500 65 6545 C-24-13 23ccd- 1 09-24-87 4,615 5,540 7.60 16,0 720 110 10746 (C-24-13)34ccb- 1 01-14-76 4,645 2,800F 350 153
~
522 (C-21-10)13baa-S1Candland Spring 09-21-87 5,790 l,3al 7.00 19.5 <0.01 410 334 271
S50 (C-25-12)30ddb-S1James Spring 10-05-87 6,630 700 7.al 13.0 <0.002 230 204
Surface water
5\<113 (C-19-10)22ddb- 1Sevier River near
culverts oncounty road 12-04-87 4,535 4,6fflF 3.0 15.7
SW14 (C-2Q-1O) 6dd- 1Sevier River atrocuth 12-04-87 4,533 4,950 8. :J) 5.0 17.9 980 275
16
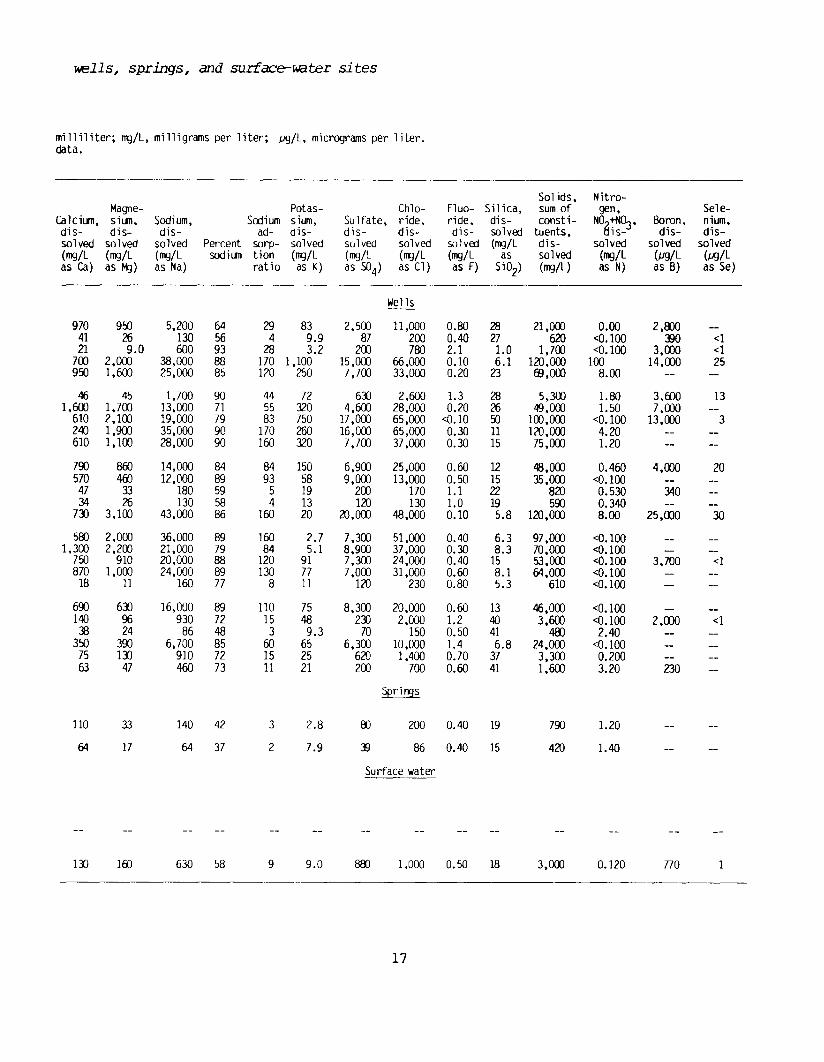
~lls, springs, and surface-water sites
milliliter; mg/L. milligrams per liter; pg/L. micrograms per liter.data.
Sol ids. Nitro-Magne- Potas- Chlo- Fluo- Sil ica. sum of gen. Sele-
Calcium. silJl1. Sodium. Sodium sium. Sulfate. ride. ride. dis- consti- NO~:N0:3' Boron, nium,dis- dis- dis- ad- dis- dis- dis- dis- solved tuents. 1S- dis- dis-solved solved solved Percent sorp- solved solved solved solved (~/L dis- solved solved solved(~/L (~/L (n¥:J/L sodilJl1 tion (mg/L (n¥:J/L (mg/L (n¥:J/L as solved (n¥:J/L (Jl9/L (J..CJ/Las Ca) as M:.J) as Na) ratio as K) as 504) as Cl) as F) Si02) (n¥:J/L) as N) as B) as Se)
Wells
970 950 5,200 64 29 83 2.500 11.000 0.80 28 21,000 0.00 2.00041 26 130 56 4 9.9 87 200 0.40 27 620 <0.100 l:l0 <121 9.0 600 93 28 3.2 200 780 2.1 1.0 1,700 <0.100 3.000 <1
700 2,000 38.000 88 170 1.100 15.000 66.000 0.10 6.1 120,000 100 14,000 25950 1,600 25.000 85 120 250 7.700 33,000 0.20 23 00.000 8.00
46 45 1,700 90 44 72 6l:J 2.600 1.3 28 5,300 1.80 3,600 131.600 1,700 13.000 71 55 320 4.600 28,000 0.20 26 49,000 1.50 7,000
610 2,100 19,000 79 83 750 17.000 65.000 <0.10 50 100,000 <0.100 13,000 3240 1,900 35.000 90 170 260 16,000 65,000 0.30 11 120.000 4.20610 1.100 28.000 90 160 320 7.700 37.000 0.30 15 75.000 1.20
790 860 14.000 84 84 150 6.900 25.000 0.60 12 48.000 0.460 4,000 20570 460 12.000 89 93 58 9.000 13,000 0.50 15 35.000 <0.100
47 33 180 59 5 19 200 170 1.1 22 820 0.530 34034 26 130 58 4 13 120 130 1.0 19 590 0.340
7l:J 3.100 43.000 86 160 20 20.000 48,000 0.10 5.8 120,000 8.00 25,000 30
500 2.000 36.000 89 160 2.7 7,300 51.000 0.40 6.3 97,000 <0.1001,300 2.200 21,000 79 84 5.1 8,900 37.000 0.30 8.3 70,000 <0.100
750 910 20,000 88 120 91 7,300 24,000 0.40 15 53.000 <0.100 3,700 <1870 1.000 24.000 89 130 77 7.000 31.000 0.60 8.1 64,000 <0.100
18 11 160 77 8 11 120 230 0.80 5.3 610 <0.100
690 6l:J 16.000 89 110 75 8,300 20.000 0.60 13 46.000 <0.100140 96 930 72 15 48 2l:J 2,000 1.2 40 3,600 <0.100 2,000 <1
38 24 86 48 3 9.3 70 150 0.50 41 400 2.40350 390 6.700 85 60 65 6,300 10.000 1.4 6.8 24,000 <0.100
75 1l:J 910 72 15 25 620 1,400 0.70 37 3,300 0.20063 47 460 73 11 21 200 700 0.60 41 1.600 3.20 230
~
110 33 140 42 3 2.8 00 200 0.40 19 790 1.20
64 17 64 37 2 7.9 l:l 86 0.40 15 420 1.40
Surface water
1l:J 160 630 58 9 9.0 800 1.000 0.50 18
17
3,000 0.120 770

BASED ON MONTHLY MEASUREMENTS
DASHED WHERE APPROXIMATE
(Location of lake-level measurementsite was variable along the southernpart of the lake. Since January 1987,the lake level has been measured atsite 52, figure 6).
I,I,I ,,,I ,I ,I ,, ,I ,I ,I ,,I ' I,I 'I ,I ~/,I \I \
\ I ,\ I ,\ I \" ,, ,,,
,'\I \I \I \IIIIII,IIIII,I
" I," ', , I, \ I, \', ~I' ,, ,
"
4,528
4,527
4,526
4,525
4,524
tiJ 4,523wu..Z
.J4,522w
>W.....J
W::t:: 4,521«.....Ju..0w0 4,520::JI-
6«4,519
4,518
4,517
4,516
4,515
1
4,514 L-___l___--'-__--'-__-----'~___'_______l_____'______l._____'
1982 1983 1984 1985 1986 1987 1988 1989 1990
Figure 8.--Altitude of Sevier Lake level, 1982-88. (Data from Larry Sower,Crystal Peak Minerals Corporation, 1988.)
18

chloride constituents. Sevier Lake, like the more concentrated Great saltlake, does not follow the classical precipitation sequence closely because itlacks excess carbonate constituents and precipitates and has a surplus ofsulfate and chloride constituents and precipitates. When sulfate and chlorideare the principal anions, sodium carbonates are no longer precipitated(Sonnenfeld, 1984, p. 142).
The brine density and concentrations of major constituents vary with lakelevels and indicate an inverse relation between lake volume and salinity. Thebrine density at various lake levels and the dissolved concentration of majorconstituents for January 1987 to July 1988 are given in table 3 and indicatethat the major constituents are sodium, sulfate, and chloride.
Ground-Water Resources
Ground water in the study area is in fractures and solution openings ofconsolidated rocks or in interstices and pore space of unconsolidated basinfill deposits. On the basis of geographic extent and location, length ofground-water flow path, water-level data, and chanical quality, three types offlow systems (fig. 9) might be present in or near the Sevier lake area. Asdefined by Gates (1987, p. 83), these are: (1) Local flow systems that haveshallow flow paths less than about 25 miles in length, are limited to onetopographic basin, and discharge to a river or terminal lake; (2) anintermediate flow system that has relatively deeper and longer floo paths, isnot necessarily limited to one t~raP1ic basin, and discharges to a river orterminal lake; and (3) a regional flow system that can include one or moreintermediate flow systems, extends beneath many topographic basins, anddischarges at a regional sink in a t~raP1ic 100 point, such as the southernpart of Great salt Lake Desert or, perhap:> , the sevier Lake area (fig. 1).
LOCAL FLOWSYSTEM
Sink
INTERMEDIATE FLOW SYSTEM
REGIONAL FLOW SYSTEM
Partly drainedtributary area
Figure 9.--Block diagram showing local, intermediate, and regional flowsystems. (Modified from Eakin and others, 1976, fig. 3j
19

Table 3.-Lake levels, brine density, dissolved ooncentration ofmajor oonstituents, and salinity of Sevier Lake fran
January 1987 to July 1988; Great Salt Lake during June 1987;and the average canposi tion of seawater
[g/mL. grams per milliliter at 20 degrees Celsius; mg/L. milligrams per liter; • no data]
Date Lake 1evel(feet abovesea level)
Brinedensity
(g/mLat 20°C)
Dissolved concentration of ma~or constituents1Magneslum Sodlum Potasslum ulfate Chlorlde
(mg/L) (mg/L) (mg/L) (mg/L) (mg/L)
Sevier Lake 2
Salinity(weightpercent)
01-01-8702-01-8703-01-8704-01-8705-01-87
06-01-8707-01-8708-01-8709-01-8710-01-87
11-01-8712-01-8701-01-8802-01-8803-01-88
04-01-8805-01-8807-01-88
4.518.904.519.504.520.004.521.004.520.40
4.519.754.518.704.518.104.517.604.517.35
4.517.354.517.354.517.504.517.604.517.60
4.517.604.517.354.516.00
1. 0501. 0501. 0501. 0501. 050
1.0601.0601.0801.0901. 110
1.0901.0701.0801.0601.080
1.0901.100
1.3651.3651.3651.365
1.4851.5901.9452.2902.775
2,5102,5703,1301,8002.485
2.6152,640
21, 42022.47021.84020,685
24,48525,12035,31539,56550,060
34,55531.67038,99024,59034,235
41.42046.860
735735945945
740850970
1,2001,445
1,3101,2851.5101.1651,190
1.4151,430
12.81015.96016.06514.595
18,23018.87026.13529,43036,740
14.7158.9907.885
10,92015.120
20,16528,380
28.24527.61526.56525.830
29,36030,00041.90546,87059.610
50,68551.04064,69036.25049.895
57.88060,500
6.156.496.356.04
7.017.209.84
10.9513.56
9.508.92
10.777.049.50
11.3312.72
Great Salt Lake, South Arm(average of 5 sites with 44 separate sample depths)3
06-10-87 4,211.60 1.069 3,620 32,600 2,080 6,550 57,500 9.57
Great Salt Lake, North Arm(average of 4 sites with 30 separate sample depths)3
06-09-87 4,210.70 1. 159 6.210 62,800 3,560 11,500 109.000 16.66
Seawater4
1.035 1 .350 10.500 390 2.700 19.000 3.28
Brine saturation commonly is reported in salinity (weight percent) of solute. To convertthe value given to weight percent, divide concentration (mg/L) by density (g/ml) and 1 x 10 4
(conversion factor to change g/ml to mg/L = 1 x 10 6; percent = 1 x 10- 2; therefore 1 x 10⁴ ). Todetermine the weight percent of water, subtract the salinity weight percent from 100.
2 Data from Larry Sower. Project Manager. Crystal Peak Minerals Corp .• written commun .•1988.
3 Data from Gwynn, 1988.4 Data from Hem. 1985.
20
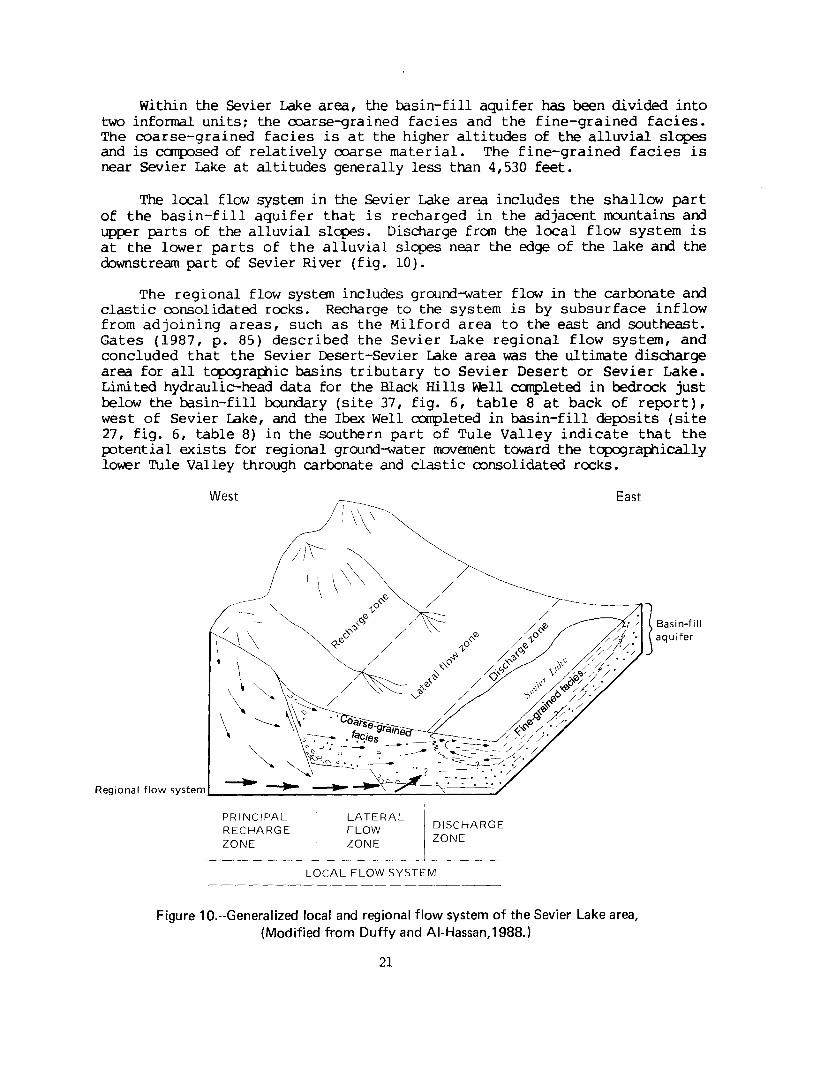
Within the sevier Lake area, the ba.sin-fill aquifer has been divided intotwo infonnal units; the coarse-grained facies and the fine-grained facies.The coarse-grained facies is at the higher altitudes of the alluvial slopesand is composed of relatively coarse material. The fine-grained facies isnear Sevier Lake at altitudes generally less than 4,530 feet.
The local flow system in the sevier Lake area includes the shallow partof the basin-fill aquifer that is recharged in the adjacent mountains andupper pa.rts of the alluvial slopes. Discharge fran the local flow system isat the lower parts of the alluvial slopes near the edge of the lake and thedownstream part of Sevier River (fig. 10).
The regional flow system includes ground~ater flow in the carbonate andclastic ronsolidated rocks. Recharge to the system is by subsurface inflowfrom adjoining areas, such as the Milford area to the east and southeast.Gates (1987, p. 85) described the Sevier Lake regional flow system, andconcluded that the Sevier Desert-Sevier Lake area was the ultimate dischargearea for all topographic basins tributary to Sevier Desert or Sevier Lake.Limi ted hydraulic-head data for the Black Hills well canpleted in bedrock justbelow the ba.sin-fill boundary (site 37, fig. 6, table 8 at back of report),west of Sevier Lake, and the Ibex Well conpleted in basin-fill de};X)sits (site27, fig. 6, table 8) in the southern part of Tule Valley indicate that thePJtential exists for regional ground-water movement toward the topographicallylower Tule Valley through carbonate and clastic consolidated rocks.
West
Regional flow systemL=~~~=--=~~::!:!L~~:S::==:;
East
PRINCIPALRECHARGEZONE
LATERALFLOWZONE
DISCHARGEZONE
LOCAL FLOW SYSTEM
Figure 10.--Generalized local and regional flow system of the Sevier Lake area,(Modified from Duffy and AI-Hassan, 1988.)
21

If the quantity of ground-water outflow fran the Sevier Lake area ~re
determined to be a substantial part of the total water budget of the area,then the Sevier Lake regional flow system could be redefined as anintermediate system in an enlarged Great Salt Lake Desert regional flowsystem. Data collected during the present study do not warrant redefinitionof the Sevier Lake regional floo system.
Consolidated Rocks
The consolidated rocks in the study area primarily consist of carbonaterocks but include sorre clastic and igneous rocks. carbonate rocks can be rrorepermeable than other consolidated rocks if dissolution has occurred alongbedding planes, fractures, joints, and faults. The carbonate rocks of westernUtah and adjoining parts of Nevada are believed to form an aquifer system ofreg ional extent on the basis of water levels rreasured in ~lls and imbalancesin the water budgets for individual basins (Gates and Kruer, 1981, p. 31-38).As previously discussed, the potential exists for ground-water movement in thecarbonate rocks fran the Milford area to the Sevier Lake area and from theSevier Lake area to southern Tule Valley, but the existence of IIOverrent andthe rate of rroverrent are uncertain.
Occurrence
Ground-water occurrence in the consolidated, primar ily carbonate, rocksof the Sevier Lake area is poorly known. Only the Black Hills well (site 37,fig. 6, table 7) is thought to be <XlITpleted in consolidated rocks, though itpenetrates only 1 foot below the basin-fill deposits (mostly clay at thislocation). In 1987, the water in this well stood at an altitude of about4,428 feet above sea level.
Recharge
Ground-water recharge to the sevier Lake area in the local flCM system isderived fran precipitation and ephemeral stream runoff that infiltrates intothe consolidated rock outcrops of the adjacent mountains. Ground-waterrecharge as subsurface inflow from the regional flow system moves throughfractures, faults, and solution cavities in the consolidated carbonate rocksfran adjoining areas to the east and southeast, such as the Milford area.
Estimates of the quanti ty of recharge to consolidated rocks are discussedlater in the rePOrt in the basin-fill recharge section. Estimates of thequantity of ground-water inflow from adjoining areas are derived from acalibrated digital ground-water rrodel and depend on the values for hydrauliccharacteristics assigned in the model. Estimates of subsurface inflow to thearea through consolidated rocks are about 11,400 acre-feet per year from theMilford area (J.L. Mason, U.S. Geological Survey, written cammun., 1988).This estimate was derived fran a calibrated local-scale digital ground-waterrrodel of the Milford area.
M:>verrent
The direction of ground-water movanent in the local flow systan is franareas of recharge, generally in the mountains, to areas of discharge attopographic low points (fig. 10). The direction of ground-water movement in
22

a:msolidated rocks in the regional flow system is east to west, or from theMilford area and the Sevier Desert and perhaps toward Tule Valley. Groundwater rrovenent in the regional system is estimated from rreasured water levelsin wells that are completed in basin-fill deposits. It is assumed thathydraulic connection exists between the consolidated rocks and the basin-filldeposi ts. Evidence for inflcw from the Milford area is based on water-leveldata from tHells, which show a hydraulic-head gradient toward Sevier Lake, andwater-budget analyses, which do not balance without subsurface outflow to theSevier Lake area.
Discharge
Ground-water discharge from the local flow system occurs at the lowerparts of the alluvial slopes near the edge of Sevier Lake and the downstreamparts of the Sevier River. Ground~ater discharge from consolidated rocks inthe regional flow system occurs by upward leakage into the overlying basinfill deposits, and subsequently discharges to the lower part of the SevierLake area, or possibly by subsurface outflcw to adjacent areas in southernTIlle Valley. Few data are available and estimates of ground-water outflowthrough consolidated rocks to adjacent areas are speculative. SteIXten Carlton(U.S. Geological Survey, written commun., 1989) suggested that the bestresults from the model of the Fish Springs multi-basin flow system wereobtained when Sevier Lake was sirmlated as an area of discharge.
Ground water is pumped from consolidated rocks within the study area framone tHeIl, the Black Hills Well (site 37, fig. 6), for livestock wateringdur ing part of the year. The quantity p..unped is estirrated to be less than 10acre-feet per year. Because this tHell penetrates only 1 fcot of consolidatedrock (table 7), some of the water pumped might be from the overlying basinfill deposits. Relative contributions of water from the basin-fill depositsand consolidated rocks are unknown.
Aquifer Characteristics
No aquifer tests are known to have been made at tHells a:xrpleted in theconsolidated rocks in the Sevier Lake area. Bedinger and others (1986)compiled values of hydraulic conductivity and effective porosity fram theliterature for the types of consolidated rocks cannon in the Basin and Rangeprovince of the southwestern United States and plotted the values on lognormal plots. The mean or 50th percentile value presented in table 4indicates that fractured and cavernous carbonate rocks have the greatestpotential for transmitting fluid.
Basin Fill
Basin-fill deposits, present throughout the Great Basin, include largeground-water reservoirs that store and transmit vast quantities of water andcontain many potential aquifers (Thomas and others, 1986). The basin-fillaquifer in the Sevier Lake area has been divided into tv.o informal units; thecoarse-grained facies, which is located at the higher altitudes of thealluvial slopes, and the fine-grained facies, which is located at the lcweraltitudes around Sevier Lake. The drillers' lithologic logs (table 7)indicate that the deposits are coarser tcward the rrountains than they are at
23

Table 4.--Aquifer characteristics of consolidated rocksin the Basin and Range province,
southwestern Uni ted States
(Modified from Bedinger and others, 1986)[Asterisk (*), indicates words were mistakenly reversed in original
reference; the correct wording is cited here (M.S. Bedinger,U.S. Geological Survey, retired, oral commun., 1989)J
Rock type Description
Meanhydraulic
conductivity(feet per day)
Meaneffectiveporosity
Metamorphic and felsicand mafic intrusiverocks
Weathered
Fracture permeability; 2 x 10⁻³depth less* than 1,000 feet
Fracture permeability; 1 x 10⁻⁶depth greater* than 1,000 feet
0.05
.003
.0001
Lava flows; includesbasalt, rhyolite, andtrachyte
Tuff
Clastic sedimentaryrocks (consolidated)
Carbonate rocks;includes limestone,dolomite, and marble
Fractured and cavernous
Moderately dense to dense
Welded and fractured
Welded and moderatelyfractured to dense
Nonwelded, partiallywelded, friable,pumiceous, zeolitized,and bedded friable
Coarse-grained (sandstoneand conglomerate)
Fine-grained (argilliteand shale)
Fractured, karstic, andcavernous
Dense to moderatelydense
24
.15
.01
.03
.001
.35
.18
.22
.12
.01
lo~r altitudes. A block diagram conceptualizing the general hydrology of thelocal and regional flow systems of the Sevier Lake area is presented infigure 10.
CX:currence
The occurrence of ground water in the basin-fill aquifer is known framwater levels measured in wells that are finished in these deposits. Waterlevels in shallow ~lls near Sevier Lake to the northwest, west, and south arehigher than water levels in wells a short distance away from the lake andindicate a potential for ground-water movanent away from the lake (sites 12and 15; 21; 23 and 24; 38; 43; 44 and 45)(fig. 11, table 5). Associated withthe differences in hydraulic-head values is a decrease in the sum ofconstituents in water sampled from wells that are located at increasingdistances fran the lake (tables 2 and 5).
Approximately 600 shallow wells were drilled less than 20 feet deep onthe dry lakebed in the early 1980's. Some flowed for a limited tline, andindicated the existence of shallow, noncontinuous ar tesian condi tions. Theshallow artesian ~lls ~re drilled in slight topographic depressions (on thelakebed) south of Needle Point and near the Sevier River inflow, with a fewisolated wells both east and north of Needle Point (Murray C. Godbe III,consultant, written o:xrmun., 1987).
Four open holes (sites 25, 26, 32, and 33, fig. 11) were drilled todepths ranging from 705 to 975 feet on the dry lakebed in 1978-79. Reportedwater levels (table 8) and altitudes of hydraulic heads (table 5) ~re belowthe land surface. The chemical analyses of brine sarrpled at various depths inthe four open holes were highly variable (Murray C. Godbe III, consultant,written o:xrmun., 1987) and indicated that the fine-grained facies of thebasin-fill aquifer might be heterogeneous and anisotropic.
In Pilot Valley, Utah (fig. 3), Duffy and AI-Hassan (1988) havedemonstrated the existence of a free-convection cell that recirculates brinesunder the lakebed towards a zone of ground-water discharge near the playamargin. A similar phenomenon might occur in the study area. Because of alack of water-level data over tirre and at various locations on and near thelakebed, however, it is not known how such a convection cell relates to thewater levels measured at Sevier Lake.
Recharge
The basin-fill aquifer is recharged near the mountain fronts frominfiltration of epherreral surface-water runoff, which is derived from snowmeltand thundersho~rs, and fran direct infiltration of precipitation. Locallyderived subsurface inflow fran the consolidated rocks of the adjacent rrountainareas also recharges the basin-fill aquifer. In addition, inflow fromadjacent areas, such as the sevier Desert, and surface-water runoff that flowsinto Sevier Lake from outside the study area contribute to the recharge of thebasin-fill aquifer.
25

T.20S.
T.21S.
T.18S.
T.19S.
WELL AND NUMBER--Four digitnumber by the site numberindicates the altitude of thehydraulic heads, in feet above
sea level; four digit number inparentheses indicates the altitudeof the equivalent freshwater hydraulichead, in feet above sea level. Thesymbol < indicates that water level isless than the number shown becausethe well was dry; the symbol>indicates the water level is greater thanthe value shown because the well wasflowing
BOUNDARY OF STUDY AREAAND DRAINAGE DIVIDE
EXPLANATION
>4,553
R.9 W.
.2 4,537(4,538)
••
• 1 4,517
I R. 10 W.
. T .•.. / 22
"S.
-- .. -T.
23S. e2
4,537(4,538)
I39 4,840 T.
24S.
e47 < 4,686
e48 4,816 T.e49 < 4,800 25
S.
R. 11 W.
4,55625 4,518
T.17S.
SEVIER LAKE
..
R. 12 W.
oo
) .• r-.
j r o•
• 0
R. 13 W.
/••
R. 14 W.I
390
00!- .( •"Y w·\" ~ )~ o •.( :r: •
.• 2327 4,365. ) ~
• i380 52'30!1. ·\ ~
u~
• a:l
I 37
•.(
380
45 L
o 1 2 3 4 5 MILESI ,', I I', I Io 1 2 3 4 5 KILOMETERS
Figure 11.--Location of wells in the Sevier Lake area and altitude of hydraulic heads.
26

Table 5.--Water levels, density, sum of constituents, altitude ofhydraulic head, and altitude of equivalent freshwater hydraulic head
for ~lls in the Sevier Lake areaSite nllTlber: Refers to hydrolOjic-<lata site nllTlber in figures 6 am II.Location: See text for explanation of nUmbering system for hydrolOjic-<lata sites.Casing: 0, depth of open role; see table 7 for additional well infonnation.Water level below land surface: Measured by the U.S. Geological Survey except when followed by an R, reported by driller or owner;
F, flowing well. Asterisk (*) indicates nonstatic water level due to evacuation of water column during cleansing, Slug-test,or sampling operations. Additional water-level infonnation in table 8.
Density: g/ml, grams per milliliter at 20 °Celsius; e, estimated value based on regression of lab-reported values of density versusdissolved solids, yielded an r2 =89.5 percent when the lab-determined density value for site 38 was deleted; L, lab-determinedvalue reported in table 2.
Sum of constituents: rng/L, milligrams per liter.Altitude of hydraulic head: Defined as the level to which water will rise in a well, and determined by subtracting the water level
from the altitude of land surface. The syntxll «) indicates that water level is less than the number shown because the wellwas dry; the symbol (» irdicates the water level is reater than the value srown because the well was flowing.
Altitude of equivalent freshwater hydraulic head: Hydraullc heads that have been corrected to equivalent freshwater heads for wellsthat yield briny water and that have density values.
Dashes (--) indicate no data.
Sitenurrber
123456789
101112151617181920212324252627282930313233343536373838394041424344454647484951
Location
(C-18-10)2Ocbd-125cad-l
(C-19- 9)29cbc-1(C-19-1O) 4cad-1
6bcd-1(C-19-10) 7bda-1
26db -1(C-19-11 )26aab--1
34dcc-134dcc-2
(C-19-12)27ddb--136bca-1
(C-20-12) 1aac-1lOdcd-1IOdcd-2lOdcd-332aaa-l32aaa-232abd-1
(C-22-12) 8bcb-19bcb--1
14a -136acc-1
(C-22-14) lcba-l(C-23-11) 7bbc-1
7bbc-27bdb-18cda-1
31a -131a -2
(C-23-12) 5cdd-l5cdd-25cdd-36ccd-16dac-16dac-1
(C-24-10)21aba-1(C-24-11) 18cac-1(C-24-12) 4aca-1
15cc -115cdc-1
(C-24-13)13aac-123ccd-134ccb-l
(C-25-11) 2bdb--1lldcd-115cda-l
(C-25-13)2Obbb-l
Altitudeof
landsurface(feet)
4,6894,5584,5534,6244,7424,6924,5454,6154,5234,5254,6954,6084,5444,5234,5244,5254,5254,5254,5504,6804,6154,5284,5174,7794,5254,5304,5504,6854,5204,5204,5244,5254,5254,6324,5604,5604,8504,6504,5254,5704,5684,5554,6154,6454,8854,8754,9504,637
Depth ofcasing or
openhole
(feet)
198.076.0
674.0152.0205.0778.0147.0150.016.0
203.0195.0195.0145.013.0
101.5203.0101.0201.0200.0196.3145.0975.00840.0 0493.022.6
203.0207.020.0
705.0 0920.0 017.0
102.0203.0560.0200.0200.091.0
147.0226.5150.0532.0145.0195.5236.0199.0197.0150.0720.0 0
Waterlevelbelowland
surface(feet)
171.6621.40F
72.35Dry R
188.5831.0 R34.052.94
37.39Dry R
180.2855.821.994.29
111.40*15.3519.71
154.36Dry
58.7110 R3 R
414 R1.204.43
18.06Dry R
10 R32 R1.537.156.60
204.25173.35*173.35*
9.96143.05
9.42Dry
80.05~.55*
178.29*211
Dry59.40Dry
17 R
Datemeasured
03-03-8103-27-8812-04-8703-03-8107- -8003-27-8807- -8003-03-8103-27-8803-27-8802-03-8203-26-8803-26-8803-26-8803-26-8803-26-8803-26-8802-()j-8403-26-8802-04-8208-05-8109-02-7808-24-78
- -3503-26-8803-26-8803-26-8807-07-8408-27-7808-28-7808-19-8303-26-8803-26-8812-02-8703-26-88
12-02-8707-29-8311-12-8702-03-8203-26-8803-26-8803-26-8812-02-8708-16-8308-01-8308-02-8309-17-78
27
Density(g/ml at20 GC)
1.021e
1.0881.046
1.04ge1.0481.0871.0511.036
1.024
1.0751.om1.054
1.0391.044
1.071L1.032e
1.020
Sum ofconst ituents
(mg/L)
21,000620
1,700
120,00069,000
100,000120,00075,00048,000
35,000
120,00097,00070,000
53,00064,000
61046,00046,0003,mO
48024,0003,3JOl,filO
Altitude ofhjUraulic
head(feet alxJve
sea level,rounded)
4,5174,537
> 4,5534,552
< 4,5374,5034,5144,5814,5204,488
< 4,5004,4284,4884,5214,5204,414*4,5104,5054,396
< 4,4844,5564,5184,5144,3654,5244,5264,532
< 4,6654,5104,4884,5224,5184,5184,4284,387*4,387*4,8404,5074,516
< 4,4204,4884,456*4,437*4,434
< 4,6ffi4,816
< 4,8004,620
Altitude ofequivalentfreshwater
hydrau 1ic head(feet alxJvesea level,rounded)
4,538
4,5224,495
4,4934,5224,5284,418*4,513
4,397
4,5254,5374,542
4,5224,527
4,389*4,388*
4,457*

The quantity of precipitation that falls on the study area averages about333,000 acre-feet per year and was estimated fran maps shCMing lines of equalprecipitation based on the 30-year average from 1931-60. Most of theprecipitation infiltrates only a few inches and is consumed byevapotranspiration.
The volume of ground-water recharge derived from precipitation wasestimated using a nethcxi adapted from Stephens am StmlSion (1978, p. 10) forbasin-fill deposits and consolidated rocks am is sumnarized in table 6. Lessthan 1 percent of the precipitation, or about 2,300 acre-feet per year,contributes to ground-water recharge in the study area. This rechargeincludes the local sources listed above: infiltration of ephemeral surfacewater runoff, direct infiltration of precipitation, and locally derivedsubsurface inflow fran consolidated rocks.
Table 6. --Estimated average annual precipitation and ground-water rechargeto basm-fill defXJsits and consolidated rocks m ~ Sevier Lake area
(Mcxiified fran Sternens and Sumsion, 1978, p. 10)
RechargeAnnual Percentage
Precipitation Average velure of ofzone precipitation Area precipitation precipitation Total
(inches (inches/feet (square miles (acre-feet) (percent) (acre-per year) per year) /acres) feet)
6-8 7 / 0.58 723/462,720 268,380 0 08-10 9 / 0.75 96/ 61,440 46,080 1 460
10-12 11 / 0.92 15/ 9,600 8,830 5 44012-16 14 / 1.17 8/ 5,120 5,990 12 72016-20 18 / 1.50 4/ 2,560 3,840 17 650
Total 846/541,440 333,120 2,300(rounded)
Based on the difference bet~en upstream (SW13) and downstream (SW14)discharge measurements (fig. 6, table 2), it is assumed that 1,600 acre-feetper year of ground water flows into the ba.sin-fill deposits in the Sevier Lakearea from the Sevier Desert. The inflow represents a minimum quantity ofground-water inflow fran adjacent areas because there ~re insufficient datato calculate total inflow across the boundary that separates the Sevier Lakearea from adjacent areas of sevier Desert (fig. 1).
28

t-bvem=nt
Horizontal and vertical ground-water flow directions are approximatedfran water-levels or hydraulic heads measured in wells canpleted in the basinfill aquifer. The direction of potential horizontal ground-water flow isperpendicular to the hydraulic-head contours and downgradient. Verticalground-water flow direction is determined from hydraulic heads measured inclosely spaced wells completed at different depths and is based on the];X)tential for ground water to flaY tavard lo~r hydraulic heads. For example,if the hydraulic head in two contiguous wells of differing depths is equal,then there is no head difference and, therefore, no potential for verticalflew. If a deeper well has a hydraulic head higher than an adjacent shallewer~ll, then the head difference indicates an upward vertical ex:xtpOnent.
For hydraulic heads in wells with high density water, located on theshoreline of Sevier lake, the estirrete of the };X)tential for vertical flow wasupward when the hydraulic heads were corrected to equivalent freshwaterhydraulic heads for c:orrparison from a canrnon datum. In several wells, theequivalent freshwater hydraulic heads ~re aoove land surface datum (table 5).Equivalent freshwater hydraulic heads were calculated for wells with highdensity water using the follaving relation:
Correction = [(TD - WL}SG]
where TO = total depth of open hole or casing, in feet;
WL = measured water level or hydraulic head, in feet; and
~ _ density of brine "tl~ - d "t f t ' unl ess.enSl y 0 wa er
Hydraulic heads measured in wells canpleted in the basin-fill deposits ofthe study area, in general, indicate a };X)tential for water to move fran areasof higher hydraulic head in the east to areas of laver hydraulic head in thewest (fig 11; table 5). The hydraulic-head values for wells near thenorthwestern, western, and southern shorelines of the lake indicate apotential for ground water to move laterally away from the lake. Thesehydraulic-head differences are difficult to rea:mcile with the hydraulic-headdifferences bet~en closely spaced ~lls such as sites 35 and 36 (fig. 11) onthe ~stern shoreline of the lake.
Discharge
Ground-water discharge fran the basin-fill aquifer in the Sevier Lakearea is by seepage to Sevier River along its downstream reaches bet~en thestudy-area boundary and Sevier Lake, by discharge from flowing wells andspr ings, by eva};X)ration from the lakebed, by evapotranspiration from areas of];ilreatq:>hytes on the margins of the lakebed, and perhap:; by subsurface outflewto adjacent areas. Ground-water discharge from the basin-fill aquifer isdetennined from IIEasured seepage to the sevier River, estimated flowing-welland spring discharge, and estimated evaporation and evapotranspiration.Subsurface outflew is SPeCulative and estirretes oould not be made.
Base flew, the sustained flaY of a stream maintained primarily by groundwater discharge to the stream, was estimated as the difference in streamflow
29

measurements at two sites on the Sevier River near the inflow to Sevier Lake(sites SWl3 and SW14, fig. 6, table 2). The measurements indicate that thereach is gaining 2.2 cubic feet per seoond, or about 1,600 acre-feet per year,which is the estimated recharge to the Sevier Lake area fran the Sevier ~sert
(see section on recharge to basin fill). Seepage to the river isrepresentative of base-flow oonditions only during early December 1987. Theannual ground-water discharge projection, based on a single base-flow estinateand representative of oonditions at one point in time, is an approxination.
Flowing-well and spring discharge, estimated to be less than 10 acre-feetper year based on discharge measurements from one well and one spring, isrelatively minor. Currently (1988), no ground water is pumped from wells inthe basin-fill aquifer in the study area.
Estimates of evaporation from the lakebed, which used rates of saltaccunulation determined by Lines (1979, p. 89) for the Bonneville Salt Flats(fig. 3), 140 miles to the north, and by Feth and Brown (1962, p. 100) for theeastern shore of the Great Salt Lake (fig. 3), 160 miles to the northeast,produced evaporation rates that ranged from about 3,800 to 4,100 acre-feet peryear for an asst.UTed freeze-free period of 125 days.
Estimates of total evapotranspiration for the sevier Lake area were madeusing data gathered from Smith Creek Valley of west-central Nevada (R.L.cannan, U.S. Geological Survey, written corrmun., 1988), which has a geografhicsetting similar to Sevier Lake with presumably similar phreatofhyte densitiesand types. The average evapotranspiration rate of 0.0043 foot per day forSnith Creek Valley was determined for predaninantly grease~ am rabbitbrushplant communities. The eddy-correlation method was used to estimate actualevapotranspiration.
Application of the Smith Creek Valley average evapotranspiration rateproduced an estinate of about 11,300 acre-feet per year for the Sevier Lakearea. For the estimate, it was assl.lIlEd that about 5 percent of the oonlakebedarea, or 21,000 acres, were occupied by fhreatophytes and that the freeze-freeperiod was 125 days (table 1). The evapotranspiration estimate includeddirect evaporation of precipitation and soil moisture, and runoff derived franprecipitation. Evapotranspiration withdrawn directly from ground water,however, may be only one-third to one-half of the total estinated using ratesestablished by cannan, or using adjustments from M:>wer and Nace (1957, p. 30)and J.R. Harrill (U.S. Geological Survey, written corrmun., 1988), about 3,700to 5,600 acre-feet per year.
Currently (1988), no water is pumped from wells in the basin-fillaquifer. As stated previously, Black Hills well is thought to be <XiTPleted inoonsolidated rocks, though it penetrates only 1 foot below the basin-filldeposits. With the anticipated completion of the Crystal Peak MineralsCorporation brine-processing facility, pumpage could range from about 3,000 to4,000 acre-feet per year from the ooarse-grained facies and about 30,000 acrefeet per year fran the fine-grained facies (Larry Sower, Crystal Peak MineralsCorp., oral corrmun., 1988).
The proposed pumping would alter the approximate steady-state conditionsthat exist at present (1988) in the basin-fill aquifer. The specific effectsof pumping depend on the quantity of water pumped from the aquifer, the
30
duration and frequency of p.mping, and the distribution of the ptmtped wells.As water is removed fram storage in the basin-fill aquifer, hydraulic headsfor water in wells can be expected to decline until a new equilibrium isestablished between discharge and recharge. A condition of disequilibrium~uld occur if the rate of discharge by p..unped withdrawals exceeds the rate ofrecharge.
Hor izontal br ine intrusion oould occur if the cone of depression around ap..unped well in the coarse-grained facies intercepts the brine in the finegrained facies of the basin-fill aquifer. The presumably small transmissivityof the material near the shoreline, however, could effectively limit thequantity of water that could move fram the fine-grained facies to the adjacentooarse-grained facies.
Transmissivity
Transmissivity of the basin-fill aquifer describes the capacity totransmit water. Transmissivity of the ooarse-grained facies was determinedfran data oollected during a short-term aquifer test performed on a 532-footdeep well. Transmissivity values of the fine-grained facies were determinedfram data fram a single-well aquifer test and from 8 slug tests of shallowwells.
A short-term, single-well aquifer test of the coarse-grained facies ofthe basin-fill aquifer, used a 532-foot deep well (site 43, figs. 6 and 11),drilled by Crystal Peak Minerals Corp::>ration (table 8). The well, perforatedfrom 420 to 500 feet (table 8), was pt.UTIped oontinuously for nearly 3 hours ata oonstant discharge of 30 gallons per minute; water levels were measuredduring drawdown and recovery. Transmissivity was determined using a relationdeveloped by Theis (1935) between residual drawdown and the ratio of t~e
since p.mping started to time after p.mping stopped (tit'). Residual drawdowndata resulted in a transmissivity estimate of 4,120 feet squared per day.Hydraulic conductivity (i.e., transmissivity divided by the thickness of theperforated interval) was 51. 5 feet per day. The aquifer-test analysis wasoonstrained by the limited duration of the test and small discharge. A longeraquifer test, using at least one observation well and a discharge well withsufficient yield to adequately stress the coarse-grained facies of the basinfill aquifer, might have provided a more representative value oftransmissivity.
A short-term single-well aquifer test of the fine-grained facies of thebasin-fill aquifer used a 226.5-foot deep well (site 41, figs. 6 and 11)dr illed by the Crystal Peak Minerals Coq:x:>ration on the lake bed. The well,perforated from 160 to 200 feet (table 8), was pumped at a graduallydecreasing discharge, which ranged from 32.6 to 27.0 gallons per minute for131 minutes. Water levels were measured during drawdown and recovery.Transmissivity, determined using the Theis (1935) residual drawdown method,was 5.2 feet squared per day; hydraulic conductivity was 0.13 foot per day.These values are typical of material that varies from clay and silt tomixtures of clay, silt, and sand (Todd, 1980, p. 72). Like the aquifer testof the coarse-grained facies, this aquifer test also was constrained bylimited duration and small discharge.
31

Fifteen slug-tests were conducted by evacuating IOClSt of the fluid in thecasing by air-lifting, using an air compressor and submerging an air linebelow the water level. The water level in the well was measured as itrecovered to the initial, pretest level. Aquifer transmissivity wasdetermined from slug-test data by matching curves sho.ving water-level reooveryas a function of time, plotted on semilogarithmic graph paper, with a set ofcomputed type curves (Cooper and others, 1967). Not all of the recoverycurves for the slug tests could be readily matched with type curves. Theusable data fram eight wells yielded transmissivity values that ranged from 1X 10⁻³ to 5 X 10⁻² foot squared per day and hydraulic cx:mductivity values thatranged from 3.3 X 10⁻⁴ to 5.0 X 10⁻³ foot per day.
Chemical quality
Suitability of water for domestic, agricultural, or industrial uses isdetermined by its chemical quality. Water in wells near Sevier lake has alarge dissolved-solids concentration that makes it suitable for brineharvesting. At increasing distances from the lake, the dissolved-solidsooncentration decreases, and the water is suitable for most domestic andagricultural uses.
'1'errperature
Temperature of ground water generally is an indication of the depth towhich the water has circulated. Elevated ground-water temperatures can becaused by subsurface heat sources that generate increased geothermalgradients. Adaptation of a thermal-spring classification developed byMundorff (1970) to ground-water systems is useful to point out anomalousground-water temperatures. This classification compares temperature ofsampled ground water with nean annual air terrperature. 'Ihermal ground waterhas a temperature 5.6 °c (10 OF) greater than the nean annual air temperature,which is about 10°C (50 OF) for the study area (table 1). Assuming a uniformgeothermal gradient (rate of tanperature increase in the earth with increasingdepth) for the study area of 1 °C per 131 feet of depth (1°F per 43 feet),the ground~ater tanperatures of five sampled sources in the Sevier Lake areaare anomalously high and could indicate either deep ground~ater circulationor undetected subsurface heat sources. The four wells and one spring thathave thermal water are at the north end of the Cricket Mountains (site 3), theIbex Well (site 27), the Black Hills Well (site 37), the Crystal Peak MineralsCorporation test well (site 43), and candland Spring (site S22) (fig. 6, table2) •
Dissolved solids
The term dissolved solids defines the quantity of dissolved material in asample of water. The quantity of dissolved solids is determined by theresidue on evaporation, dried at 180°C; or, for many waters that oontain rrorethan about 1,000 parts per million or 1,000 milligrams per liter, the sum ofdetermined constituents (O.S. Geological Survey, 1958, p. 50).
Specific conductance or electrical conductivity of aqueous solutions is afunction of terrperature, valence of dissolved ionic species, and concentrationof dissolved constituents. At small dissolved-solids concentrations,conductivity of an electrolyte is directly proportional to concentration. At
32
larger concentrations, complex ions form and cause nearly constantconductivity for increasing concentration; this precludes using conductivityfor measuring concentrations of strong brines (Whelan and Petersen, 1977, p.10). Concentrations of dissolved solids and comparable values of specificconductance for natural waters are shown at the front of the report withoonversion factors and related information.
Concentration of dissolved solids in water fram wells in and near thestudy area ranges from 480 to 120,000 milligrams per liter (table 2).Generally, smaller concentrations of dissolved solids are in water samplesfran wells canpleted in the ooarse-grained facies of the basin-fill aquifer,and larger concentrations of dissolved solids are in water from wellscompleted in the fine-grained facies of the basin-fill aquifer near theshoreline of Sevier Lake.
The large contrast of density and dissolved-solids concentration inground water in the adjacent coorse- and fine-grained facies of the basin-fillaquifer oould indicate limited ground-water movement within the aquifer.Dissolved-solids concentrations are as much as 75 times greater withindistances of less than 1 mile fran Black Hills Well (e. g ., sites 37 and 38,table 2). 9naller variations of dissolved-solids concentration exist betweenthe paired sites 12 and 15, 19 and 21, 29 and 30, and 44 and 45 (fig. 6, table2) •
water composition
Water samples collected from wells that are canpleted in the fine-grainedfacies of the basin-fill aquifer near the shoreline of Sevier Lake containlarge concentrations of sodium, sulfate, and chloride (table 2). Atincreasing distances from the shoreline, concentrations of these ionsdecrease.
The effect of mixing, longer flaY paths, and increased residence tines isillustrated by composition differences between a water sample fran JamesSpring (site S50)(fig. 6), which is in a recharge area of the San FranciscoM:>untains, and a water sample fran a well at site 43, which is topogra{i1icallyand hydrologically downgradient from James Spring. Water from the wellcontains a slightly greater concentration of sulfate and chloride and aslightly smaller concentration of calcium than does the upgradient JamesSpring.
APPROXIMATICN OF GROOND-WATER B(J))3El' <n-iPCNENI'S
A water budget is a hydrologic accounting of inflav to, outflav from, andchange in storage of water in a hydrologic system (Langbein and Iseri, 1960).'!he annual ground-water budget for the Sevier Lake area includes the followingrecharge carq;:onents: ground-water inflow fran adjacent areas, precipitation,and surface-water runoff to the lake. Discharge components of the budgetinclude: evapotranspiration, evaporation, discharge from springs, wells, andseepage to streams, and ground-water discharge to adjacent areas. Values foreach water-budget cx:xrp:ment are given to provide insight into the nature ofthe sevier Lake ground-water flow systan (fig. 12).
33

Ground-water discharge byevaporation from lakebed(GWd evap)
Ground-water dischargeby evapotranspiration fromphreatophytes (GWdET)
Ground-water discharge toadjacent areas (GWdadj)
Ground-water recharge fromsurface-water runoff tolake (GWrlake)
Ground-water rechargefrom precipitation (GWrppt)
)'o"",'--~"'" Ground-water discharge fromwells, springs, and streamreaches (GWd)
~...-- Ground-water rechargeas inflow from adjacentareas (GWradj)
FOR EQUILIBRIUM SYSTEM: RECHARGE = DISCHARGE
Recharge (acre-feet per year) Discharge (acre-feet per year)
GWr adj
GWrppt
13,000
About 2,300 GWdevap
3,700 to 5,600
3,800 to 4,100
GWrlake = Not estimated
15,300 does not equal
GWd
GWdadj
1,600
Not estimated
9,100 to 11,300
Figure 12.--Approximated water-budget components of the ground-water system.
34

Inflow to the Sevier Lake area includes ground-water recharge fromadjacent areas, precipitation that recharges the ground-water system, andrecharge from surface-water runoff to sevier Lake. Ground-water inflow franadjacent areas is at least 13,000 acre-feet per year: 11,400 in consolidatedrock and 1,600 in basin fill. The quantity of precipitation that falls on thestudy area is about 333,000 acre-feet per year, of which probably less than 1percent, or about 2,300 acre-feet per year, recharges the ground-water systan(table 6). '!he balance of the precipitation is consumed by evaporation orevapotranspiration of soil moisture in the unsaturated zone. The totaldischarge of the Sevier River at Deseret or Oasis is assumed to flow intoSevier Lake, and in most years, the discharge is negligible. Most of thesurface water that enters the lake probably evaporates before it affects theunderlying aquifers and thus, does not affect the water budget. '!he total ofall inflCM canp:ments of the ground-water budget is about 15,300 acre-feet,not including an unknown quantity of recharge fran Sevier River and sevierLake.
Outflow from the Sevier Lake area includes evapotranspiration fromI;tlreatophytes; evapxation at the surface of the lakebed; discharge fran wellsand springs, and seepage to streams; and ground-water discharge to adjacentareas. Evapotranspiration in the sevier Lake area, which asSWTeS that about 5percent of the nonlakebed is occupied by I;tlreatophytes and that the freezefree period is 125 days, is estimated to be about 11,300 acre-feet per year.Direct evapotranspiration fran ground water is perhap:; one-third to one-halfof the estimate, or approximately 3,700 to 5,600 acre-feet per year. For thelakebed, which measures 190 square miles, the annual grouoo-water dischargefran eva};X)ration was estimated to range fran about 3,800 to 4,100 acre-feetper year, using the rate of evaporation determined from salt accumulation atother playas. Discharge from wells and springs and seepage to streams isabout 1,600 acre-feet (about 10 acre-feet fran flowing wells aoo springs and1,600 acre-feet fran seepage to streams). Subsurface ground-water outflow isunknown and indeterminate from available data. The total annual outflow franthe ground-water system is estimated to be 9,100 to 11,300 acre-feet.
An exact balance of the ground-water budget was not possible because ofthe uncertainty of the assLmlptions and the range of values for each o:xrrponent.The objective was to awroximate the various canp::ments of the water budget,which serves to {Xlint out the assurrptions and the limitations of the data andareas where they could be improved. Better estimates of ground-water rechargefran Sevier River, Sevier Lake, and inflCM from adjacent areas; evaporationand evapotranspiration; and ground-water discharge to adjacent areas areneeded to rrore closely define the water budget. The problan of balancing thewater budget and final determination of whether Sevier Lake is a hydrologicsource, sink area, or has characteristics of both that could vary withclimatic conditions, cannot be resolved with available data.
SlliMARY
The Sevier Lake area of about 850 square miles in west-central utah is inthe interior draining Great Basin. '!he area is defined by the local SevierLake drainage basin in the mediate vicinity of eI;tlaneral Sevier Lake. Theplrpose of the report is to describe the baseline hydrologic conditions of thepreviously unstudied Sevier Lake area for future evaluation of potentialground-water develc:prent and for assessment of the effects of developnent.
35
Sources of surface-water inflow to the study area are the sevier Riverand local, eP1emeral streams that fl~ in response to snowmelt or rainfall.For nost of the 20th century, sevier Lake probably has been dry. 'Ihe nearlycomplete utilization of available surface-water supplies by upstream waterusers or in storage-retention facilities effectively limits the volume ofwater that flows into sevier Lake. Unusually wet climatic conditions dur ingthe early to mid-1980's, however, resulted in record runoff of about 2.27million acre-feet from 1983-87 in the sevier River and reestablished SevierLake, which reached a maximum lake level of 4,527 feet above sea level in June1985.
The water quality of the lake initially was fresh to slightly saline butbecame increasingly briny as the constituents were concentrated by evaporationand dissolution of the lakebed material. 'Ihe major oonstituents are sodium,sulfate, and chlor ide.
Ground-water occurrence in the oonsolidated, primarily carbonate, rocksof the Sevier Lake area is poorly kn~. Q1ly the Black Hills Well (site 37)is thought to be completed in consolidated rocks, trough it penetrates only 1foot bel~ the basin-fill deposits. Ground-water recharge as subsurfaceinflow from the regional flow system moves through fractures, faults, andsolution cavities in the consolidated carbonate rocks. Regional ground-waterIIDvenent in the oonsolidated rocks generally is from east to west, or fran theMilford area and the Sevier ~sert and perhap:; tCMards Tule Valley. Groundwater discharge might occur by upward leakage into the overlying basin-filldeposits of the sevier Lake area or possibly by subsurface outfl~ to adjacentareas in southern Tule Valley.
The occurrence of ground water in the basin-fill aquifer is known fromwater levels rreasured in wells that are canpleted in the basin-fill deposits.'Ihe basin-fill aquifer has been divided into two informal uni ts: the coarsegrained facies, which is at the higher altitudes of alluvial slopes, am thefine-grained facies, which is at the lower altitudes around Sevier Lake.Water levels in shall~ wells canpleted in the basin-fill aquifer near sevierLake on the northwest, west, and south are higher than water levels in wellsthat are a srort distance from the lake.
The basin-fill aquifer is recharged near the mountain fronts byinfiltration of ephemeral surface-water runoff and from direct infiltration ofprecipitation. Locally derived subsurface inflow from the consolidated rocksof adjacent rrountain areas and from adjacent areas of basin-fill deposits alsorecharges tbe basin-fill aquifer.
Hydraulic heads, in wells on the shoreline of Sevier Lake with highdensity water, were oorrected to equivalent freshwater heads for comparisonfrom a common datum. In several wells, the equivalent freshwater hydraulicheads were above the land-surface datum. 'Ihe hydraulic heads in wells nearthe northwestern, western, and southern shorelines of the lake, however,indicate a potential for ground water to nove laterally away from the lake.'Ihese hydraulic-head differences are difficult to reooncile with the hydraulichead differences between closely spaced wells, such as at sites 35 and 36(fig. 11), on the western shoreline of the lake.
Ground-water discharge from the basin-fill aquifer in the sevier Lakearea is by seepage to the Sevier River along its downstream read1es between
36

the study-area boundary and sevier Lake, by discharge from flowing wells andsprings, by evaporation fran the lakebed, and by evap:>transpiration fran areasof phreatophytes on the margins of the lakebed, and perhaps by subsurfaceoutflow to adjacent areas. Currently (1988), 00 water is p.mped fran wells inthe basin-fill aquifer, but with the anticipated completion of a brineprocessing facility, pumpage from the basin-fill aquifer could range franabout 3,000 to 4,000 acre-feet per year from the coarse-grained facies andabout 30,000 acre-feet per year fran the fine-grained facies of the basin-fillaquifer. The proposed pumping would alter the approximate steady-stateconditions that exist at present (1988) in the basin-fill aquifer. As wateris removed from storage in the basin-fill aquifer, hydraulic heads can beexpected to decline until a new equilibrium is established between dischargeand recharge. A condition of disequilibrium would occur if the rate ofdischarge by pl.Ullped withdrawalS exceeds the rate of recharge.
TransrrUssivity of the coarse-grained facies of the basin-fill aquifer wasdetermined fran data collected during a short-term aquifer test on a 532-footdeep well. Residual drav..doon data irrlicated a transmissivity of 4,120 feetsquared per day and a hydraulic corrluctivity of 51.5 feet per day.
Transmissivity values for the fine-grained facies were determined fromsingle-well aquifer test and from slug tests of shallow wells near theshoreline of the lake. Transmissivity for the single-well test was 5.2 feetsquared per day, and the hydraulic oorrluctivity was 0.13 feet per day. Theslug-test data yielded transmissivity values that ranged from 1 X 10⁻³ to5 X 10-2 foot squared per day arrl hydraulic conductivity values that rangedfran 3.3 X 10⁻⁴ to 5.0 X 10⁻³ foot per day.
The concentration of dissolved solids in water fran wells in and near thestudy area ranges fran 480 to 120,000 milligram:; per liter. Generally, waterfrom wells completed in the coarse-grained facies of the basin-fill aquiferoontains smaller concentrations of dissolved solids than does water fran wellscompleted in the fine-grained facies of the basin-fill aquifer near theshoreline of Sevier Lake. Dissolved-solids ooncentrations are as much as 75times greater within distances less than 1 mile fran the Black Hills Well.water sanples oollected fran wells near the shoreline of Sevier Lake containlarge ooncentrations of sodiLnTI, sulfate, arrl chloride.
The annual ground-water budget for the study area includes the followingrecharge components: ground-water inflow from adjacent areas, precipitation,and surface-water ruooff to the lake. Discharge components of the budgetinclude: evapotranspiration, evaporation, discharge fran springs, wells,seepage to stream:;, and ground-water discharge to adjacent areas. An exactbalance of the ground-water budget was not possible because of the uncertaintyof the assumptions and the range of values for each component. Betterestimates of ground-water recharge fran Sevier River, Sevier Lake, and infloofran adjacent areas; evaporation and evapotranspiration; and ground-waterdischarge to adjacent areas are needed to more closely define the waterbudget.
37

REFERENCES CITED
Bedinger, M.S., Langer, W.H., and Reed, J.E., 1986, Synthesis of hydraulicproperties of rocks in the Basin and Range province, southwestern UnitedStates: U.S. Geological SUrvey Water-Supply Paper 2310, p. 35-43.
case, R.W. and Cook, K.L., 1979, A gravity survey of the Sevier Lake area,Millard County, Utah: Utah Geology, v. 6, no. 1, p. 55-67.
Cooper, H.H., Bredehoeft, J.D., and Papadopulos, 1.5.,1967, Resp:mseofafinite-diameter well to an instantaneous charge of water: WaterResources Research, v. 3, no. 1, p. 263-269.
Crosby, G.W., 1973, Regional structure in southwestern Utah, in Hintze, L.F.and Whelan, J.A., eds., Geology of the Milford area:-Utah GeologicalAssociation Publication, no. 3, p. 27-32.
Currey, D.R., and Oviatt, C.G., 1985, furations, average rates, and probablecauses of Lake Bonneville expansions, stillstands, and contractionsduring the last deep-lake cycle, 32,000 to 10,000 years ago, in Kay,P.A., and Diaz, H.F., eds., Problems of and prospects for predictingGreat salt Lake levels: Pap?rs fran a conference held in salt Lake City,March 26-28, 1985, Center for Public Affairs and Administration,University of Utah, p. 9-24.
fuffy, C.J., and Al-Hassan, Sumani, 1988, Groundwater circulation in a closeddesert basin: water Resources Research, v. 24, no. 10, p. 1675-1688.
Eakin, T.E., Price, Don, and Harrill, J.R., 1976, Summary appraisals of thenation's ground-water resources-Great Basin region: U.S. GeologicalSurvey Professional Paper 813-G, 37 p.
Farnsworth, R.K., Thorrpson, E.S., and Peck, E.L., 1982, Evap::>ration atlas forthe contiguous 48 United States: u.S. National OCeanic and AtmosphericAdministration Technical Rep::>rt NWS 33, 26 p., 4 rnap:;.
Feltis, R.D., 1966, water fran bedrock in the Colorado Plateau of Utah: UtahState Engineer Technical Publication 15, 82 p.
Feth, J .H., and Broon, R.J., 1962, Method for measuring upward leakage fromartesian aquifers using rate of salt-crust accunulation: u.S. GeologicalSurvey Professional Paper 450-B, p. 100-101.
Gates, J .S., 1987, Ground water in the Great Basin part of the Basin and Rangeprovince, western Utah, in KoW, R.S., and Cohenour, R.E., eds., cenozoicgeology of western Utah: Utah Geological Association Publication 16, p.75-89.
Gates, J.S., and Kruer, S.A., 1981, Hydrologic reconnaissance of the southernGreat salt Lake Desert and SlllIlIlary of the hydrology of west-central Utah:Utah Departnent of Natural Resources Technical Publication 71, 55 p.
Gilbert, G.K., 1890, Lake Bonneville: U.S. Geological Survey Monograph 1,438 p.
38
Gwynn, J.W., 1988, Great Salt Lake brine sampling program, 1985-87: UtahGeological and Mineral Survey Open-File Report 117, 30 p.
Hem, J.D., 1985, Study and interpretation of the chemical characteristics ofnatural water: U.S. Geological Survey water-Suwly Paper 2254, 263 p.
Hintze, L.F., 1973, Geologic history of utah: Provo, Utah, Brigham YoungUniversity Geology Studies, v. 20, part 3 (July 1973), 181 p.
----- 1984, Geology of the Cricket Mountains, Millard County, Utah: U.S.Geological Survey Open-File Report 84-683, 14 p.
Hunt, C.B., 1981, ed., Pleistocene Lake Bonneville, ancestral Great Salt Lake,as described in the notebooks of G.K. Gilbert, 1875-1880: Provo, Utah,Brigham Young University Geology Studies, v. 29, part 1, 231 p.
Langbein, W.B., and Iseri, K. T., 1960, General introduction and hydrologicdefinitions: U.S. Geological Survey water-Suwly Paper 154I-A, 29 p.
Lindskov, K.L., and Kimball, B.A., 1984, Water resources and potentialhydrologic effects of oil-shale development in the southeastern UintaBasin, Utah and Colorado: U.S. Geological Survey Professional Paper1307, 32 p.
Lines, G.C., 1979, Hydrology and surface morphology of the Bonneville SaltFlats and Pilot Valley, Utah: U.S. Geological Survey Water-Supply Paper2057, 107 p.
Mitchell, G.C., and McDonald, R.E., 1987, Subsurface Tertiary strata, origin,deposi tional model, and hydrocarbon exploration potential of the sevierDesert basin, west central utah, in Kopp, R.S., and Cohenour, R.E., eds.,Cenozoic geology of western1ftah: Utah Geological AssociationPublication 16, p. 533-556.
M:x>re, D.O., 1968, Estimating rrean runoff in ungaged saniarid areas: NevadaDepartment of Conservation and Natural Resources, Water ResourcesBulletin No. 36, 11 p.
MJwer, R.W., and Nace, R.L., 1957, Water consurrption by water-loving plants inthe Malad Valley, Oneida County, Idaho: U.S. Geological Survey waterSupply Pap:!r 1412, 33 p.
Mundorff, J.C., 1970, Major thermal springs of Utah: Utah Geological andMineralogical Survey water-Resources Bulletin 13, 60 p.
Murphy, D.R., 1981, Climatic zones, in wahlquist, W.L., ed., Atlas of Utah:Provo, Utah, Brigham Young University Press, p. 54-55.
Oviatt, C.G., 1987, Quaternary geology of part of the sevier Desert, MillardCounty, Utah: utah Geological and Mineral Survey Open-File Report 106,134 p.
Richardson, E.A., Ashcroft, G. L., and Westbrook, J. K., 1981, Potentialevapotranspiration, in Wahlquist, W. L., ed., Atlas of Utah: Provo,Utah, Brigham Young University Press, p. 64-67.
39

Robinove, C.J., Langford, R.H., and Brookhardt, J.W., 1958, Saline-waterresources of North r:akota: U.S. Geological Survey Water-Supply Paper1428, 72 p.
Shultz, L.M., and Shultz, J.S., 1984, Vegetation zones in the Bonnevillebasin, in Kerns, G.J., and Kerns, R.L., Jr., eds., Geology of northwestUtah, southern Idaho, and northeast Nevl.da: Utah Geological AssociationPublication 13, p. 261-267.
Sonnenfeld, Peter, 1984, Brines and evapor i tes: New York, Academic Press,613 p.
Stephens, J.C. and Sumsion, C.T., 1978, Hydrologic reconnaissance of theDugway Valley-Governrrent Creek area, west-central Utah: Utah oepartm:mtof Natural Resources Technical Publication 59, 42 p.
Steven, T.A. and Morris, H.T., 1983, Geology of the Richfield quadrangle,west-central Utah: U.S. Geological Survey <:pen-File Rep:::>rt 83-583, 22 p.
Stevens, D.J., Brough, C.R., Griffin, R.D., and Richardson, A.E., 1983, Utahweather guide: West Jordan, Utah, Society for Applied Climatology, 46 p.
Theis, C.V., 1935, The relation between the lowering of the piezometricsurface and the rate and duration of discharge of a well using groundwater storage: American Geophysical Union Transactions, v. 16,p. 519-524.
Thanas, J. T., Mason, J. L., and Crabtree, J. D., 1986, Ground-water levels inthe Great Basin region of Nevada, Utah, and adjacent states: U.S.Geological Survey Hydrologic Investigations Atlas 694-B, 2 sheets, scale1:1,000,000.
Todd, D.K., 1980, Groundwater hydrology (2nd ed): New York, John Wiley andSons, 535 p.
U.S. Department of Commerce, 1982, Monthly normals of temperature,precipitation, and heating and cooling degree days, 1951-80, Utah:Clirnatography of the United States, no. 81, 14 p.
U.S. Geological Survey, 1958, Suggestions to authors of rep:::>rts of the UnitedStates Geological Survey (5th ed.): Washington, D.C., U.S. GovernrrentPrinting Office, 255 p.
M1elan, J .A., and Petersen, C.A., 1977, Great salt Lake, Utah: Chanica! andphysical variations of the brine, water-years 1974 and 1975: UtahGeological and Mineral Survey Water-Resources Bulletin 22, 47 p.
Woodward, L.E., 1970, Tectonic implications of structure of Beaver andnorthern San Francisco Mountains, Utah: Geological Society of ArrericaBulletin, v. 81, no. 5, p. 1577-1583.
Woolley, R.R., 1947, Utilization of surface-water resources of Sevier Lakebasin, Utah: U.S. Geological Survey water-SUwly Paper 920, 393 p.
40
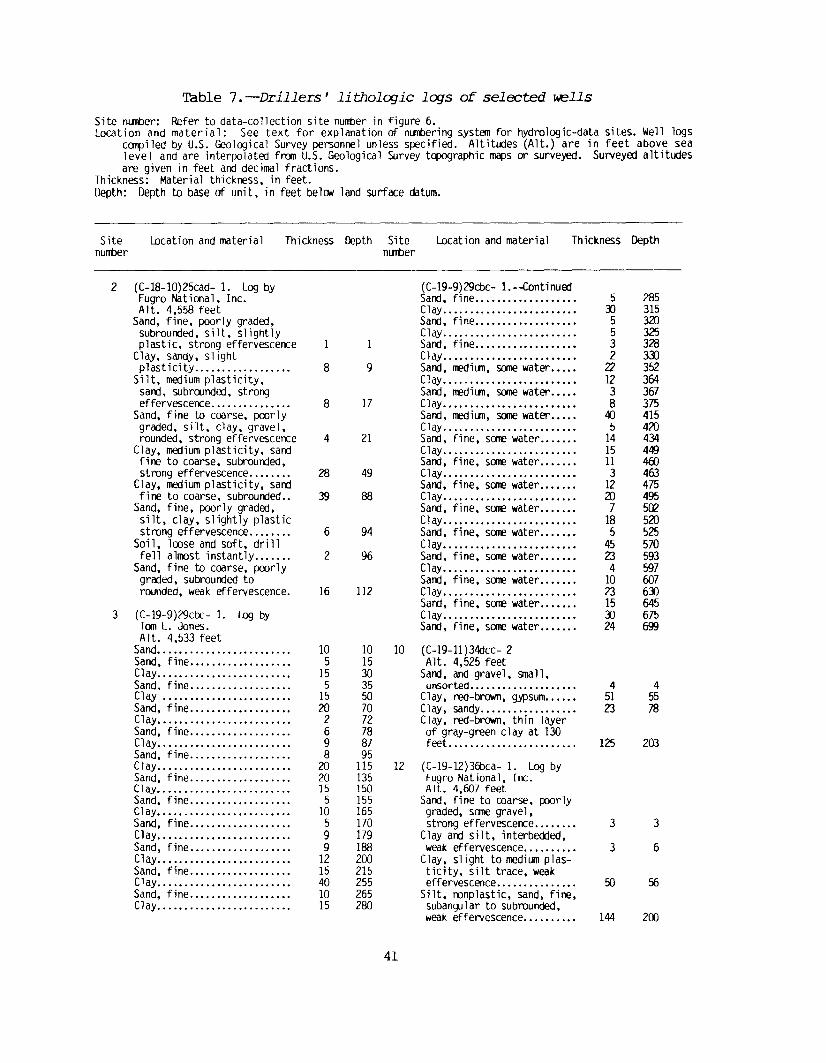
Table 7. -Drillers' li tholCX]ic lCX]s of selected rt.ells
Site number: Refer to data-collection site number in figure 6.Location and material: See text for explanation of numbering system for hydrologic-data sites. Well logs
c~iled by U.S. GeolOjical Survey personnel unless specified. Altitudes (Alt.) are in feet above sealevel and are interpolated fran U.S. Geological Survey tq:>ographic maps or surveyed. Surveyed altitudesare given in feet and decimal fractions.
Thickness: Material thickness, in feet.Depth: Depth to base of unit, in feet bela« land surface datum.
Sitenumber
Location and material Thickness Depth Site Location and materialmlmer
Thickness Depth
2 (C-18-10)25cad- 1. Log byFugro National, Inc.AlL 4,558 feet
Sand, fine, poorly graded,subrounded, silt, slightlyplastic, strong effervescence
Clay, sandy, slightp1ast ici ty•...•.•...•.......
Silt, medium plasticity,sand, subra.mded, strongeffervescence .•...•.•...••..
Sand, fine to coarse, poorlygraded, silt, clay, gravel,rounded, strong effervescence
Clay, medium plasticity, sandfine to coarse, subrounded,strong effervescence ...•••..
Clay, medium plasticity, sandfine to coarse, subrounded ..
Sand, fine, poorly graded,silt, clay, slightly plasticstrong effervescence•..•....
Soil, loose and soft, drillfell almost instantly...•...
Sand, fine to coarse, poorlygraded, subrounded torounded, weak effervescence.
3 (C-19-9)29ctx:- 1. Log byTan L. Jones.A1t. 4,533 feet
Sand•..••......•.•..•.....•..Sand, fine .Clay•..••..••.•.•....•...•..•Sand. fine .Clay ..•....•...•.•••..•••.••Sand, fine ..Clay••••....••••....•....•...Sand, fine .Clay .Sand, fine .Clay•................•.......Sand, fine ................••.Clay•.........•..............Sand, fine .Clay•.....•...•...•.•..•.••..Sand, fine ..Clay.••.•..•.•.••..•.•..•.••.Sand, fine ..Clay ..Sand, fine .Clay•...•...•.•...•....•....•Sand, fine .Clay....•....•...............
8
8
4
28
39
6
2
16
105
155
15202698
202015
510599
1215401015
(C-19-9)29cbc- 1.--ContinuedSand, fine .Clay .Sand, fine .•....••...••••.•••Clay .Sand, fine ...•.•...••.•••.•••Clay .
9 Sand, medilJll, sane water•••••Clay•.....•.•.•.•••.•.•••••••Sand, medilJll, sane water .
17 Clay .Sand, medilJll, sane water.••••Clay .
21 Sand, fi ne, SaTe water .Clay .Sand, fine, SaTe water •••..••
49 Clay ...•..•..•.•..•••.•••••••Sand, fine, SaTe water .•••.•.
88 Clay .Sand, fine, SaTe water .•.•••.Clay••.••...••..•••...•.•••••
94 Sand, fine, SaTe water .Clay .
96 Sand, fine, SaTe water ..•••.•Clay•••..•.••••.•.••.•••.••••Sand, fine, SaTe water•.•••••
112 Clay .Sand, fine, SaTe water .•.•••.Clay•...•.•..•••..•.•.•••••••Sand, fine, SaTe water •..•••.
10 10 (C-19-11)34dcc- 215 Alt. 4,525 feet30 Sand, and gravel, small,35 unsorted ....•...••••.•••.•.•50 Clay, red-brown, gypsum .70 Clay, sandy .72 Clay, red-brown, thin layer78 of gray-green clay at 13087 feet. .95
115 12 (C-19-12)36bca- 1. Log by135 Fugro National, Inc.150 AIt. 4,607 feet155 Sand, fine to coarse, poorly165 graded, sane gravel,170 strong effervescence ...•...•179 Clay and silt, interbedded,188 weak effervescence.•.•.•••.•200 Clay, slight to medium plas-215 ticity, silt trace, weak255 effervescence•.••..•....•.•.265 Silt, nonplastic, sand, fine,280 subangular to subrounded,
weak effervescence.•.••...•.
41
53J5532
221238
405
1415113
12207
185
45234
1023153J24
45123
125
3
3
50
144
2853153203253283303523643673754154204344494ff)
463475495502520525570593597607630645675699
45578
203
3
6
56
200

Table 7.--Drillers' lithologic logs of selected wells-COntinued
Site Location and material Thickness lA!pth Site Location and material Thickness DepthnunDer nmer
15 (C-20-12) 1aac- 1. Log by 21 (C-20-12)32abd- 1Fugro National, Inc. Alt. 4,550 feetAlt. 4,543.8 feet Sard, thin soil layer on top. 8 8
Sand, silty, poorly sorted ... 2 2 Clay, red, low plasticity ••. 11 25Gravel, silty, poorly Clay, red-brDlNll, thin layergrocled, strong effervescence 7 9 of gray-green clay at 40
Clay, silty, weak effer- feet. ••.••.•..•..•...•.••••• 125 If{)vescence .•.•••.•.•.•.•••..•. 10 19 Clay, alternating red-brDINll
Clay, strong effervescence... 10 29 ard gray-green•..••••••••••• 52 202Clay, medium plasticity,weak effervescence••••••..•. 30 59 25 (C-22-12) 14a -1. Log by
Clay, high plasticity, M. C. Godbe, IIIstrong effervescence ...•..•. 10 69 AlL 4,528 feet
Clay, medium plasticity, Limestone, dark gray toweak effervescence •....•.... 27 96 black, miror qJartzite peb-
Silt, nonplastic, gravel, ble gravel, quartz sardfine, angular, weak ard grit, tan and lighteffervescence......•...•.... 4 100 brown, grocles dowrward wi th
Clay, slight to medium silt and clay, gray, inter-plasticity, silt interbeds •. 50 150 bedded wj th sand, sa1ty
taste .. •t ................... l) l)17 (C-20-12)lOdcd- 2 Clay, silty, dark, carbon-
Alt. 4,524.5 feet a~eou~ .•.••.•••••••••••. :•• 10 40Clay, tan, and gravel, Clay, sllty, green-gray, slltunsorted •.•.•.•.•..•••.•••.. 5 5 ard sand, fine, silty clay
Clay, tan .................... 25 30 zone part ially cenentedClay, reddish-brown ••••••..• 71.5 101.5 with gypsum ard selenite
crystals .................... 20 0018 (C-20-12)lOdcd- 3 Sard, dark brt:l\lofl to gray,
Alt. 4,525 feet thin beds, grocling to clay,Clay, tan, and gravel, salty .....•••••••••••••••••• 20 00unsorted .•.......••.•...•••• 5 5 Clay, gray-green, sandy
Clay, tan .................... 30 35 zones, slight salt taste•••• 20 100Clay, gray-green..••.•••••••• 2 37 Clay, gray-green, and siltyClay, red-brown, some gypsum clay, brown, mottled. silty-crystals present •.•••..•.••. 53 90 sand zones, some carbon,
Clay. gray-green, with sane salty•.•..••.•••.••••••••••• 100 200interbedded red-brown clay Clay, brown, mottled, siltcontaining some gypsum.••.•. 40 130 ard sand, gray-green,
Clay, red-brown, sard, coarse 73 203 slightly salty••••.•••.••••• 20 220Clay, gray-green ard brown,
19 (C-20-12)32aaa- 1 mottled, hard, dense,Alt. 4,525 feet slightly salty.............. 20 240
Sand. gravel, clay, Clay, gray-green ard brown,unsorted .................... 1 1 alternating, mottled, mod-
Clay, tan .................... 4 5 erately hard, dense ••••••••• 80 320Clay, red-brown ....•..•.....• 40 45 Clay, sandy-silty, green-grayClay, red-brown, high ard brown, some gypsump1ast ici ty •••••.•..•••..•.•• 5 50 cenenting ••••••••••••••••••• 40 300
Clay, red, tan. intermittent Clay, silty, gray-green andgray-green clay layers •••••• 10 60 brown, occasionally mottled.
Clay, red .................... 2 62 slightly salty, dense, hard,Clay, red-brown ......•••..••• 39 101 zones of carbonacoous mater-
ial from 430-490 .•••••••.••• 158 51820 (C-20-12)32aaa- 2 Sard, fi ne, dark grily-brDINll.
Alt. 4,525 feet clay bits, gray ••••••••••••• 7 525Sand, gravel clay, Sard ard silt, brown am red-unsorted •.•.•••.•.....•....• 1 1 brown, scattered gypslJTl in
Clay, tan, gypsum present .•.. 7 8 clay..•.•..•.•••.•...•...... 50 575Clay, red, with intermittent Silt, gray-brown ...•••••••••• 5 500gray-green clay layers ...... 195.5 203.5
42
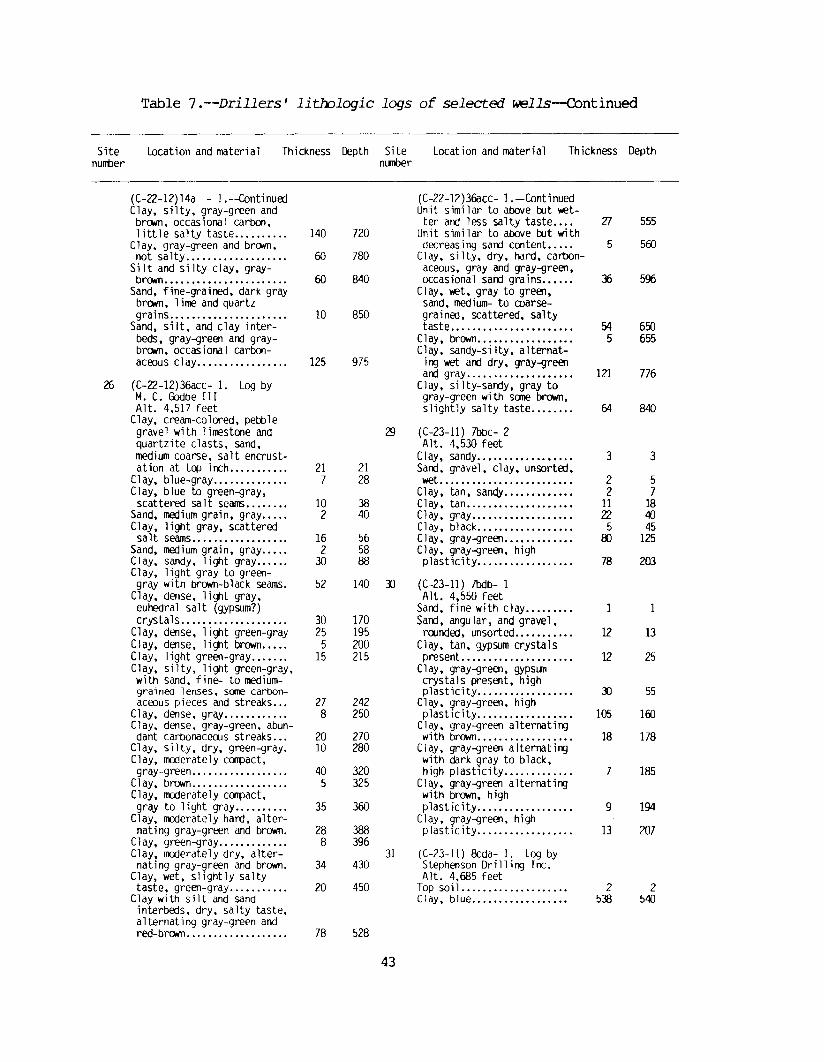
Table 7 .--Drillers' litmlogic logs of selected wells-COntinued
SitenuntJer
Location and material Thickness Depth SitenlJltJer
Location and material Thickness Depth
(C-22-12)14a - 1.--ContinuedClay, silty, gray-green andbnwn, occasional carboo,little salty taste.......... 140
Clay, gray-green and brown,not salty................... 60
Silt and silty clay. gray-brown....................... 60
Sand, fine-grained, dark graybrown, lime and quartzgrains...................... 10
Sand, silt, and clay interbeds, gray-green and graybrown, occasional carboo-aceous clay................. 125
26 (C-22-12)36acc- 1. Log byM. C. GJdbe IIIAlt. 4,517 feet
Clay, cream-colored, pebblegravel with limestone andquartzite clasts, sand,medium coarse, salt encrust-ation at top inch........... 21
Clay, blue-gray.............. 7Clay, blue to green-gray,scattered salt seams........ 10
Sand, medium grain, gray..... 2Clay, light gray, scatteredsalt seams.................. 16
Sand, medium grain, gray..... 2Clay, sandy, light gray...... 30Clay, light gray to green-gray with brown-black seams. 52
Clay, dense, light gray,euhedral salt (gypsum?)crystals.................... 30
Clay, dense, light green-gray 25Clay, dense, light brown..... 5Clay, light green-gray....... 15Clay, silty, light green-gray,with sand, fine- to mediumgrained lenses, some carbon-aceous pieces and streaks... 27
Clay, dense, gray............ 8Clay, dense, gray-green, abun-dant carbonaceoos streaks... 20
Clay, silty, dry, green-gray. 10Clay, moderately compact,gray-green. . . . . . . . . . . . . . . . . . 40
Clay, brown.................. 5Clay, moderately compact,gray to light gray.......... 35
Clay, moderately hard, alter-nating gray-green and brown. 28
Clay, green-gray............. 8Clay, moderately dry, alter-nating gray-green and brown. 34
Clay, wet, slightly saltytaste, green-gray........... 20
Clay with silt and sandinterbeds, dry, salty taste,alternating gray-green andred-brown. . . . . . . . . . . . . . . . . . . 78
(C-22-12)36acc- 1.--ContinuedUnit similar to above but wet-ter and 1ess sa1ty taste.... 27
720 Unit similar to above but withdecreas i ng sand content..... 5
780 Clay, silty, dry, hard, carbon-aceous, gray and gray-green,
840 occasional sand grains...... 36Cl ay, IrIet, gray to green,sand, medium- to coarse-
850 grained, scattered, saltytaste....................... 54
Clay, brown.................. 5Clay, sandy-silty, alternat-
975 ill] wet and dry, gray-greenand gray.................... 121
Clay, silty-sandy, gray togray-green with sane brown,slightly salty taste........ 64
29 (C-23-11) lbbc- 2AIt. 4,530 feet
Clay, sandy.................. 321 Sand, gravel, clay, unsorted,28 wet........ 2
Clay, tan, sandy...... 238 Clay, tan.................... 1140 Clay, gray.... ........ ....... 22
Clay, black.................. 556 Clay, gray-green............. 8058 Clay, gray-green, high88 plasticity.................. 78
140 30 (C-23-11) lbdb- 1Alt. 4,550 feet
Sand, fine with clay .170 Sand, angular, and gravel,195 rounded, unsorted........... 12200 Clay, tan, gypsum crystals215 present..................... 12
Clay, gray-green, gypsumcrystals present, highplasticity.................. 30
242 Clay, gray-green' high250 plasticity....... ...... ..... 105
Cl ay, gray-green alternat ill]270 with brown.................. 18280 Clay, gray-green alternating
with dark gray to black,320 high plasticity............. 7325 Clay, gray-green alternating
with brown, high360 plasticity.................. 9
Clay, gray-green, high388 plasticity...... 13396
31 (C-23-11) 8cda- 1. Log by430 Stephenson Drilling Inc.
AIt. 4,685 feet450 Top soiL................... 2
Clay, blue.................. 538
528
43
555
500
596
6~
655
776
840
3
57
184045
125
203
13
25
55
100
178
185
194
207
2540
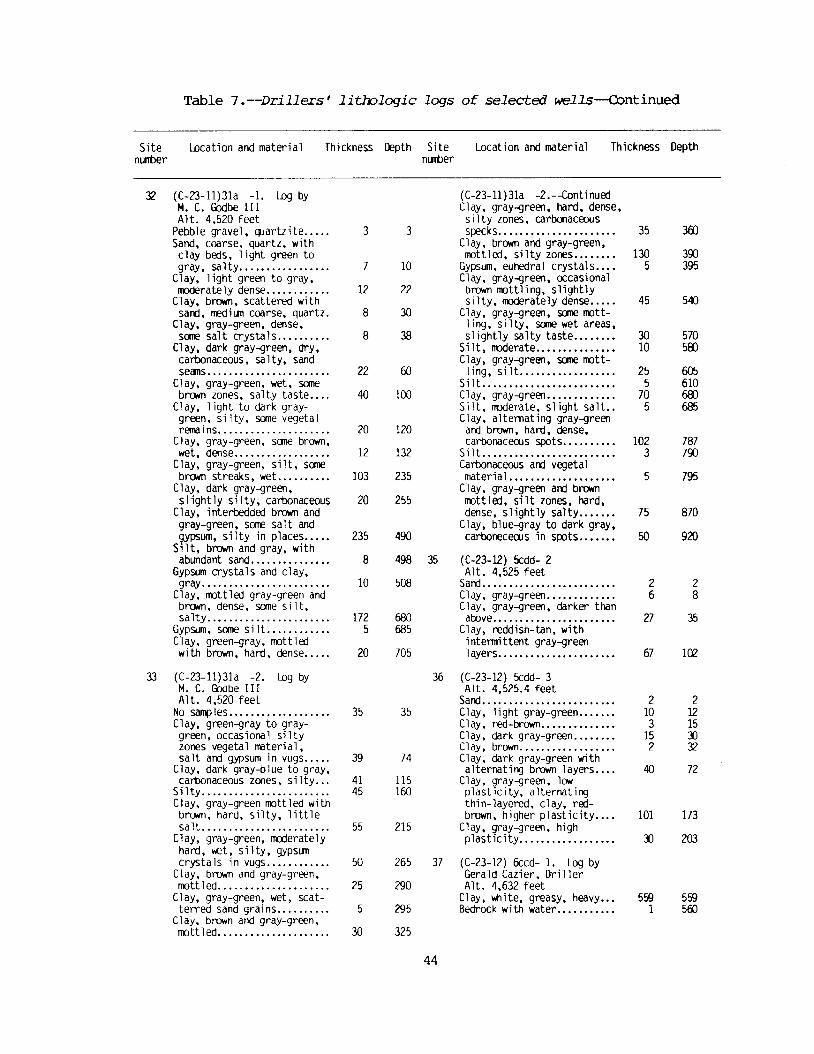
Table 7 .--Drillers' lithologic logs of selected wells-continued
Sitenurtber
Location and material Thickness Depth SitenlJllber
Location and material Thickness Depth
32 (C-23-11)31a -1. Log byM. C. (i)dbe IIIAlt. 4,520 feet
Pebble gravel, quartzite....•Sand, coarse, quartz, withclay beds, light green togray, salty..•.•............
Clay, light green to gray,moderately dense .•..........
Clay, brown, scattered withsand, rredium coarse, quartz.
Clay, gray-green, dense,some salt crystals ..•....•.•
Cl ay, dark gray-green, dry,carbonaceous, sa lty, sandseiJTIs ..•.•.•••.•..•.•.•.••.•
Clay, gray-green, wet, somebrown zones, salty taste ....
Clay, light to dark graygreen, silty, some vegetalremains....•................
Clay, gray-green, same brawn,wet, dense .
Clay, gray-green, silt, somebrown streaks, wet .....•••••
Clay, dark gray-green,slightly silty, carbonaceous
Clay, interbedded brown andgray-green, some salt andgypsum, silty in places•••••
Silt, brown and gray, withabundant sand .....•••..•..•.
Gypsum crysta1sand clay,gray.....•....•.........•.•.
Clay, mottled gray-green andbrown, dense, some si It,salty..•....................
Gypsum, some si 1t. .Clay, green-gray, mottledwith brown, hard, dense.....
33 (C-23-11)31a -2. Log byM. C. (i)dbe I IIA1t. 4,520 feet
No ~les ...•...............Clay, green-gray to graygreen, occasional siltyzones vegetal material,salt and gypsum in vugs.....
Clay, dark gray-blue to gray,carbonaceous zones, si lty ...
Si lty..........•.............Clay, gray-green mottled withbrown, hard, silty, littlesalt .•.....•.•.•......•..•..
Clay, gray-green, moderatelyhard, I>€t, silty, gypsumcrystals in vugs ..•.........
Clay, brawn and gray-green,mottled.....•.•..•...••.....
Clay, gray-green, wet, scatterred sand grains •.•....•.•
Clay, brown and gray-green,mottled ....•.•.•.•..•.•••...
3
7
12
8
8
22
40
20
12
103
20
235
8
10
1725
20
35
39
4145
55
50
25
5
30
(C-23-11)31a -2.--ContinuedClay, gray-green, hard, dense,silty zones, carbonaceous
3 specks...................... 35Clay, brawn and gray-green,mottled, silty zones........ 130
10 Gypsum, euhedral crystals.... 5Clay, gray-green, occasional
22 brown mottling, slightlysilty, moderately dense..... 45
30 Clay, gray-green, some mott-ling, silty, some wet areas,
38 slightly salty taste........ 30Si lt, rroderate............... 10Clay, gray-green, some mott-
60 ling, silL................. 25Si It...... .••.••••••.•••.•.•• 5
100 Clay, gray-green............. 70Silt, rroderate, slight salt.. 5Clay, alternating gray-green
120 and brawn, hard, dense,carbonaceous spots.......... 102
132 Si It......................... 3Carbonaceous and vegetal
235 materiaL................... 5Cl ay, gray-green and brown
255 mottled, silt zones, hard,dense, slightly salty....... 75
Clay, blue-gray to dark gray,490 carboneceous in slXltS....... 50
498 35 (C-23-12) 5cdd- 2AIt. 4,525 feet
508 Sand......................... 2Cl ay, gray-green............. 6Clay, gray-green, darker than
680 above. •. . . . •. •. . •. ••••••. . •• 27685 Clay, reddish-tan, with
intermittent gray-green705 1ayers. . . •. . . •• . . •• •. •. •••• . 67
36 (C-23-12) 5cdd- 3Alt. 4,525.4 feet
Sand......................... 235 Cl ay, 1ight gray-green....... 10
Clay, red-brawn.............. 3Cl ay, dark gray-green........ 15Clay, brawn.................. 2
74 Clay, dark gray-green witha1ternat i ng brown 1ayers.. . . 40
115 Clay, gray-green, low160 plasticity, alternating
thin-layered, clay, red-brawn, higher plasticity.... 101
215 Clay, gray-green, highplasticity....... .•.. •.•. ••• 1)
265 37 (C-23-12) 6ccd- 1. Log byGerald Cazier, Driller
290 Alt. 4,632 feetClay, white, greasy, heavy... 559
295 Bedrock with water........... 1
325
44
3ffl
3~
395
540
570500
605610600685
7877~
795
870
920
28
35
102
212151)32
72
173
203
5595f:()

Table 7 .--Drillers' lithologic logs of selected wel1s-continued
Site Location and materialnuntler
Thickness Depth Site Location and materialnllTtler
Thickness Depth
~ (C-23-12) 6dac- 1Alt. 4,560 feet
Soil, sandy .Clay, light brown ..Clay, light gray-green .Clay, gray-green, withintermittent thin brawnclay layers .
Clay, blue-green, highplasticity ..
Clay, alternating brown andgray-green, 1ayers 2 to 3feet thick, high plasticity.
Clay, gray-green, highplasticity•.•.•............•
Clay, brown .Clay, gray-green..•..•.•.•...Clay, gray-green, withintermittent brown layers ...
Clay, gray-green, whitecrystals present •.•...•.....
Clay, gray-green..........•..
39 (C-24-10)21aba- 1. Log byStephenson Drilling Inc.Alt. 4,850 feet
Top soil ..Clay, gray, water at 12 ft .••Sand, fine grained, black,with clay interbeds.........
Sand, coarse grained••.••••••Sand, fine-grained, and clay
interbedded .Clay, gray ..
41 (C-24-12) 4aca- 1 Log byB&B Drilling Co.AlL 4,525.0Top soil ..Clay, blue .Clay, white .Clay with hard and softgrave1 streak •.•.•..•.•••.•.
43 (C-24-12) 15OOc- 1. Log byB and BDrilling Co.Alt. 4,568 feet
Clay and rock ..Clay, white ..Clay, blue, with white streaksLava, decomposed, waterbearing.....•........•......
44 (C-24-13) 13aac- 1. Log byFugro Nat iooa1, Inc.Alt. 4,555.4 feet
Silt, high plasticity, someclay and sand, weakeffervescence•...••••.•.•...
Gravel, sandY, poorly graded,fine to coarse sand, silt ...
Sand, silty, poorly graded •..Clay, medium to highplasticity, some sand •••••..
5 53 87 15
50 65
10 75
38 113
17 1308 1386 144
48 192
2 1947 201
6 66 12
43 5513 68
23 91159 250
12 123 15
157 172
54.5 226.5
8 8392 400
75 475
57 532
6 6
10 165 21
80 101
45
46
47
(C-24-13)I3aac- 1.--ContinuedSilt, non plastic, clay, sand
weak effervescence, sanegypsum clasts •..•••.•.•.••••
(C-24-13)23ccd- 1. Log byFugro National, Inc.AlL 4,615 feet
Silt, high plasticity, clay,carbonate and evaJX)riteclasts•••.••.••..•••..••.•..
Clay, medium plasticity, subangular to subrounded sandclasts, dessicatioo cracks••
Sand, fine, poorly sorted •••.Silt and sand, caliche (Stage
II) ••••••.•.••.•.•••••••••••Clay, medium plasticity,sand, fine, subangular tosubrounded .
Sand, fine to medium grained,weak effervescence....••.•.•
(C-24-13)34ccb- 1. Log byH.L. Hall and H.M. RobisonAlL 4,645 feet
Clay, light-colored .Clay, light brOOl .Clay, brown .Clay, gray, with gypsum••••••Clay, brown .Sand, fine, water bearing ••••Gravel, hard, JX)rphyritic
(conglOOl€rate?) .Gravel, water bearing •.•••.•.Unreported•••.•......•.••••••
(C-25-11) 2bdb- 1AlL 4,885 feet
Silt, sandy, tan ..Sand and graveL ..Sand, coarse, angular .Clay, brown to reddish-brownwith intermittent thinlayers.•...••••..•.•••.•••••
Clay, alternating betweengray-green to reddishbrown ........•.••.•.•...•.•.
Sand, medium to coarse••.•••.Sand, medium, some gravel ....Clay, sandy, gray-green••••.•Clay, gray-green .Sand, gray .•.•...•..••••...•.Sand, coarse, some gravel .••.Gravel, some sand .•...•.•••••Clay, gray-green,intermittent gravel .••••••••
Clay, gray-green ..Gravel •.•..••...••••.••••••••Sand, coarse, gray•.••••.••••Clay, sandy, gray-green••••••Clay, gray-green .Clay, some graveL .Sand•••••••••••••••••••••••••
49 150
2.5 2.5
2.5 54.5 9.5
2 11.5
1f:B 100.5
20 200.5
35 3565 10041 1419 150
00 23J4 234
36 27020 29)4 294
2 22 42 6
1:3 44
19 6310 7317 9)5 957 1025 1073 1103 113
13 12614 1404 1446 150
10 10032 1924 1964 200
45

Table 7 .--Drillers' lithologic logs of selected wells-COntinued
SitenUn'Der
Location and material Thickness Depth Sitenumber
Location and material Thickness Depth
48 (C-25-11)11dcd- 1Alt. 4,875 feet
Topsoil, dark brawn •.•.......Sand, medium to coarse,dark brawn ..
Clay, sandy, reddish-brown .Clay, light gray ..Clay, sandy, reddish-brown .Clay, alternating gray-green
and reddish-brown ...•••.•..•Clay, reddish-brawn withintermittent thin layers ofmedium sand•......•..••••••.
Clay, alternating gray-greenand reddish-brown .....•.•.••
Clay, gray to gray-green,intermittent black, organicstreaks.•.•••.•.•.•..•.•••••
Clay, alternating gray-greenand reddish-brown .........•.
Clay, gray-green ..Clay, gray-green, sane lightgray to white selenitecrystals, intermittentblack organic streaks andblack sand .............•..•.
49 (C-25-11)15cda- 1A1t. 4,950 feet
Topsoil, sandy, tan ..•••••.••Sand, fine, reddish-brown ••••Sand, fine, some gravel,unsorted .....•.••.•..•.•.•..
Clay, dry, ~ery, fine tocoarse sand, unsorted .•.••..
Clay, reddish-brown, withvariable amounts of finesand, angular, unsorted...••
Clay, silty, reddish-brown .•.Clay, light tan .Clay, silty, reddish-brown,dry, crumbles eas i ly .
Clay, sandy, reddish-brown .Clay, alternating withlayers of fine sand, sanegravel, reddish-brown •..•••.
Silt, with fine sand, sameclay, reddish-brawn.•....•..
Sand, fine, appears cemented,some graveL ..
51 (C-25-13)20bbb- 1. Log byM. C. COObe IIIAlt. 4,637 feet
Silt, reddish, gray-brown,dilflll·· ••..........••........
Silt, clayey, gray, slightlydilflll, water table(?) ..•.•..•
7
3103
14
23
10
20
13
4248
7
13
24
23
2484
299
8
5
10
10
10
7
10202337
60
70
90
103
145193
200
14
28
51
758387
116125
133
138
148
10
20
46
(C-25-13)2Obbb- 1--ContinuedClay, slightly silty, gray,wet. ....•.....••••...••••••.
Silt, 1ight gray to redbrawn, clay, gray, quart-zite fragrrents .
Clay, slightly silty, lightgray .....•.••.••..•.••••...•
Clay, slightly silty, greengray, mottled with lightred clay .
Clay, reddish-brawn, mottledwith gray-{}reen clay,slightly sllty, slightlysalty .•••..•.••••.•.•••.•...
Clay, greenish-gray, occasirna1 reddi sh-brown mottling, slightly salty•••.••••
Clqy, brown, mottled ••••••.•.Clay, greenish-gray, occasiooal reddish-brown mott-ling, slightly salty••••...•
Clay, gray-green, lenses ofsilt and fine sand, nonsalty, streaks of carbon•••.
Clay, greenish-gray, occasional reddish-brown mottling, slightly salty•.•.•.•.
Cl ay, dark gray-green,carbonacews ••.•••••••••••.•
Clay, greenish-gray, occasional reddish-brown mottling, slightly salty••.•••.•
Sand, fine, and silt, darkgray and gray-green, bedsof silt, yellaw, and clay,gray, little or no salttaste ..........•..•..•••••••
Sand, fine- to mediumgrained, dark gray•.••.•••••
Quartzite and limestone pebble and cebb1e fragnents,dark gray to black, sand,fine to coarse, and siltbeds, minor clay seams,possible alluvial fan encroachment from east, non-salty .
Quartzite pebbles, dark redbrawn to white, glassy,sand, fine to coarse, subangu 1ar to subrounded, nonsalty to slightly salty,more sandy at 580-590, 62G655, sparse clay seams at660-695•........•.•..••••••.
2
8
28
40
22
505
75
5
fi)
10
35
50
26
129
155
22
J)
58
120
170175
250
255
315
325
410
436
565
720

Table 8.-Records of selected .....ells, springs, and surface-water sites
Site number: Refer to data-collection site number in figure 6; SW, surface-water data-collection site; S, spring data-collectionsite; all others, data were collected from wells.
Location: See text for explanatioo of nuntering systen for hydrologic-data sites.I)"ner or user: Last known owner or user; USAF, U.S. Air Force; USGS, U.S. Geological Survey; BLM, U.S. Bureau of Lard Managenent;
LOOT, Utah Department of Transportation; CPMC, Crystal Peak Minerals Corp.Casing: Total depth, NA indicates not applicable because there was an open hole and had Il) casing. Finish, letter irdicates type
of finiSh: P, perforated-casing interval; S, screened-casing interval; 0, open hole.Water level: Below or above (-) land surface. F, flowing well. Measured by the U.S. Geological Survey except when followed by an
R, reported by driller or owner. Asterisk (*) irdicates nonstatic water level due to evacuation of water column durin~cleansing, Slug-test, or sampling operations. See table 5 for water levels corrected to equivalent freshwater hydraullc heads.
Altitude of land surface: Surveyed altitudes given in feet ard decimal fractions. Altitudes interpolated from U.S. Geolo;}icalSurvey 7.5- and 15-minute tOp:lgraphic maps are given in feet above sea level.
Use of water: Z, plugged by the State of Utah; N, not used except for periodic water-level measurenents ard water s~l ing by U.S.Geolo;}ical Survey as part of a statewide observation~ell network; L, livestock; D, could not locate during field inventory,probably destroyed; T, test; A, abanooned.
Remarks and other available data: D, driller's 10;} in files of the U.S. Geological Survey; C, chemical analysis (table 2); L,drillers' log (table 7); X, Iooell destroyed by shore ice or by other natural Iilenamenoo between date of last rreasurement andJanuary 21, 1986.
Dashes (--) indicate Il) data.
Water levelAltitude Remarks
Casing Below Date of andOwner Depth land rreasured land Use other
Site Location or Date of Total surface surface of availablenumber user canpleted hole Diameter depth Finish datum (feet above water data
(feet) (i nches) (feet) (feet) (feet) sea level)
(C-18-10)20cbd- 1 USAF 1979 200.0 2.0 198.0 P 178.0-198.0 171.78 00-07-80 4,689 Z D171.66 03-03-81
2 25cad- 1 USGS 1980 112.0 2.0 76.0 P 56.0-76.0 23.13 00-07-80 4,558 N CL22.88 03-03-8122.34 03-29-8422.25 00-0&-8421.95 00-09-8521.73 03-01-8621. 73 00-12-8621.50 00-10-8721.42 12-04-8721.40 03-27-88
3 (C-19- 9)29cbc- 1 BLM 1940 m.o 1.25 674.0 3.24 03-03-81 4,553 L CLF 12-04-87
4 (C-19-10) 4cad- 1 USAF 1979 156.0 2.0 152.0 P 132.0-152.0 68.85 00-07-80 4,624 Z D72.35 03-03-81
5 6bcd- 1 USAF 1980 205.0 2.0 205.0 P 182.0-202.0 DRY R 07----80 4,742 D D
6 7bda- 1 LOOT 1951 778.0 8.0 778.0 P 523.0-778.0 188.96 03-04-75 4,692 T C188.97 00-2&-75188.83 03-02-76188.90 00-22-76188.77 03-02-77188.75 00-30-77188.75 02-28-78188.81 00-07-78189.00 03-0&-79189.08 00-24-79188.90 03-11-80188.93 03-03-81189.71 00-03-81188.89 03-1&-82189.05 00-07-82188.91 03-08-83188.90 00-08-83188.77 03-14-84
47

Table 8.--Records of selected wells, sprin;;s, and surface-water sites-eontinued
Water levelAltitude Ranarl<s
Casing Be10« Date of andOtmer Depth 1aIII rreasured land Use other
Site Location or Date of Total surface surface of availablenLJTt)er user c~1eted role Di ameter depth Finish datum (feet atxlve water data
(feet) (inches) (feet) (feet) (feet) sea level)
6 (C-19-10) 7bda- I-Continued 100.97 O9-lXi-84100.78 09-05-85100.73 03-01-86100.58 03-10-86100.81 08-12-86100.78 08-25-86100.74 06-29-87100.80 08-17-87100.78 09-10-87100.85 09-22-87100.79 12-01-87100.58 03-27-88
7 26db - 1 USAF 1~ 150.0 2.0 147.0 P 127.0-147.0 31. OR 07----80 4,545 D D
8 (C-19-11)26aab- 1 USAF 1979 150.0 2.0 150.0 P 130.0-150.0 ]).28 08-07-80 4,615 Z D34.05 03-03-81
9 34dcc- 1 USGS 1!E2 16.4 2.0 16.0 2.86 06-29-87 4,523 N C2.95* 07-02-872.76 08-20-872.74 09-22-872.98 12-01-872.94 03-27-88
10 34dcc- 2 USGS 1~3 203.0 2.0 203.0 S 200.0-203.0 37.13 02-12-84 4,525 N a..37.34 01-21-8637.56 05-18-8737.63 06-29-8737.24* 09-22-8737.43 12-01-8737.39 03-27-88
11 (C-19-12)27ddb- 1 USAF 1~ 200.0 2.0 195.0 P 177 .0-195.0 DRY R 02-03-82 4,695 Z D
12 36tx:a- 1 USGS 1979 200.0 2.0 195.0 P 177 .0-195.0 100.42 08-07-80 4,600 N a..100.29 03-03-81175.32 03-27-84100.43 O9-lXi-84100.37 09-00-85100.32 03-01-86100.33 08-12-86100.29 07-01-87100.28 08-18-87100.19* 09-22-87100.28 12-01-87100.28 03-26-88
SWl3 (C-19-10)22ddb- 1 4,535 N C; SevierRiver nearculvertson oountyroad
SWl4 (C-20-10) 6dd - 1 4,533 N C; SevierRiver atIOOUth
15 (C-2O-12) 1aac- 1 USGS 1979 150.0 2.0 145.0 P 127.0-145.0 56.67 08-07-80 4,544 N a..56.64 03-03-8156.79 07-22-8255.38 03-27-8455.64 08-12-86
48

Table 8.--Records of selected wells, springs, and surface-water sites-eontinued
Water levelAltitude Remarks
Casing Below Date of and(Wner ~pth land rreasured land Use other
Site Location or Date of Total surface surface of availablenllllber user canp1eted hole Diameter depth Finish datum (feet alx>Ve water data
(feet) (inches) (feet) (feet) (feet) sea level)
15 (C-2O-12) 1aac- 1--Continued 56.08 07-01-8756.00 08-18-8756.04 09-22-8755.99 12-01-8755.82 03-26-88
16 (C-2O-12)lOdcd- 1 USGS 1~2 13.0 2.0 13.0 -- 2.01 02-12-84 4,523 N C3.87* 12-01-871.99 03-26-88
17 lOdcd- 2 USGS 1~3 101.5 2.0 101.5 S 98.5-101.5 1.43 02-12-84 4,524 N Cl1.27 01-21-863.71 08-18-874.30 09-23-874.27 12-01-874.29 03-26-88
18 lOdcd- 3 USGS 1~3 203.0 2.0 203.0 S 200.G-203.0 24.32 02-12-84 4,525 N Cl14.35 01-12-86
102.15* 07-01-87142.21* 09-23-87111.40* 03-26-88
19 32aaa- 1 USGS 1~3 101.0 2.0 101.0 S 98.G-101.0 13.84 02-CXi-84 4,525 N Cl9.14 01-21-86
13.49 05-18-8714.55 07-01-8715.85 12-03-8715.35 03-26-88
20 32aaa- 2 USGS 1~3 203.5 2.0 201.0 S 198.G-201.0 19.71 02-CXi-84 4,525 N XL
21 32abd- 1 USGS 1~3 202.0 2.0 200.0 S 197.G-200.0 152.68 02-CXi-84 4,5~ N Cl153.46 01-21-86153.52 05-18-87154.49 07-01-87155.03 08-19-87156.43* 09-23-87154.84 12-03-87154.36 03-26-88
S22 (C-21-10) 13baa-S1 BlJ.1 09-21-87 5,7CXJ L C; CandlandSpring
23 (C-22-12) 8bcb- 1 USAF 1979 201.3 2.0 196.3 P 178.1--196.3 DRY 02-04-82 4,600 Z D
24 9bcb- 1 USAF 1979 150.0 2.0 145.0 P 127.G-145.0 58.71 08-OS-81 4,615 Z D
25 14a - 1 CPMC 1978 975.0 5.0 NA 0 NA lOR 09-02-78 4,528 AT L
26 36acc- 1 CPMC 1978 840.0 5.0 NA 0 NA 3R 08-24-78 4,517 AT L
27 (C-22-14) 1cba- 1 BlJ.1 1935 515.0 6.25 493.0 414R -- -- 35 4,779 N C; IbexWell
28 (C-23-11) 7bbc- 1 USGS 1~2 22.6 2.0 22.6 S 21.2-22.6 0.70 02-05-84 4,525 N C-1.34 01-21-861.16 05-19-871.78 06-lJ-872.44* 08-21-872.58* 1O-CXi-871.79 12-03-871.20 03-26-88
49

Table 8. --Records of selected wells, spriD}s, and surface-water sites-COntinued
Water levelAltitude Ra'narks
Casing Below Date of and~er ~pth laro neasured land Use other
Site LDcation or Date of Total surface surface of availablemlltler user c~1eted role Diameter depth Finish datum (feet above water data
(feet) (inches) (feet) (feet) (feet) sea level)
29 (C-23-11) 7bbc- 2 USGS 1~3 203.0 2.0 203.0 S 200.0-203.0 5.70 08-21-86 4.53) N a.5.74 10-00-875.13 12-03-874.43 03-26-88
30 7lx:lb- 1 USGS 1~3 207.0 2.0 207.0 S 204.0-207.0 17.53 02-05-84 4.5~ N a.15.95 01-21-8615.47 05-19-8715.48 06-3)-8718.05* 08-21-8718.53* 10-00-8718.33* 12-03-8718.06* 03-26-88
31 8cda- 1 BlM 1~ 540.0 6.6 20.0 0 20.0 DRY R 07-07-84 4.685 T L
32 31a - 1 lYMC 1978 705.0 5.0 NA 0 NA lOR 08-27-78 4.520 AT L
33 31a - 2 lYMC 1978 920.0 5.0 NA 0 NA 32R 08-28-78 4.520 AT L
34 (C-23-12) 5cdd- 1 USGS 1~2 17.0 2.0 17 .0 S 14.0-17.0 1.53 08-19-83 4.524 N X
35 5cdd- 2 USGS 1~3 102.0 2.0 102.0 S 99.0-102.0 10.69 02-00-84 4.525 N a7.40 01-21-869.34 05-18-87
10.10 07-01-8710.77* 08-20-8711.07* 09-24-8710.85 12-03-877.15 03-26-88
36 5cdd- 3 USGS 1~3 203.0 2.0 203.0 S 200.0-203.0 5.01 02-00-84 4.525 N a.5.87 01-21-864.85 05-18-875.31 07-01-878.63 08-20-879.81 09-24-87
10.56 12-03-876.60 03-26-88
37 6ccd- 1 BIJ.1 1945 560.0 6.0 560.0 -- 204R 02-04-46 4.632 L 0.; Black204.00 05-18-87 Hills Well204.07 07-01-87204.06 08-19-87204.20 09-24-87204.25 12-02-87
38 6dac- 1 USGS l!1l3 200.0 2.0 200.0 S 197.0-200.0 157.00 02-06-84 4.560 N a.167.67 01-21-86168.59 05-18-87168.78 07-01-87172.79* 08-19-87179.93* 09-24-87177.75* 12-03-87173.35* 03-26-88
39 (C-24-10)21aba- 1 BlM 1959 250.0 6.0 91.0 P 50.0- 84.0 9.96 12-02-87 4.8~ L a.; BlackRock well
50

Table 8.--Records of selected wells, springs, and surface-water sites-continued
Water levelAltitude Ranarks
Casing Below Date of andI),rmer ~pth land rreasured land Use other
Site LDcation or Date of Total surface surface of availablemnt>er user COOlP1eted hole Diameter depth Fi ni sh datum (feet aoove water data
(feet) (inches) (feet) (feet) (feet) sea level)
40 (C-24-11)18cac- 1 USAF 1~ 150.0 2.0 147.0 P 127.0-147.0 142.39 08-05-81 4,6!lJ Z D143.59 02-10-83143.05 07-29-83
41 .(C-24-12) 4aca- 1 lYMC 1!138 226.5 12.0 226.5 P 160.0-200.0 9.42 11-12-87 4,525 T L
42 15cc - 1 USAF 1~ 150.0 2.0 1!lJ.0 P 130.0-150.0 DRY 08-05-81 4,570 Z DDRY 02-03-82
43 15cdc- 1 lYMC 1!137 532 6.0 532 P 420.0-500.0 00.41 11-13-87 4,568 T Q00.05 03-26-88
44 (C-24-13)13aac- 1 USGS 1979 150.0 2.0 145.0 P 127.0-145.0 96.79 08-05-81 4,555 N Q96.96 02-04-8296.99 09-05-8497.11 09-04-8596.99 05-19-8797.05* 06-Il-87
100.12* 12-03-87!13.55* 03-26-88
45 23ccd- 1 USGS 1979 200.5 2.0 195.5 P 177.5-195.5 177.94 08-04-81 4,615 N Q178.02 02-03-82177.68 09-05-84177.51 09-04-85177.75 08-27-86177.39 05-19-87177.58 06-Il-87178.53* 11-11-87178.35* 12-03-87178.29* 03-26-88
46 34ccb- 1 BLM 1934 294.0 8.0,6.0 236.0 o 236.0 212.1 10-13-72 4,645 L Q; Wah211 12-02-87 Wah Well
47 (C-25-11) 2bdb- 1 USGS 1!133 199.0 2.0 193.0 S 196.0-199.0 DRY 08-16-83 4,885 N L
48 llck::d- 1 USGS 1~3 197.0 2.0 197.0 S 194.0-197.0 59.40 08-01-83 4,875 N L
49 15cda- 1 USGS 1!133 150.0 1.25 1!lJ.0 P 140.0-150.0 DRY 08-02-83 4,9!lJ N L
S!lJ (C-25-12)3Oddb-Sl 10-05-87 6,6Il L C; JcrnesSpring
51 (C-25-13)20bbb- 1 CPMC 1978 720.0 5.0 0 17R 09-17-78 4,637 AT L
51


