squalene recovery from palm fatty acid distillate using ... (04) 2012/51 ifrj 19 (04) 2012...
TRANSCRIPT

© All Rights Reserved
*Corresponding author. Email: [email protected]
International Food Research Journal 19(4): 1661-1667 (2012)Journal homepage: http://www.ifrj.upm.edu.my
1Norhidayah, S., 1*Baharin, B. S., 1Hamed, M. and 2Zaidul, I. S. M.
1Departmentof Food Technology, Faculty of Food Science and Technology, Universiti Putra Malaysia, 43400 UPM Serdang, Selangor D.E., Malaysia
2Department of Pharmaceutical Technology, Kulliyyah of Pharmacy, International Islamic University Malaysia, Kuantan Campus, Jalan Sultan Ahmad Shah, Bandar
Indera Mahkota, 25200 Kuantan, Pahang Darul Makmur, Malaysia
Squalene recovery from palm fatty acid distillate using supercritical fluid extraction
Abstract
The objective of this research is recovery of squalene from palm fatty acid distillate (PFAD) using supercritical fluid extraction (SFE). The extraction process was performed by using the SFE and recovered squalene was analyzed from total lipid extracts using HPLC. A central composite design was used to study the effect of SFE variables namely pressure (X1) from 200 to 400 bar and temperature (X2) from 40 to 600C on the total lipid extracts (Y1) and squalene concentration (Y2) and optimize the SFE conditions. The nonlinear regression equations were significantly (p < 0.05) fitted for both responses with high R2 (> 0.965), which had no indication of lack of fit. The results indicated that a combined pressure (200 bar) and temperature (500C) was predicted to provide the optimum region in terms of total lipid extracts (13.84 ± 0.52%) and squalene concentration (418.31 ± 18.40 ppm) studied.
Introduction
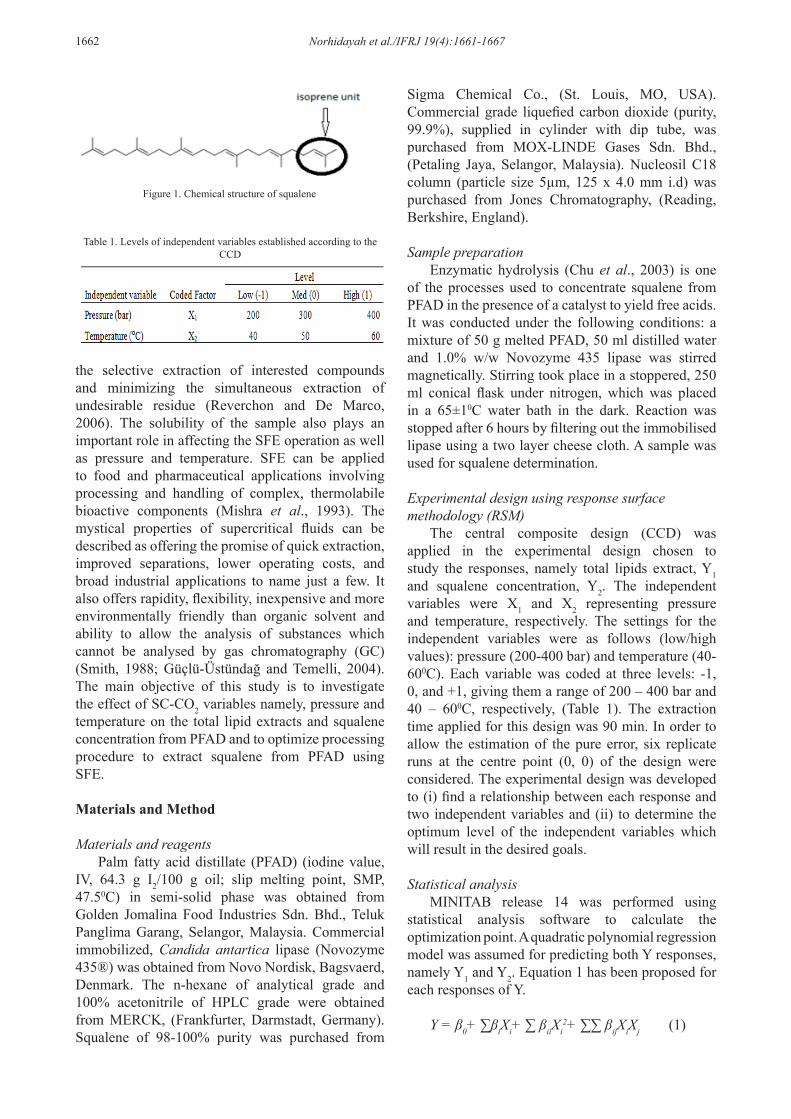
Squalene is a natural lipid belonging to the triterpene hydrocarbon group (2,6,10,15,19,23-hexamethyltetracosa-2,6,10,14,18,22-hexane) with a symmetrical 30-carbon polyprenyl compound and containing six isoprene units (Bhattacharjee and Shingal, 2003). The chemical structure of squalene is given in Figure 1. It is a colourless oil that extracts in semi-solid phase with faint odour and taste (Bhattacharjee and Shingal, 2003). Apart from that, it is low density and lighter than water with a specific gravity of 0.9 (Channon, 1926).
Squalene is known as a biochemical intermediate synthesis of cholesterol and other steroids (Redyy and Couvreur, 2009). Sixty percent of dietary squalene is absorbed and distributed in human tissue (Vazquez et al., 2007). In human, squalene is synthesized in the liver and the skin, and then transported in the blood (Reddy and Couvreur, 2009). Squalene is used in clinical and daily usage such as detoxification factor, skin and eye antioxidant, provide cells with oxygen, bactericidal and fungicidal agent, antistatic and emollient in pharmaceutical and cosmetics, fine chemical, magnetic tape and also as low temperature lubricants (Bahttacahrjee and Shingal 2003).
The name squalene was given because of its occurrence in shark liver oil (Squalus spp.), which is
the richest and primary source of squalene (Vazquez et al., 2007). However, the limitation of squalene usage is because of the uncertainty of its availability as a result of international concern to protect marine animal (Bondioli et al., 1993). Squalene can be found as a minor constituent in plant oils such as olive oil, palm oil, amaranth oil, wheat germ oil and also in vegetable oil (Bhattacharjee and Shingal, 2003). However, squalene content in olive, wheat germ and rice bran oils are in the 0.1 – 0.7% ranges which are not high enough to be considered as a viable source (Schnetzler and Breene, 1994).
It was reported palm fatty acid distillate (PFAD) contains high amount of squalene up to 1.03% w/w more than other common vegetable oil (Posada et al., 2007). PFAD is a by-product of physical refining of palm oil and it could become one of the most valuable sources of squalene. Approximately 3.66 tonnes PFAD are produced for every 100 tonnes of crude palm oil (Chu et al., 2004). In 2002, Malaysia produced 500 metric tons of PFAD from crude palm oil (Sundram et al., 2002).
SFE can be defined as a process of separating multi components mixture into two different types which are component volatiles and specific interactions between the mixture component and the supercritical fluid solvent (McHugh, 1990). SFE operating conditions are chosen in order to achieve
Keywords
Squalenepalm fatty acidHPLC
Article history
Received: 1 August 2011 Received in revised form: 12 December 2011Accepted:12 December 2011
1662 Norhidayah et al./IFRJ 19(4):1661-1667
the selective extraction of interested compounds and minimizing the simultaneous extraction of undesirable residue (Reverchon and De Marco, 2006). The solubility of the sample also plays an important role in affecting the SFE operation as well as pressure and temperature. SFE can be applied to food and pharmaceutical applications involving processing and handling of complex, thermolabile bioactive components (Mishra et al., 1993). The mystical properties of supercritical fluids can be described as offering the promise of quick extraction, improved separations, lower operating costs, and broad industrial applications to name just a few. It also offers rapidity, flexibility, inexpensive and more environmentally friendly than organic solvent and ability to allow the analysis of substances which cannot be analysed by gas chromatography (GC) (Smith, 1988; Güçlü-Üstündağ and Temelli, 2004). The main objective of this study is to investigate the effect of SC-CO2 variables namely, pressure and temperature on the total lipid extracts and squalene concentration from PFAD and to optimize processing procedure to extract squalene from PFAD using SFE.
Materials and Method
Materials and reagentsPalm fatty acid distillate (PFAD) (iodine value,
IV, 64.3 g I2/100 g oil; slip melting point, SMP, 47.50C) in semi-solid phase was obtained from Golden Jomalina Food Industries Sdn. Bhd., Teluk Panglima Garang, Selangor, Malaysia. Commercial immobilized, Candida antartica lipase (Novozyme 435®) was obtained from Novo Nordisk, Bagsvaerd, Denmark. The n-hexane of analytical grade and 100% acetonitrile of HPLC grade were obtained from MERCK, (Frankfurter, Darmstadt, Germany). Squalene of 98-100% purity was purchased from
Sigma Chemical Co., (St. Louis, MO, USA). Commercial grade liquefied carbon dioxide (purity, 99.9%), supplied in cylinder with dip tube, was purchased from MOX-LINDE Gases Sdn. Bhd., (Petaling Jaya, Selangor, Malaysia). Nucleosil C18 column (particle size 5µm, 125 x 4.0 mm i.d) was purchased from Jones Chromatography, (Reading, Berkshire, England).
Sample preparationEnzymatic hydrolysis (Chu et al., 2003) is one
of the processes used to concentrate squalene from PFAD in the presence of a catalyst to yield free acids. It was conducted under the following conditions: a mixture of 50 g melted PFAD, 50 ml distilled water and 1.0% w/w Novozyme 435 lipase was stirred magnetically. Stirring took place in a stoppered, 250 ml conical flask under nitrogen, which was placed in a 65±10C water bath in the dark. Reaction was stopped after 6 hours by filtering out the immobilised lipase using a two layer cheese cloth. A sample was used for squalene determination.
Experimental design using response surface methodology (RSM)
The central composite design (CCD) was applied in the experimental design chosen to study the responses, namely total lipids extract, Y1 and squalene concentration, Y2. The independent variables were X1 and X2 representing pressure and temperature, respectively. The settings for the independent variables were as follows (low/high values): pressure (200-400 bar) and temperature (40-600C). Each variable was coded at three levels: -1, 0, and +1, giving them a range of 200 – 400 bar and 40 – 600C, respectively, (Table 1). The extraction time applied for this design was 90 min. In order to allow the estimation of the pure error, six replicate runs at the centre point (0, 0) of the design were considered. The experimental design was developed to (i) find a relationship between each response and two independent variables and (ii) to determine the optimum level of the independent variables which will result in the desired goals.
Statistical analysisMINITAB release 14 was performed using
statistical analysis software to calculate the optimization point. A quadratic polynomial regression model was assumed for predicting both Y responses, namely Y1 and Y2. Equation 1 has been proposed for each responses of Y.
Y = β0+ ∑βiXi+ ∑ βiiXi2+ ∑∑ βijXiXj (1)
Figure 1. Chemical structure of squalene
Table 1. Levels of independent variables established according to the CCD

Norhidayah et al./IFRJ 19(4):1661-1667 1663
Where β0 is an intercept; βi, first-order model coefficient, βii, quadratic coefficient for the ith variable, βij, interaction coefficient for the interaction of variables i and j; Xiand Xj are independent variables (Choon-Hui et al., 2009). The model was evaluated using the coefficient of determination (R2) and the analysis of variance (ANOVA). Contour plots were developed using the fitted full quadratic polynomial equations obtained by holding one of the independent variables at a constant value and changing the level of the other variables (Chu et al., 2003).
Verification of modelExperiments for optimum point were performed
in triplicate and each set of yields were averaged. The result were then test using two sample t-test at the least significant difference at the 95 % confident level was calculated for each yield.
Supercritical fluid extractionThe experimental setup for the supercritical fluid extraction
(SFE) process is shown in Figure 2. It is consisted of a 50 ml volume extractor vessel (model EV-3, JASCO Corporation, Tokyo) with 13 mm diameter and 320 mm height, high-pressure pump (model PU-1580, JASCO Corporation, Tokyo), automated back pressure regulator (model BP-1580-81, JASCO Corporation, Tokyo) and a chiller (Yih Der, B/L-730).
The liquid CO2 was compressed to the desired pressure and then continuously pumped through the extractor at 3 ml/min for 90 min extraction time. The extraction occurred during the continuous extraction until the desired time was completed. The use of rigid materials such as glass beads with the sample allowed a proper flow rate of CO2 and it also can maintain the desired permissibility of the particle (Wang and Weller, 2006). Meanwhile glass wool was used at the both inlet and outlet of the vessel to prevent any possible carryover of solid material. In order to maintain the desired condition of the extraction, the
extraction vessel was equipped with a temperature controller and pressure valves at both inlet and outlet. The extraction product was only collected at the end of the experiment via a valve which was located at the bottom of the separator and the total amount of solute collected was weighed using a balance (Mettler Toledo, model AG 204) with an accuracy of ± 0.0001g.
Result and Discussion
Model fittingThe matrix of optimisation is shown in Table 2.
All experiments were conducted in random order. Parameter ranges were made based on the preliminary study of the extraction process using SC-CO2. The response surface analysis allowed the development of the polynomial regression relationship where each response variable (Yi) was assessed as a function of pressure (X1) and temperature (X2).Table 3 presents the estimated regression coefficients of the response models, along with the corresponding R2 values and lack of fit tests.
Table 3 shows the significant (p < 0.05) regression relationship between the independent variables (pressure and temperature) and the responses (total lipid extracts and squalene concentration). The response surface analysis offered high R2 values ranging from 0.965 to 0.991 (Table 3). It indicates that at least 95% of the variation of the response variables could be accurately explained by the reliable regression models relating the independent variables (pressure and temperature) and responses (total lipid extracts and squalene concentration). Therefore, this finding exhibits a satisfactory fitness of the response surface models employed for describing the response variations as a function of two independent variables (pressure and temperature) (Table 3). These indicate that the generated models sufficiently explained the data variation and significantly represent the actual relationships between the reaction parameters.
According to the Table 4, the main effect of pressure and temperature had significant (p < 0.05) effects on the total lipid extracts and squalene concentration. It shows the highest R2 and p values for lack of fit test and lowest p value for regression for full quadratic regression model compared to other regression model. It should be noted that the polynomial regression equation is significant (p < 0.05) only for a selected range (Hamed et al., 2007). It does not exist in the factor ranges and cannot be extrapolated beyond these ranges (Montgomery, 2001). As shown in Table 4, both main effects of pressure and temperature had the most significant
Figure 2. Schematic diagrams of supercritical carbon dioxide extraction (Zaidul et al., 2007)

1664 Norhidayah et al./IFRJ 19(4):1661-1667
(p < 0.05) effect on total lipid extracts (Y1) and squalene concentration (Y2).Therefore, pressure and temperature should be considered as critical parameter in order to extract total lipid and squalene. The interaction effect of pressure and temperature also significantly (p < 0.05) affected both response variables (Table 4).
Response analysisEffect of temperature on total lipid extracts and squalene concentration
Figures 3, show the effects of pressure and temperature on total lipids extracts and squalene concentration, respectively. It shows that total lipid
extracts and squalene concentration are strongly nonlinear in the studied independent variable ranges. Figure 3 (a) presents the effect of temperature on total lipid extracts at 40, 50 and 60 0C and constant pressure of 200, 300 and 400 bar. Reverchon and De Marco (2006) reported, the tendency of compounds to be extracted passing through the supercritical fluid will increase with the increasing temperature. This is because the increase in temperature can increase the vapour pressure of oil since more molecules have enough energy to escape from the oil at high temperature.
According to the Figure 3 (a), the total lipid extracts had increased with combined effects of pressure and temperature. The result shows that the extraction yield increased as temperature increased from 40 to 600C which could indicate that temperature enhances desorption of the oil from the PFAD into the CO2. This can be explained in a way that increasing temperature increases the vapour pressure of the oil. Thus enhancing the contact between the oil and SC-CO2 (Reverchon and De Marco, 2006).
Figure 3 (b) presents the effect of temperature on squalene concentration. Density of CO2 at constant pressure decreases with increasing temperature and hence reduces the solvent power of SC-CO2. Roop et al. (1989) reported a moderate increase in temperature can lead to a large decrease in SC-CO2 density, with a consequent reduction in oil solubility. The result shows squalene concentration decreased as the temperature was increased from 40 to 600C
Table 2. Matrix of the CCD
* central point for centre composite design (CCD)
Table 3. Regression coefficients, R2, adjusted R2, probability values, and lack of fit for two dependent variablesa
aKey: bi the estimated regression coefficient for the main effects; bii, the estimated regression coefficient for the quadratic effects; bij, the estimated regression coefficient for the interaction effects; 1, pressure and 2, temperature. bSignificant (p < 0.05). cNo significant (p > 0.05)
Table 4. F ratio and p value for each independent variable effects in the polynomial response surface modelsa
aKey: X1 and X2 the main effect of pressure and temperature, respectively. X12 and X2
2 the quadratic effect of pressure and temperature, respectively. X1X
2 the interaction effect of pressure and temperature. bSignificant at p < 0.05
Figure 3(a). Response surface plot for the effect of pressure and temperature on total lipid extract (%)
Figure 3(b). Response surface plot for the effect of pressure and temperature on squalene concentration (ppm)

Norhidayah et al./IFRJ 19(4):1661-1667 1665
at constant pressure. Squalene concentration had decreased gradually with increasing temperature. It proves that the fluid solvating power decreased with the increase in temperature.
Effect of pressure on total lipid extracts and squalene concentration
Figure 3 (a) presents the effect of pressure on total lipid extracts. The result shows the total lipid extracts increases with increasing pressure from 200 to 400 bar and with increasing temperature at constant pressure. It proves that, at a constant temperature, an increase in the pressure will increase the density of the SC-CO2, hence increasing the solvent strength of SC-CO2. Luque De Castro et al. (1994) reported that, the distance between the molecules decreased as the density increased. Thus, the interaction between the oil and CO2 increased, leading to greater solubility of the analytes in CO2. An increase in pressure will also accelerate mass transfer oil into the solvent in the supercritical extractor vessel system and improve the extraction yield.
In contrast, the increase in pressure as well
as the temperature increase lead to a decrease in squalene concentration (Figure 3 (b)). Therefore, it is concluded that the squalene concentration is negatively influenced by the pressure and temperature. The positive effect of pressure could be due to the selectivity of SC-CO2 for squalene is decreasing, as there is an increased possibility of co-extraction of other hydrocarbons at high pressure. This might be because increasing pressure will cause the increase in fluid density, which alters solubility of solute. As an example, Gomes et al. (2007) found that the oil solubility will improve when the CO2 density increased with the rise in pressure. On comparison, squalene extracts from yeast using SC-CO2 at 150 and 250 bar were colourless to pale yellow and less viscous and at 350-355 bar, the extract was distinctly brownish and more viscous (Bhattacharjee and Shingal, 2003). The results also show the colour and viscosity of total extracts obtained at 200 and 300 bars was pale yellow and less viscous. In contrast, at pressure 300 to 400 bars, the colour was strong yellow to brownish and more viscous compared to the total extracts less than 300 bar. This suggests the presence of other compounds in the total extracts when the extract pressure was increased up to 300 bar.
Optimization conditionGraphical and numerical optimization were
carried out to determine an optimum set level of pressure and temperature resulting in the desirable total lipid extracts and squalene concentration. There are a number of combinations of pressure and temperature that could give minimum total lipid extracts with the highest concentration of squalene. A numerical optimization was also carried out to determine the exact value of multiple response optimization resulting in the desirable goals. The multiple response optimization shows that the overall optimum region was achieved at pressure of 200 bar and temperature 500C (Figure 4). Under this optimum condition, the corresponding predicted response value for total lipid extracts is 14.24% and squalene concentration is 438.16 ppm (Figure 5).
Verification of the ModelTable 5 shows the experimental and predicted
values. The experimental response values were found to be in agreement with the predicted values. There are no significant (p > 0.05) difference between the experimental and predicted values. The results indicated that the corresponding experimental value for total lipid extracts and squalene concentration were 13.84 ± 0.52% and 418.31 ± 18.40 ppm,
Table 5. Experimental and predicted values for the response variablesa
aY0, experimental value; Yi, predicted value; and Y0-Yi, residue. bNo significant (p>0.05) difference between experimental (Y0) and predicted (Yi)
Figure 4. Response optimization of the effects of 200 bar and 50ºC on total lipid extract (%) and squalene concentration (ppm)

1666 Norhidayah et al./IFRJ 19(4):1661-1667
respectively. From the optimum region, the closeness between the experimental and the predicted values from the model verified the accuracy of the response surface models fitted to the experimental data.
Conclusion
As a novel extraction method, SFE of total lipid extracts and squalene concentration was optimized by central composite design. The lowest total lipid extracts (13.84 %) with a highest squalene concentration (418.31 ppm) were obtained at 200 bar and 50 0C for a 90 min extraction time. Based on the analysis of variance (ANOVA), pressure and temperature had a significant effect on the total lipid extracts and squalene concentration. Results of this study can be used as a guide for a pilot scale production of squalene from PFAD using SFE for commercialization purpose. Pressure swing technique which is pressurization-depressurization steps can be applied in SFE process. This will be able to reduce the amount of CO2 used and increase the efficiency of the extraction process.
Acknowledgements
This work was financially supported by Research University Grant Scheme, University Putra Malaysia
References
Bondioli, P., Mariani, C., Lanzani, A., Fedeli, F. and Muller, A. 1993. Squalene recovery from olive oil deodorizer distillates. Journal of American Oil Chemists’ Society 70: 763–766.
Bhattacharjee, P. and Singhal, R. S. 2003. Extraction of squalene from yeast by supercritical carbon dioxide. Journal of Microbiology and Biotechnology 19: 605-608.
Channon, H. J. 1926. The biological significance of the unsaponifiable matter of oils: Experiments with the unsaturated hydrocarbon, squalene (spinacene). Journal of Biochemistry 20(2): 400-408.
Choon-Hui, T., Hasanah, M. G., Ainie, K., Chin-Ping, T. and Abdul, A. A. 2009. Extraction and physicochemical properties of low free fatty acid crude palm oil. Journal of Food Chemistry 113: 645-650.
Chu, B. S., Quek, S. Y. and Baharin, B. S. 2003.Optimisation of enzymatic hydrolysis for concentration of vitamin E in palm fatty acid distillate. Journal of Food Chemistry 8: 295-302.
Gomes, P. B., Mata, V. G. and Rodrigues, A. E. 2007. Production of rose geranium oil using supercritical fluid extraction. Journal of Supercritical Fluids 41: 50-60.
Güçlü-Üstündağ, Ö. And Temelli, F. 2004. Correlating the solubility behaviour of minor lipid components in
supercritical carbon dioxide. Journal of Supercritical Fluids 31: 235-253.
Hamed, M., Chin, P. T., Nazimah, S. A. H. and Salmah, Y. 2007. Modeling the relationship between the main emulsion components and stability, viscosity, fluid behaviour, -potential, and electrophoretic mobility of orange beverage emulsion using response surface methodology. Journal of Agricultural and Food Chemistry 55: 7659-7666.
Kelly, G. S. 1999. Squalene and its clinical uses, Alternative Med. Rev. 4: 29-36.
Leng, C. C. S., Baharin, B. S., Man, Y. C. and Tan, C. P. 2008 Optimisation of enzymatic hydrolysis for concentration of squalene in palm fatty acid distillate. Journal Science of Food and Agriculture 88: 1512-1517.
McHugh, M. A. 1990. Biotechnology and food process engineering; Supercritical fluid Extraction, p. 203-212. Maryland: IFT.
Mishra, V. K., Temelli, F. and Ooraikul, B. 1993. Extraction and purification of ~0-3 fatty acids with an emphasis on supercritical fluid extraction. Food Research International 26: 217 -226.
Montgomery, D. C. 2001. Design and analysis of experiments, p. 455-492. 5th ed.; New York: Wiley.
Posada, L. R., Shi, J., Kakuda, Y. and Xue, S. J. 2007.Extraction of tocotrienols from palm fatty acid distillates using molecular distillation. Journal of Separation and Purification Technology 57: 220-229.
Pourmortazavi, S.M. and Hajimirsadeghi, S.S. 2007. Supercritical fluid extraction in plant essential and volatile oil analysis. Journal of Chromatography A. 1162: 2-24.
Reddy, H. L. and Couvreur, P. 2009. Squalene: A triterpene for use in disease management and therapy. Advanced Drug Delivery Review 61: 1412-1426.
Reverchon, E. and De Marco, I. 2006. Supercritical fluid extraction and purification of natural matter. Journal of Supercritical Fluids 38: 146–166.
Roop, R.K., Akgerman, A., Dexter, B.J. and Irvin, T.R. 1989. Extraction of phenol from water with supercritical carbon dioxide . Journal of Supercritical Fluids 2: 51-56.
Schnetzler, K. A. and Breene, W. M. 1994. Food uses and amaranth product research: a comprehensive review. In Amaranth: Biology, Chemistry, and Technology; Paredes-Lopez, O., Ed.; CRC Press: Boca Raton, FL 155-184.
Smith, R. M. 1988. Supercritical fluids chromatography. p. 2-3. Cambridge: The Royal Society of Chemistry.
Smith, T. J., Yang, G. Y., Seril, D. N., Liao, J. and Kim, S. 1998. Inhibition of 4- (methylnitrosamino)-1-(3-piridil)-1-butanone-induced lung tumorigenesis by dietary olive oil and squalene, Carcinogenesis 19: 703–706.
Temelli, F. 2009. Perspectives on supercritical fluid processing of fats and oils. Journal of Supercritical Fluids 47: 583-590.
V´azquez, L., Torres, C. F., Fornari, T., Se˜nor´ans, F. J. and

Norhidayah et al./IFRJ 19(4):1661-1667 1667
Reglero, G. 2007. Recovery of squalene from vegetable oils sources using countercurrent supercritical carbon dioxide extraction. Journal of Supercritical Fluids 40: 59-66.
Wang, L. and Weller, C.L. 2006. Recent advances in extraction of nutraceutical from plants. Trends in Food Science and Technology 17: 300-312.
Zaidul, I. S. M., NikNorulaini, N.A., Mohd. Omar, A. K., Sato, Y. and Smith Jr., R.L. (2007). Separation of palm kernel with supercritical carbon dioxide using pressure swing technique. Journal of Food Engineering 81: 419-428.