sqm-lu-dl operator’s manual - bunker.co.uk sqm-lu-dl users manual.pdf · 2 measurements the...
TRANSCRIPT
SQM-LU-DLOperator’s Manual
Copyright 2005 - 2014
Company information
Mailing address Unihedron4 Lawrence AvenueGrimsby, Ontario L3M 2L9Canada
Telephone (905) 945-1197
Fax (905) 945-6770
Website unihedron.com
Email [email protected]

Contents
1 Introduction . . . . . . . . . . . . . . . . . . . . . . . . . . . . . . . . . . . . . . . . . . . . . . . . . . . . . . . 81.1 QuickStart . . . . . . . . . . . . . . . . . . . . . . . . . . . . . . . . . . . . . . . . . . . . . . . . . . . . . 8
1.1.1 Other software . . . . . . . . . . . . . . . . . . . . . . . . . . . . . . . . . . . . . . . . . . . . . . . 91.1.2 FITS integration . . . . . . . . . . . . . . . . . . . . . . . . . . . . . . . . . . . . . . . . . . . . . . 9
2 Measurements . . . . . . . . . . . . . . . . . . . . . . . . . . . . . . . . . . . . . . . . . . . . . . . . . . . . . . 102.1 Getting accurate readings . . . . . . . . . . . . . . . . . . . . . . . . . . . . . . . . . . . . . . . . . . . . . 11
2.1.1 Seeing conditions . . . . . . . . . . . . . . . . . . . . . . . . . . . . . . . . . . . . . . . . . . . . . . 112.1.2 Light pollution . . . . . . . . . . . . . . . . . . . . . . . . . . . . . . . . . . . . . . . . . . . . . . . 112.1.3 Other luminance scales . . . . . . . . . . . . . . . . . . . . . . . . . . . . . . . . . . . . . . . . . . 12
3 Theory of operation . . . . . . . . . . . . . . . . . . . . . . . . . . . . . . . . . . . . . . . . . . . . . . . . . . . 143.1 Light measurement . . . . . . . . . . . . . . . . . . . . . . . . . . . . . . . . . . . . . . . . . . . . . . . . . 143.2 Communication to the PC . . . . . . . . . . . . . . . . . . . . . . . . . . . . . . . . . . . . . . . . . . . . . 14
4 Specifications . . . . . . . . . . . . . . . . . . . . . . . . . . . . . . . . . . . . . . . . . . . . . . . . . . . . . . . 15
5 Hardware connections . . . . . . . . . . . . . . . . . . . . . . . . . . . . . . . . . . . . . . . . . . . . . . . . . . 175.1 Battery operation . . . . . . . . . . . . . . . . . . . . . . . . . . . . . . . . . . . . . . . . . . . . . . . . . . 175.2 Diagnostic LED . . . . . . . . . . . . . . . . . . . . . . . . . . . . . . . . . . . . . . . . . . . . . . . . . . . 19
6 Software development . . . . . . . . . . . . . . . . . . . . . . . . . . . . . . . . . . . . . . . . . . . . . . . . . . 206.1 Writing your own software interface . . . . . . . . . . . . . . . . . . . . . . . . . . . . . . . . . . . . . . . 206.2 Pascal . . . . . . . . . . . . . . . . . . . . . . . . . . . . . . . . . . . . . . . . . . . . . . . . . . . . . . . . 21
7 Unihedron Device Manager . . . . . . . . . . . . . . . . . . . . . . . . . . . . . . . . . . . . . . . . . . . . . . 227.1 Getting UDM . . . . . . . . . . . . . . . . . . . . . . . . . . . . . . . . . . . . . . . . . . . . . . . . . . . . 227.2 Installation . . . . . . . . . . . . . . . . . . . . . . . . . . . . . . . . . . . . . . . . . . . . . . . . . . . . . 22
7.2.1 System requirements . . . . . . . . . . . . . . . . . . . . . . . . . . . . . . . . . . . . . . . . . . . . 227.2.2 Windows . . . . . . . . . . . . . . . . . . . . . . . . . . . . . . . . . . . . . . . . . . . . . . . . . . 227.2.3 Mac . . . . . . . . . . . . . . . . . . . . . . . . . . . . . . . . . . . . . . . . . . . . . . . . . . . . . 227.2.4 Linux . . . . . . . . . . . . . . . . . . . . . . . . . . . . . . . . . . . . . . . . . . . . . . . . . . . . 22
7.3 Operation . . . . . . . . . . . . . . . . . . . . . . . . . . . . . . . . . . . . . . . . . . . . . . . . . . . . . . 237.3.1 Start up . . . . . . . . . . . . . . . . . . . . . . . . . . . . . . . . . . . . . . . . . . . . . . . . . . . 237.3.2 Main screen . . . . . . . . . . . . . . . . . . . . . . . . . . . . . . . . . . . . . . . . . . . . . . . . . 237.3.3 Main menu . . . . . . . . . . . . . . . . . . . . . . . . . . . . . . . . . . . . . . . . . . . . . . . . . 247.3.4 File menu . . . . . . . . . . . . . . . . . . . . . . . . . . . . . . . . . . . . . . . . . . . . . . . . . . 24
7.4 Information tab . . . . . . . . . . . . . . . . . . . . . . . . . . . . . . . . . . . . . . . . . . . . . . . . . . . 307.5 Log Continuous . . . . . . . . . . . . . . . . . . . . . . . . . . . . . . . . . . . . . . . . . . . . . . . . . . . 307.6 Calibration tab . . . . . . . . . . . . . . . . . . . . . . . . . . . . . . . . . . . . . . . . . . . . . . . . . . . 327.7 Report Interval tab . . . . . . . . . . . . . . . . . . . . . . . . . . . . . . . . . . . . . . . . . . . . . . . . . 337.8 Firmware tab . . . . . . . . . . . . . . . . . . . . . . . . . . . . . . . . . . . . . . . . . . . . . . . . . . . . 347.9 Configuration tab . . . . . . . . . . . . . . . . . . . . . . . . . . . . . . . . . . . . . . . . . . . . . . . . . . 357.10 Data Logging tab . . . . . . . . . . . . . . . . . . . . . . . . . . . . . . . . . . . . . . . . . . . . . . . . . . 36
3
Contents
7.11 Simulation Tab . . . . . . . . . . . . . . . . . . . . . . . . . . . . . . . . . . . . . . . . . . . . . . . . . . . 39
8 Commands and responses . . . . . . . . . . . . . . . . . . . . . . . . . . . . . . . . . . . . . . . . . . . . . . . 408.1 Commands . . . . . . . . . . . . . . . . . . . . . . . . . . . . . . . . . . . . . . . . . . . . . . . . . . . . . 408.2 Response details . . . . . . . . . . . . . . . . . . . . . . . . . . . . . . . . . . . . . . . . . . . . . . . . . . 42
8.2.1 Reading request . . . . . . . . . . . . . . . . . . . . . . . . . . . . . . . . . . . . . . . . . . . . . . 428.2.2 Unaveraged reading request . . . . . . . . . . . . . . . . . . . . . . . . . . . . . . . . . . . . . . . . 428.2.3 Unit information . . . . . . . . . . . . . . . . . . . . . . . . . . . . . . . . . . . . . . . . . . . . . . 43
8.3 Calibration commands . . . . . . . . . . . . . . . . . . . . . . . . . . . . . . . . . . . . . . . . . . . . . . . 448.3.1 Calibration information request . . . . . . . . . . . . . . . . . . . . . . . . . . . . . . . . . . . . . . 448.3.2 Light calibration command . . . . . . . . . . . . . . . . . . . . . . . . . . . . . . . . . . . . . . . . 448.3.3 Dark calibration command . . . . . . . . . . . . . . . . . . . . . . . . . . . . . . . . . . . . . . . . 458.3.4 Disarm calibration command . . . . . . . . . . . . . . . . . . . . . . . . . . . . . . . . . . . . . . . 458.3.5 Manually set light calibration offset . . . . . . . . . . . . . . . . . . . . . . . . . . . . . . . . . . . 468.3.6 Manually set light calibration temperature . . . . . . . . . . . . . . . . . . . . . . . . . . . . . . . . 468.3.7 Manually set dark calibration time period . . . . . . . . . . . . . . . . . . . . . . . . . . . . . . . . 468.3.8 Manually set dark calibration temperature . . . . . . . . . . . . . . . . . . . . . . . . . . . . . . . . 47
8.4 Datalogger commands . . . . . . . . . . . . . . . . . . . . . . . . . . . . . . . . . . . . . . . . . . . . . . . 488.4.1 FLASH ID report . . . . . . . . . . . . . . . . . . . . . . . . . . . . . . . . . . . . . . . . . . . . . 488.4.2 Logging pointer report . . . . . . . . . . . . . . . . . . . . . . . . . . . . . . . . . . . . . . . . . . . 488.4.3 Logging capacity report . . . . . . . . . . . . . . . . . . . . . . . . . . . . . . . . . . . . . . . . . . 498.4.4 Erase entire FLASH memory . . . . . . . . . . . . . . . . . . . . . . . . . . . . . . . . . . . . . . . 498.4.5 Log one record . . . . . . . . . . . . . . . . . . . . . . . . . . . . . . . . . . . . . . . . . . . . . . . 498.4.6 Return one logged record . . . . . . . . . . . . . . . . . . . . . . . . . . . . . . . . . . . . . . . . . 498.4.7 Get internal voltage . . . . . . . . . . . . . . . . . . . . . . . . . . . . . . . . . . . . . . . . . . . . 508.4.8 Set and read logging trigger mode . . . . . . . . . . . . . . . . . . . . . . . . . . . . . . . . . . . . 518.4.9 Logging Interval setting response . . . . . . . . . . . . . . . . . . . . . . . . . . . . . . . . . . . . . 518.4.10 Logging interval reporting period setting . . . . . . . . . . . . . . . . . . . . . . . . . . . . . . . . . 528.4.11 Set and read logging Real Time Clock . . . . . . . . . . . . . . . . . . . . . . . . . . . . . . . . . . 528.4.12 Put datalogging unit to sleep . . . . . . . . . . . . . . . . . . . . . . . . . . . . . . . . . . . . . . . 538.4.13 Gather alarm 0 data from RTC . . . . . . . . . . . . . . . . . . . . . . . . . . . . . . . . . . . . . . 53
8.5 Setting Interval reporting parameters . . . . . . . . . . . . . . . . . . . . . . . . . . . . . . . . . . . . . . . 548.5.1 Interval reporting period setting . . . . . . . . . . . . . . . . . . . . . . . . . . . . . . . . . . . . . 548.5.2 Threshold setting for interval reporting . . . . . . . . . . . . . . . . . . . . . . . . . . . . . . . . . 548.5.3 Interval setting response . . . . . . . . . . . . . . . . . . . . . . . . . . . . . . . . . . . . . . . . . . 55
8.6 Simulation commands . . . . . . . . . . . . . . . . . . . . . . . . . . . . . . . . . . . . . . . . . . . . . . . 56
9 Installation . . . . . . . . . . . . . . . . . . . . . . . . . . . . . . . . . . . . . . . . . . . . . . . . . . . . . . . . 589.1 Electrical connection . . . . . . . . . . . . . . . . . . . . . . . . . . . . . . . . . . . . . . . . . . . . . . . . 589.2 Mechanical installation . . . . . . . . . . . . . . . . . . . . . . . . . . . . . . . . . . . . . . . . . . . . . . . 58
9.2.1 Cover selection . . . . . . . . . . . . . . . . . . . . . . . . . . . . . . . . . . . . . . . . . . . . . . . 589.2.2 Cover calibration . . . . . . . . . . . . . . . . . . . . . . . . . . . . . . . . . . . . . . . . . . . . . . 589.2.3 Cover maintenance . . . . . . . . . . . . . . . . . . . . . . . . . . . . . . . . . . . . . . . . . . . . . 59
10 Default settings . . . . . . . . . . . . . . . . . . . . . . . . . . . . . . . . . . . . . . . . . . . . . . . . . . . . . 60
11 Firmware upgrade . . . . . . . . . . . . . . . . . . . . . . . . . . . . . . . . . . . . . . . . . . . . . . . . . . . . 6111.1 Details . . . . . . . . . . . . . . . . . . . . . . . . . . . . . . . . . . . . . . . . . . . . . . . . . . . . . . . . 61
12 Calibration . . . . . . . . . . . . . . . . . . . . . . . . . . . . . . . . . . . . . . . . . . . . . . . . . . . . . . . . 6212.1 Recalibration . . . . . . . . . . . . . . . . . . . . . . . . . . . . . . . . . . . . . . . . . . . . . . . . . . . . 6212.2 Light calibration . . . . . . . . . . . . . . . . . . . . . . . . . . . . . . . . . . . . . . . . . . . . . . . . . . 6212.3 Dark calibration . . . . . . . . . . . . . . . . . . . . . . . . . . . . . . . . . . . . . . . . . . . . . . . . . . 6212.4 Confirmation . . . . . . . . . . . . . . . . . . . . . . . . . . . . . . . . . . . . . . . . . . . . . . . . . . . . 62
4
13 Troubleshooting . . . . . . . . . . . . . . . . . . . . . . . . . . . . . . . . . . . . . . . . . . . . . . . . . . . . . 63
14 Glossary . . . . . . . . . . . . . . . . . . . . . . . . . . . . . . . . . . . . . . . . . . . . . . . . . . . . . . . . . . 67
List of Figures
2.1 Mpsas interpretive scale . . . . . . . . . . . . . . . . . . . . . . . . . . . . . . . . . . . . . . . . . . . . . . 102.2 Mpsas vs NELM . . . . . . . . . . . . . . . . . . . . . . . . . . . . . . . . . . . . . . . . . . . . . . . . . . 13
3.1 SQM-LU-DL Block diagram . . . . . . . . . . . . . . . . . . . . . . . . . . . . . . . . . . . . . . . . . . . . 14
4.1 Front of unit . . . . . . . . . . . . . . . . . . . . . . . . . . . . . . . . . . . . . . . . . . . . . . . . . . . . 154.2 Back of unit . . . . . . . . . . . . . . . . . . . . . . . . . . . . . . . . . . . . . . . . . . . . . . . . . . . . . 16
5.1 Wired connection . . . . . . . . . . . . . . . . . . . . . . . . . . . . . . . . . . . . . . . . . . . . . . . . . . 175.2 Battery connection . . . . . . . . . . . . . . . . . . . . . . . . . . . . . . . . . . . . . . . . . . . . . . . . . 175.3 Current profile . . . . . . . . . . . . . . . . . . . . . . . . . . . . . . . . . . . . . . . . . . . . . . . . . . . 185.4 Diagnostic LED timing diagram . . . . . . . . . . . . . . . . . . . . . . . . . . . . . . . . . . . . . . . . . . 19
7.1 Splash screen . . . . . . . . . . . . . . . . . . . . . . . . . . . . . . . . . . . . . . . . . . . . . . . . . . . . 237.2 File menu . . . . . . . . . . . . . . . . . . . . . . . . . . . . . . . . . . . . . . . . . . . . . . . . . . . . . . 247.3 File Open dialog . . . . . . . . . . . . . . . . . . . . . . . . . . . . . . . . . . . . . . . . . . . . . . . . . . 257.4 View menu . . . . . . . . . . . . . . . . . . . . . . . . . . . . . . . . . . . . . . . . . . . . . . . . . . . . . 257.5 View : Log . . . . . . . . . . . . . . . . . . . . . . . . . . . . . . . . . . . . . . . . . . . . . . . . . . . . . 267.6 View:Directories . . . . . . . . . . . . . . . . . . . . . . . . . . . . . . . . . . . . . . . . . . . . . . . . . . 267.7 Data logging header . . . . . . . . . . . . . . . . . . . . . . . . . . . . . . . . . . . . . . . . . . . . . . . . 277.8 Set Location dialog . . . . . . . . . . . . . . . . . . . . . . . . . . . . . . . . . . . . . . . . . . . . . . . . . 287.9 Help menu . . . . . . . . . . . . . . . . . . . . . . . . . . . . . . . . . . . . . . . . . . . . . . . . . . . . . . 287.10 Help : About . . . . . . . . . . . . . . . . . . . . . . . . . . . . . . . . . . . . . . . . . . . . . . . . . . . . 297.11 Found device (single) . . . . . . . . . . . . . . . . . . . . . . . . . . . . . . . . . . . . . . . . . . . . . . . . 297.12 Found device (multiple) . . . . . . . . . . . . . . . . . . . . . . . . . . . . . . . . . . . . . . . . . . . . . . 297.13 USB connection details . . . . . . . . . . . . . . . . . . . . . . . . . . . . . . . . . . . . . . . . . . . . . . . 307.14 Ethernet connection details . . . . . . . . . . . . . . . . . . . . . . . . . . . . . . . . . . . . . . . . . . . . 307.15 Information tab . . . . . . . . . . . . . . . . . . . . . . . . . . . . . . . . . . . . . . . . . . . . . . . . . . . 307.16 Log Continuously screen . . . . . . . . . . . . . . . . . . . . . . . . . . . . . . . . . . . . . . . . . . . . . . 317.17 Log Continuously Trigger tab . . . . . . . . . . . . . . . . . . . . . . . . . . . . . . . . . . . . . . . . . . . 317.18 Log Continuously Annotation tab . . . . . . . . . . . . . . . . . . . . . . . . . . . . . . . . . . . . . . . . . 327.19 Calibration tab (initial) . . . . . . . . . . . . . . . . . . . . . . . . . . . . . . . . . . . . . . . . . . . . . . 327.20 Calibration tab (populated) . . . . . . . . . . . . . . . . . . . . . . . . . . . . . . . . . . . . . . . . . . . . 337.21 Report interval tab . . . . . . . . . . . . . . . . . . . . . . . . . . . . . . . . . . . . . . . . . . . . . . . . . 347.22 Firmware tab . . . . . . . . . . . . . . . . . . . . . . . . . . . . . . . . . . . . . . . . . . . . . . . . . . . . 347.23 Firmware selection . . . . . . . . . . . . . . . . . . . . . . . . . . . . . . . . . . . . . . . . . . . . . . . . . 357.24 Configuration tab . . . . . . . . . . . . . . . . . . . . . . . . . . . . . . . . . . . . . . . . . . . . . . . . . . 357.25 Light calibration confirmation . . . . . . . . . . . . . . . . . . . . . . . . . . . . . . . . . . . . . . . . . . . 367.26 Dark calibration confirmation . . . . . . . . . . . . . . . . . . . . . . . . . . . . . . . . . . . . . . . . . . . 367.27 Data logging tab . . . . . . . . . . . . . . . . . . . . . . . . . . . . . . . . . . . . . . . . . . . . . . . . . . 367.28 Real Time Clock setting dialog . . . . . . . . . . . . . . . . . . . . . . . . . . . . . . . . . . . . . . . . . . 377.29 Storage navigation . . . . . . . . . . . . . . . . . . . . . . . . . . . . . . . . . . . . . . . . . . . . . . . . . 377.30 DL Retrieve dialog window . . . . . . . . . . . . . . . . . . . . . . . . . . . . . . . . . . . . . . . . . . . . 38
5
7.31 DL Erase dialog window . . . . . . . . . . . . . . . . . . . . . . . . . . . . . . . . . . . . . . . . . . . . . . 397.32 Simulation tab . . . . . . . . . . . . . . . . . . . . . . . . . . . . . . . . . . . . . . . . . . . . . . . . . . . 39
9.1 Housing . . . . . . . . . . . . . . . . . . . . . . . . . . . . . . . . . . . . . . . . . . . . . . . . . . . . . . . 589.2 Example cover calibration . . . . . . . . . . . . . . . . . . . . . . . . . . . . . . . . . . . . . . . . . . . . . 59
List of Tables
2.1 Apparent Magnitudes of Known Celestial Objects adapted from [2] . . . . . . . . . . . . . . . . . . . . . . 10
7.2 Storage navigation button descriptions . . . . . . . . . . . . . . . . . . . . . . . . . . . . . . . . . . . . . . 37
8.1 Summary of standard commands . . . . . . . . . . . . . . . . . . . . . . . . . . . . . . . . . . . . . . . . . 408.2 Summary of datalogger commands . . . . . . . . . . . . . . . . . . . . . . . . . . . . . . . . . . . . . . . . 418.3 Reading request response . . . . . . . . . . . . . . . . . . . . . . . . . . . . . . . . . . . . . . . . . . . . . 428.4 Unaveraged reading request response . . . . . . . . . . . . . . . . . . . . . . . . . . . . . . . . . . . . . . . 428.5 Unit information request response . . . . . . . . . . . . . . . . . . . . . . . . . . . . . . . . . . . . . . . . 438.6 Calibration information request response . . . . . . . . . . . . . . . . . . . . . . . . . . . . . . . . . . . . . 448.7 Light calibration response . . . . . . . . . . . . . . . . . . . . . . . . . . . . . . . . . . . . . . . . . . . . . 448.8 Dark calibration response . . . . . . . . . . . . . . . . . . . . . . . . . . . . . . . . . . . . . . . . . . . . . 458.9 Disarm calibration response . . . . . . . . . . . . . . . . . . . . . . . . . . . . . . . . . . . . . . . . . . . . 458.10 Response for manual setting of light calibration offset . . . . . . . . . . . . . . . . . . . . . . . . . . . . . 468.11 Response for manually setting of light calibration temperature . . . . . . . . . . . . . . . . . . . . . . . . 468.12 Response of manually setting dark calibration time period . . . . . . . . . . . . . . . . . . . . . . . . . . . 478.13 Response for manually setting of dark calibration temperature . . . . . . . . . . . . . . . . . . . . . . . . 478.14 Response of requesting the FLASH chip ID . . . . . . . . . . . . . . . . . . . . . . . . . . . . . . . . . . . 488.15 Response of requesting the data logging pointer . . . . . . . . . . . . . . . . . . . . . . . . . . . . . . . . . 488.16 Response of requesting the data logging capacity . . . . . . . . . . . . . . . . . . . . . . . . . . . . . . . . 498.17 Response of requesting to log one record . . . . . . . . . . . . . . . . . . . . . . . . . . . . . . . . . . . . . 498.18 Request to return one logged record . . . . . . . . . . . . . . . . . . . . . . . . . . . . . . . . . . . . . . . 508.19 Response to return one logged record . . . . . . . . . . . . . . . . . . . . . . . . . . . . . . . . . . . . . . . 508.20 Response of requesting internal voltage . . . . . . . . . . . . . . . . . . . . . . . . . . . . . . . . . . . . . . 508.21 Request to set the logging trigger mode . . . . . . . . . . . . . . . . . . . . . . . . . . . . . . . . . . . . . 518.22 Response of setting or getting the log trigger mode . . . . . . . . . . . . . . . . . . . . . . . . . . . . . . . 518.23 Response of viewing or setting logging interval reporting parameters . . . . . . . . . . . . . . . . . . . . . 528.24 Setting the RTC . . . . . . . . . . . . . . . . . . . . . . . . . . . . . . . . . . . . . . . . . . . . . . . . . . 528.25 Response of getting the RTC values . . . . . . . . . . . . . . . . . . . . . . . . . . . . . . . . . . . . . . . 538.26 Response of getting the RTC “Alarm 0” value . . . . . . . . . . . . . . . . . . . . . . . . . . . . . . . . . . 538.27 Interval report . . . . . . . . . . . . . . . . . . . . . . . . . . . . . . . . . . . . . . . . . . . . . . . . . . . 548.28 Response of viewing or setting interval reporting parameters . . . . . . . . . . . . . . . . . . . . . . . . . . 558.29 Response of request for internal simulation values . . . . . . . . . . . . . . . . . . . . . . . . . . . . . . . . 568.30 Request simulation (S....x) . . . . . . . . . . . . . . . . . . . . . . . . . . . . . . . . . . . . . . . . . . . . . 568.31 Response of setting simulation values (S...x) . . . . . . . . . . . . . . . . . . . . . . . . . . . . . . . . . . . 56
13.1 Reading seem too bright . . . . . . . . . . . . . . . . . . . . . . . . . . . . . . . . . . . . . . . . . . . . . . 6313.2 Driver not found . . . . . . . . . . . . . . . . . . . . . . . . . . . . . . . . . . . . . . . . . . . . . . . . . . 6313.3 USB device not found, or more than one device on the same COM port . . . . . . . . . . . . . . . . . . . 6313.4 LED does not light up . . . . . . . . . . . . . . . . . . . . . . . . . . . . . . . . . . . . . . . . . . . . . . . 63
6
13.5 Recording stops . . . . . . . . . . . . . . . . . . . . . . . . . . . . . . . . . . . . . . . . . . . . . . . . . . . 6313.6 Meter cannot be found on battery or by PC . . . . . . . . . . . . . . . . . . . . . . . . . . . . . . . . . . . 6413.7 Meter cannot be found by Windows operating system . . . . . . . . . . . . . . . . . . . . . . . . . . . . . 6413.8 Cannot get a reading . . . . . . . . . . . . . . . . . . . . . . . . . . . . . . . . . . . . . . . . . . . . . . . . 65
14.1 Glossary of terms . . . . . . . . . . . . . . . . . . . . . . . . . . . . . . . . . . . . . . . . . . . . . . . . . . 67
List of Equations
2.1 MPSAS to cd/m2 . . . . . . . . . . . . . . . . . . . . . . . . . . . . . . . . . . . . . . . . . . . . . . . . . . 122.2 NELM to MPSAS . . . . . . . . . . . . . . . . . . . . . . . . . . . . . . . . . . . . . . . . . . . . . . . . . 132.3 MPSAS to NELM . . . . . . . . . . . . . . . . . . . . . . . . . . . . . . . . . . . . . . . . . . . . . . . . . 13
7
1 Introduction
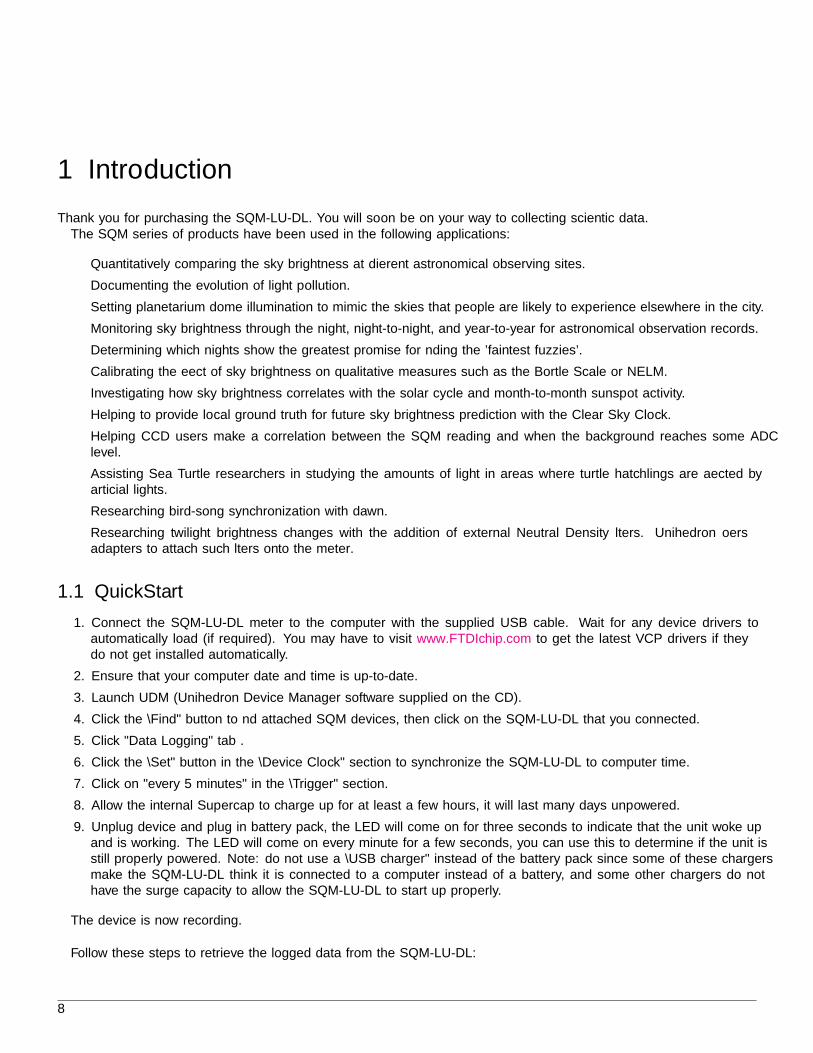
Thank you for purchasing the SQM-LU-DL. You will soon be on your way to collecting scientific data.The SQM series of products have been used in the following applications:
• Quantitatively comparing the sky brightness at different astronomical observing sites.
• Documenting the evolution of light pollution.
• Setting planetarium dome illumination to mimic the skies that people are likely to experience elsewhere in the city.
• Monitoring sky brightness through the night, night-to-night, and year-to-year for astronomical observation records.
• Determining which nights show the greatest promise for finding the ’faintest fuzzies’.
• Calibrating the effect of sky brightness on qualitative measures such as the Bortle Scale or NELM.
• Investigating how sky brightness correlates with the solar cycle and month-to-month sunspot activity.
• Helping to provide local ground truth for future sky brightness prediction with the Clear Sky Clock.
• Helping CCD users make a correlation between the SQM reading and when the background reaches some ADClevel.
• Assisting Sea Turtle researchers in studying the amounts of light in areas where turtle hatchlings are affected byartificial lights.
• Researching bird-song synchronization with dawn.
• Researching twilight brightness changes with the addition of external Neutral Density filters. Unihedron offersadapters to attach such filters onto the meter.
1.1 QuickStart
1. Connect the SQM-LU-DL meter to the computer with the supplied USB cable. Wait for any device drivers toautomatically load (if required). You may have to visit www.FTDIchip.com to get the latest VCP drivers if theydo not get installed automatically.
2. Ensure that your computer date and time is up-to-date.
3. Launch UDM (Unihedron Device Manager software supplied on the CD).
4. Click the “Find” button to find attached SQM devices, then click on the SQM-LU-DL that you connected.
5. Click ”Data Logging” tab .
6. Click the “Set” button in the “Device Clock” section to synchronize the SQM-LU-DL to computer time.
7. Click on ”every 5 minutes” in the “Trigger” section.
8. Allow the internal Supercap to charge up for at least a few hours, it will last many days unpowered.
9. Unplug device and plug in battery pack, the LED will come on for three seconds to indicate that the unit woke upand is working. The LED will come on every minute for a few seconds, you can use this to determine if the unit isstill properly powered. Note: do not use a “USB charger” instead of the battery pack since some of these chargersmake the SQM-LU-DL think it is connected to a computer instead of a battery, and some other chargers do nothave the surge capacity to allow the SQM-LU-DL to start up properly.
The device is now recording.
Follow these steps to retrieve the logged data from the SQM-LU-DL:
8

1.1 QuickStart
1. Connect the SQM-LU-DL to the computer with the USB cable.
2. Launch the UDM program.
3. Find your device as before.
4. Select the “Data Logging” tab.
5. Click “Retrieve All” and follow the instructions on that page.
6. ONCE YOU’VE CHECKED THAT THE DATA IS SAVED TO DISK PROPERLY, and you want to clear thedata-logger memory in preparation for a new set of records, you can erase the old memory. Warning this stepcannot be undone!
1.1.1 Other software
If you are using Windows, you may want to use Knightware SQM-Reader from www.knightware.biz/sqm .Also, if you are using Windows, Linux, or Mac, you can use the Perl scripts supplied on the CD for various functions.
1.1.2 FITS integration
Some programs (listed below) gather information from the Unihedron Sky Quality meter products and insert that datainto the Flexible Image Transport System (FITS) header.
• MaxPilote (Freeware) incorporates SQM readings from an SQM-LE/SQM-LU into the FITS header while at thesame time provide constant readings in a live and updated Data Window.
• CCDAutoPilot
• FITS4Win2 uses the MPSAS keyword for sorting and filtering image files.
9
2 Measurements
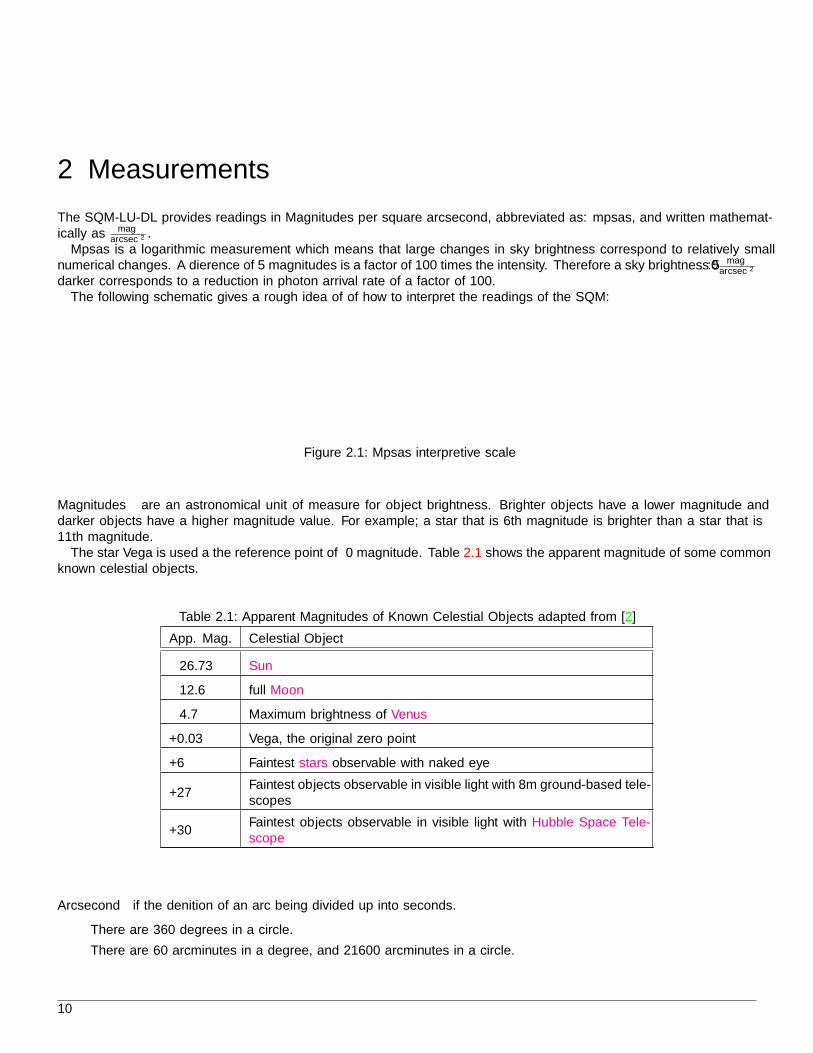
The SQM-LU-DL provides readings in Magnitudes per square arcsecond, abbreviated as: mpsas, and written mathemat-ically as mag
arcsec2 .Mpsas is a logarithmic measurement which means that large changes in sky brightness correspond to relatively small
numerical changes. A difference of 5 magnitudes is a factor of 100 times the intensity. Therefore a sky brightness 5.0 magarcsec2
darker corresponds to a reduction in photon arrival rate of a factor of 100.The following schematic gives a rough idea of of how to interpret the readings of the SQM:
Figure 2.1: Mpsas interpretive scale
Magnitudes are an astronomical unit of measure for object brightness. Brighter objects have a lower magnitude anddarker objects have a higher magnitude value. For example; a star that is 6th magnitude is brighter than a star that is11th magnitude.
The star Vega is used a the reference point of ≈ 0 magnitude. Table 2.1 shows the apparent magnitude of some commonknown celestial objects.
Table 2.1: Apparent Magnitudes of Known Celestial Objects adapted from [2]
App. Mag. Celestial Object
−26.73 Sun
−12.6 full Moon
−4.7 Maximum brightness of Venus
+0.03 Vega, the original zero point
+6 Faintest stars observable with naked eye
+27Faintest objects observable in visible light with 8m ground-based tele-scopes
+30Faintest objects observable in visible light with Hubble Space Tele-scope
Arcsecond if the definition of an arc being divided up into seconds.
• There are 360 degrees in a circle.
• There are 60 arcminutes in a degree, and 21600 arcminutes in a circle.
10
2.1 Getting accurate readings
• There are 60 arcseconds in an arcminute, and 1296000 arcseconds in a circle.
Square arcsecond (arcsec2) is the area covered by a square measuring 1arcsec× 1arcsec .
Magnitude per square arcsecond is the definition of brightness in magnitudes spread out over one square arcsecondof the sky. For example; if the SQM provides a reading of 20.00 mpsas, that would be like saying that a light of a 20th
magnitude star brightness was spread over one square arcsecond of the sky.The ”magnitudes per square arcsecond” numbers are commonly used in astronomy to measure sky brightness. More
details can be found at www.stjarnhimlen.se/comp/radfaq.htmlEach magnitude lower (numerically) means just over 2.5 times as much more light is coming from a given patch of sky.
A change of 5 mags/sq arcsec means the sky is 100x brighter.Also, a reading of greater than 22.0 is unlikely to be recorded and the darkest we’ve personally experienced with the
SQM is 21.80.
2.1 Getting accurate readings
Various factors will cause the night sky brightness to fluctuate. Taking more readings will be useful in ruling out spuriousevents. The SQM gathers light for at least a one second period, and the brightness report is based on the light that wasaccumulated during that time.
At the darkest sites, natural variations in conditions such as airglow and the brightness of the zodiacal light are limitingfactors.
Prevent artificially high (dark) readings by ensuring that there is nothing blocking the view of the sensor. Avoid takingreadings near trees or buildings that may block the sensor.
Prevent artificially low (bright) readings by ensuring that there are no lighted objects (street lamps, the moon, etc.)that shine into the sensor at any angle.
2.1.1 Seeing conditions
The apparent blurring/transparency and twinkling (scintillation) of stars is due to wind in the upper atmosphere thatcauses water molecules to distort the light from space.
Stars are too small in comparison to the entire SQM field of view, so scintillation is not expected to alter the SQMreading significantly.
2.1.2 Light pollution
Undesirable artificial light that reaches you is considered to be light pollution. Much of this light comes from outdoorillumination of parking lots, street lamps, office buildings, advertising signs, etc..
Other causes of extra light in the night sky are listed below:
Aurora
Charged particles emitted from the Sun are directed to the poles of the earth by the Earth’s magnetic field. These particlescollide with atoms in the atmosphere and cause light to be emitted. Aiming the meter at the polar regions during AuroraBorealis (in the North) or Aurora Australis (in the South) will reduce the reading (lighter). Aiming the meter towardsthe equator will increase the reading (darker) under these conditions.
Airglow
Airglow is light produced by various phenomenon in the atmosphere which prevent the sky from being totally dark. Effectsof the magnetic poles of the Earth may cause airglow to be brighter near the poles.
11
2 Measurements
The Milky Way
The northern view of the Milky Way contributes about 0.10 mpsas under 21.5 mpsas (moonless) skies.
The southern view of the Milky Way might be as big an effect as 0.30 mpsas where it goes near-overhead.
For more information, see Surface Photometries of the Milky Way (Schlosser+ 1997)vizier.u-strasbg.fr/ftp/cats/VII/199/ReadMe
Moisture
Clouds, fog, and mist will reflect artificial light back down to the Earth causing a brighter (lower) reading. If there isno artificial light, then clouds may prevent starlight from coming to you and the reading will be darker (higher). Thisextra-dark situation can occur in very isolated areas like mountain tops, the ocean, or the desert. You will have to beaware of this special situation when analyzing readings.
Volcanic eruptions
Dust released into the atmosphere by volcanoes can reflect light from the surface of the earth back down. In a darklocation this dust will prevent the light from stars and Milky Way and produce a darker (higher) reading.
Zodiacal light
The sunlight reflected of off dust particles in the ecliptic plane of our solar system is called zodiacal light.
The amount of light will be different depending on whether the meter is pointed to the poles or plane of the solarsystem. It is likely to have less than 2% effect. The primary reason for this small effect is that the brightest and widestpart of the zodiacal light is nearest the horizon where the SQM has almost no sensitivity (due to it being a primarilyzenith-looking device). The portions at higher altitude are the narrowest and faintest and they would barely creep intothe sensitivity cone of the SQM.
2.1.3 Other luminance scales
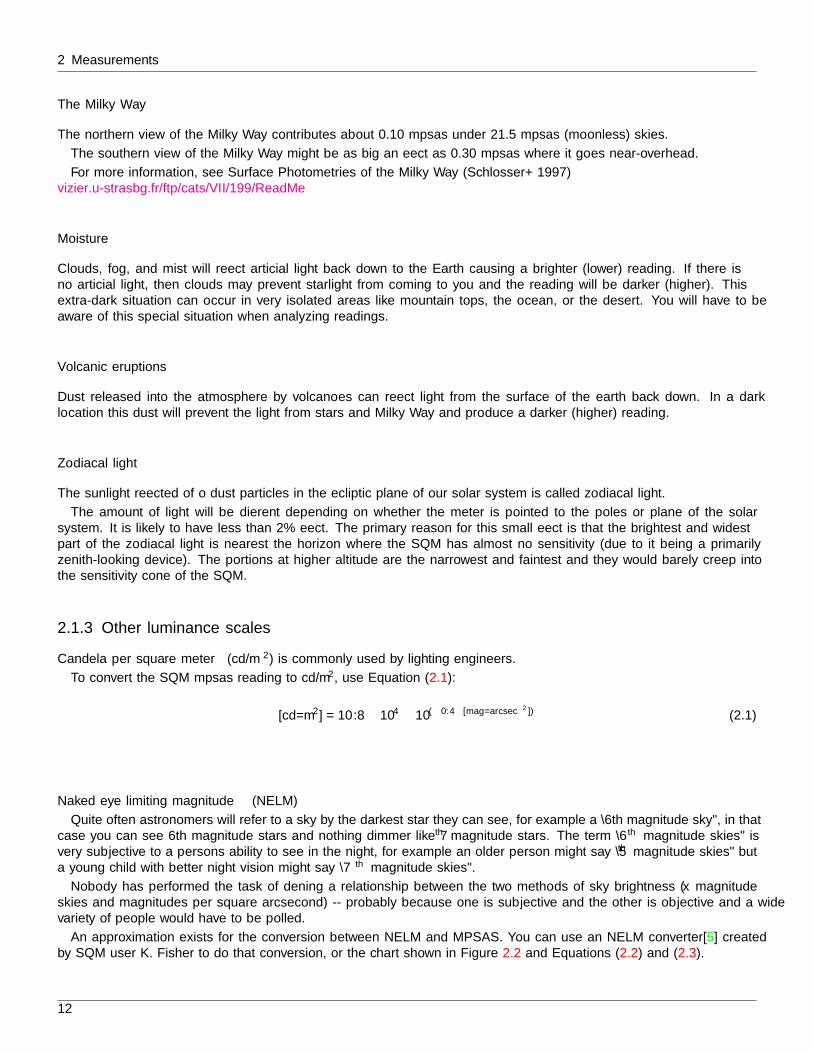
Candela per square meter (cd/m2) is commonly used by lighting engineers.
To convert the SQM mpsas reading to cd/m2, use Equation (2.1):
[cd/m2] = 10.8× 104 × 10(−0.4×[mag/arcsec2]) (2.1)
Naked eye limiting magnitude (NELM)
Quite often astronomers will refer to a sky by the darkest star they can see, for example a “6th magnitude sky”, in thatcase you can see 6th magnitude stars and nothing dimmer like 7th magnitude stars. The term “6th magnitude skies” isvery subjective to a persons ability to see in the night, for example an older person might say “5th magnitude skies” buta young child with better night vision might say “7th magnitude skies”.
Nobody has performed the task of defining a relationship between the two methods of sky brightness ( x magnitudeskies and magnitudes per square arcsecond) -- probably because one is subjective and the other is objective and a widevariety of people would have to be polled.
An approximation exists for the conversion between NELM and MPSAS. You can use an NELM converter[5] createdby SQM user K. Fisher to do that conversion, or the chart shown in Figure 2.2 and Equations (2.2) and (2.3).
12
2.1 Getting accurate readings
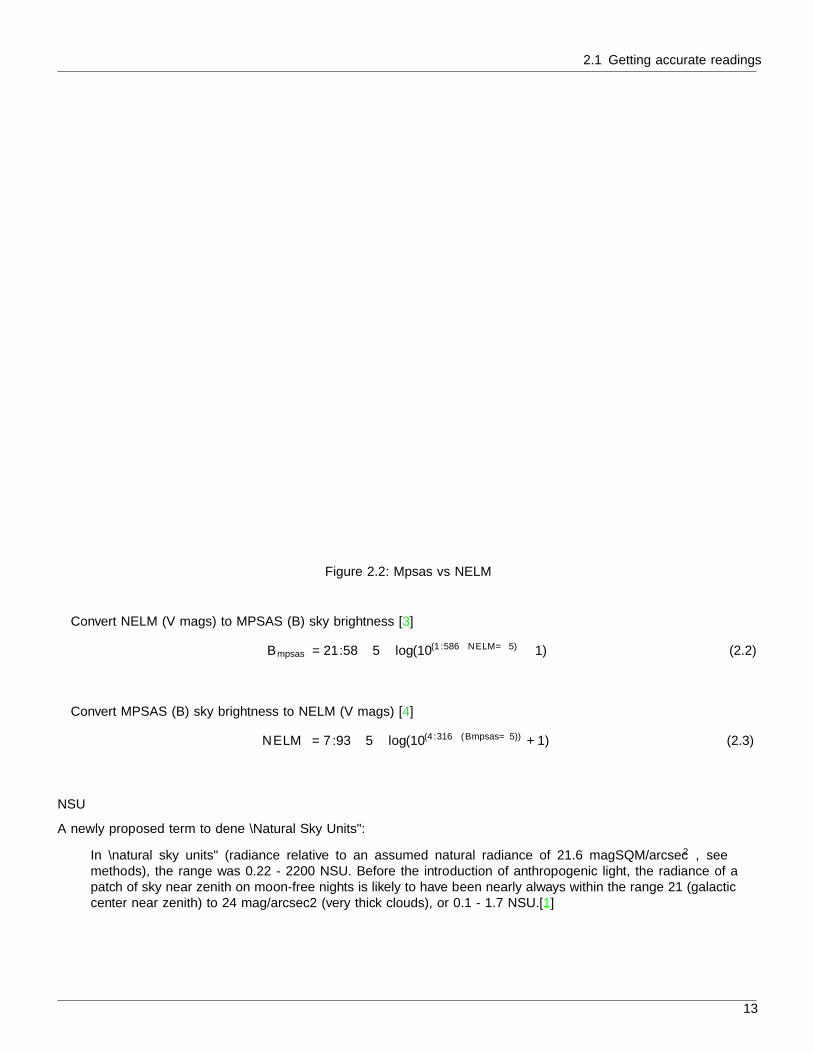
Figure 2.2: Mpsas vs NELM
Convert NELM (V mags) to MPSAS (B) sky brightness [3]
Bmpsas = 21.58− 5× log(10(1.586−NELM/5) − 1) (2.2)
Convert MPSAS (B) sky brightness to NELM (V mags) [4]
NELM = 7.93− 5× log(10(4.316−(Bmpsas/5)) + 1) (2.3)
NSU
A newly proposed term to define “Natural Sky Units”:
In “natural sky units” (radiance relative to an assumed natural radiance of 21.6 magSQM/arcsec2 , seemethods), the range was 0.22 - 2200 NSU. Before the introduction of anthropogenic light, the radiance of apatch of sky near zenith on moon-free nights is likely to have been nearly always within the range 21 (galacticcenter near zenith) to 24 mag/arcsec2 (very thick clouds), or 0.1 - 1.7 NSU.[1]
13

3 Theory of operation
Figure 3.1: SQM-LU-DL Block diagram
3.1 Light measurement
The SQM-LU-DL measures the darkness of the night sky to provide readings of magnitudes per square arc second througha USB connection, and is capable of internally recording readings.
A light sensor (TSL237) provides the micro-controller with a light level, and readings from the temperature sensor areused to compensate the light sensor readings through the range of operating temperatures.
3.2 Communication to the PC
Commands sent from a PC through the USB cable to the USB interface are relayed to the micro-controller.The micro-controller responds to commands by sending data strings to the USB interface which are then relayed to the
PC.Readings are gathered asynchronously by the micro-controller. Requests from the PC are buffered and dealt with as
time permits.
14
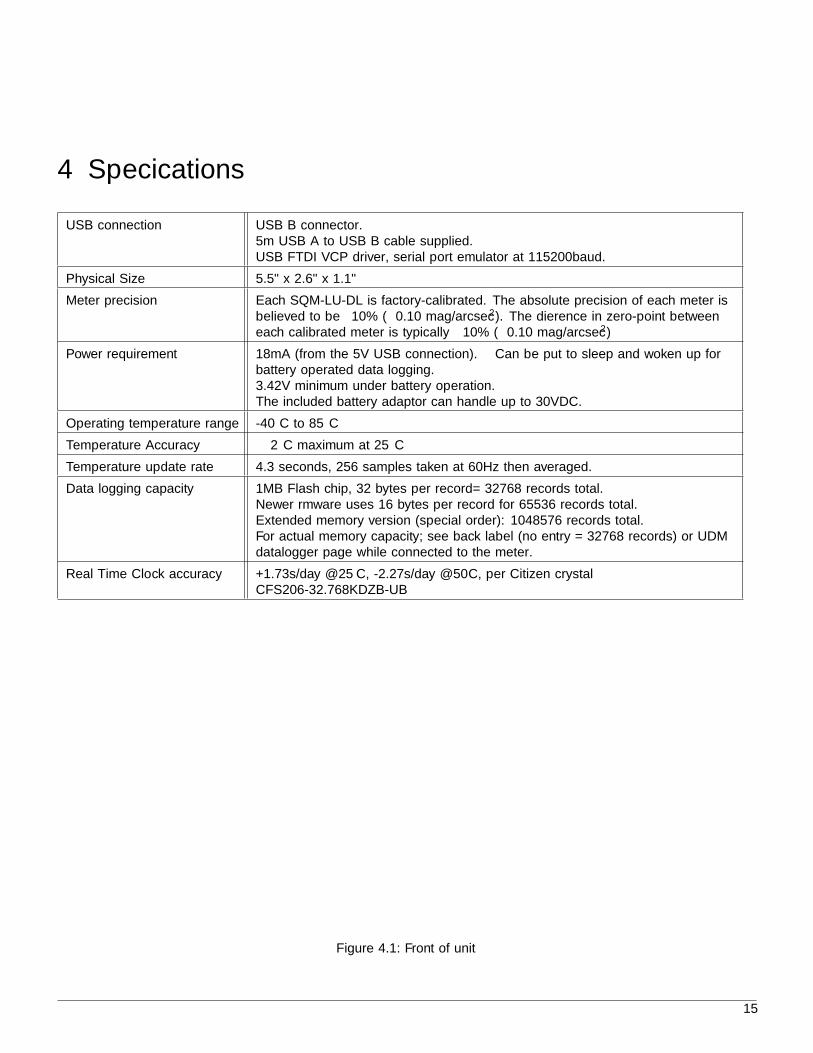
4 Specifications
USB connection USB B connector.5m USB A to USB B cable supplied.USB FTDI VCP driver, serial port emulator at 115200baud.
Physical Size 5.5” x 2.6” x 1.1”
Meter precision Each SQM-LU-DL is factory-calibrated. The absolute precision of each meter isbelieved to be ±10% (±0.10 mag/arcsec2). The difference in zero-point betweeneach calibrated meter is typically ±10% (±0.10 mag/arcsec2)
Power requirement 18mA (from the 5V USB connection). Can be put to sleep and woken up forbattery operated data logging.3.42V minimum under battery operation.The included battery adaptor can handle up to 30VDC.
Operating temperature range -40C to 85C
Temperature Accuracy ± 2C maximum at 25C
Temperature update rate 4.3 seconds, 256 samples taken at 60Hz then averaged.
Data logging capacity 1MB Flash chip, 32 bytes per record= 32768 records total.Newer firmware uses 16 bytes per record for 65536 records total.Extended memory version (special order): 1048576 records total.For actual memory capacity; see back label (no entry = 32768 records) or UDMdatalogger page while connected to the meter.
Real Time Clock accuracy +1.73s/day @25C, -2.27s/day @50C, per Citizen crystalCFS206-32.768KDZB-UB
Figure 4.1: Front of unit
15

4 Specifications
Figure 4.2: Back of unit
16
5 Hardware connections
The SQM-LU-DL requires one connection to a USB hub or a PC for configuring the device and recovering the readingsas shown in Figure 5.1.
Figure 5.1: Wired connection
The maximum length cable per the USB specification is 15ft (3m). USB extenders exist on the market, some work upto 198ft (60m).
A battery adaptor with batteries is supplied to allow the SQM-LU-DL to perform data-logging while disconnected fromthe computer. This battery connection replaces the USB connection from the computer as shown in Figure 5.2.
Figure 5.2: Battery connection
5.1 Battery operation
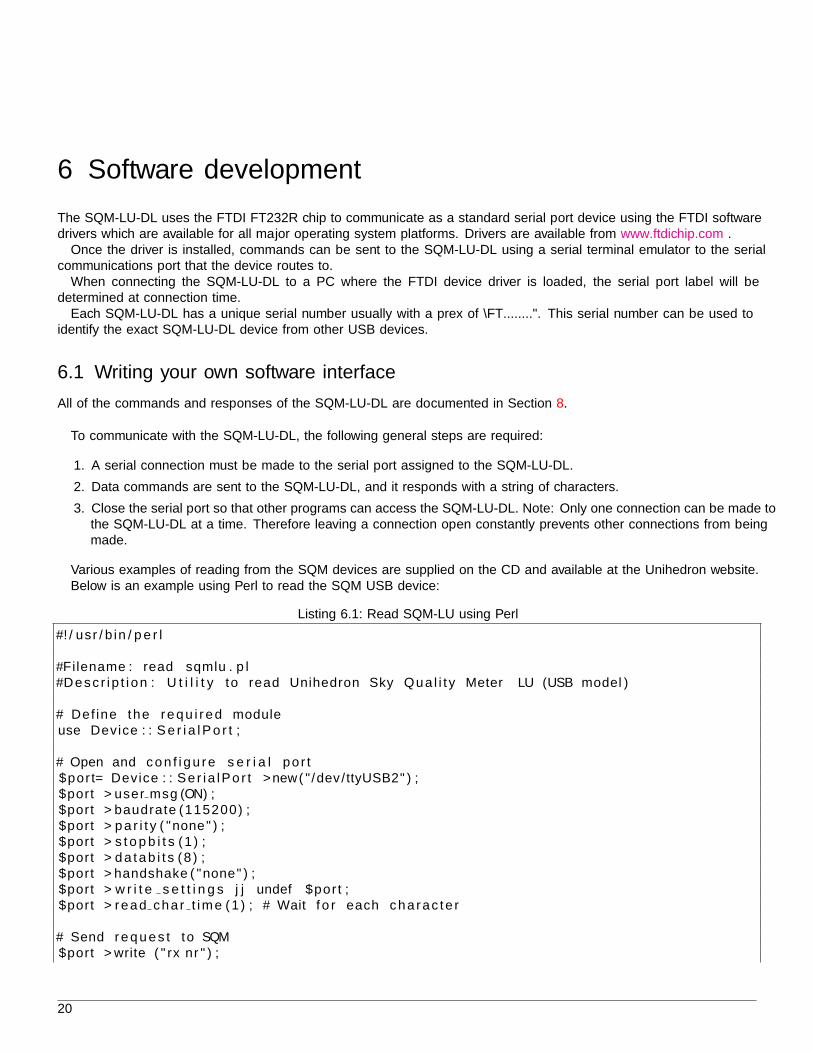
The SQM-LU-DL may be operated by an external battery using the supplied “battery to USB adaptor”. The lifetime ofthe battery can be determined as shown below. This calculation is also performed and displayed by the UDM softwareon the “Data Logging” panel. Figure 5.3 shows experimental results of the current profile using a 10Ω current shunt.
17
5 Hardware connections
Current consumption values:
IQ = 600nA Quiescent current (5.1)
IW = 10mA Wake current (5.2)
IM = 55mA Measure current (5.3)
Current consumption timing:
tQ = 1− (tW + tM ) (5.4)
tW =3s
60s(5.5)
tM =5s
n× 60s(5.6)
n = number of minutes between samples (5.7)
Current consumption formula:
IAvg = tQ × IQ + tW × IW + tM × IM (5.8)
Figure 5.3: Current profile
As an example for determining battery life of a 3AH battery with sampling every 5 minutes:
TBatt =AHRating
IAverage(5.9)
=AHRating
(IQuiescent + tWake × IWake + tMeasure × IMeasure)(5.10)
=AHRating
(IQuiescent + tWake × IWake + 5sn×60s × IMeasure)
(5.11)
=3AH
(500nA + 3s60s × 10mA + 5s
60s × 55mA)(5.12)
= 2117 hrs, or 88 days, or 2.8 months (5.13)
Note that measuring is still performed for ”Threshold” settings, even when it is too bright to record a reading. Measuringis performed to determine this ”measure” state, and IMeasure still applies.
18

5.2 Diagnostic LED
5.2 Diagnostic LED
When the unit is connected to a battery, the red LED near the USB connector will illuminate in sequence shown in Figure5.4 (firmware feature version 26 onwards):
Figure 5.4: Diagnostic LED timing diagram
Description of LED flashes:
A On for three seconds during the power-up/boot-load sequence. During this time, the unit is supplying power to thesensor components and will also accept firmware updates.
B Log a reading if it is scheduled and is above the set threshold. The meter requires about 8 seconds to gather a validreading, Some readings may take much longer (300s max) to acquire.
C Shutdown: One quick flash for normal battery voltage (above 4.9V), more quick flashes if the battery voltage is toolow (2:4.8V, 3:4.6V, 4:4.4V, 5:4.2V, 6:4.0V). Battery voltage detection is performed at the end of the light meterreading time (B) because low batteries drop during power drain and this is the voltage that the light meter readingwas recorded at.
19
6 Software development
The SQM-LU-DL uses the FTDI FT232R chip to communicate as a standard serial port device using the FTDI softwaredrivers which are available for all major operating system platforms. Drivers are available from www.ftdichip.com .
Once the driver is installed, commands can be sent to the SQM-LU-DL using a serial terminal emulator to the serialcommunications port that the device routes to.
When connecting the SQM-LU-DL to a PC where the FTDI device driver is loaded, the serial port label will bedetermined at connection time.
Each SQM-LU-DL has a unique serial number usually with a prefix of “FT........”. This serial number can be used toidentify the exact SQM-LU-DL device from other USB devices.
6.1 Writing your own software interface
All of the commands and responses of the SQM-LU-DL are documented in Section 8.
To communicate with the SQM-LU-DL, the following general steps are required:
1. A serial connection must be made to the serial port assigned to the SQM-LU-DL.
2. Data commands are sent to the SQM-LU-DL, and it responds with a string of characters.
3. Close the serial port so that other programs can access the SQM-LU-DL. Note: Only one connection can be made tothe SQM-LU-DL at a time. Therefore leaving a connection open constantly prevents other connections from beingmade.
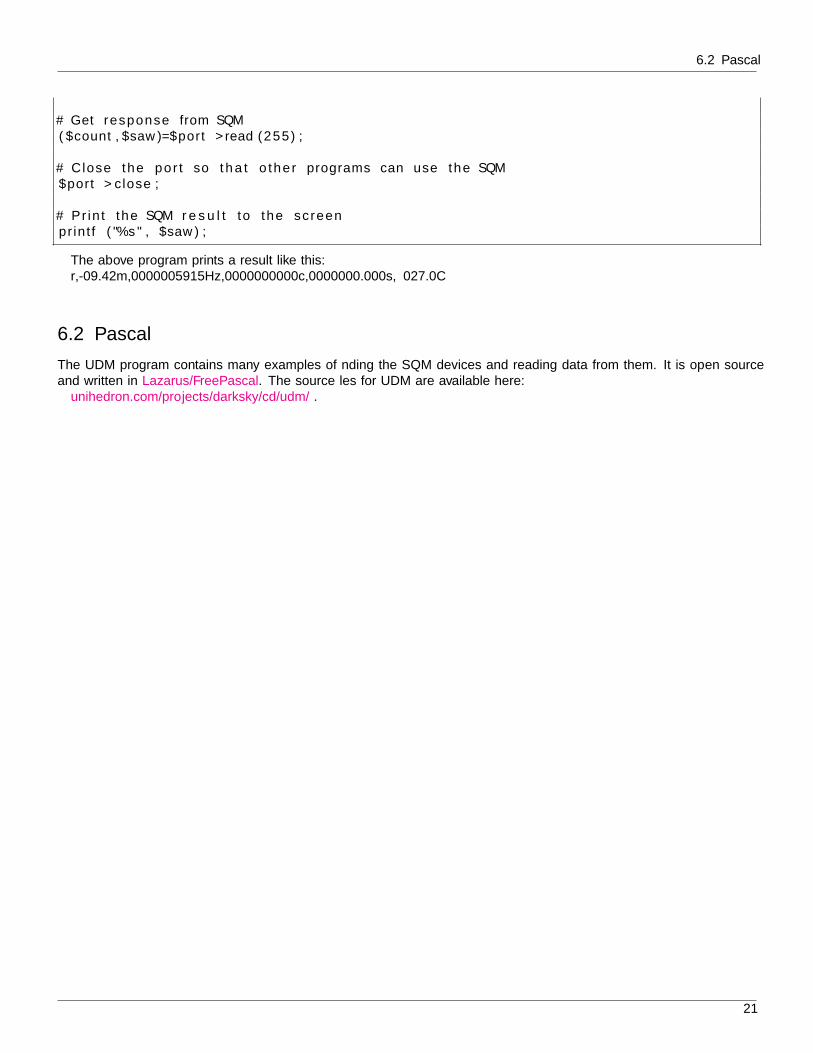
Various examples of reading from the SQM devices are supplied on the CD and available at the Unihedron website.Below is an example using Perl to read the SQM USB device:
Listing 6.1: Read SQM-LU using Perl
#! / usr / b in / p e r l
#Filename : read−sqmlu . p l#D e s c r i p t i o n : U t i l i t y to read Unihedron Sky Qua l i t y Meter−LU (USB model )
# Define the r e q u i r e d moduleuse Device : : S e r i a l P o r t ;
# Open and c o n f i g u r e s e r i a l por t$port= Device : : Se r i a lPor t−>new( ”/dev/ttyUSB2” ) ;$port−>user msg (ON) ;$port−>baudrate (115200) ;$port−>par i t y ( ”none” ) ;$port−>s t o p b i t s (1 ) ;$port−>datab i t s (8 ) ;$port−>handshake ( ”none” ) ;$port−>w r i t e s e t t i n g s | | undef $port ;$port−>r ead char t ime (1 ) ; # Wait f o r each c h a r a c t e r
# Send r e q u e s t to SQM$port−>write ( ” rx\ r ” ) ;
20
6.2 Pascal
# Get response from SQM( $count , $saw )=$port−>read (255) ;
# Close the por t so t h a t o the r programs can use the SQM$port−>close ;
# Print the SQM r e s u l t to the screenprintf ( ”%s ” , $saw ) ;
The above program prints a result like this:r,-09.42m,0000005915Hz,0000000000c,0000000.000s, 027.0C
6.2 Pascal
The UDM program contains many examples of finding the SQM devices and reading data from them. It is open sourceand written in Lazarus/FreePascal. The source files for UDM are available here:
unihedron.com/projects/darksky/cd/udm/ .
21
7 Unihedron Device Manager
The Unihedron Device Manager (UDM) program is intended for use in maintaining and testing the Unihedron connectedSky Quality Meter products. Windows, Mac, Linux versions of UDM area available on the supplied CD. It is used to:
• Read version information.
• Request readings.
• Read and set calibration data.
• Read and set all other meter parameters.
• Install new firmware.
• Setup and retrieve data from datalogging meters.
• Continuously log data from connected meters.
7.1 Getting UDM
UDM is supplied on the CD that shipped with the SQM-LU-DL. The latest version of UDM is available at the Unihedronwebsite at this location
www.unihedron.com/projects/darksky/cd/
7.2 Installation
7.2.1 System requirements
The UDM is a fairly simple (but large) program which should run sufficiently on any present-day computer under theWindows, Mac, or Linux operating systems.
7.2.2 Windows
The Windows version of UDM is in a setup.exe style file located in the Windows subdirectory of the CD, for example:
\Windows\setup1.0.0.38.exeSimply double-click on that file to start the installation procedure.
7.2.3 Mac
The Mac OSX version of UDM is a dmg file located in the Mac subdirectory of the CD, for example:
/Mac/udm.app.dmg
Drag the app to the /Applications directory.
7.2.4 Linux
The Linux version of UDM is available in a Debian package separately for both 32bit and 64bit systems located in theLinux directory of the CD, for example:
/Linux/udm 20140821-1 i386.deb
Open the file with package installer program like GDebi.
22
7.3 Operation
7.3 Operation
After starting UDM, a list of found devices should appear, if your device is not listed on the screen, try clicking “Find”once more to search for connected devices.
If more than one SQM device is found, then you will have to select (click) on one of the devices, otherwise if only onedevice is found, then click on “Version” or “Reading” of the information tab for more information.
The tabs can be used to select various functions when working with your selected device. These tabs and their functionsare described further in this document.
7.3.1 Start up
After starting the UDM program, a splash screen shown in Figure 7.1 is temporarily shown while the program searchesfor attached devices.
Figure 7.1: Splash screen
1. UDM searches for attached USB devices first. This step is fairly quick (a few seconds).
2. UDM then searches for attached Ethernet devices within the reach of the Ethernet network but not outside a firewall.This step may take about 30 seconds.
If no devices are found, then the main UDM program will be shown with the “found devices box” empty. You canattach an SQM device to your computer and press the “Find” button to search for the newly connected devices.
If you know that an Ethernet device is connected but it does not show up, then a network problem may be the cause.Also check the power connection to the SQM-LE.
If you know that a USB device is connected but it does not show up, then there may be a device driver issue. Checkthe USB device listing for your operating system. These USB devices should appear as a COMM port. Also, check thetroubleshooting notes in section 13 on page 63 for possible solutions.
7.3.2 Main screen
The main screen of UDM consist of the following sections:
23

7 Unihedron Device Manager
1. Window controls
2. Menu
3. Found devices box
4. Selected device details
5. Information section
6. Status bar
7.3.3 Main menu
The main menu of UDM consists of the items; File, View, Tools, Help as defined below.
7.3.4 File menu
The file menu is used for: opening files, finding newly attached devices, and quitting the program as shown in Figure 7.2.
Figure 7.2: File menu
File : Open
The “File : Open” menu item is used to open up previously stored log files or calibration reports.
24
7.3 Operation
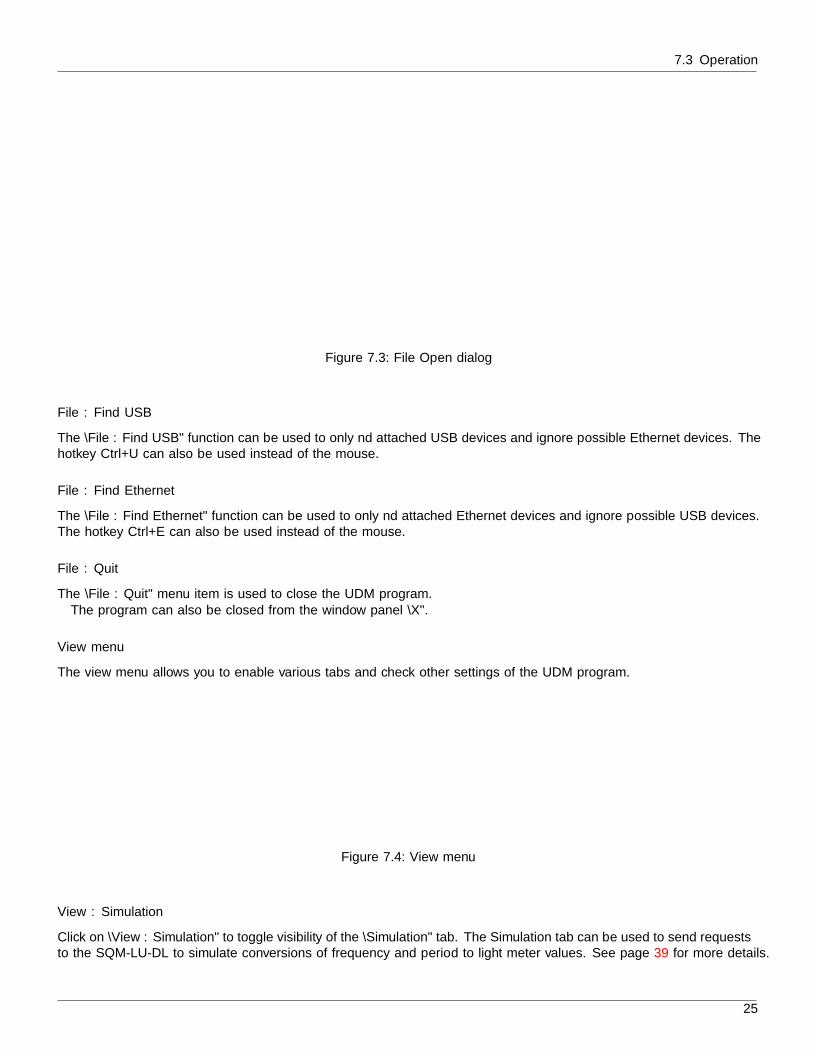
Figure 7.3: File Open dialog
File : Find USB
The “File : Find USB” function can be used to only find attached USB devices and ignore possible Ethernet devices. Thehotkey Ctrl+U can also be used instead of the mouse.
File : Find Ethernet
The “File : Find Ethernet” function can be used to only find attached Ethernet devices and ignore possible USB devices.The hotkey Ctrl+E can also be used instead of the mouse.
File : Quit
The “File : Quit” menu item is used to close the UDM program.The program can also be closed from the window panel “X”.
View menu
The view menu allows you to enable various tabs and check other settings of the UDM program.
Figure 7.4: View menu
View : Simulation
Click on “View : Simulation” to toggle visibility of the “Simulation” tab. The Simulation tab can be used to send requeststo the SQM-LU-DL to simulate conversions of frequency and period to light meter values. See page 39 for more details.
25
7 Unihedron Device Manager
View : Configuration
Click on “View : Configuration” to toggle visibility of the “Configuration” tab. The Configuration tab is used to configurethe SQM with its calibration values when calibrated light and dark settings are being performed.
View : Log shows a window of commands and responses sent to and received from the SQM during this session ofrunning UDM. Some excessively repetitive commands are suppressed from this listing.
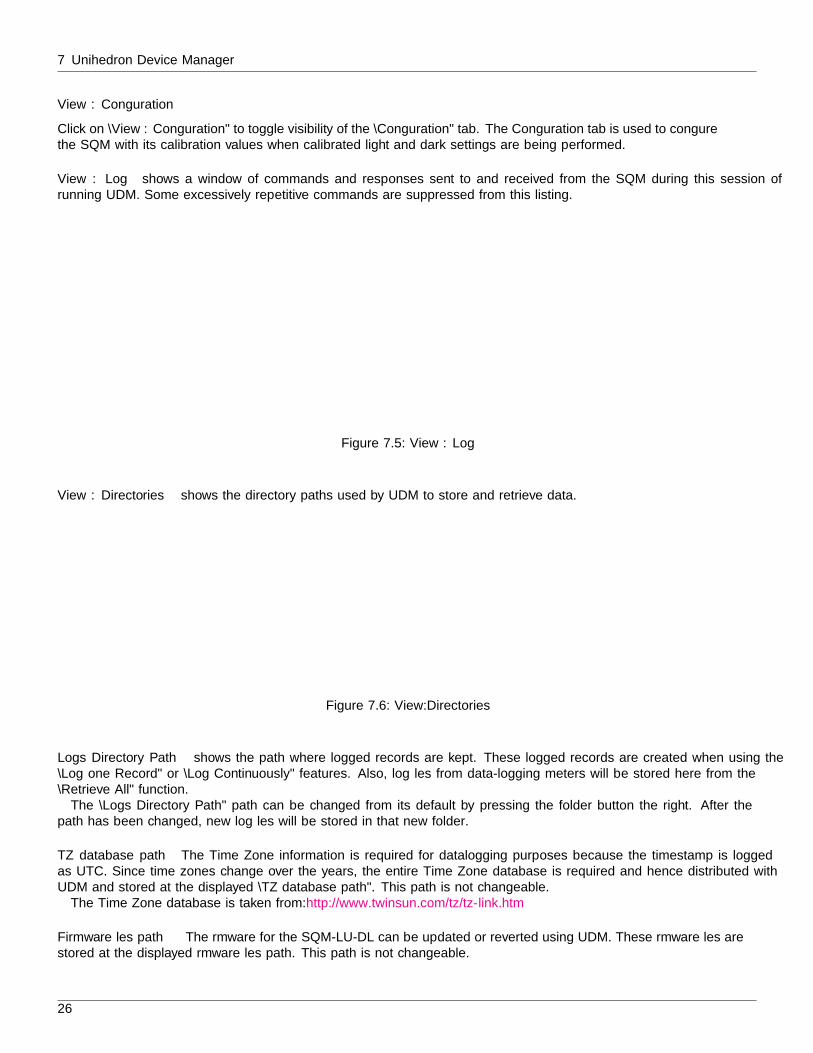
Figure 7.5: View : Log
View : Directories shows the directory paths used by UDM to store and retrieve data.
Figure 7.6: View:Directories
Logs Directory Path shows the path where logged records are kept. These logged records are created when using the“Log one Record” or “Log Continuously” features. Also, log files from data-logging meters will be stored here from the“Retrieve All” function.
The “Logs Directory Path” path can be changed from its default by pressing the folder button the right. After thepath has been changed, new log files will be stored in that new folder.
TZ database path The Time Zone information is required for datalogging purposes because the timestamp is loggedas UTC. Since time zones change over the years, the entire Time Zone database is required and hence distributed withUDM and stored at the displayed “TZ database path”. This path is not changeable.
The Time Zone database is taken from: http://www.twinsun.com/tz/tz-link.htm
Firmware files path The firmware for the SQM-LU-DL can be updated or reverted using UDM. These firmware files arestored at the displayed firmware files path. This path is not changeable.
26
7.3 Operation
Data Directory is the place where some data files are kept, specifically the change-log for UDM and firmware files. Thispath is not changeable.
Configfile path is the place where UDM stores its configuration about the program and attached SQM devices. Thispath is not changeable.
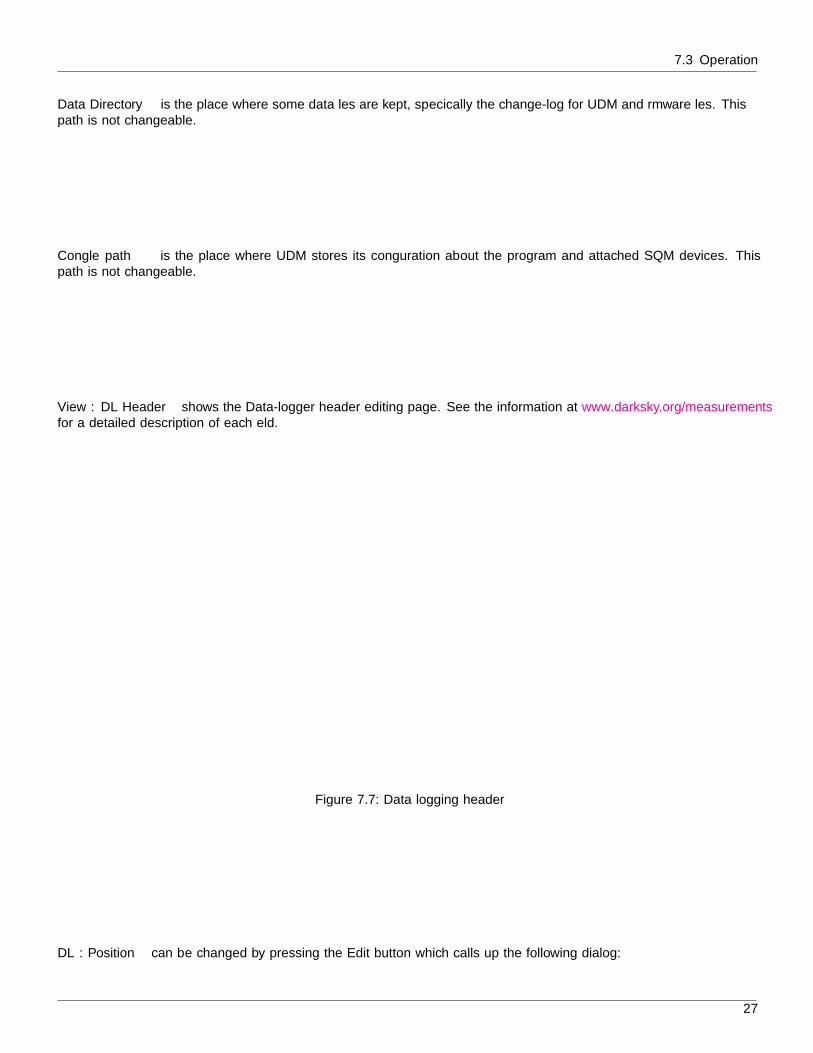
View : DL Header shows the Data-logger header editing page. See the information at www.darksky.org/measurementsfor a detailed description of each field.
Figure 7.7: Data logging header
DL : Position can be changed by pressing the Edit button which calls up the following dialog:
27
7 Unihedron Device Manager
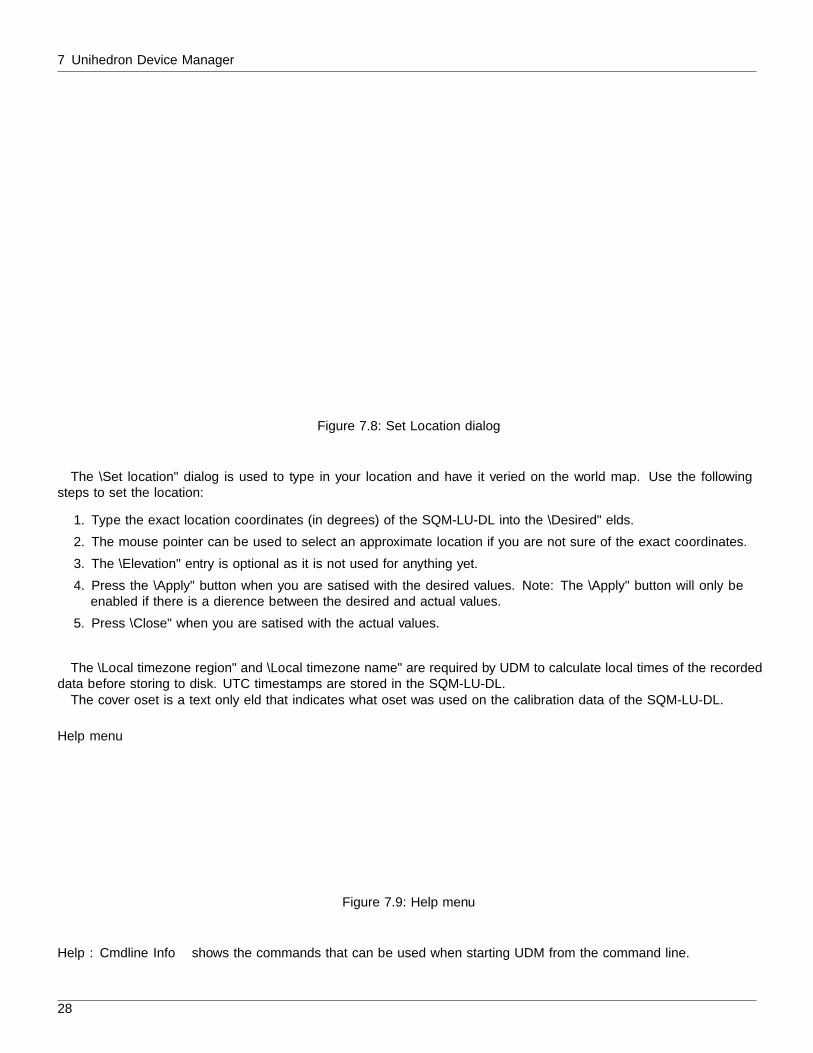
Figure 7.8: Set Location dialog
The “Set location” dialog is used to type in your location and have it verified on the world map. Use the followingsteps to set the location:
1. Type the exact location coordinates (in degrees) of the SQM-LU-DL into the “Desired” fields.
2. The mouse pointer can be used to select an approximate location if you are not sure of the exact coordinates.
3. The “Elevation” entry is optional as it is not used for anything yet.
4. Press the “Apply” button when you are satisfied with the desired values. Note: The “Apply” button will only beenabled if there is a difference between the desired and actual values.
5. Press “Close” when you are satisfied with the actual values.
The “Local timezone region” and “Local timezone name” are required by UDM to calculate local times of the recordeddata before storing to disk. UTC timestamps are stored in the SQM-LU-DL.
The cover offset is a text only field that indicates what offset was used on the calibration data of the SQM-LU-DL.
Help menu
Figure 7.9: Help menu
Help : Cmdline Info shows the commands that can be used when starting UDM from the command line.
28
7.3 Operation
Help : Version Info shows the detailed version information for the UDM software.
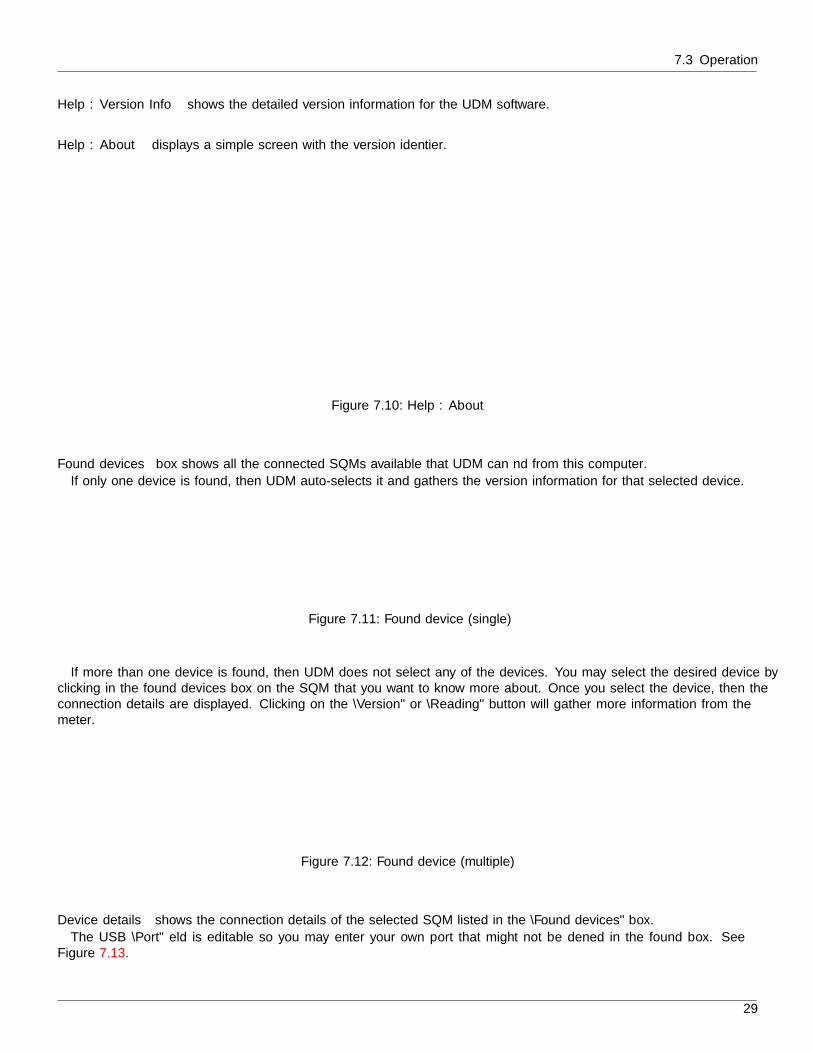
Help : About displays a simple screen with the version identifier.
Figure 7.10: Help : About
Found devices box shows all the connected SQMs available that UDM can find from this computer.
If only one device is found, then UDM auto-selects it and gathers the version information for that selected device.
Figure 7.11: Found device (single)
If more than one device is found, then UDM does not select any of the devices. You may select the desired device byclicking in the found devices box on the SQM that you want to know more about. Once you select the device, then theconnection details are displayed. Clicking on the “Version” or “Reading” button will gather more information from themeter.
Figure 7.12: Found device (multiple)
Device details shows the connection details of the selected SQM listed in the “Found devices” box.
The USB “Port” field is editable so you may enter your own port that might not be defined in the found box. SeeFigure 7.13.
29

7 Unihedron Device Manager
Figure 7.13: USB connection details
The Ethernet IP and port fields are editable so you may enter your own IP and port that might not be defined in thefound box. The default port number for the SQM-LE is 10001. See Figure 7.14.
Figure 7.14: Ethernet connection details
7.4 Information tab
The information tab is used to show information about the version and the reading of the selected SQM.Press the “Version” button for an updated list of data about the device version, and press the “Reading button” for
an updated list of data about the device reading.
Figure 7.15: Information tab
The Header button calls up the data file header entry screen, see the datalogging Header section on page 27 for moreinformation. This header information is used when storing logged data to the disk with the “Log one record” or “Logcontinuous” functions described below.
Log one record gathers one data record from the connected SQM and stores that information to a data log file on thedisk in the “Logs directory path”. The location of the file can be identified and changed by “View : Directories”. The logfile can be accessed later from the “File : Open” menu.
7.5 Log Continuous
The “Log continuous” function allows data from the connected SQM device to be logged repetitively as shown in Figure7.16.
30
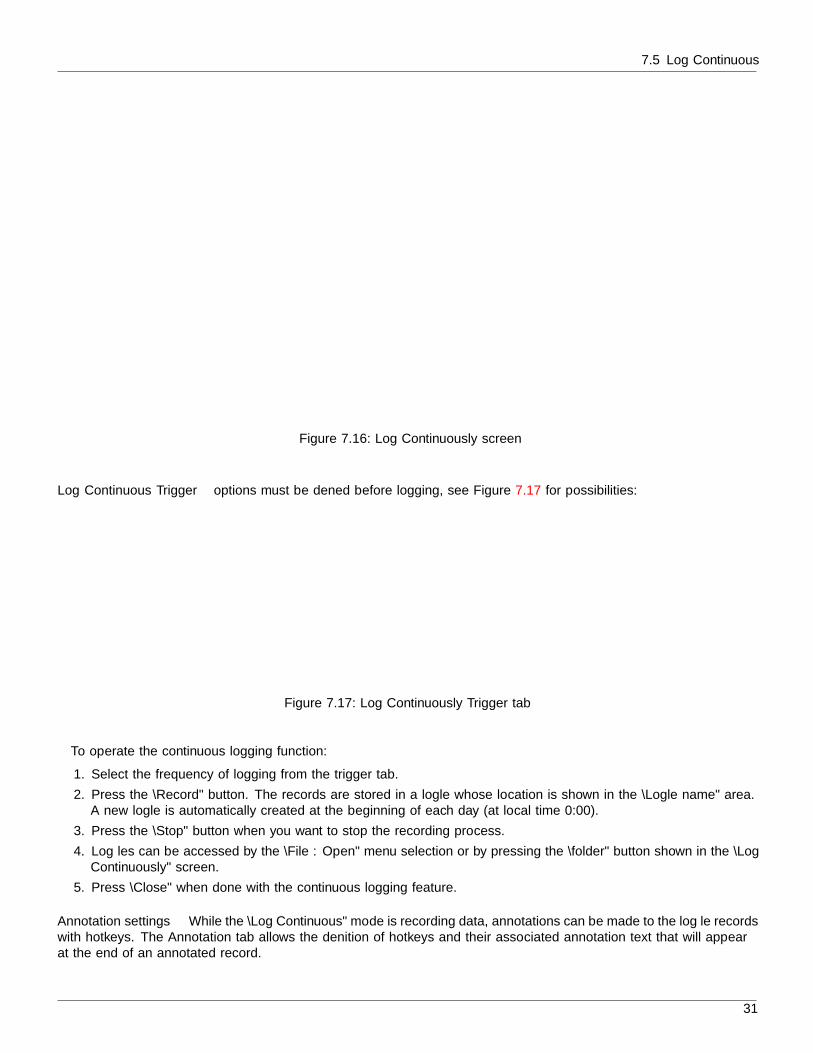
7.5 Log Continuous
Figure 7.16: Log Continuously screen
Log Continuous Trigger options must be defined before logging, see Figure 7.17 for possibilities:
Figure 7.17: Log Continuously Trigger tab
To operate the continuous logging function:
1. Select the frequency of logging from the trigger tab.
2. Press the “Record” button. The records are stored in a logfile whose location is shown in the “Logfile name” area.A new logfile is automatically created at the beginning of each day (at local time 0:00).
3. Press the “Stop” button when you want to stop the recording process.
4. Log files can be accessed by the “File : Open” menu selection or by pressing the “folder” button shown in the “LogContinuously” screen.
5. Press “Close” when done with the continuous logging feature.
Annotation settings While the “Log Continuous” mode is recording data, annotations can be made to the log file recordswith hotkeys. The Annotation tab allows the definition of hotkeys and their associated annotation text that will appearat the end of an annotated record.
31
7 Unihedron Device Manager
Figure 7.18: Log Continuously Annotation tab
Persistent annotation The “Persistent” mode makes the annotated text persistently appear at the end of each loggedrecord after the first time the hotkey is pressed.
Without “Persistent” checked, annotation text is only appended to a record when the hotkey is pressed, and otherrecords have no annotation text.
Synchronized annotation The “Synchronized” mode postpones annotation requests until the next scheduled record sothat the annotated text is synchronized with scheduled triggered recordings.
Without “Synchronized” checked, the hotkey will immediately trigger a record log, and the associated annotation textwill be appended to that triggered record.
7.6 Calibration tab
The Calibration tab is used to show and set the calibration data for the selected SQM device.
Figure 7.19: Calibration tab (initial)
32
7.7 Report Interval tab
Press the “Get Calibration Info” button so that the updated calibration data is brought in from the SQM on to theActual values boxes as show below.
Figure 7.20: Calibration tab (populated)
Use the following steps to change the calibration values:
1. Enter the new calibration data on the left side entry box (Desired values column).
2. Press the associated “Set” button.
3. The value is sent to the SQM, and then confirmed in the right side box (Actual values column).
Note that temperatures set in to the SQM use their own resolution and may not be reflected as the same value entered.For example. 24.7C might read back as 24.8 C.
The original factory calibration values were provided on a paper with the shipped unit. If you have lost this information,please contact Unihedron to have the information emailed.
7.7 Report Interval tab
The Report Interval tab is used to show and set the report interval information for the selected SQM. Report intervalsettings are used to control the SQM to send readings out at a regular rate (in seconds) and only if darker than a specifiedthreshold value. See section 8.5 on page 54 for more information about “Interval reporting”.
33
7 Unihedron Device Manager
Figure 7.21: Report interval tab
Use the “R” button to temporarily set the value in to RAM for experimentation. The new value will be used instantly.The RAM value is set to the EEPROM value on power-up.
Use the “E/R” button to set the value in to EEPROM and RAM. The new value will be used instantly and also afterpower up.
Report interval is measured in seconds (i.e. 300 = 5 minutes).
Report threshold is measured in Magnitudes per square arcsecond (mpsas), a larger positive value is darker.
7.8 Firmware tab
In a case where new firmware is supplied by Unihedron to correct bugs or add features, use this tab to select and loadfirmware in to the SQM-LU-DL.
All available versions of firmware are shipped with the UDM software package in case you want to revert to an earlierfirmware version for testing purposes. New firmware versions are announced on the Unihedron forum.
Figure 7.22: Firmware tab
Follow these steps to load new firmware:
1. Press the “Select Firmware” button to choose the firmware file to load in to the SQM as shown in Figure 7.23:
34

7.9 Configuration tab
Figure 7.23: Firmware selection
2. Select the desired firmware file then press “Open”.
3. The “Load firmware” button will be enabled and you can press it now to start loading the firmware in to theSQM-LU-DL. The status bar will indicate successful completion when the firmware has been completely loaded.
7.9 Configuration tab
The “Configuration tab” shows the factory set calibration values. A new calibration using a calibrated light source anddarkroom can be performed by following the instructions on the right side of the screen. The calibration report can belogged to a data file and also printed out from this screen.
Figure 7.24: Configuration tab
Warning confirmations as shown in Figure 7.25 and Figure 7.26 are shown when trying to calibrate the unit yourself:
35
7 Unihedron Device Manager
Figure 7.25: Light calibration confirmation
Figure 7.26: Dark calibration confirmation
7.10 Data Logging tab
The “Data Logging” tab is available when an SQM-LU-DL unit is connected and selected.
Figure 7.27: Data logging tab
Trigger group Select one of the items in the trigger group to define when the SQM-LU-DL will record data whileconnected to a battery instead of connected to the computer.
Threshold : mpsas Readings darker than the threshold value (mpsas) will be recorded. Readings brighter (lower value)than the threshold value will be ignored. The SQM-LU-DL still has to turn on to determine the brightness value.
Battery Life estimator Use the “Battery life estimator” to determine the approximate battery life with the selectedtrigger settings.
A custom mAH value may be entered directly into the “Capacity” field to instantly show a calculated duration approx-imation.
36
7.10 Data Logging tab
Device Clock To set the RTC on the SQM-LU-DL, press the “Device Clock” button to call up the “Real Time Clock”dialog. While the RTC dialog is shown, UDM continuously polls the SQM-LU-DL for an updated Unit clock value. TheUTC and local time are taken from the computer that UDM is running on.
Figure 7.28: Real Time Clock setting dialog
Pressing the “Set” button will copy the UTC time in to the SQM-LU-DL. Due to single second resolution, the clocksmay never match within 0 seconds difference. The SQM-LU-DL clock is as accurate as a common digital watch, it maydrift a few seconds per day.
Storage The “Storage” section shows the contents of the SQM-LU-DL data-logging memory.The position buttons shown below are used to move through the data-logger memory and view individual records:
Figure 7.29: Storage navigation
Table 7.2: Storage navigation button descriptions
Button Description
Move the current record pointer to the first record stored in the SQM-LU-DL and display that record.
Move the current record pointer back 10 percent of the total recordsand display that record. Does nothing if already displaying the firstrecord.
Move the current record pointer back one position and display thatrecord. Does nothing if already displaying the first record.
Table continued on next page ...
37

7 Unihedron Device Manager
Table 7.2 – continued from previous page
Column Description
Move the current record pointer forward one position and displaythat record. Does nothing if already displaying the last record.
Move the current record pointer forward 10 percent of the totalrecords and display that record. Does nothing if already displayingthe last record.
Move the current record pointer to the first record stored in the SQM-LU-DL and display that record. Note that if the meter is still record-ing values, the last position will be increasing, so continued pressesof this button may result in the display of new records.
Retrieve Press the “Retrieve” button to call up the “Retrieve” dialog shown in Figure 7.30.
Figure 7.30: DL Retrieve dialog window
Header The “Header” button calls up the details that are stored on the computer when a data-logger data is retrievedand written to disk. See page 27 for more information.
Retrieve All Press the “Retrieve All” button to collect all recorded data points from the SQM-LU-DL unit and store toa file. Depending on the number of data-points, this action may take a long time.
When the retrieval is complete, the file location will be shown in the “recent file” sdection. You can access that storedfile by pressing the file-folder icon to the right of that filename, the file contents will be shown in the text box at thebottom of the “DL Retrieve” dialog window.
38

7.11 Simulation Tab
Cancel Retrieve Press the “Cancel Retrieve” button to cancel a “Retrieve All” action.
Log one Press the “Log one” button to record a single record in the data log memory of the SQM-LU-DL. The datalog window will be instantly updated with the result of your action and point to the latest record.
Erase All The “Erase All” button calls up the “Erase” dialog window shown below
Figure 7.31: DL Erase dialog window
• The total size of erasable memory and range of erase time is shown.
• Pressing “Close” before the erasing starts will close this dialog window.
• Pressing the “Erase all” button on this dialog window starts the unstoppable erase procedure. All data log recordswill be removed from the SQM-LU-DL data log memory.
• While the erasing is taking place, the dialog window shows the current status of time taken to complete the erasure.
7.11 Simulation Tab
The “Simulation” tab is enabled from the View menu.The “Simulation” tab allows the simulation of raw light sensor values for experimentation purposes. The “Start”
button initiates feeding the range of values to the internal formulas of the SQM and results are displayed on this tab. Thesimulation will stop once all the steps are complete or when the “Stop” button is pressed.
Figure 7.32: Simulation tab
39

8 Commands and responses
The SQM-LU-DL accepts a sequence of characters as a command, then executes those commands and usually provides aresponse of a sequence of characters. The following details are useful when programming your own interface to send datato and receive data from the SQM-LU-DL.
8.1 Commands
Commands consist of a string of characters. The first character is the command type. The following is a list of the“Standard” commands:
Table 8.1: Summary of standard commands
Command Description
rx Reading request.
cx Calibration information request.
ix Unit information request (note lower case “i”).
zcalAx Arm Light Calibration command.
zcalBx Arm Dark Calibration command.
zcalDx Disarm Calibration command.
zcal5 Manually Set Light Calibration Offset.
zcal6 Manually Set Light Calibration Temperature.
zcal7 Manually Set Dark Calibration Time Period.
zcal8 Manually Set Dark Calibration Temperature.
0x19 Reset micro-controller. Hexadecimal value 19. See the “Firmware Upgrade” chapteron page 61 for more details.
: Intel Hex firmware upgrade initiation. See the “Firmware Upgrade” chapter onpage 61 for more details.
P...x Set period (in seconds) for interval reporting to EEPROM and RAM for bootingand immediate use. Firmware feature=13.
p...x Set period (in seconds) for interval reporting to RAM for immediate use. Firmwarefeature=13.
T...x Set threshold (in magarcsec2 ) for interval reporting only to EEPROM and RAM for
booting and immediate use. Firmware feature≥13.
t...x Set threshold (in magarcsec2 ) for interval reporting only to RAM for immediate use.
Firmware feature≥13.
Ix Request interval settings (note upper case “I”). Firmware feature≥13.
sx Request reading of internal variables.
S...x Simulate internal calculations.
40

8.1 Commands
The following is a list of the ”Data logger” commands:
Table 8.2: Summary of datalogger commands
Command Description
L0x Report on FLASH chip Manufacturer ID, and Device ID.
L1x Report on logging pointer.
LZx Report on logging capacity.
L2x Erase entire FLASH chip contents.
L3x Log one record.
L4...x Return one record.
L5x Get battery voltage.
LM.x Set Logging trigger mode, next digit defines mode.
Lmx Get Logging trigger mode.
LIx Logging Interval settings requested.
LPS...x Logging Interval period set in seconds.
LPM...x Logging Interval period set in minutes.
LT...x Logging Threshold for interval reports set.
Lcx Get real time clock data.
LC...x Set real time clock data.
Lsx Put unit to sleep.
Lax Get alarm data.
41

8 Commands and responses
8.2 Response details
8.2.1 Reading request
The “Reading” request “rx” or “Rx” commands the SQM-LU-DL to provide the current darkness value as well as allvariables used to generate that result.
Readings produced by this request are averaged internally by using the last 8 readings and shifting those values throughan 8 cell buffer then summing and dividing by 8. Use the “ux” command to get the un-averaged and most recent value.Averaging is only performed on period-mode readings (when the light sensor frequency is below 128Hz). Frequency modereadings (above 128Hz) are automatically averaged because the reading is taken from a one second sampling of pulses.
The format of the response is shown in table 8.3:
Table 8.3: Reading request response
Column Example value Description
0 r Indicates that a reading is being returned.
2-8 06.70m Reading in magarcsec2 .
Leading space for positive value.Leading negative sign (-) for negative value.A reading of 0.00m means that the light at the sensor has reachedthe upper brightness limit of the unit.
10-21 0000022921Hz Frequency of sensor in Hz.
23-33 0000000020c Period of sensor in counts, counts occur at a rate of 460.8 kHz(14.7456MHz/32).
35-46 0000000.000s Period of sensor in seconds with millisecond resolution.
48-54 039.4C Temperature measured at light sensor in degrees C.Leading space for positive value.Leading negative sign (-) for negative value.
55-56 Carriage return (0x0d), Line feed (0x0a).
An example of the response is:r, 06.70m,0000022921Hz,0000000020c,0000000.000s, 039.4C
0123456789 123456789 123456789 123456789 123456789 123456
Future versions of this reading string will only modify reported values beyond position 54. Characters 0 to 54 may beconsidered stable.
A special case “Rx” command returns the serial number in the same format as the interval report does. See page 54“Setting Interval reporting parameters” for report details.
8.2.2 Unaveraged reading request
The “unaveraged reading” request “ux” commands the meter to provide the current darkness value as well as all variablesused to generate that result. This readings is not averaged out like the “rx” command.
The format of the response is shown in table 8.4:
Table 8.4: Unaveraged reading request response
Column Example value Description
0 u Indicates that a reading is being returned.
Table continued on next page ...
42

8.2 Response details
Table 8.4 – continued from previous page
Column Example value Description
2-8 06.70m Reading in magarcsec2 .
Leading space for positive value.Leading negative sign (-) for negative value.A reading of 0.00m means that the light at the sensor has reachedthe upper brightness limit of the unit.
10-21 0000022921Hz Frequency of sensor in Hz.
23-33 0000000020c Period of sensor in counts, counts occur at a rate of 460.8 kHz(14.7456MHz/32).
35-46 0000000.000s Period of sensor in seconds with millisecond resolution.
48-54 039.4C Temperature measured at light sensor in degrees C.Leading space for positive value.Leading negative sign (-) for negative value.
55-56 Carriage return (0x0d), Line feed (0x0a).
An example of the response is:u, 06.70m,0000022921Hz,0000000020c,0000000.000s, 039.4C
0123456789 123456789 123456789 123456789 123456789 123456
Future versions of this reading string will only modify reported values beyond position 54. Characters 0 to 54 may beconsidered stable.
8.2.3 Unit information
Unit information command “ix” provides details about the software in the micro-controller.The format of the response is:
Table 8.5: Unit information request response
Column Example value Description
0 i Indicates that the unit information response is being returned.
2-9 00000002 Protocol number (8 digits). This will always be the first 8 char-acters (after the “i,” response). This value indicates the revisionnumber of the data protocol to/from the SQM-LU-DL. The protocolversion is independent of the feature version.
11-18 00000003 Model number (8 digits). The model value identifies the specifichardware model that the firmware is tailored for.
20-27 00000001 Feature number (8 digits). The feature value identifies softwarefeatures. This number is independent of the data protocol.
29-36 00000413 Serial number (8 digits). Each unit has its own unique serial num-ber.
37-38 Carriage return (0x0d), Line feed (0x0a).
An example of the response is:
i,00000002,00000003,00000001,00000413
0123456789 123456789 123456789 12345678
43
8 Commands and responses
8.3 Calibration commands
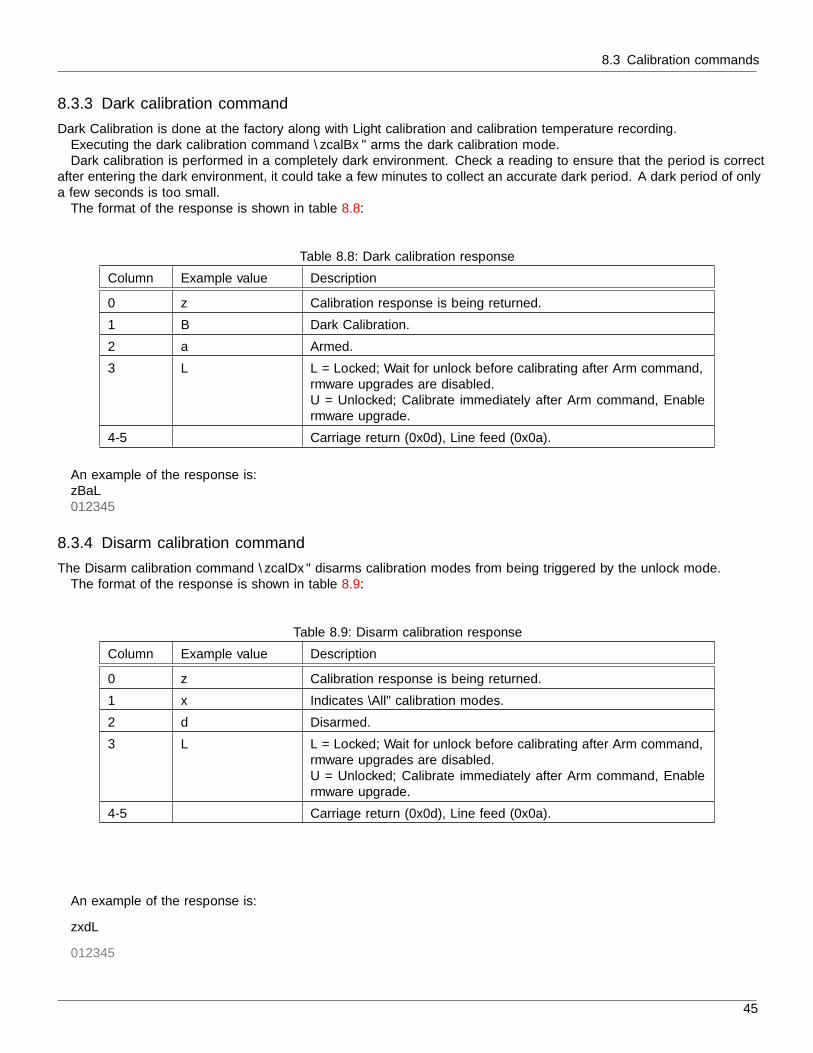
8.3.1 Calibration information request
The calibration information request “cx” returns all data about the specific light sensor in the unit required to calculatea reading.
The format of the response is shown in table 8.6:
Table 8.6: Calibration information request response
Column Example value Description
0 c Indicates that the calibration information is being returned.
2-13 00000017.60m Light calibration offset in magarcsec2 .
15-26 0000000.000s Dark calibration time period in seconds with millisecond resolution.
28-34 039.4C Temperature in degrees C measured during light calibration.Leading space for positive value.Leading negative sign (-) for negative value.
36-47 00000008.71m Offset of light sensor in magarcsec2 based on manufacturing reference.
49-55 039.4C Temperature in degrees C measured during dark calibration.Leading space for positive value.Leading negative sign (-) for negative value.
56-57 Carriage return (0x0d), Line feed (0x0a).
An example of the response is:c,00000017.60m,0000000.000s, 039.4C,00000008.71m, 039.4C
0123456789 123456789 123456789 123456789 123456789 1234567
8.3.2 Light calibration command
Calibration of the SQM-LU-DL is done at the factory in a controlled light and temperature environment.Executing the Light calibration command “zcalAx” arms the light calibration mode.A calibrated light source of approximately 13.5fc is supplied to the sensor.The format of the response is shown in table 8.7:
Table 8.7: Light calibration response
Column Example value Description
0 z Indicates that a “Calibration” response is being returned.
1 A Indicates Light Calibration mode.
2 a Indicates that the calibration is armed.
3 L L = Locked; Wait for unlock before calibrating after Arm command,firmware upgrades are disabled.U = Unlocked; Calibrate immediately after Arm command, Enablefirmware upgrade.
4-5 Carriage return (0x0d), Line feed (0x0a).
An example of the response is:zAaL
012345
44
8.3 Calibration commands
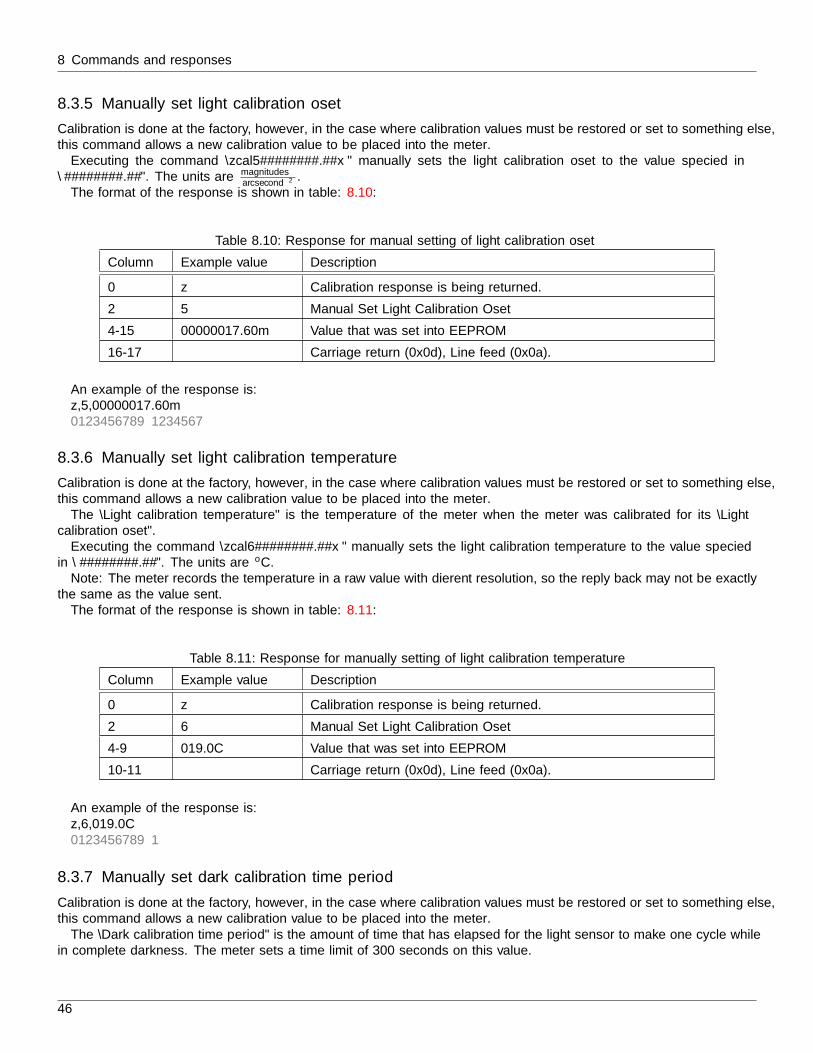
8.3.3 Dark calibration command
Dark Calibration is done at the factory along with Light calibration and calibration temperature recording.Executing the dark calibration command “zcalBx” arms the dark calibration mode.Dark calibration is performed in a completely dark environment. Check a reading to ensure that the period is correct
after entering the dark environment, it could take a few minutes to collect an accurate dark period. A dark period of onlya few seconds is too small.
The format of the response is shown in table 8.8:
Table 8.8: Dark calibration response
Column Example value Description
0 z Calibration response is being returned.
1 B Dark Calibration.
2 a Armed.
3 L L = Locked; Wait for unlock before calibrating after Arm command,firmware upgrades are disabled.U = Unlocked; Calibrate immediately after Arm command, Enablefirmware upgrade.
4-5 Carriage return (0x0d), Line feed (0x0a).
An example of the response is:zBaL
012345
8.3.4 Disarm calibration command
The Disarm calibration command “zcalDx” disarms calibration modes from being triggered by the unlock mode.The format of the response is shown in table 8.9:
Table 8.9: Disarm calibration response
Column Example value Description
0 z Calibration response is being returned.
1 x Indicates “All” calibration modes.
2 d Disarmed.
3 L L = Locked; Wait for unlock before calibrating after Arm command,firmware upgrades are disabled.U = Unlocked; Calibrate immediately after Arm command, Enablefirmware upgrade.
4-5 Carriage return (0x0d), Line feed (0x0a).
An example of the response is:
zxdL
012345
45
8 Commands and responses
8.3.5 Manually set light calibration offset
Calibration is done at the factory, however, in the case where calibration values must be restored or set to something else,this command allows a new calibration value to be placed into the meter.
Executing the command “zcal5########.##x” manually sets the light calibration offset to the value specified in“########.##”. The units are magnitudes
arcsecond2 .The format of the response is shown in table: 8.10:
Table 8.10: Response for manual setting of light calibration offset
Column Example value Description
0 z Calibration response is being returned.
2 5 Manual Set Light Calibration Offset
4-15 00000017.60m Value that was set into EEPROM
16-17 Carriage return (0x0d), Line feed (0x0a).
An example of the response is:z,5,00000017.60m
0123456789 1234567
8.3.6 Manually set light calibration temperature
Calibration is done at the factory, however, in the case where calibration values must be restored or set to something else,this command allows a new calibration value to be placed into the meter.
The “Light calibration temperature” is the temperature of the meter when the meter was calibrated for its “Lightcalibration offset”.
Executing the command “zcal6########.##x” manually sets the light calibration temperature to the value specifiedin “########.##”. The units are oC.
Note: The meter records the temperature in a raw value with different resolution, so the reply back may not be exactlythe same as the value sent.
The format of the response is shown in table: 8.11:
Table 8.11: Response for manually setting of light calibration temperature
Column Example value Description
0 z Calibration response is being returned.
2 6 Manual Set Light Calibration Offset
4-9 019.0C Value that was set into EEPROM
10-11 Carriage return (0x0d), Line feed (0x0a).
An example of the response is:z,6,019.0C
0123456789 1
8.3.7 Manually set dark calibration time period
Calibration is done at the factory, however, in the case where calibration values must be restored or set to something else,this command allows a new calibration value to be placed into the meter.
The “Dark calibration time period” is the amount of time that has elapsed for the light sensor to make one cycle whilein complete darkness. The meter sets a time limit of 300 seconds on this value.
46

8.3 Calibration commands
Executing the command “zcal7#######.###x” manually sets the light calibration offset to the value specified in“#######.###”. The units are in seconds.
The format of the response is shown in table: 8.12:
Table 8.12: Response of manually setting dark calibration time period
Column Example value Description
0 z Calibration response is being returned.
2 7 Manual Set Dark Calibration time period.
4-15 0000300.000s Value that was set into EEPROM
16-17 Carriage return (0x0d), Line feed (0x0a).
An example of the response is:z,7,00000300.00s
0123456789 1234567
8.3.8 Manually set dark calibration temperature
Calibration is done at the factory, however, in the case where calibration values must be restored or set to something else,this command allows a new calibration value to be placed into the meter.
The “Dark calibration temperature” is the temperature of the meter when the meter was calibrated for its “Darkcalibration time period”.
Executing the command “zcal8########.##x” manually sets the light calibration offset to the value specified in“########.##”. The units are oC.
Note: The meter records the temperature in a raw value with different resolution, so the reply back may not be exactlythe same as the value sent.
The format of the response is shown in table: 8.13:
Table 8.13: Response for manually setting of dark calibration temperature
Column Example value Description
0 z Calibration response is being returned.
2 8 Manual Set Dark Calibration temperature.
4-9 019.0C Value that was set into EEPROM
10-11 Carriage return (0x0d), Line feed (0x0a).
An example of the response is:z,8,019.0C
0123456789 1
47
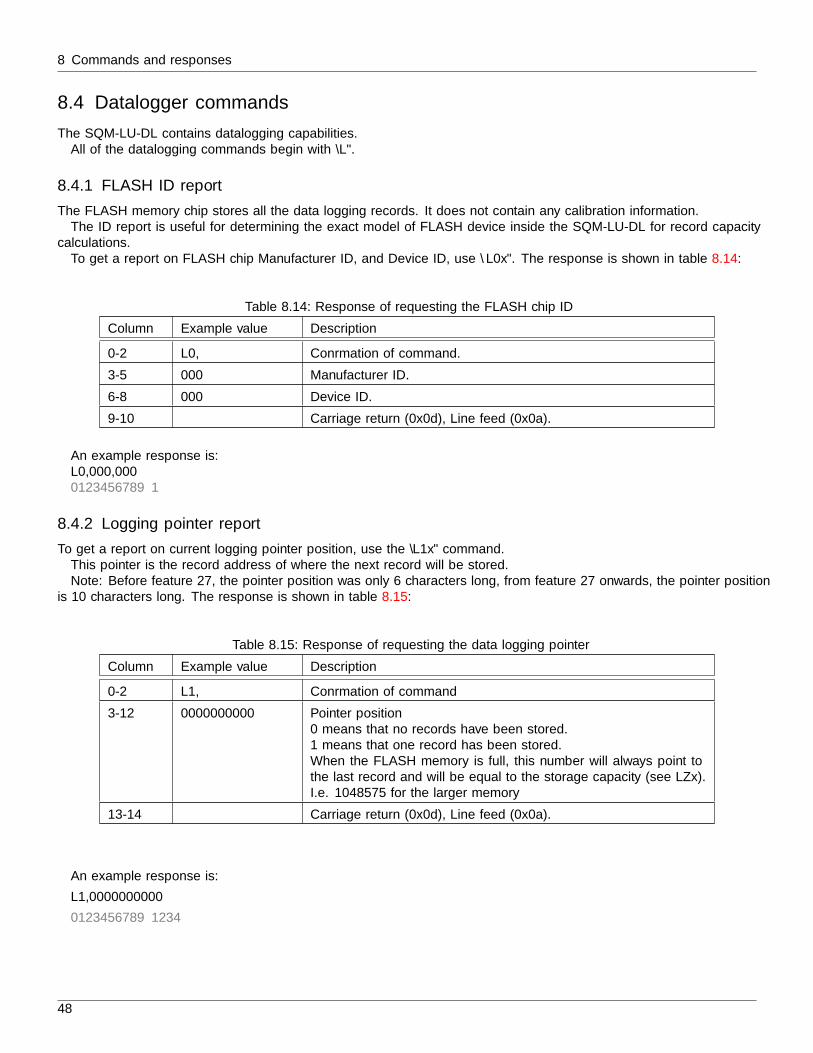
8 Commands and responses
8.4 Datalogger commands
The SQM-LU-DL contains datalogging capabilities.All of the datalogging commands begin with “L”.
8.4.1 FLASH ID report
The FLASH memory chip stores all the data logging records. It does not contain any calibration information.The ID report is useful for determining the exact model of FLASH device inside the SQM-LU-DL for record capacity
calculations.To get a report on FLASH chip Manufacturer ID, and Device ID, use “L0x”. The response is shown in table 8.14:
Table 8.14: Response of requesting the FLASH chip ID
Column Example value Description
0-2 L0, Confirmation of command.
3-5 000 Manufacturer ID.
6-8 000 Device ID.
9-10 Carriage return (0x0d), Line feed (0x0a).
An example response is:L0,000,000
0123456789 1
8.4.2 Logging pointer report
To get a report on current logging pointer position, use the “L1x” command.This pointer is the record address of where the next record will be stored.Note: Before feature 27, the pointer position was only 6 characters long, from feature 27 onwards, the pointer position
is 10 characters long. The response is shown in table 8.15:
Table 8.15: Response of requesting the data logging pointer
Column Example value Description
0-2 L1, Confirmation of command
3-12 0000000000 Pointer position0 means that no records have been stored.1 means that one record has been stored.When the FLASH memory is full, this number will always point tothe last record and will be equal to the storage capacity (see LZx).I.e. 1048575 for the larger memory
13-14 Carriage return (0x0d), Line feed (0x0a).
An example response is:
L1,0000000000
0123456789 1234
48
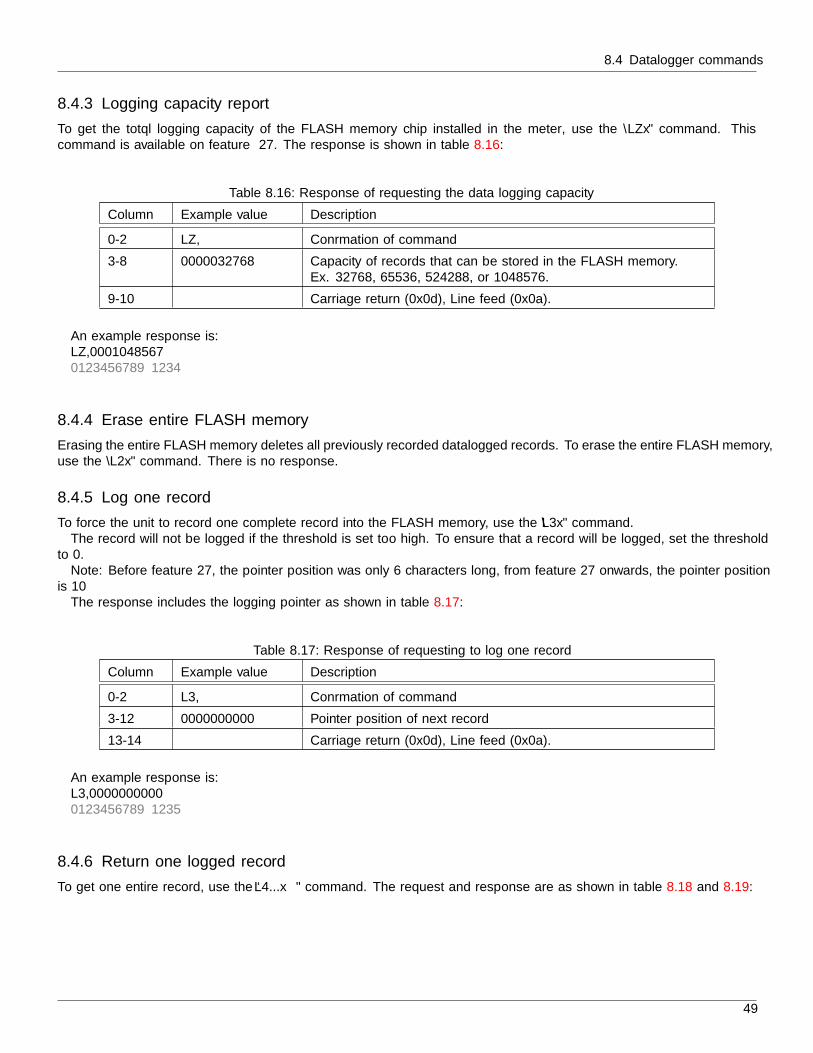
8.4 Datalogger commands
8.4.3 Logging capacity report
To get the totql logging capacity of the FLASH memory chip installed in the meter, use the “LZx” command. Thiscommand is available on feature ≥27. The response is shown in table 8.16:
Table 8.16: Response of requesting the data logging capacity
Column Example value Description
0-2 LZ, Confirmation of command
3-8 0000032768 Capacity of records that can be stored in the FLASH memory.Ex. 32768, 65536, 524288, or 1048576.
9-10 Carriage return (0x0d), Line feed (0x0a).
An example response is:LZ,0001048567
0123456789 1234
8.4.4 Erase entire FLASH memory
Erasing the entire FLASH memory deletes all previously recorded datalogged records. To erase the entire FLASH memory,use the “L2x” command. There is no response.
8.4.5 Log one record
To force the unit to record one complete record into the FLASH memory, use the “L3x” command.The record will not be logged if the threshold is set too high. To ensure that a record will be logged, set the threshold
to 0.Note: Before feature 27, the pointer position was only 6 characters long, from feature 27 onwards, the pointer position
is 10The response includes the logging pointer as shown in table 8.17:
Table 8.17: Response of requesting to log one record
Column Example value Description
0-2 L3, Confirmation of command
3-12 0000000000 Pointer position of next record
13-14 Carriage return (0x0d), Line feed (0x0a).
An example response is:L3,0000000000
0123456789 1235
8.4.6 Return one logged record
To get one entire record, use the ‘L4...x” command. The request and response are as shown in table 8.18 and 8.19:
49
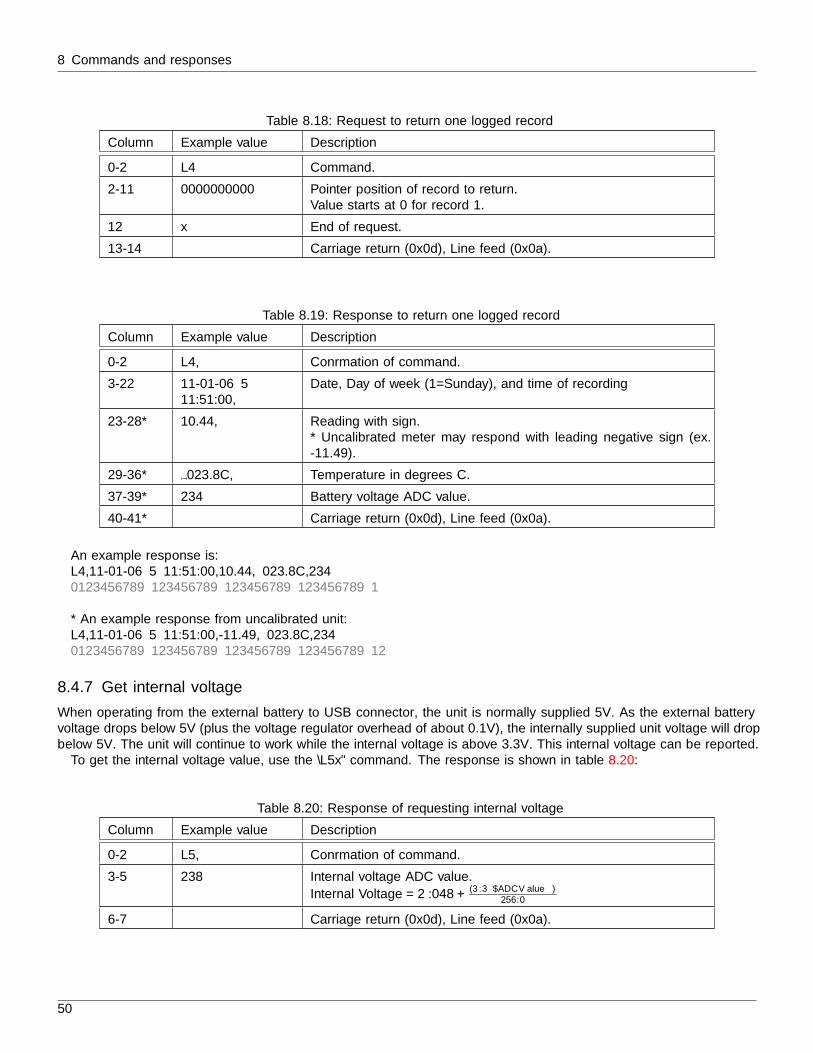
8 Commands and responses
Table 8.18: Request to return one logged record
Column Example value Description
0-2 L4 Command.
2-11 0000000000 Pointer position of record to return.Value starts at 0 for record 1.
12 x End of request.
13-14 Carriage return (0x0d), Line feed (0x0a).
Table 8.19: Response to return one logged record
Column Example value Description
0-2 L4, Confirmation of command.
3-22 11-01-06 5
11:51:00,
Date, Day of week (1=Sunday), and time of recording
23-28* 10.44, Reading with sign.* Uncalibrated meter may respond with leading negative sign (ex.-11.49).
29-36* 023.8C, Temperature in degrees C.
37-39* 234 Battery voltage ADC value.
40-41* Carriage return (0x0d), Line feed (0x0a).
An example response is:L4,11-01-06 5 11:51:00,10.44, 023.8C,234
0123456789 123456789 123456789 123456789 1
* An example response from uncalibrated unit:L4,11-01-06 5 11:51:00,-11.49, 023.8C,234
0123456789 123456789 123456789 123456789 12
8.4.7 Get internal voltage
When operating from the external battery to USB connector, the unit is normally supplied 5V. As the external batteryvoltage drops below 5V (plus the voltage regulator overhead of about 0.1V), the internally supplied unit voltage will dropbelow 5V. The unit will continue to work while the internal voltage is above 3.3V. This internal voltage can be reported.
To get the internal voltage value, use the “L5x” command. The response is shown in table 8.20:
Table 8.20: Response of requesting internal voltage
Column Example value Description
0-2 L5, Confirmation of command.
3-5 238 Internal voltage ADC value.
Internal Voltage = 2.048 + (3.3∗$ADCV alue)256.0
6-7 Carriage return (0x0d), Line feed (0x0a).
50
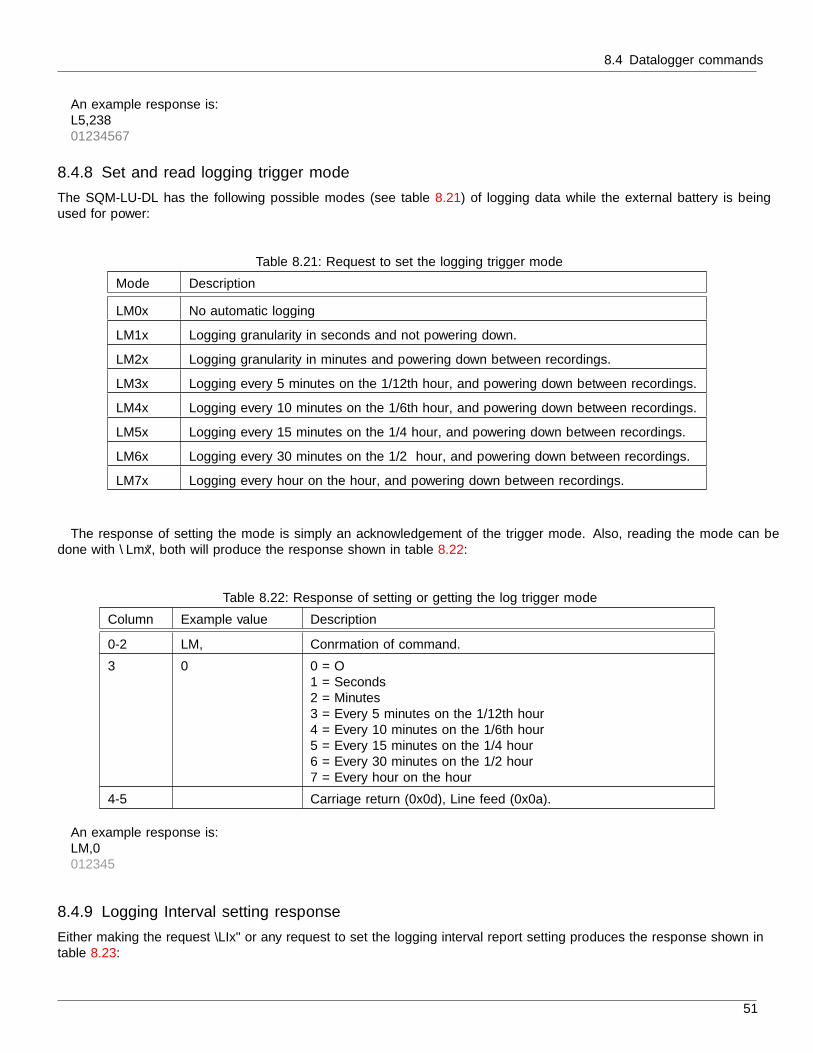
8.4 Datalogger commands
An example response is:L5,238
01234567
8.4.8 Set and read logging trigger mode
The SQM-LU-DL has the following possible modes (see table 8.21) of logging data while the external battery is beingused for power:
Table 8.21: Request to set the logging trigger mode
Mode Description
LM0x No automatic logging
LM1x Logging granularity in seconds and not powering down.
LM2x Logging granularity in minutes and powering down between recordings.
LM3x Logging every 5 minutes on the 1/12th hour, and powering down between recordings.
LM4x Logging every 10 minutes on the 1/6th hour, and powering down between recordings.
LM5x Logging every 15 minutes on the 1/4 hour, and powering down between recordings.
LM6x Logging every 30 minutes on the 1/2 hour, and powering down between recordings.
LM7x Logging every hour on the hour, and powering down between recordings.
The response of setting the mode is simply an acknowledgement of the trigger mode. Also, reading the mode can bedone with “Lmx”, both will produce the response shown in table 8.22:
Table 8.22: Response of setting or getting the log trigger mode
Column Example value Description
0-2 LM, Confirmation of command.
3 0 0 = Off1 = Seconds2 = Minutes3 = Every 5 minutes on the 1/12th hour4 = Every 10 minutes on the 1/6th hour5 = Every 15 minutes on the 1/4 hour6 = Every 30 minutes on the 1/2 hour7 = Every hour on the hour
4-5 Carriage return (0x0d), Line feed (0x0a).
An example response is:LM,0
012345
8.4.9 Logging Interval setting response
Either making the request “LIx” or any request to set the logging interval report setting produces the response shown intable 8.23:
51
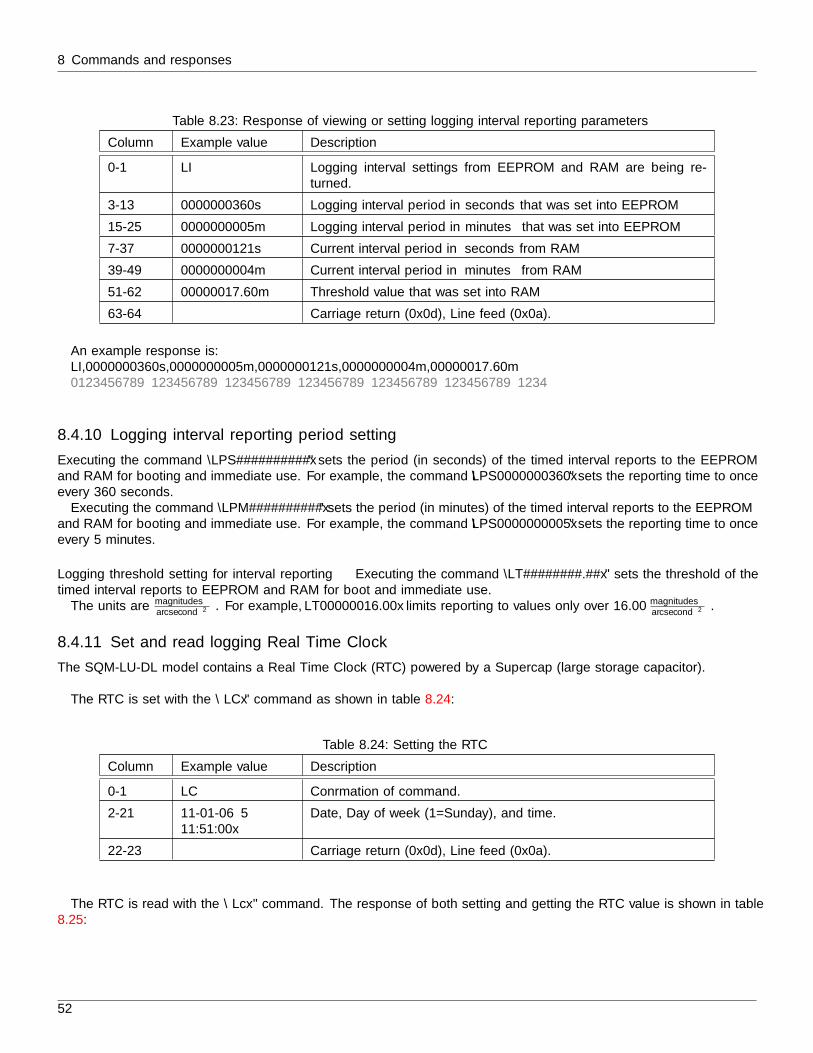
8 Commands and responses
Table 8.23: Response of viewing or setting logging interval reporting parameters
Column Example value Description
0-1 LI Logging interval settings from EEPROM and RAM are being re-turned.
3-13 0000000360s Logging interval period in seconds that was set into EEPROM
15-25 0000000005m Logging interval period in minutes that was set into EEPROM
7-37 0000000121s Current interval period in seconds from RAM
39-49 0000000004m Current interval period in minutes from RAM
51-62 00000017.60m Threshold value that was set into RAM
63-64 Carriage return (0x0d), Line feed (0x0a).
An example response is:LI,0000000360s,0000000005m,0000000121s,0000000004m,00000017.60m
0123456789 123456789 123456789 123456789 123456789 123456789 1234
8.4.10 Logging interval reporting period setting
Executing the command “LPS##########x” sets the period (in seconds) of the timed interval reports to the EEPROMand RAM for booting and immediate use. For example, the command “LPS0000000360x” sets the reporting time to onceevery 360 seconds.
Executing the command “LPM##########x” sets the period (in minutes) of the timed interval reports to the EEPROMand RAM for booting and immediate use. For example, the command “LPS0000000005x” sets the reporting time to onceevery 5 minutes.
Logging threshold setting for interval reporting Executing the command “LT########.##x” sets the threshold of thetimed interval reports to EEPROM and RAM for boot and immediate use.
The units are magnitudesarcsecond2 . For example, LT00000016.00x limits reporting to values only over 16.00 magnitudes
arcsecond2 .
8.4.11 Set and read logging Real Time Clock
The SQM-LU-DL model contains a Real Time Clock (RTC) powered by a Supercap (large storage capacitor).
The RTC is set with the “LCx” command as shown in table 8.24:
Table 8.24: Setting the RTC
Column Example value Description
0-1 LC Confirmation of command.
2-21 11-01-06 5
11:51:00x
Date, Day of week (1=Sunday), and time.
22-23 Carriage return (0x0d), Line feed (0x0a).
The RTC is read with the “Lcx” command. The response of both setting and getting the RTC value is shown in table8.25:
52

8.4 Datalogger commands
Table 8.25: Response of getting the RTC values
Column Example value Description
0-2 LC, Confirmation of setting command.
0-2 Lc, Confirmation of getting command.
3-21 11-01-06 5
11:51:00
Date, Day of week (1=Sunday), and time.
22-23 Carriage return (0x0d), Line feed (0x0a).
An example response is:Lc,11-01-06 5 11:51:00
0123456789 123456789 123
8.4.12 Put datalogging unit to sleep
For test purposes, the SQM-LU-DL can be put to sleep with the “Lsx” command so that the quiescent battery currentcan be measured. The unit must be awakened by re-applying power (cold-start).
8.4.13 Gather alarm 0 data from RTC
For tests purposes, the SQM-LU-DL RTC “Alarm 0” data can be retrieved with the “Lax” command. The response isshown in table 8.26:
Table 8.26: Response of getting the RTC “Alarm 0” value
Column Example value Description
0-1 La, Confirmation of command.
3-6 000, Address 07H, SecondsSee “DS1305N"+ RTC chip information for details.
7-10 128, Address 08H, minutes.
11-14 128, Address 09H, hours.
15-18 128, Address 0AH, day.
19-21 001, Address 0FH, Control register.
22-23 Carriage return (0x0d), Line feed (0x0a).
An example response is:La,000,128,128,128,001
0123456789 123456789 123
53
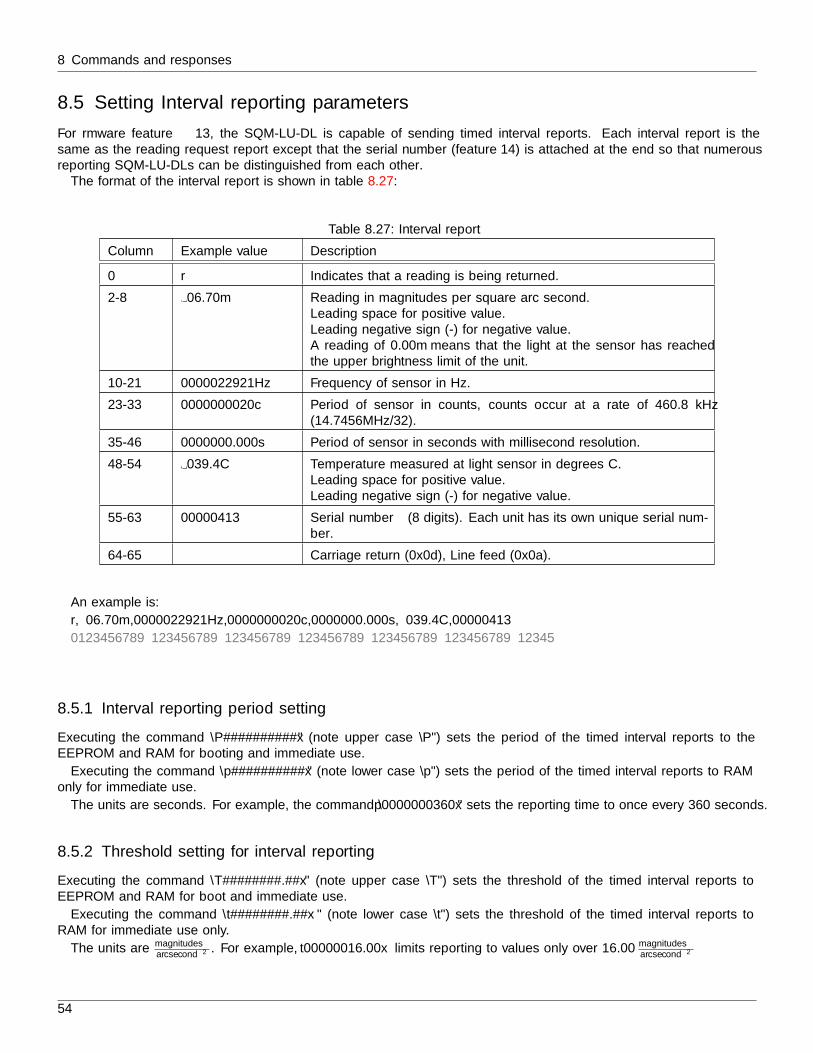
8 Commands and responses
8.5 Setting Interval reporting parameters
For firmware feature ≥13, the SQM-LU-DL is capable of sending timed interval reports. Each interval report is thesame as the reading request report except that the serial number (feature ≥14) is attached at the end so that numerousreporting SQM-LU-DLs can be distinguished from each other.
The format of the interval report is shown in table 8.27:
Table 8.27: Interval report
Column Example value Description
0 r Indicates that a reading is being returned.
2-8 06.70m Reading in magnitudes per square arc second.Leading space for positive value.Leading negative sign (-) for negative value.A reading of 0.00m means that the light at the sensor has reachedthe upper brightness limit of the unit.
10-21 0000022921Hz Frequency of sensor in Hz.
23-33 0000000020c Period of sensor in counts, counts occur at a rate of 460.8 kHz(14.7456MHz/32).
35-46 0000000.000s Period of sensor in seconds with millisecond resolution.
48-54 039.4C Temperature measured at light sensor in degrees C.Leading space for positive value.Leading negative sign (-) for negative value.
55-63 00000413 Serial number (8 digits). Each unit has its own unique serial num-ber.
64-65 Carriage return (0x0d), Line feed (0x0a).
An example is:
r, 06.70m,0000022921Hz,0000000020c,0000000.000s, 039.4C,00000413
0123456789 123456789 123456789 123456789 123456789 123456789 12345
8.5.1 Interval reporting period setting
Executing the command “P##########x” (note upper case “P”) sets the period of the timed interval reports to theEEPROM and RAM for booting and immediate use.
Executing the command “p##########x” (note lower case “p”) sets the period of the timed interval reports to RAMonly for immediate use.
The units are seconds. For example, the command “p0000000360x” sets the reporting time to once every 360 seconds.
8.5.2 Threshold setting for interval reporting
Executing the command “T########.##x” (note upper case “T”) sets the threshold of the timed interval reports toEEPROM and RAM for boot and immediate use.
Executing the command “t########.##x” (note lower case “t”) sets the threshold of the timed interval reports toRAM for immediate use only.
The units are magnitudesarcsecond2 . For example, t00000016.00x limits reporting to values only over 16.00 magnitudes
arcsecond2
54
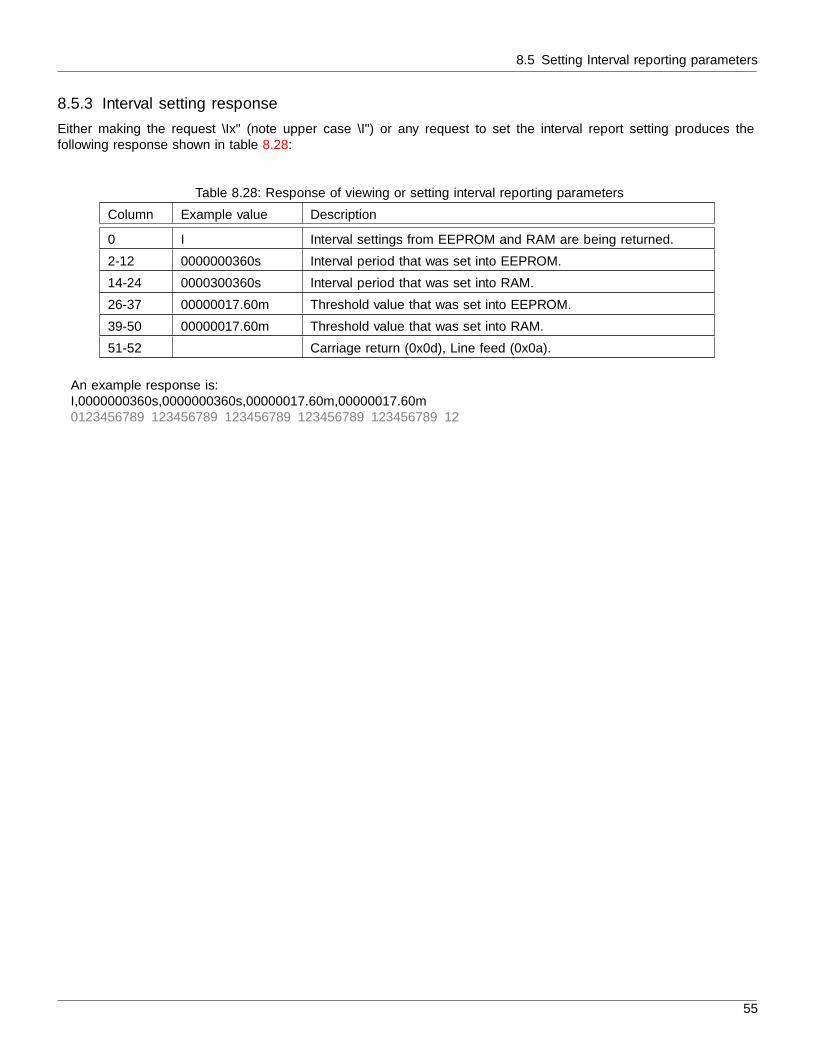
8.5 Setting Interval reporting parameters
8.5.3 Interval setting response
Either making the request “Ix” (note upper case “I”) or any request to set the interval report setting produces thefollowing response shown in table 8.28:
Table 8.28: Response of viewing or setting interval reporting parameters
Column Example value Description
0 I Interval settings from EEPROM and RAM are being returned.
2-12 0000000360s Interval period that was set into EEPROM.
14-24 0000300360s Interval period that was set into RAM.
26-37 00000017.60m Threshold value that was set into EEPROM.
39-50 00000017.60m Threshold value that was set into RAM.
51-52 Carriage return (0x0d), Line feed (0x0a).
An example response is:I,0000000360s,0000000360s,00000017.60m,00000017.60m
0123456789 123456789 123456789 123456789 123456789 12
55
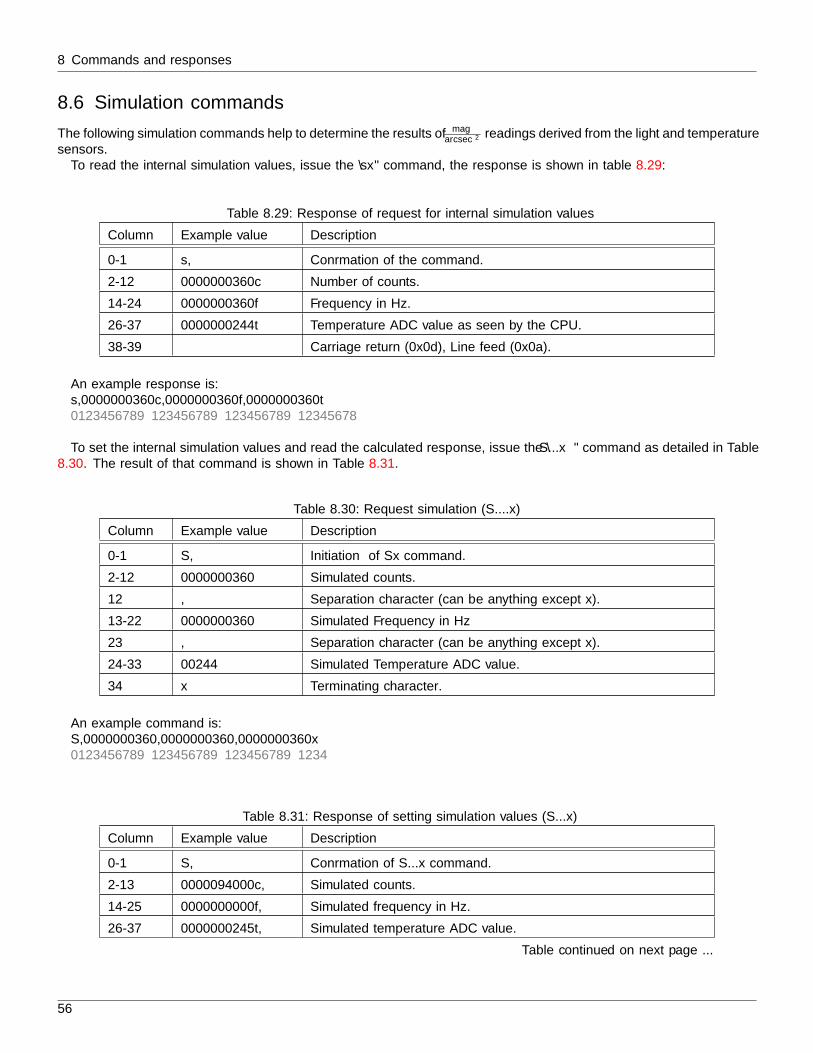
8 Commands and responses
8.6 Simulation commands
The following simulation commands help to determine the results of magarcsec2 readings derived from the light and temperature
sensors.To read the internal simulation values, issue the “sx” command, the response is shown in table 8.29:
Table 8.29: Response of request for internal simulation values
Column Example value Description
0-1 s, Confirmation of the command.
2-12 0000000360c Number of counts.
14-24 0000000360f Frequency in Hz.
26-37 0000000244t Temperature ADC value as seen by the CPU.
38-39 Carriage return (0x0d), Line feed (0x0a).
An example response is:s,0000000360c,0000000360f,0000000360t
0123456789 123456789 123456789 12345678
To set the internal simulation values and read the calculated response, issue the “S...x” command as detailed in Table8.30. The result of that command is shown in Table 8.31.
Table 8.30: Request simulation (S....x)
Column Example value Description
0-1 S, Initiation of Sx command.
2-12 0000000360 Simulated counts.
12 , Separation character (can be anything except x).
13-22 0000000360 Simulated Frequency in Hz
23 , Separation character (can be anything except x).
24-33 00244 Simulated Temperature ADC value.
34 x Terminating character.
An example command is:S,0000000360,0000000360,0000000360x
0123456789 123456789 123456789 1234
Table 8.31: Response of setting simulation values (S...x)
Column Example value Description
0-1 S, Confirmation of S...x command.
2-13 0000094000c, Simulated counts.
14-25 0000000000f, Simulated frequency in Hz.
26-37 0000000245t, Simulated temperature ADC value.
Table continued on next page ...
56
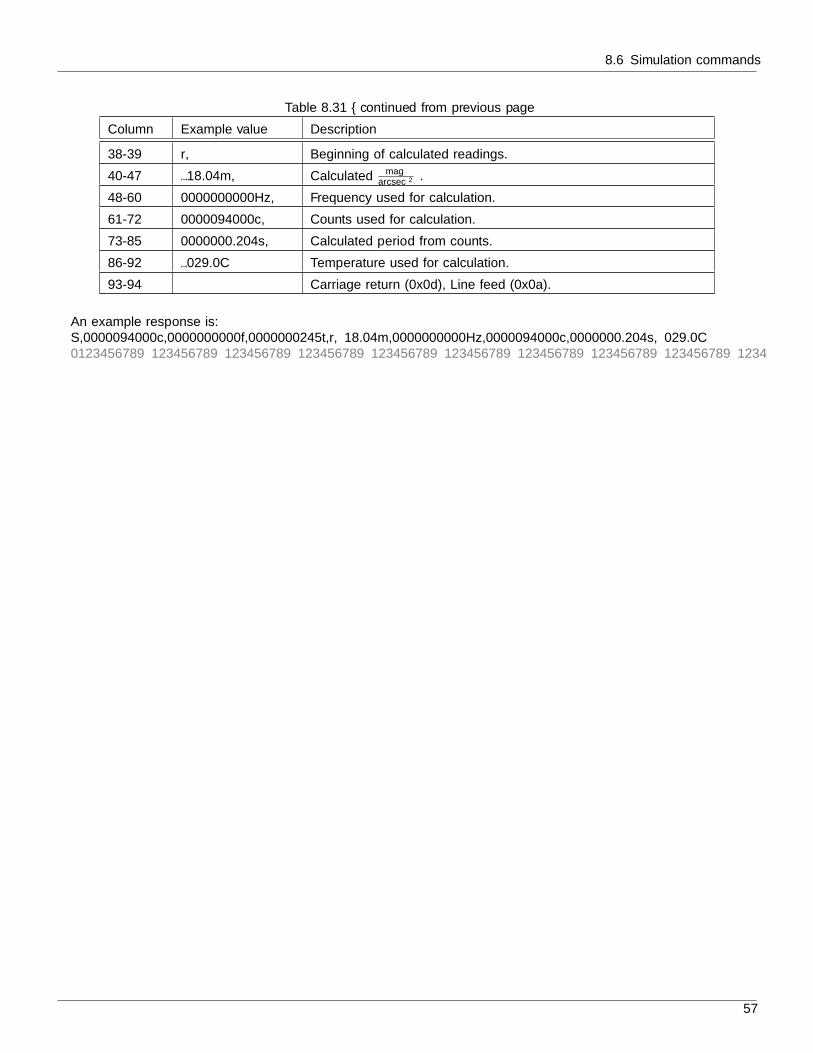
8.6 Simulation commands
Table 8.31 – continued from previous page
Column Example value Description
38-39 r, Beginning of calculated readings.
40-47 18.04m, Calculated magarcsec2 .
48-60 0000000000Hz, Frequency used for calculation.
61-72 0000094000c, Counts used for calculation.
73-85 0000000.204s, Calculated period from counts.
86-92 029.0C Temperature used for calculation.
93-94 Carriage return (0x0d), Line feed (0x0a).
An example response is:S,0000094000c,0000000000f,0000000245t,r, 18.04m,0000000000Hz,0000094000c,0000000.204s, 029.0C
0123456789 123456789 123456789 123456789 123456789 123456789 123456789 123456789 123456789 1234
57
9 Installation
9.1 Electrical connection
The SQM-LU-DL uses an internal voltage-regulator to bring the incoming USB 5VDC voltage from the PC down to3.3VDC. The 5V USB voltage is measured and logged during datalogging operation.
The battery adapter uses an in-line-mounted voltage-regulator to bring the 9VDC down to 5VDC.
9.2 Mechanical installation
Unihedron sells an enclosure that is suitable for mounting either the SQM-LE or SQM-LU into. You can read more aboutit, including plans to build your own at www.unihedron.com/projects/sqmhousing/ .
Figure 9.1: Housing
9.2.1 Cover selection
If the unit is to be mounted in exposed location, we recommend the Unihedron plastic weatherproof housing with glasswindow plate, or an acrylic dome. Acrylic domes will last 2-3 years but eventually weather on the surface. It is not clearthat this will affect the reading much. The best test would be to swap a weathered and new one back and forth whenchanging one out. Presumably the main consideration would be to keep the domes clean every so often and to make surethat the mounting plane is painted black to that it doesn’t reflect light back to the inside of the dome and then back intothe meter.
Source of scrylic domes: www.globalplastics.ca/domes.htm
9.2.2 Cover calibration
Since the meter is not weather-proof, it must be protected in some way from the elements. The Unihedron meter housingor a plastic dome is recommended. This will reduce the incoming light (approximately 15-20%).
Because a covering will reduce the incoming light, the resultant reading will be darker (higher magarcsec2 value). The offset
determined by a simple light experiment should be subtracted from the reading.Apply this subtraction offset as a negative value, i.e. if you measured 16.60 outside the covering, then 16.75 under the
dome, then an offset of -0.15 should be applied to all readings.
58

9.2 Mechanical installation
An example using the UDM software; if your offset is -0.12 and your factory calibrated light calibration offset is 19.92then you should change the light-calibration-offset on the calibration-tab to 19.80. European users will see and use acomma instead of a decimal point.
Figure 9.2: Example cover calibration
9.2.3 Cover maintenance
Keep the covering clean of dust, water, ice, and bird droppings.
59

10 Default settings
The SQM-LU-DL contains an FTDI USB interface module.The FTDI interface has not been altered from its default. There should be no reason to alter the FTDI chip settings.
The baud rate is defined by the VCP driver side when a terminal program connects to the SQM-LU-DL.
60
11 Firmware upgrade
See the UDM “Firmware tab” section on page 34 for instructions on updating the firmware in the SQM-LU-DL.
11.1 Details
The SQM-LU-DL contains a micro-controller that is equipped with a boot-loader mechanism which is enabled within afew seconds after reboot/reset.
Intel hex strings sent to the unit are used to overwrite program memory. The following link contains a thoroughdescription of the Intel Hex format: http://en.wikipedia.org/wiki/.hex
The basic requirements for firmware uploading are:
1. Reset micro-controller by sending the hex character 0x19
2. Within a few seconds, send the first Intel hex record. The colon “:” character indicates the beginning of an IntelHex record.
3. Wait for a response of “Ok” followed by “CR LF” which indicates that the record was processed properly.
4. Continue sending records and waiting for the acknowledgement.
5. The unit will reset on its own when no more records have been sent for a few seconds.
61

12 Calibration
The SQM-LU-DL is factory calibrated and a sheet of the calibration values was provided with the unit. Contact Unihedronwith your unit’s USB S/N if you need a copy of the original calibration sheet.
Some possible reasons for recalibration are:
1. A new covering/housing is being used besides the small case that the unit was shipped with.
2. A regular maintenance program is desired. There is no great need for this as the SQM-LU-DL has no analogcomponents.
3. Compensation for aged housing, if a plastic dome is used that might have degraded over time.
4. Replaced lens or changed field of view for experimental reasons.
12.1 Recalibration
There is no easy way to perform in-field recalibration. It is recommended to send the unit back to Unihedron for propercalibration. There is a nominal fee for recalibration and shipping. Please contact Unihedron for details.
12.2 Light calibration
The sensor must have a reference point for an amount of light against the signal produced. It is not recommended thatthis be done after factory calibration and relied upon since an improper setup will result in non-standard results.
A fluorescent light or green LED is used to simulate the spectrum that the meter would see during the night sky. Alight meter is used to adjust the light reading to 13.5 fc at the place of the SQM-LU-DL. The light calibration routineinside the SQM-LU-DL expects to see this value.
The light that the SQM-LU-DL and light meter see must be coming from an evenly lit surface.The “light calibration” command can be sent to the unlocked SQM-LU-DL to set the calibration value.
12.3 Dark calibration
The optical sensor in the SQM-LU-DL produces a reading even when totally dark. This “dark level” reading must bedetermined so that the meter can compensate for it.
The method of dark calibration is simply to prevent any light from entering the meter then execute a “dark calibration”command to the unit. A darkroom bag is one way to prevent light from entering the unit.
The optical sensor provides timed pulses depending on the amount of light entering. In a dark environment the pulseswill be long. The meter has a timeout of 300 seconds, so the dark calibration will take at least 5 minutes (300 seconds)to perform.
Place the unit in a dark environment and monitor the timed readings (rx reading request) until they are consistent,normally the value is in the 80-300 second range, then execute the “dark calibration” command.
12.4 Confirmation
Once the calibration has been done, you should be able to get a light reading from the unit at the calibration light levelof the same value as the value printed on your calibration sheet in the “Calibration offset” field, Normally this field hasa value of 8.71 mags/arcsec2.
62
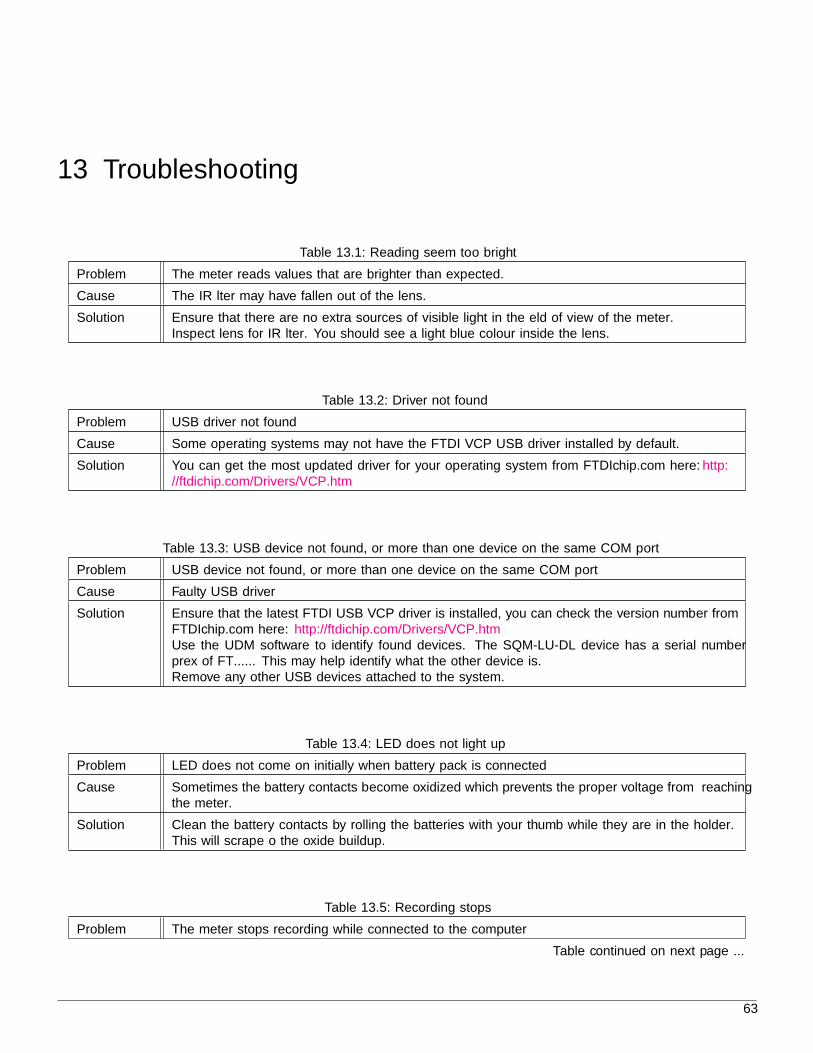
13 Troubleshooting
Table 13.1: Reading seem too bright
Problem The meter reads values that are brighter than expected.
Cause The IR filter may have fallen out of the lens.
Solution Ensure that there are no extra sources of visible light in the field of view of the meter.Inspect lens for IR filter. You should see a light blue colour inside the lens.
Table 13.2: Driver not found
Problem USB driver not found
Cause Some operating systems may not have the FTDI VCP USB driver installed by default.
Solution You can get the most updated driver for your operating system from FTDIchip.com here: http:
//ftdichip.com/Drivers/VCP.htm
Table 13.3: USB device not found, or more than one device on the same COM port
Problem USB device not found, or more than one device on the same COM port
Cause Faulty USB driver
Solution Ensure that the latest FTDI USB VCP driver is installed, you can check the version number fromFTDIchip.com here: http://ftdichip.com/Drivers/VCP.htmUse the UDM software to identify found devices. The SQM-LU-DL device has a serial numberprefix of FT...... This may help identify what the other device is.Remove any other USB devices attached to the system.
Table 13.4: LED does not light up
Problem LED does not come on initially when battery pack is connected
Cause Sometimes the battery contacts become oxidized which prevents the proper voltage from reachingthe meter.
Solution Clean the battery contacts by rolling the batteries with your thumb while they are in the holder.This will scrape off the oxide buildup.
Table 13.5: Recording stops
Problem The meter stops recording while connected to the computer
Table continued on next page ...
63
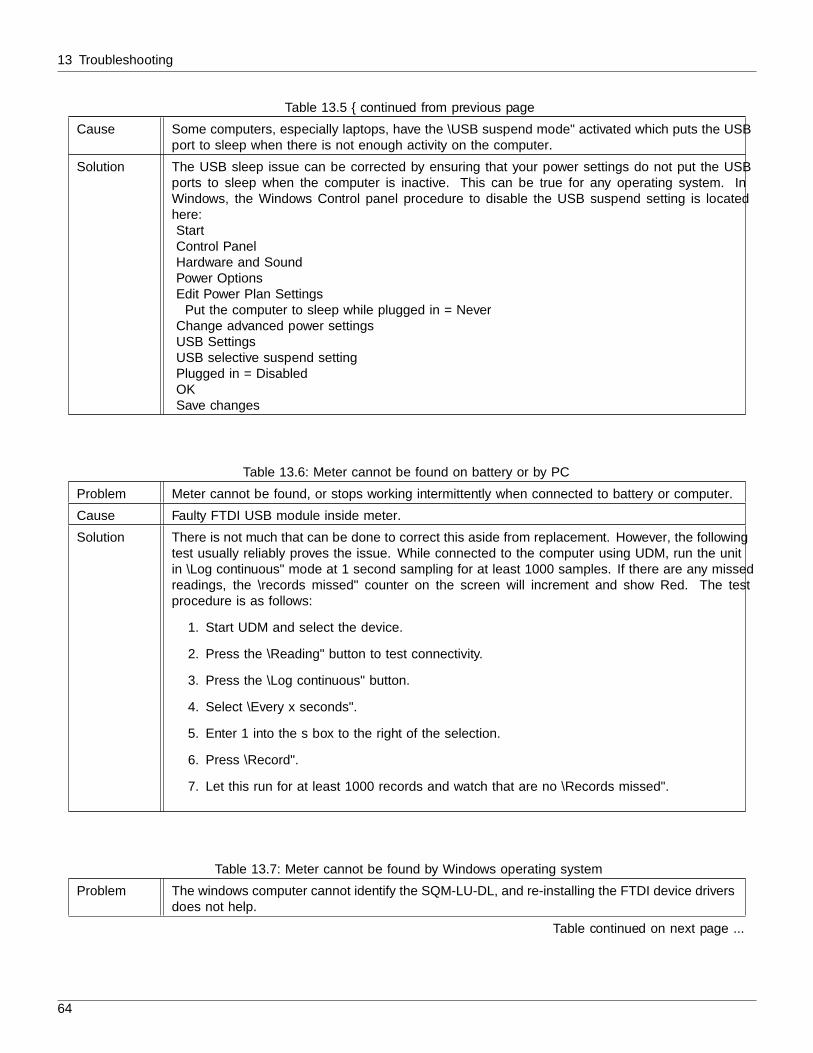
13 Troubleshooting
Table 13.5 – continued from previous page
Cause Some computers, especially laptops, have the “USB suspend mode” activated which puts the USBport to sleep when there is not enough activity on the computer.
Solution The USB sleep issue can be corrected by ensuring that your power settings do not put the USBports to sleep when the computer is inactive. This can be true for any operating system. InWindows, the Windows Control panel procedure to disable the USB suspend setting is locatedhere:StartControl PanelHardware and SoundPower OptionsEdit Power Plan Settings
Put the computer to sleep while plugged in = NeverChange advanced power settingsUSB SettingsUSB selective suspend settingPlugged in = DisabledOKSave changes
Table 13.6: Meter cannot be found on battery or by PC
Problem Meter cannot be found, or stops working intermittently when connected to battery or computer.
Cause Faulty FTDI USB module inside meter.
Solution There is not much that can be done to correct this aside from replacement. However, the followingtest usually reliably proves the issue. While connected to the computer using UDM, run the unitin “Log continuous” mode at 1 second sampling for at least 1000 samples. If there are any missedreadings, the “records missed” counter on the screen will increment and show Red. The testprocedure is as follows:
1. Start UDM and select the device.
2. Press the “Reading” button to test connectivity.
3. Press the “Log continuous” button.
4. Select “Every x seconds”.
5. Enter 1 into the s box to the right of the selection.
6. Press “Record”.
7. Let this run for at least 1000 records and watch that are no “Records missed”.
Table 13.7: Meter cannot be found by Windows operating system
Problem The windows computer cannot identify the SQM-LU-DL, and re-installing the FTDI device driversdoes not help.
Table continued on next page ...
64
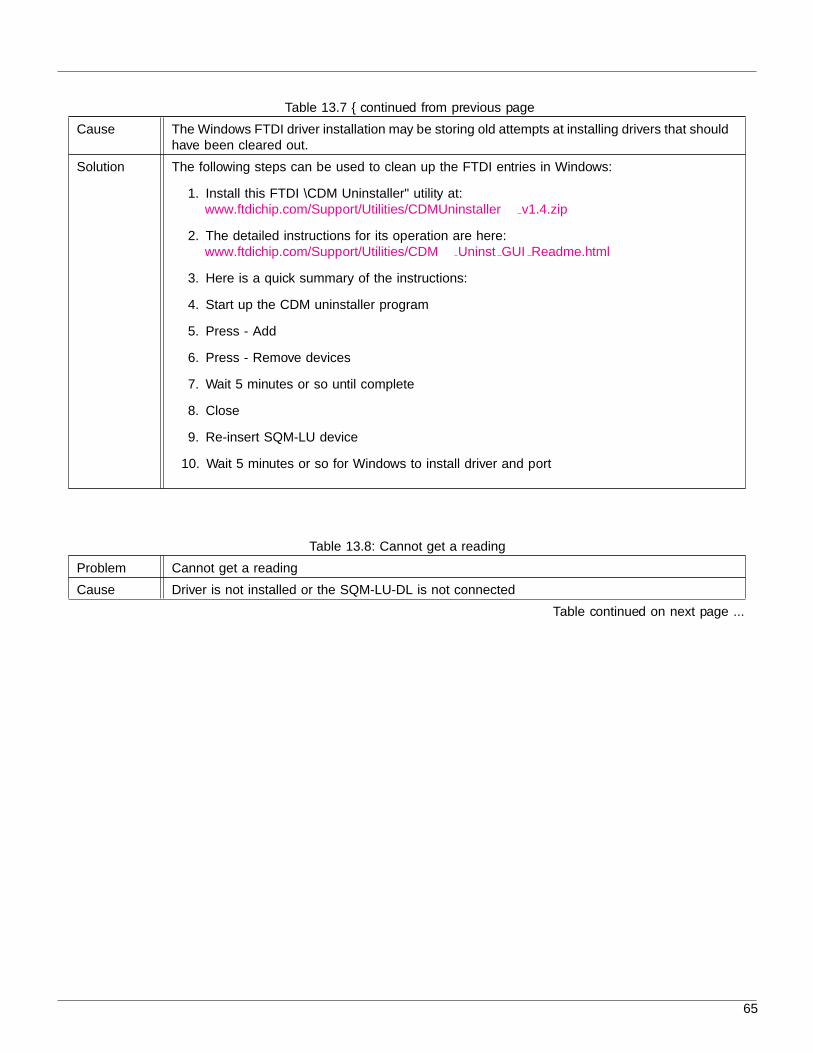
Table 13.7 – continued from previous page
Cause The Windows FTDI driver installation may be storing old attempts at installing drivers that shouldhave been cleared out.
Solution The following steps can be used to clean up the FTDI entries in Windows:
1. Install this FTDI “CDM Uninstaller” utility at:www.ftdichip.com/Support/Utilities/CDMUninstaller v1.4.zip
2. The detailed instructions for its operation are here:www.ftdichip.com/Support/Utilities/CDM Uninst GUI Readme.html
3. Here is a quick summary of the instructions:
4. Start up the CDM uninstaller program
5. Press - Add
6. Press - Remove devices
7. Wait 5 minutes or so until complete
8. Close
9. Re-insert SQM-LU device
10. Wait 5 minutes or so for Windows to install driver and port
Table 13.8: Cannot get a reading
Problem Cannot get a reading
Cause Driver is not installed or the SQM-LU-DL is not connected
Table continued on next page ...
65

13 Troubleshooting
Table 13.8 – continued from previous page
Solution For Windows, check that the unit is registered using the registry editor from the Start menu, selectRun, then type in regedit and press OK.For Windows XP and Windows 2000, look here for your device
HKEY LOCAL MACHINE\SYSTEM\
Enum\FTDIBUS\
VID 0403+PID 6001+Serial Number\0000\
PortName
For Windows 98 and Windows ME, look here for your deviceHKEY LOCAL MACHINE\
SYSTEM\Enum\
FTDIBUS\VID 0403+PID 6001+Serial Number\
0000\PortName
The Serial Number is printed on the bottom of the unit.The above will identify which COM port the SQM-LU-DL has been assigned.If the SQM-LU-DL is plugged in, the active COM port will show up in this list:
HK LOCAL MACHINE\HARDWARE\
DEVICEMAP\SERIALCOMM
For Linux and Mac, use lshal to determine which device the FTDI driver has attached the SQM-LU-DL to. The CD contains a Perl script findftdi.pl to filter out the lshal output.
66
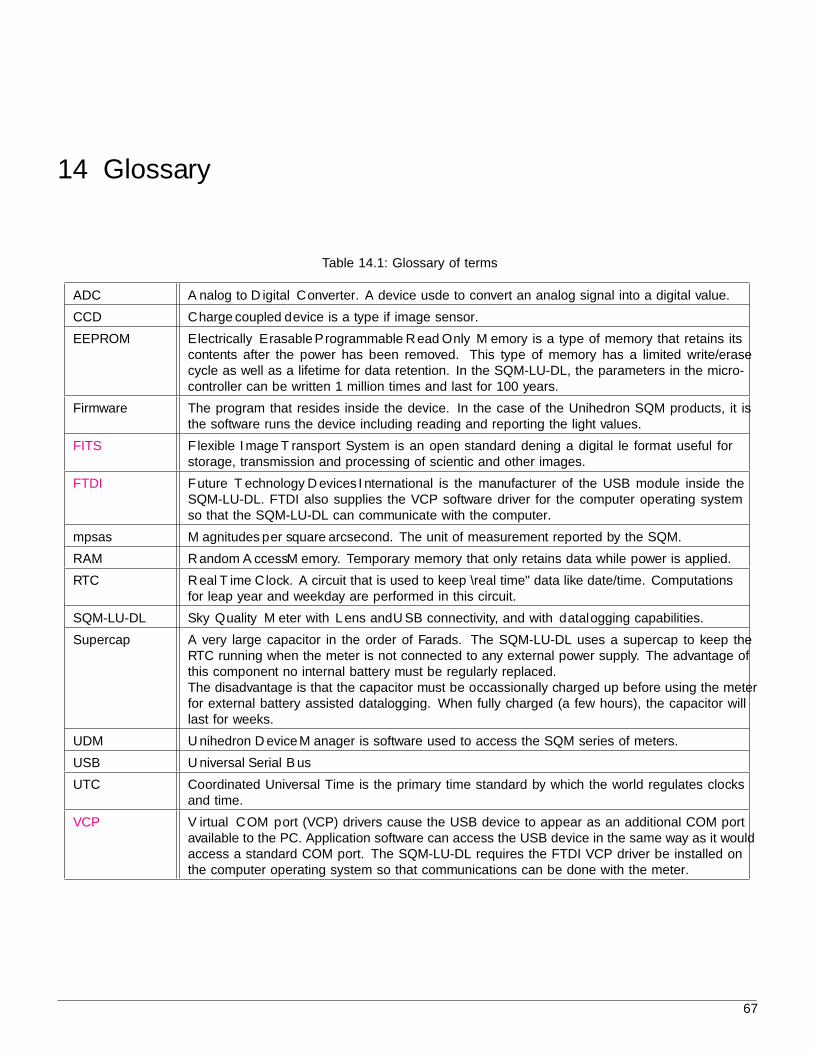
14 Glossary
Table 14.1: Glossary of terms
ADC Analog to Digital Converter. A device usde to convert an analog signal into a digital value.
CCD Charge coupled device is a type if image sensor.
EEPROM Electrically Erasable Programmable Read Only Memory is a type of memory that retains itscontents after the power has been removed. This type of memory has a limited write/erasecycle as well as a lifetime for data retention. In the SQM-LU-DL, the parameters in the micro-controller can be written 1 million times and last for 100 years.
Firmware The program that resides inside the device. In the case of the Unihedron SQM products, it isthe software runs the device including reading and reporting the light values.
FITS Flexible Image Transport System is an open standard defining a digital file format useful forstorage, transmission and processing of scientific and other images.
FTDI Future Technology Devices International is the manufacturer of the USB module inside theSQM-LU-DL. FTDI also supplies the VCP software driver for the computer operating systemso that the SQM-LU-DL can communicate with the computer.
mpsas Magnitudes per square arcsecond. The unit of measurement reported by the SQM.
RAM Random Access Memory. Temporary memory that only retains data while power is applied.
RTC Real Time Clock. A circuit that is used to keep “real time” data like date/time. Computationsfor leap year and weekday are performed in this circuit.
SQM-LU-DL Sky Quality Meter with Lens and USB connectivity, and with datalogging capabilities.
Supercap A very large capacitor in the order of Farads. The SQM-LU-DL uses a supercap to keep theRTC running when the meter is not connected to any external power supply. The advantage ofthis component no internal battery must be regularly replaced.The disadvantage is that the capacitor must be occassionally charged up before using the meterfor external battery assisted datalogging. When fully charged (a few hours), the capacitor willlast for weeks.
UDM Unihedron Device Manager is software used to access the SQM series of meters.
USB Universal Serial Bus
UTC Coordinated Universal Time is the primary time standard by which the world regulates clocksand time.
VCP Virtual COM port (VCP) drivers cause the USB device to appear as an additional COM portavailable to the PC. Application software can access the USB device in the same way as it wouldaccess a standard COM port. The SQM-LU-DL requires the FTDI VCP driver be installed onthe computer operating system so that communications can be done with the meter.
67

Bibliography
[1] Christopher Kyba, etc., Worldwide variations in artificial skyglow. PNAS, Volume 1, Issue 6, 2014.
[2] Wikipedia, Apparent Magnitudes of Known Celestial Objects. wikipedia.org/wiki/Apparent magnitude, Table of no-table celestial objects, 2014.
[3] Schaefer, B.E. Feb. 1990. Telescopic Limiting Magnitude. PASP 102:212-229 http://adsbit.harvard.edu/cgi-bin/
nph-iarticle_query?bibcode=1990PASP..102..212S
[4] Olof Carlin, Nils. About Bradley E. Schaefer, Telescopic limiting Magnitudes, Web page discussion of brightnessin Schaefer (1990) and Clark (1994). http://w1.411.telia.com/~u41105032/visual/Schaefer.htm(accessed7/
2003)
[5] NELM Converter, K. Fisher [email protected] Rev. 8/2006 http://unihedron.com/projects/darksky/
NELM2BCalc.html
68