sqlio - measuring storage performance
TRANSCRIPT

Measuring Storage PerformanceCourse practicePresented by Valerian Ceaus

1. Using SQLIO to Stress Test an I/O Subsystem
Use SQLIO.exe to determine the Input/Output capacity of a disk subsystem(tool provided by Microsoft).
The purpose of SQLIO is not to simulate I/O patterns of SQL Server but rather to test a variety of I/O types and sizes and determine the capacity of an I/O subsystem.
When testing the I/O system you should consider the following:
• Test a variety of I/O types and sizes
• Make sure the total size of the test files used in each test is significantly larger than the amount of cache on the SAN (Short Stroke Efect).
• Short test runs (5-10 minutes) are okay for initial testing, however if potential problem areas are discovered longer tests should be run.
• Allow some time in between each I/O type you test to allow the I/O system to return to an idle state (1 min. acceptabile).

2. Commonly used SQLIO.exe options
Option Description
-o Specify the number of outstanding I/O requests. Increasing the queue depth may result in a higher total throughput. However, increasing this number too high may result in problems. Common values for this are 8, 32, and 64. In RAID, SAN or Storage Spaces setups, a single disk can be made up of
multiple physical disks. You can start with twice the number of physical disks used by the volume where the file sits. Using a higher number will increase your latency, but can get you more IOPs and throughput.
-LS Capture disk latency information. Capturing latency data is recommended when testing a system.
-k Specify either R or W (read or write).
-s Duration of test (seconds). You can use 10 seconds for a quick test. For any serious work, use at least 60 seconds.
-b Size of the IO request in bytes. 8KB is the typical IO for OLTP workloads. 512KB is common for Reporting, Data Warehousing.
-f Type of IO to issue. Either ‘random’ or ‘sequential’. Random is common for OLTP workloads. Sequential is common for Reporting, Data Warehousing..
-F Name of the file which will contain the test files to run SQLIO against.
-t Threads. For large IOs, just a couple is enough. Sometimes just one. For small IOs, you could need as many as the number of CPU cores.

3. Interpreting the results of SQLIO
When running the test you can redirect the output of SQLIO to a text file to capture the performance information.
If more detailed information is needed Windows Performance Monitor and/or SAN specific monitoring tools can be used.

4. Monitoring I/O Performance – using Windows Resource Monitor
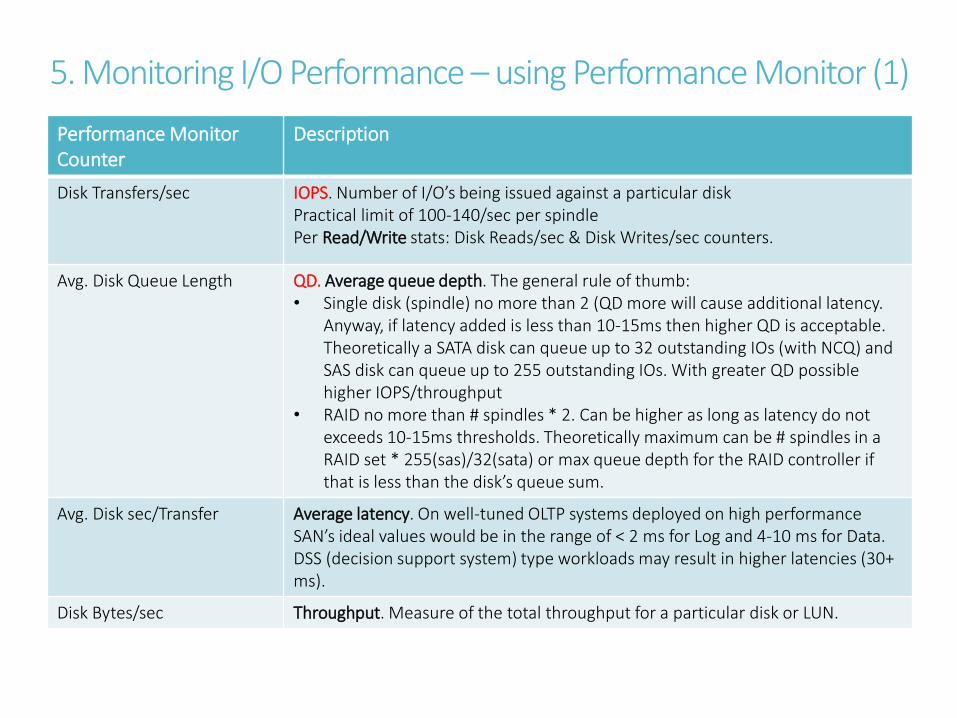
5. Monitoring I/O Performance – using Performance Monitor (1)
Performance Monitor Counter
Description
Disk Transfers/sec IOPS. Number of I/O’s being issued against a particular diskPractical limit of 100-140/sec per spindlePer Read/Write stats: Disk Reads/sec & Disk Writes/sec counters.
Avg. Disk Queue Length QD. Average queue depth. The general rule of thumb:• Single disk (spindle) no more than 2 (QD more will cause additional latency.
Anyway, if latency added is less than 10-15ms then higher QD is acceptable. Theoretically a SATA disk can queue up to 32 outstanding IOs (with NCQ) and SAS disk can queue up to 255 outstanding IOs. With greater QD possible higher IOPS/throughput
• RAID no more than # spindles * 2. Can be higher as long as latency do not exceeds 10-15ms thresholds. Theoretically maximum can be # spindles in a RAID set * 255(sas)/32(sata) or max queue depth for the RAID controller if that is less than the disk’s queue sum.
Avg. Disk sec/Transfer Average latency. On well-tuned OLTP systems deployed on high performance SAN’s ideal values would be in the range of < 2 ms for Log and 4-10 ms for Data. DSS (decision support system) type workloads may result in higher latencies (30+ ms).
Disk Bytes/sec Throughput. Measure of the total throughput for a particular disk or LUN.

6. Monitoring I/O Performance – using Performance Monitor (2)

7. Using SQLIO.exe utility (preparing)
Download the Tool
• You can get it from http://www.microsoft.com/en-us/download/details.aspx?id=20163
Prepare a test file
• Ideally, you should create a file as big as possible, so that you can exercise the entire disk. Creating a small file causes the head movement to be restricted to a portion of the disk – as a result SQLIO will show an unrealistically high random IO performance (short stroke effect).
• To create a large file for your test, the easiest way is using the FSUTIL.EXE tool, which is included with all versions of Windows (starting Windows Vista). Use FSUTIL.exe from PS:
FSUTIL.EXE file createnew X:\testfile.dat (1TB)FSUTIL.EXE file setvaliddata X:\testfile.dat (1TB)
• Alternatives: (1) Dummy File Creator (2) Disk Tools
http://www.7tutorials.com/3-ways-create-random-dummy-files-windows-given-size

8. Using SQLIO.exe utility (run the tool)
Run the Tool
• Make sure that nothing else is competing with your testing.
• WARNING: You could be generating a whole lot of disk IO, network traffic and/or CPU load when you run SQLIO. If you’re in a shared environment, you might want to talk to your administrator and ask permission.
• Read(100%), Random(100%), Request Size(8KB), # of Outstanding(16)
SQLIO.EXE -s15 -kR -frandom -b8 -t8 -o16 -LS -BN X:\TestFile.DAT
• Write(100%), Sequential(100%), Request Size(512KB), # of Outstanding(32)
SQLIO.EXE -s15 -kW -fsequential –b512 -t8 -o32 -LS -BN X:\TestFile.DAT
• Recommendations:
- OLTP workloads 8KB random IOs, 8 threads, 16 outstanding (-frandom -b8 -t8 -o16)
- OLAP workloads 512KB sequential IOs, 2 threads, 16 outstanding (-fsequential -b512 -t2 -o16)
- Virtual Machines workloads: 8KB, Random (80%), Read (80%), 32 outstanding.(I/O blender)

9. Typical access patterns of various applications.

10. Other storage performance tools
IOMeter – The open-source, cross-platform tool. If you do a lot of SAN work, you might prefer a cross-platform tool that you can use across all of the clients that connect to the SAN. IOMeter works on Windows and Linux. Intel developed tool. (As compared to SQLIO support mixed R/W workload testing)
SQLIOStress.exe - differs from SQLIO in that it is designed to simulate the I/O patterns of SQL Server.
Crystal Disk Mark - The easy, free one-button solution.
HDTune Pro …
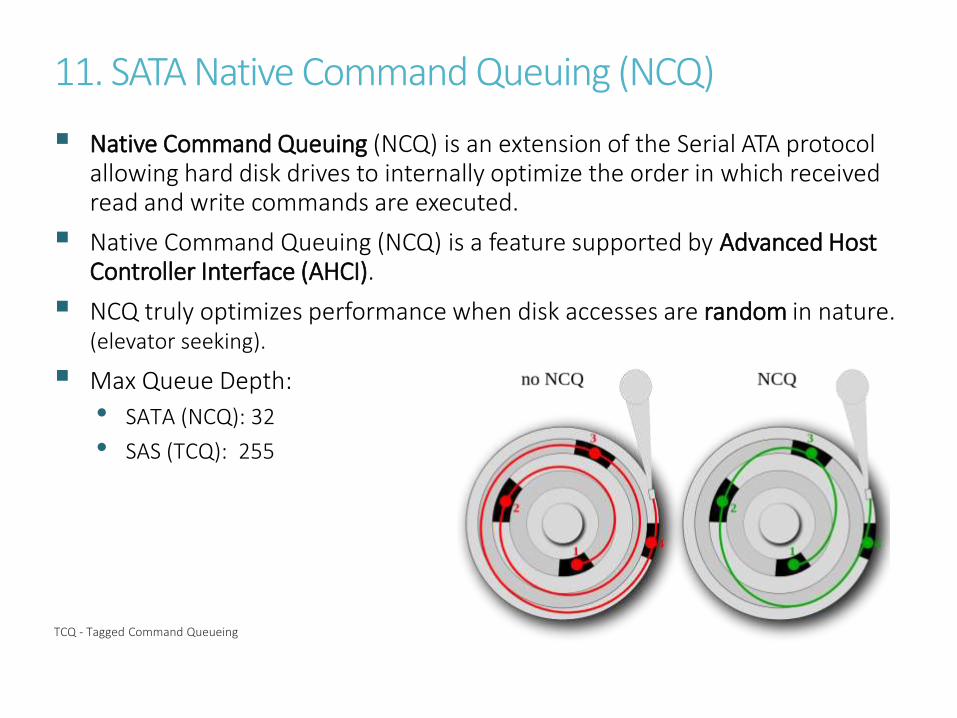
11. SATA Native Command Queuing (NCQ)
Native Command Queuing (NCQ) is an extension of the Serial ATA protocol allowing hard disk drives to internally optimize the order in which received read and write commands are executed.
Native Command Queuing (NCQ) is a feature supported by Advanced Host Controller Interface (AHCI).
NCQ truly optimizes performance when disk accesses are random in nature. (elevator seeking).
Max Queue Depth:
• SATA (NCQ): 32
• SAS (TCQ): 255
TCQ - Tagged Command Queueing
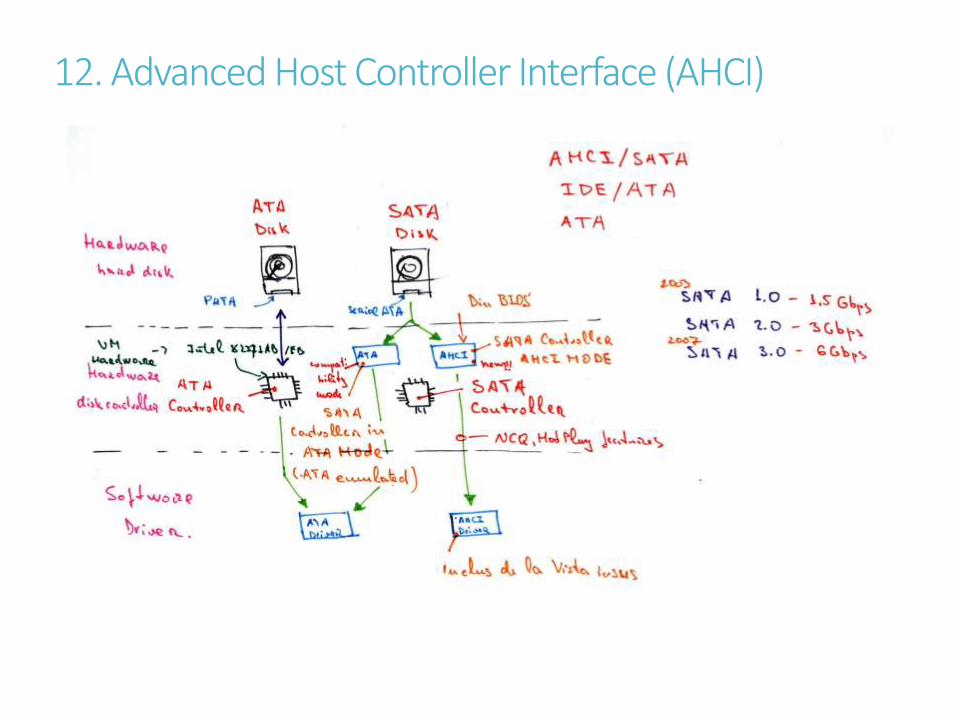
12. Advanced Host Controller Interface (AHCI)
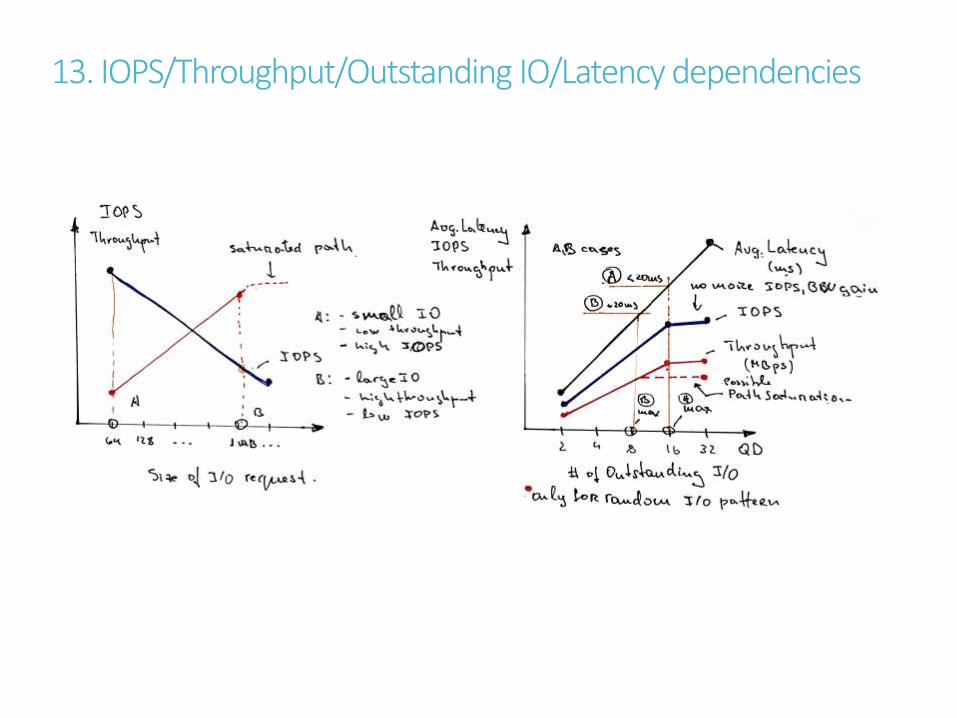
13. IOPS/Throughput/Outstanding IO/Latency dependencies
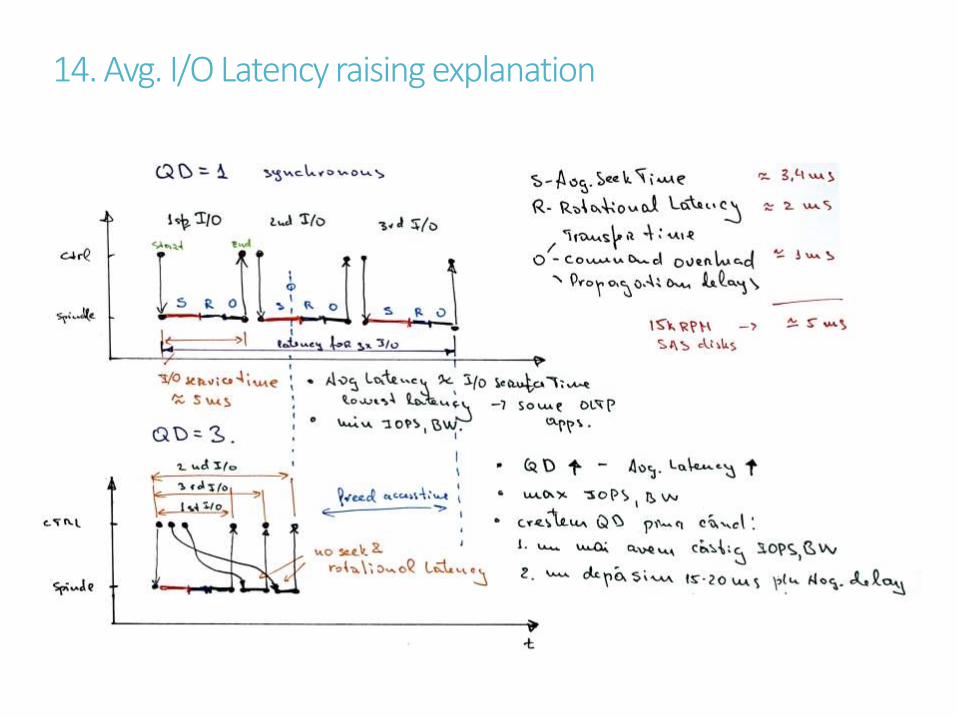
14. Avg. I/O Latency raising explanation
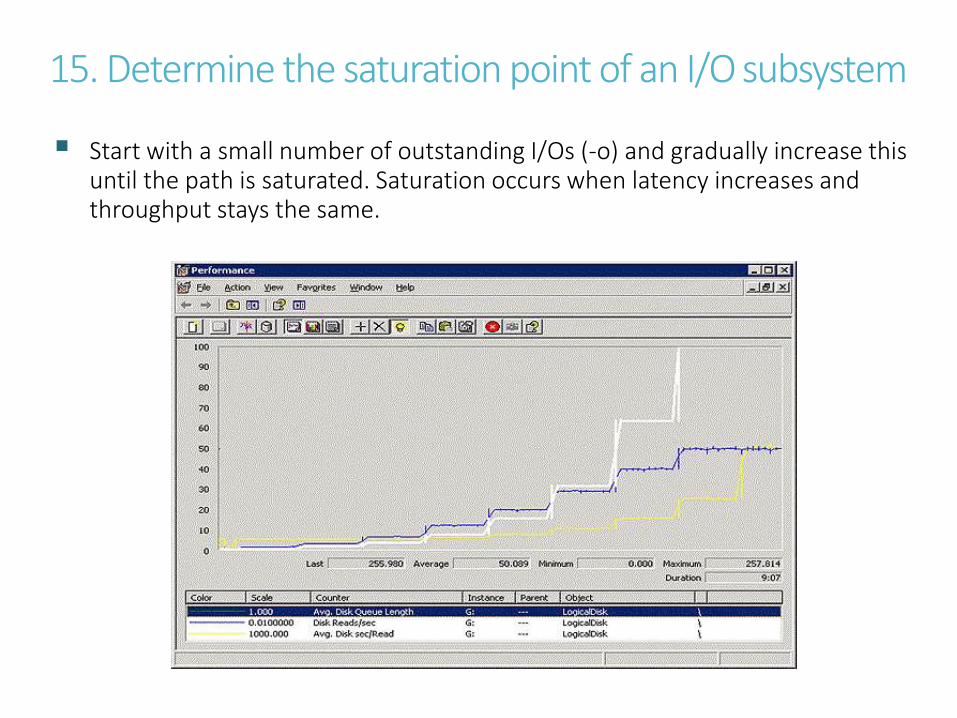
15. Determine the saturation point of an I/O subsystem
Start with a small number of outstanding I/Os (-o) and gradually increase this until the path is saturated. Saturation occurs when latency increases and throughput stays the same.

Additional Info
SQLIO, PowerShell and storage performance: measuring IOPs, throughput and latency for both local disks
http://blogs.technet.com/b/josebda/archive/2013/03/28/sqlio-powershell-and-storage-performance-measuring-iops-
throughput-and-latency-for-both-local-disks-and-smb-file-shares.aspx
Benchmarking SQL Server IO with SQLIO
http://www.mssqltips.com/sqlservertip/2127/benchmarking-sql-server-io-with-sqlio
SQLIO Tutorial: How to Test Disk Performance
http://www.brentozar.com/archive/2008/09/finding-your-san-bottlenecks-with-sqlio
3 Ways to Create Random Dummy Files in Windows, with a Given Size
http://www.7tutorials.com/3-ways-create-random-dummy-files-windows-given-size
habr - Развитие накопителей
http://habrahabr.ru/company/etegro/blog/217115
SAS vs SATA — выбор дисковой подсистемы
http://www.etegro.ru/articles/sas-sata
IO Queue Depth Strategy
http://sqlblog.com/blogs/joe_chang/archive/2010/10/18/io-queue-depth-strategy.aspx
WHITE PAPER FUJITSU PRIMERGY SERVER BASICS OF DISK I/O PERFORMANCE
http://globalsp.ts.fujitsu.com/dmsp/Publications/public/wp-basics-of-disk-io-performance-ww-en.pdf
SQL Server Best Practices Article
http://technet.microsoft.com/en-us/library/cc966412.aspx
Use Resource Monitor to monitor storage performance
http://www.techrepublic.com/blog/the-enterprise-cloud/use-resource-monitor-to-monitor-storage-performance/
wikipedia - Native Command Queuing
http://en.wikipedia.org/wiki/Native_Command_Queuing
Installing Windows XP With F6 AHCI/RAID Drivers From USB Only
http://www.prime-expert.com/articles/b02/installing-windows-xp-with-f6-ahci-raid-drivers-from-usb-only.php
SQL Server Best Practices Article
http://technet.microsoft.com/en-us/library/cc966412.aspx