sps barriers to india’s agriculture exportsps barriers to india’s agriculture export learning...
TRANSCRIPT

1
SPS Barriers to India’s Agriculture Export Learning from the EU Experiences in SPS and
Food Safety Standards
Authors
Arpita Mukherjee Tanu M. Goyal Smita Miglani Avantika Kapoor
Legal Advisors RV Anuradha Ronjini Ray


SPS Barriers to India’s Agriculture Export Learning from the EU Experiences in
SPS and Food Safety Standards
Authors Arpita Mukherjee
Tanu M. Goyal
Smita Miglani
Avantika Kapoor
Legal Advisors RV Anuradha
Ronjini Ray
MARCH 2019

SPS Barriers to India’s Agriculture Export Learning from the EU Experiences in
SPS and Food Safety Standards
ALL RIGHTS RESERVED
No part of this report shall be reproduced, stored in a retrieval system, or transmitted by any means, electronic,
mechanical, photocopying, recording, or otherwise, without the prior written permission of the copyright holders –
ICRIER.
COVER PHOTOGRAPH:
Source: The image has been taken from http://www.thedailystar.net/country/eco-friendly-bagging-method-
save-mangoes-pests-84862
DISCLAIMER:
Opinions and recommendations in the report are exclusively of the author(s) and not of any other individual or
institution including ICRIER. This report has been prepared in good faith on the basis of information available at the
date of publication. All interactions and transactions with industry sponsors and their representatives have been
transparent and conducted in an open, honest and independent manner as enshrined in ICRIER Memorandum of
Association. ICRIER does not accept any corporate funding that comes with a mandated research area which is not
in line with ICRIER’s research agenda. The corporate funding of an ICRIER activity does not, in any way, imply
ICRIER’s endorsement of the views of the sponsoring organization or its products or policies. ICRIER does not
conduct research that is focused on any specific product or service provided by the corporate sponsor.
© 2019 by the Indian Council for Research on International Economic Relations (ICRIER)
Indian Council for Research on International Economic Relations (ICRIER)
India Habitat Centre Core 6-A, 4th Floor, India Habitat Centre Lodhi Road, New Delhi- 110003. Tel: 91-11-48202100 www.icrier.org

AUTHORS
Arpita Mukherjee
Professor
Indian Council for Research on International Economic Relations (ICRIER), New Delhi
Author can be contacted at: [email protected]
Tanu M. Goyal
Consultant
ICRIER
Author can be contacted at: [email protected]
Smita Miglani
Research Associate
ICRIER
Author can be contacted at: [email protected]
Avantika Kapoor
Masters in Public Policy Candidate
Georgetown University, Washington, District of Columbia, USA; and Former Research Assistant,
ICRIER
Author can be contacted at: [email protected]
R.V. Anuradha
Partner
Clarus Law Associates, New Delhi
Author can be contacted at: [email protected]
Ronjini Roy
Graduate Institute, Geneva; and Former Associate, Clarus Law Associates, New Delhi
Author can be contacted at: [email protected]

Table of Contents
Acknowledgement ..................................................................................................................... i
List of Abbreviations .............................................................................................................. iii
Executive Summary ................................................................................................................ vi
Chapter 1: Introduction ...................................................................................................... 1
1.1 Methodology ............................................................................................. 2
1.2 Layout ....................................................................................................... 2
1.3 Various Ways to Address SPS Barriers .................................................... 3
1.4 WTO’s SPS Agreement: Can India Raise SPS Issues in Exports to the EU
under this Agreement? .............................................................................. 3
Chapter 2: Agriculture Trade between India and the EU: Trends, Regulatory
Scenario and Treatment in Trade Agreements ............................................. 7
2.1 Institutional Structure and Regulations for Ensuring Quality of Food
Products .................................................................................................... 9
2.2 Bilateral Trade in Agricultural Products ............................................... 14
2.3 Assessment of SPS Provisions in Trade Agreements: The Case of the EU
and India ................................................................................................ 20
2.4 The Way Forward ................................................................................... 27
Chapter 3: The Case of Fresh Mango and Mango Pulp Exports to the EU ................ 30
3.1 Overview of Fresh Mango and Mango Pulp Production in India .......... 30
3.2 Export of Fresh Mango and Mango Pulp from India ............................. 33
3.3 The Fresh Mango and Mango Pulp Supply Chains ................................ 35
3.4 The Survey and SPS Issues Faced .......................................................... 37
3.5 The Way Forward ................................................................................... 43
Chapter 4: The Case of Export of Indian Table Grapes to the EU .............................. 45
4.1 Overview of the Table Grape Industry in India ...................................... 46
4.2 Export Process and the Supply Chain .................................................... 49
4.3 The ‘ccc’ Issue – Why Indian Table Grapes were detained in EU Ports in
2010 ........................................................................................................ 54
4.6 The Recent ‘ccc’ Issue ............................................................................ 59
4.5 Other SPS Related Issues Faced by Grape Exporters ............................ 60
4.6 The Way Forward ................................................................................... 62
Chapter 5: Export of Basmati Rice from India: Opportunities and Constraints in the
EU Market ...................................................................................................... 66
5.1 Introduction ............................................................................................ 66
5.2 Production of Basmati Rice .................................................................... 68
5.3 International Trade and Key Markets for Basmati Rice ........................ 69
5.4 The Export Process ................................................................................. 72
5.5 SPS Issues Related to Exports of Basmati Rice ...................................... 74
5.6 The Way Forward ................................................................................... 79
Chapter 6: Case of the Dairy Sector in India: Scope for Export to the EU Market ... 83
6.1 Overview of the Dairy Sector.................................................................. 84
6.2 Trade in the Dairy Sector ....................................................................... 87
6.3 The Survey Findings ............................................................................... 92
6.4 Some Concerns ....................................................................................... 93
6.5 The Way Forward ................................................................................... 95
Chapter 7: The Case Study of Exports of Green Peas from India to the EU .............. 99
7.1 Overview of Green Peas Production ...................................................... 99
7.2 Export of Peas from India ..................................................................... 101
7.3 Fresh Peas Supply Chain ...................................................................... 103
7.4 SPS Issues in Green Peas ..................................................................... 105
7.5 The Way Forward ................................................................................. 105
Chapter 8: Export of Green Beans from India to the EU: Present Status and the Way
Forward ........................................................................................................ 106
8.1 Overview of Green Beans Production .................................................. 106
8.2 Export of Beans from India ................................................................... 108
8.3 Supply Chain for Fresh Beans in India, Exports to the EU and Some
Concerns ............................................................................................... 109
8.4 The Way Forward ................................................................................. 110
Chapter 9: Case Study of Indian Eggplant: A Vegetable that Faced a Ban in the
EU .................................................................................................................. 111
9.1 Production of Eggplant ......................................................................... 111
9.2 Export of Eggplant from India .............................................................. 113
9.3 The Eggplant Supply Chain .................................................................. 114
9.4 Ban on Export of Eggplant from India ................................................. 117
9.5 The Way Forward ................................................................................. 122

Chapter 10: The Case Study of Indian Peanut Exports to the EU ............................... 125
10.1 Production of Peanuts in India ............................................................. 125
10.2 Exports of Peanuts from India and the Export Value Chain ................ 127
10.3 Export Promotion and Regulatory Structure in the Peanut Sector in India
.............................................................................................................. 129
10.4 Procedure for Peanut Exports from India to the EU and the Export Supply
Chain ..................................................................................................... 130
10.5 Issues with Exports to the EU ............................................................... 132
10.6 The Way Forward ................................................................................. 137
Chapter 11: The Case of Mushroom Exports to the EU ................................................ 140
11.1 Introduction .......................................................................................... 140
11.2 Global Production of Mushrooms ........................................................ 140
11.3 Production of Mushrooms in India ....................................................... 141
11.4 Export of Mushrooms from India.......................................................... 142
11.5 India’s Exports to the EU ..................................................................... 143
11.6 Issues and the Way Forward ................................................................ 144
Chapter 12: Conclusion and the Way Forward ............................................................. 146
12.1 SPS Barriers in the EU: Where They Arise and Their Impact ............. 146
12.2 Addressing the SPS Barriers................................................................. 148
References ............................................................................................................................. 156

List of Tables
Table 2.1: India’s Trade with the EU in Selected Agricultural Commodities in 2015-16 (in
INR Million) .................................................................................................... 16
Table 2.2: India’s Top Ten Items of Agricultural Export to the EU in 2015-16 (in INR
Million) ............................................................................................................ 16
Table 2.3: India’s Top Ten Items of Agricultural Import from the EU in 2015-16 (in INR
Million) ............................................................................................................ 17
Table 2.4: Export of Selected Commodities to the EU and the World in 2015-16 (in INR
million) ............................................................................................................. 18
Table 2.5: Assessment of EU’s FTAs: The SPS Chapter ................................................. 22
Table 3.1: Some Important Mango Varieties and States Where They are Cultivated ...... 31
Table 3.2: Top Importers of Fresh Mango from India ...................................................... 34
Table 3.3: Top Importers of Mango Pulp from India........................................................ 34
Table 3.4: Number of Interceptions in the Case of Mangoes from the EU ...................... 38
Table 4.1: Top 10 Global Countries and the EU Member States Importing India’s Table
Grapes in 2015-2016 ........................................................................................ 47
Table 4.2: Export of Table Grapes from India to EU Member States in 2015-16 ............ 48
Table 4.3: Template of Laboratory Report Sent to the Exporter by APEDA approved Labs
.......................................................................................................................... 52
Table 5.1: Rice Varieties Notified as Basmati Rice under the Seed Act, 1966 ................ 67
Table 5.2: State-wise Area and Production of Basmati Rice in 2012-2013 and 2014-2015
.......................................................................................................................... 69
Table 5.3: Top 5 Destinations for India's Export of Basmati Rice ................................... 70
Table 5.4: India’s Export of Basmati Rice to the EU ....................................................... 71
Table 5.5: Some Examples of Border Rejection for Basmati Rice ................................... 76
Table 6.1: Key Trends in the Dairy Farming Sector ......................................................... 86
Table 7.1: Producers of Green Peas: EU, Selected EU Member States and Other Countries
(in MT) ........................................................................................................... 100
Table 7.2: Productivity, Yield and Area Harvested of Green Peas in India ................... 100
Table 8.1: Producers of Green Beans: EU, Selected EU Member states and Other Countries
(in MT) ........................................................................................................... 107
Table 8.2: Productivity, Yield and Area Harvested of Green Beans in India ................. 107

Table 9.1: Producers of Eggplant: EU, Selected EU Member states and Other Countries
(in MT) ........................................................................................................... 112
Table 9.2: Area, Production and Productivity of Eggplant in India................................ 112
Table 9.3: Top Importing Nations of Eggplant from India ............................................. 114
Table 10.1: Top Global Exporters of Peanuts (Quantity in ’000 MT) .............................. 127
Table 10.2: India's Export of Peanuts to the EU ............................................................... 128
Table 10.3: Top Exporters of Peanut to the EU in Comparison with Exports from India 128
Table 10.4: Top Indian Peanut Importing Countries in the EU (quantity in MT; values in
million EUR) .................................................................................................. 129
Table 10.5: Aflatoxin Tolerance Limit in the EU (by category) ....................................... 133
Table 11.1: Top Producers of Mushrooms and Truffles in the World, 2013-14 .............. 141
Table 11.2: All India Production of Mushroom ................................................................ 142
Table 11.3: India's Exports of Mushrooms to EU Countries (Values in INR million) ..... 144
Table 11.4: EU's Share in India’s Export of Mushrooms (in percentage) ........................ 144
Table 12.1: STCs Raised by India against the EU (either individually or with other WTO
members) between 1995 and 2016 ................................................................ 152
List of Figures
Figure 2.1: India’s Trade in Agricultural Commodities with the EU during 2003-04 and
2015-16 (in INR Million)................................................................................. 15
Figure 3.1: Mango Production in India (in 1000 metric tons (MT) ................................... 32
Figure 3.2: Share of Various States in Mango Production (2014-15) ................................ 32
Figure 3.3: Supply Chain of Fresh Mangoes for Export to the EU .................................... 36
Figure 3.4: Supply Chain of Mango Pulp for Export to the EU ......................................... 37
Figure 3.5: Interceptions Raised by the EU for India and Pakistan ................................... 39
Figure 4.1: Average Production of Grapes in 2004-14 for Selected Countries (in MT) .... 46
Figure 4.2: An Indicative Supply Chain of Grapes Exported to the EU Market ................ 50
Figure 5.1: Supply Chain of Basmati Rice ......................................................................... 74
Figure 6.1: Milk Production and Per Capita Availability in India (1950-2015) ................ 84
Figure 6.2: State-wise Milk Production (percentage share) ............................................... 85
Figure 7.1: Share of Different States in Production of Pea, 2014-2015 (in percentage) .. 101

Figure 7.2: Export of Various Varieties of Peas to the World and to the EU (in MT) .... 102
Figure 7.3: Value Chain in Green Peas for Export to the EU .......................................... 104
Figure 8.1: Share of Different States in Production of Beans, 2014-2015 (in percentage)
........................................................................................................................ 108
Figure 8.2: Export of Various Varieties of Green Beans to the World and to the EU (in MT)
........................................................................................................................ 109
Figure 9.1: Share of Different States in the Production of Eggplant, 2014-2015 (in
percentage) ..................................................................................................... 113
Figure 9.2: Value Chains in Fresh Eggplant for Export to the EU................................... 116
Figure 9.3: Number of Interceptions for Eggplant on the EUROPHYT Portal ............... 117
Figure 9.4: Types of Pests and the Number of Interceptions for Each Type ................... 119
Figure 10.1: Peanut Production by Country in 2015-16 (in percentage) ........................... 126
Figure 10.2: Export Supply Chain for Peanuts ................................................................... 132
Figure 10.3: Notifications for Peanuts and Peanuts Products on RASFF Portal, Classified by
Year ................................................................................................................ 134
Figure 11.1: Export Value Chain for Mushrooms .............................................................. 143
List of Boxes
Box 2.1: Features of the EUROPHYT Network ............................................................10
Box 5.1: How an Exporter is Ensuring Compliance with EU Standards .......................80
Box 6.1: Requirements for Introduction of Milk and Milk Products for Human
Consumption into the EU.................................................................................89
Box 9.1: Impact of EFSB and Thrips on Eggplants .....................................................119
Appendices
Appendix A2.1: List of Agricultural Commodities and their HS Code ...............................29
Appendix A4.1: Some Examples of the Chemicals and Changes in their Limits for Table
Grapes ........................................................................................................64
Appendix A5.1: Some Examples of Chemicals and the Change in their Limits for Basmati
Rice ............................................................................................................81

i
Acknowledgement
We express our gratitude to Rajat Kathuria, Director and Chief Executive, ICRIER, for giving
us the opportunity to work in this area and for his constant support and encouragement. We are
grateful to Ecorys Nederland BV and Ecorys India Private Limited for giving us the
opportunity to be a part of their consortium. We would especially like to thank Nora Plaisier,
Sector Leader, Trade & Private Sector and Rohan Krishna, Director, Business Development,
for their support.
This report is part of the European Union (EU)-India Capacity-building Initiative for Trade
Development (CITD) Project. At the inception of the study, senior officials from the Indian
Government and the European Commission provided us with crucial insights. In particular, we
would like to thank Anita Praveen, Joint Secretary, Department of Commerce and Chairman,
Agricultural & Processed Food Products Export Development Authority (APEDA); Ishita G.
Tripathy, Director, Department of Commerce; Wojciech Dziworski, Senior Economist and
Political Analyst, Innovation and Healthy Ageing, DG SANTE; Francesca Renzi, Advisor,
Economic Co-operation; Chaitanya Kaushal, Senior Trade Officer and Smita Singh, Senior
Project Manager, Delegation of the European Union to India.
During the course of this study, we met with several experts who are also key stakeholders in
the EU-India CITD programme. These include S. K. Saxena, Director, Export Inspection
Council of India and his team; Tarun Bajaj, General Manager (APEDA), Sudhanshu, Deputy
General Manager (APEDA) and A. K. Yadav, Advisor (APEDA); S. N. Sushil, Plant Protection
Advisor, Directorate of Plant Protection, Quarantine & Storage; Pawan Kumar Agarwal, Chief
Executive Officer, The Food Safety and Standards Authority of India; and Anil Jauhri, Chief
Executive Officer, National Accreditation Board for Certification Bodies.
We would also like to thank officials from the Ministry of Agriculture & Farmers Welfare
(India), Ministry of Food Processing Industries (India) and Department for Environment, Food
& Rural Affairs (DEFRA, United Kingdom) for their inputs. Officials from horticulture
missions and agriculture departments of different states, state marketing boards such as the
Maharashtra State Agricultural Marketing Board and Maharashtra State Horticulture &
Medicinal Plant Board gave us useful insights into state policies and issues. Siraj Hussain,
Senior Visiting Fellow – Agriculture, ICRIER, and Ashok Gulati, Infosys Chair Professor for
Agriculture, ICRIER connected us to a number of companies and government officials. Their
knowledge and contribution has enriched the study.
We are also thankful to industry associations and export promotion councils such as the All
India Rice Exporters’ Association, Vegetables and Fruit Exporters Association, Indian
Oilseeds and Produce Export Promotion Council, the National Dairy Development Board,
Gujarat Co-operative Milk Marketing Federation Limited, Maratha Chambers of Commerce,
Grapes Exporters Association of India and Maharashtra Rajya Draksha Bagaitdar Sangh for
not only sharing their inputs but also connecting us to their members.
ii
We would also like to thank the exporters, processors and farmers who participated in the
survey and shared their views. Pallab Ghosh and his team at Spectrum Research Group deserve
a special mention for conducting the survey. We would like to thank Bhavook Bhardwaj, Suvi
Agrawal and Mahima Malhotra at ICRIER who helped us in compiling information at different
phases during the study.
Tara Nair deserves a special mention for copyediting the report. The administrative team of
ICRIER comprising Anu Mohandas, Chhaya Singh, Raj Kumar Shahi, Prabhat Kumar, Rajeev
Kapil and his team and Manmeet Ahuja and his team provided excellent administrative support.
Last but not least, we would like to thank our families for their support and encouragement.

iii
List of Abbreviations
Agricultural and Processed Food Products Export Development Authority APEDA
Agricultural Produce Market Committee APMC
All India Rice Exporters Association AIREA
Association of Public Analysts APA
Bacterial blight BB
British Retail Consortium BRC
Broad-based Trade and Investment Agreement BTIA
Bureau of Indian Standards BIS
Capacity-building Initiative for Trade Development CITD
chlormequat chloride ccc
codex maximum residue level CXL
Deoxyribonucleic acid DNA
Department for Environment, Food and Rural Affairs DEFRA
Directorate General of Foreign Trade DGFT
Directorate General of Health and Food Safety DG SANTE
eggplant fruit and shoot borers EFSB
European Commission EC
European Food safety Authority EFSA
European Union EU
European Union Notification System for Plant Health Interceptions EUROPHYT
Export Inspection Agencies EIAs
Export Inspection Council of India EIC
The Food and Agriculture Organization of the United Nations FAO
Food and Veterinary Office
food business operator
FVO
FBO
Food Safety and Standards Authority of India FSSAI
foot and mouth disease FMD
foreign direct investment FDI

iv
free on board f.o.b.
free trade agreement FTA
General Agreement on Tariff and Trade
General Principles of Food Hygiene
GATT
GPH
Generalized System of Preferences GSP
geographical indication GI
Good Agricultural Practices GAP
Great British Pound GBP
Gujarat Co-operative Milk Marketing Federation Limited GCMMF
Hazard Analysis and Critical Control Point HACCP
Harmonised System HS
high temperature short time HTST
Importer Exporter Code IEC
In Process Quality Control IPQC
Indian rupee INR
Indian Oilseeds and Produce Export Promotion Council IOPEPC
Information Network for Animal Productivity & Health INAPH
International Food Policy Research Institute IFPRI
International Organisation for Standardization ISO
International Union for the Protection of New Varieties of Plants UPOV
Jawaharlal Nehru Port JNP
Kentucky Fried Chicken KFC
Local Authorities Coordinators of Regulatory Services LACORS
Maharashtra Hybrid Seeds Company MAHYCO
Maharashtra State Agricultural Marketing Board MSAMB
maximum residue limit MRL
metric tons
mutual recognition agreement
MT
MRA
National Dairy Development Board NDDB
v
non-resident Indian NRI
Office International des Epizooties (World Organisation for Animal Health)
parts per billion
parts per million
OIE
ppb
ppm
Plant Protection and Quarantine PPQ
Quick Service Restaurant QSR
Rapid Alert System for Food and Feed RASFF
Registration-Cum-Allocation Certificate RCAC
research and development R&D
Rice Exporters Association of Pakistan REAP
sanitary and phytosanitary SPS
skimmed milk powder SMP
specific trade concern STC
ultra high temperature UHT
United Arab Emirates UAE
United Kingdom UK
United States US
United States Dollar USD
Vegetables and Fruit Exporters Association VAFA
whole milk powder WMP
wood packaging material WPM
World Health Organization WHO
World Trade Organization WTO

vi
Executive Summary
India is one of the largest producers of a number of agriculture commodities and the European
Union (EU) is one of the largest export markets for India. In 2015-16, India’s export of
agricultural commodities to the EU was more than five times higher than the EU’s exports to
India. While the EU continues to be a key export destination for Indian agricultural exports, in
recent years a number of Indian agricultural products have been facing rejection and export
bans in the EU due to standards related to food quality, safety and health, also known as
sanitary and phytosanitary (SPS) measures. The European Commission (EC) funded EU-India
Capacity-Building Initiative for Trade and Development (CITD) project, which was launched
in the year 2013, provides a platform to build the capacity of various Indian stakeholders on
how to address different trade related issues, including the SPS issues. Under this project, the
objective of this report is to study SPS related barriers faced by India’s agricultural exports
to key markets, identify the reasons for such barriers and make recommendations on
addressing barriers through greater collaboration and knowledge sharing with the EU.
1.1 Methodology
The study is based on secondary data analysis and a primary survey using the case study based
approach for nine agricultural commodities, namely, mangoes, table grapes, Basmati rice, dairy
products, green peas, green beans, eggplant, peanuts and mushrooms.1 The stakeholders were
identified in consultation with Agricultural and Processed Food Products Export Development
Authority (APEDA), sector specific export promotion councils, state government departments
and industry associations. The survey was conducted from May 2016 to March 2017.
1.2 Key Findings
The survey found that there are differences in the case studies with respect to the extent that
different products are affected by the EU’s SPS measures. There are products (such as
mangoes, grapes and eggplants) in which Indian exporters have faced rejections or bans in the
EU and other markets in the past for SPS issues such as fruit flies or thrips infestation. These
issues have now been resolved by implementing measures (such as hot water treatment for the
mangoes being exported to the EU or gamma irradiation treatment for the mangoes being
exported to the US) that are acceptable to the importing countries. For some products, there are
issues with the maximum residue limits (MRLs) permissible for certain chemicals and
pesticides as is required by the EU, which can act as SPS barriers for Indian exporters and
farmers. For some products such as green peas, green beans and mushrooms, there are hardly
any SPS related alerts raised by the EU, but export potential is low.
The survey also found that implementing traceability to the farm has been the most successful
way of addressing the SPS barriers on a long-term basis. Setting up systems to allow for
traceability (as part of domestic reforms) and requests for scientific justifications for new or
adjusted SPS measures of India’s trading partners (through trade agreements) have helped India
1 This methodology and the selection of products was requested in the Terms of Reference (ToR) for this
study.
vii
to raise certain SPS issues in the World Trade Organization (WTO)’s Committee on Sanitary
and Phytosanitary Measures. These have been discussed in detail in the respective chapters.
1.2.1 SPS Barriers in the EU: Where They Arise and Their Impact
This report highlights that the EU has higher food safety standards than not only those set by
international organisations such as Codex Alimentarius Commission, but for some products
such as peanuts, the standards are higher than those set by other developed countries such as
the US. There are instances where the EU has frequently revised the MRL for chemicals for
various products, which make the imports to the EU more prone to rejections. It is extremely
difficult to understand the scientific justification for some of the changes in the MRL, such as
the proposed reduction in the chlormequat chloride (ccc) limits in grapes from 0.05mg/kg to
0.01mg/kg in the year 2016 and India has argued this case in the WTO. The EU has decided
to roll back the measure until there are scientific justifications. In a number of cases, such as
the reduction of MRL of ccc for grapes and MRL of tricyclazole for Basmati rice, the issue has
to be addressed at field level by reducing/limiting use of the particular chemical, but this would
require longer transition periods as such adjustments are not possible within a short time
duration.
For certain products like milk products, the export requirements related to health and food
safety standards are so stringent that there are hardly any exports. Further, in cases where India
has official export inspections, laboratory testing procedures/residue monitoring procedures;
the EU in its audits has raised concerns related to such procedures. Recently, the EU decided
to test up to 50 per cent of India’s shrimp consignments for residues such as chloramphenicol
and nitrofurans, which was earlier 10 per cent.
Over the years, India has set up a robust export inspection regime. However, the survey
participants fail to understand why after meeting all the official export inspection requirements
in India, their consignments are being rejected in the EU.
The case studies also highlight that the certain chemicals, pesticides, etc., used in farms can
lead to SPS barriers and, therefore, they can only be controlled to some extent at the post-
harvest and pre-export stage. The survey found that the product can also get contaminated in
the supply chain due to poor storage conditions or incorrect processing technologies, among
others. Specifically, aflatoxin contamination in Basmati rice and peanuts has been attributed to
poor supply chain and storage conditions by a number of studies and this may be a possible
reason for SPS barriers and product rejections.
The case studies also discussed how these barriers have adversely affected the Indian exporters
and farmers. It ranges from loss of revenue and reduction in shelf-life of products, to destroying
the products/consignment at the EU port of entry. Since issues are product specific, each case
study discusses how the specific issues have adversely affected the different stakeholders.
The case studies show that the EU standards apply equally to the EU food business operators
(FBOs) as well as to all exporters to the EU. In this context, it is important to note that public

viii
awareness and concerns about food safety are rising across the world. There has been an
increase in the use of risk analysis techniques and a number of developing countries are taking
measures to implement more stringent food safety standards for both exports and domestic
consumption. For example, Cambodia banned tricyclazole in March 2017, following the EU’s
new MRL on the same.
One of the concerns of the Indian exporters is that they are losing their market share to exports
from countries such as Kenya, Uganda and Brazil and Chile, who are able to meet the EU
standards. Therefore, SPS issues have to be addressed in the context of a highly globalised and
competitive trade environment.
1.2.2 Addressing the SPS Barriers
The SPS barriers can be addressed in several ways such as by ensuring conformity to the
importing country standards, implementing certain processes to meet the importing country
requirements, undertaking corrective measures, implementing good agriculture practices,
raising the issue in the WTO and discussing the issue bilaterally with the importing country,
among others. These are discussed in details below:
Implement Product Traceability: The most successful way of resolving the SPS issues in
the recent years has been establishment of product traceability. The case studies of
mangoes, fresh grapes, peanuts and eggplant reflect how product traceability can help to
overcome the SPS barriers. A number of exporters and processors are also keen to have a
product traceability system for Basmati rice and milk products, which is presently not in
place.
There are some issues in implementing product traceability, which may continue to exist.
India is a large country with multiple small and mid-sized farmers and, therefore, raw
materials are procured from multiple farms and agriculture mandis, which make it difficult
to ensure product traceability. The same is true for sourcing of milk from co-operatives.
Further, direct sourcing and contract farming are not allowed in certain states which makes
it difficult to have direct links between exporters, processors and farmers, and ensure
product traceability.
Initiate Proactive Measures: The case studies show that proactive measures will enable
India to counter bans. For example, while mangoes from Pakistan faced significantly more
interceptions than Indian mangoes for fruit flies during the same time period, Indian
mangoes faced the ban and Pakistani mangoes were not banned. This is because when the
EC sent a warning letter to Pakistan, it immediately stopped exporting mangoes and made
hot water treatment mandatory. Similar action was taken by India for okra which helped
the country to counter a ban.
Implement Good Agriculture Practices (GAP): Most developing countries address the
SPS issues faced in developed country markets by implementing GAP and reducing the use
of chemicals and pesticides. The survey found that many chemicals that are globally banned

ix
are still available over the counter in India. If Indian farmers use these pesticides, they will
not be able to exports to countries such as the US, the EU and Japan.
A number of state government officials pointed out that India should move to safe
agriculture and GAP. First, chemicals and fertilisers that are banned in other countries
should not be used in India. Second, the curriculum in agricultural universities should be
updated and students should be imparted with lessons on modern and good agriculture
practices that can be applied at the ground level. These have to percolate down to the farm
level. Agricultural universities can have farm-level programmes to enable the practical
application of knowledge. Third, in sectors such as dairy sector, proper hygiene conditions
should be maintained at the farm level to ensure that the milk that reaches co-operatives
and private processors is of good quality. Indian government has renewed its focus on
hygienic milk production and marketing and such efforts have to begin at the farm level.
Farmers who were surveyed, irrespective of their farm size, revealed that they would like
to move away from the use of chemicals and towards GAP and subsequently towards
organic farming as there is greater demand for organic products in large markets such as
the EU. All government departments may work together to design a comprehensive policy
on safe agriculture and organic farming.
Strengthen Testing Procedures and Follow Global Best Practices: In the case of sectors
such as milk products and milk-based products, efforts have been put in the right direction
to ensure that India has good inspection process for dairy exports. There is a need for
research in developing efficient testing procedures for milk products and milk-based
products. General Principles of Food Hygiene (GPH) based on the hazard analysis and
critical control points (HACCP) system for milk production and processing should be
followed throughout the milk supply chain.
Export Infrastructure: The survey found that India has been increasingly implementing
food safety assurance and management system such as HACCP, and the Food Safety and
Standards Authority of India (FSSAI) is also enforcing it for all FBOs. However, some
trading partners such as the EU are insisting on installation of specific infrastructure
requirements such as mechanised methods of milking, which may be possible for private
dairies to abide by but may be difficult for the milk co-operatives to implement, given the
large number of small farms. In this context, it is important to identify and prioritise
companies which are ready to export and those which need further training and capacity
building and infrastructure prior to export. The survey recommended creation of model
dairy farms with common infrastructure such as mechanised milking facilities for the small
farmers and co-operatives. This will also enable poor farmers to have access to state-of-
the-art infrastructure and hygienic methods, which will in turn enable them to earn better
revenue.
Discussions at the WTO’s Committee on Sanitary and Phytosanitary Measures highlight
that India is of the view that aflatoxin contamination can happen in transit (for example,
during storage and transportation), while according to the EU it is possible to restrict
aflatoxin contamination through appropriate packaging, storage and shipping conditions.
While the two economies may differ in their views, there is no denial that it is important to

x
strengthen the supply chain. In this context, the Ministry of Agriculture & Farmers Welfare
and the Ministry of Food Processing Industries (MOFPI), and others agencies such as the
National Centre for Cold Chain Development (NCCD) which are involved in building
agriculture infrastructures pay a key role.
The survey strongly recommends that there should be products of exportable quality
accompanied by farm level infrastructure and supply chain that support the exports. This
along with a product traceability system (which helps to ensure quality) will facilitate
exports. Without these there may not be any exports – the case study of milk product
exports highlight that India is the largest producer of milk and has a fairly robust export
inspection regime, yet there is no exports because the produce and farm level infrastructure
does not meet the importing country’s requirements.
Data Generation and Data Availability: To raise an SPS issue with any trading partner,
there is need for data and scientific justification. In India, there is no data of exports from
different states. This data has to be collected and analysed. APEDA, through the TraceNet
system, can create a database consisting of exports from the state, number of farmers and
acreage under export, etc., which can be made available on the public domain through the
APEDA website. Since agriculture is a state subject, information on how much land is used
for cultivation for export, export contribution of each state, export infrastructure in each
state, etc., will be particularly beneficial for both state level policymakers and exporters.
Further, in sectors such as dairy sector, India is not declared free from foot and mouth
disease (FMD) by the Office International des Epizooties (OIE). However, the government
is continuously making efforts to reduce the incidence of FMD outbreaks. There is a need
for collection of data by the relevant authorities capturing the information on FMD
outbreaks in the country. This will also help to raise the issue in the WTO and other forums,
if it is backed by data and scientific evidence.
Scientific Research: A number of agriculture products that India exports to the EU and
other markets are specific to this country. For example, Basmati rice, Alphonso mango and
Darjeeling tea. These are premium products and if such products get rejected or banned,
the cost of such a ban is high. To prevent it, there is need for scientific research in India to
find out methods to address the issues faced by such products in key markets. The research
should focus on both short-term and long-term solutions and research outcomes may be
made available in the public domain before implementing policies. Such research findings
can be used in discussion with the importing countries and also for training and knowledge
sharing with the exporters and other stakeholders.
Request for Information and Scientific Justification: The case studies show that while
information on the SPS measures imposed by the EU is available in the public domain, in
some cases the scientific justification for imposing the measure is not clear. India should
request for the scientific justification of the measures.
Discuss the Issue in the WTO: Out of the 416 specific trade concerns that have been raised
in the WTO by its member countries, only 8 are raised by India against the EU. Given that
Indian exports face a number of SPS barriers in the EU, India can raise more concerns in
the WTO, with scientific evidence and data supporting the concerns. Further, the status of

xi
6 out of 8 concerns given as “not reported” (NR), which implies that the current status of
the concerns (whether it has been addressed or not addressed) is not known. It is important
to clarify the status once the issue is resolved in the WTO.
Discuss the Issue Bilaterally by taking Buyers and their Associations into Confidence:
The survey showed that SPS issues are mostly discussed bilaterally with the importing
country. Such discussions may be more beneficial if the EU buyers support it and if the
restrictions imposed by the EU adversely impact them. The case of tricyclazole for Basmati
rice is a good example in this respect. In this case, certain relaxation of the time period of
implementation of the measure has been given to Basmati rice growing countries (namely
India and Pakistan) at the request of the European FBOs and other stakeholders. Thus,
working with the EU buyers can help to reduce the SPS barriers.
Sign Equivalence Agreements/MoUs: The WTO’s SPS Agreement encourages member
countries to recognise each other’s conformity assessment systems based on international
standards so that products certified in one country are accepted without the need for further
inspection/testing by other countries through equivalence or mutual recognition agreements
(MRAs). The Codex Alimentarius Commission also encourages such agreements with a
view to avoid duplication of inspection and testing which can increase the cost of exports,
and to ensure the health and safety concerns. The EU enters into product specific MRAs
and such agreements are possible with countries that have strong export control system.
India may sign product specific equivalence agreement with the EC. The content of the
agreement may include, among others, provision for retesting and appeal in case of product
rejection.
Knowledge Sharing and Collaboration with the EU: The case studies identified specific
areas where there is need for knowledge sharing and collaboration with the EU. The EU-
India CITD programme has helped to establish co-operation and to increase capacity of key
beneficiaries, but there are possibilities of further co-operation and capacity improvement.
To conclude, in spite of the issues that companies may face, the report found that there is
strong willingness among Indian exporters, processors and farmers to meet EU standards.
The case studies of mangoes and fresh grapes reflect success stories; efforts were made by
the government agencies, farmers and exporters to adhere to the EU norms to be able to
export to them. The EU is a crucial market for India and all stakeholders (including
exporters, farmers, processors, supply chain agents) have accepted that they have to meet
EU export requirements and they are willing to do so.

1
Chapter 1: Introduction
Global trade in agricultural products was valued at around United States Dollar (USD) 3.3
trillion in 2015.2 According to the World Trade Organization (WTO), the value of global
agricultural exports nearly tripled between 2000 and 2012, while agricultural exports increased
by about 60 per cent in volume terms over the same period.3 In the year 2015, the European
Union (EU) was the largest exporter of agricultural produce and India was the ninth largest
exporter. However, there are some areas of concern. First India’s share in global exports of
agricultural products has remained low at around one to two per cent in the last ten-year period.
Second, India’s position among the top ten exporters declined from 7th in 2014 to 9th in 2015
and the country recorded a decline of around 19 per cent in exports from the previous year.
Third, Indian agricultural exports have been facing rejection in important markets such as the
United States (US), the EU, Australia and Japan because they do not meet food safety
requirements, also known as sanitary and phystosanitary (SPS) standards imposed to protect
the health and safety of consumers of importing countries and regions.
A number of studies have shown that Indian exporters have been facing difficulties in exporting
food products to key markets such as the EU (Chaturvedi and Nagpal, 2003; Mehta, 2005;
Chaudhari et al., 2012). The issues affect various products and are multi-dimensional in nature.
This means that technical assistance is often required by developing countries to successfully
meet global standards or the standards of specific importing countries.
Given this background, the European Commission (EC) initiated a project entitled ‘Capacity-
building Initiative for Trade Development’ (CITD), was launched in 2013 to help to modernise
and enhance the capacity of India's trade-related regulatory institutions and enforcement
systems to meet international standards and requirements. ‘SPS and food safety standards’ is
one of the key areas under this project where trade related assistance in the form of training,
field visits and knowledge sharing are offered to Indian exporters, farmers and export
promotion organisations to enable them to upgrade and help them adhere to EU standards. This
report, which is a part of the project, aims to examine SPS related barriers faced by India’s
agricultural exports to key markets, identify the reasons for such barriers and make
recommendations to help address the issue of barriers through greater collaboration and
knowledge sharing with the EU. The broad objective of the study is to suggest measures to
help upgrade the quality and standards of India’s products with a view to increase exports;
increase understanding of the EU’s standards and regulations to facilitate exports to the EU
market; identify the training needs of different stakeholders in the export supply chain, and
identify the reforms required in India and areas of EU-India knowledge sharing and
collaboration.
2 Calculated using the World Trade Organization’s Statistical Review, Table No. A14, accessible at
https://www.wto.org/english/res_e/statis_e/wts2016_e/wts16_chap9_e.htm (accessed on 19 December,
2016) 3 WTO. 2014. World Trade Report 2014. Trade and development: recent trends and the role of WTO.
Geneva, Switzerland

2
1.1 Methodology
The report is based on a literature review, secondary data analysis and case studies of specific
agricultural product exports to the EU. The study covers nine products – mango, table grapes,
Basmati rice, dairy products, green peas, green beans, eggplant, peanuts and mushrooms. The
products were given to the research team by the Agricultural and Processed Food Products
Export Development Authority (APEDA), Export Inspection Council of India (EIC) and other
beneficiaries of the EU-India CITD programme. For this study, one-to-one meetings were held
with central and state government officials, export promotion and regulating agencies, state
chambers of commerce, state marketing boards and industry associations. The list of exporters
was identified after discussion with APEDA, state marketing boards, product specific
associations, etc. Care was taken to cover companies whose product has faced SPS issues in
the EU market. The sample size depended on the product category. In certain products, such as
grapes and mangoes there are a large number of exporters while in others such as green peas
there are only a few exporters.
The secondary data has been used to present an overview of agriculture trade, and product
specific exports. It is important to note that India grows a number of varieties of specific
products such as mangoes but may export only certain varieties of mangoes for example
Alphonso mangoes. This is discussed in the case studies. Each case study follows a common
format. It begins by describing the interviews covered in the survey, Indian export to the world
and the EU, the export process and the supply chain. It then focuses on SPS measures imposed
by the EU that can act as a barrier to Indian exports and how it has impacted exports of that
product, the exporters and other stakeholders such as farmers. It also covers wider challenges
that affect compliance with the EU’s SPS measures.
It is important to note that SPS issues arise on a continuous basis and only those issues which
came up during the time period of the survey (the survey was conducted from May 2016 to
March 2017) are presented in this report.
The issues raised by exporters were cross-verified with other stakeholders such as farmers and
logistics service providers and state government departments and state marketing boards. In
some cases the case studies have been substantiated by secondary information such as the EC
audit reports. Product specific recommendations are given in each case study and general
recommendations are given in the concluding chapter.
1.2 Layout
The layout of the report is as follows. The next chapter (Chapter 2) presents an overview of
India’s agricultural exports to the world and the EU. It also examines the broad changes in
export patterns in the past ten years. It then examines the key institutions regulating exports in
the two economies and how food safety related issues are addressed in India’s and EU’s trade
agreements. Chapters 3 to Chapter 11 present the case studies of the selected product
categories. The case studies follow a common format. They present global production and
India’s position in the production of the specific product, key states within India producing the

3
product, India’s export of the product and share of the EU in exports, the export process,
regulation and value chain, SPS and other barriers to export and the way forward. Chapter 12
summarises the findings from secondary literature and the survey and presents the policy
recommendations from the study.
1.3 Various Ways to Address SPS Barriers
The preliminary meetings with APEDA, Trade Policy Division of the Department of
Commerce, industry associations such as Federation of Indian Chambers of Commerce and
Industry (FICCI) and Confederation of Indian Industry (CII) confirm that SPS issues faced by
Indian exports to the EU can be addressed through the following strategies or corrective
measures:
India (either on its own or along with other exporting countries) can ask for scientific
evidence of SPS measures implemented by the EU. The EC can share the scientific
justification for imposition of SPS measures with India and also share what other countries
are doing to address the SPS issues.
India adopts certain measures domestically (such as implementing a traceability system)
that are acceptable to the EU. The EU checks that the measures are to its satisfaction and
then India continues to export.
SPS barriers can be addressed through mutual collaborations and knowledge sharing under
initiatives such as the EU-India CITD programme.
India may initiate domestic reforms.
As a member of the WTO, India may raise the issues under the Agreement on the
Application of Sanitary and Phytosanitary measures.
If India signs a trade agreement with the EU in the future, SPS issues can be discussed
under that agreement.
The case studies examine in detail what measures have been adopted and what strategy India
can adopt in the future. As a first step it is important to note how SPS issues are discussed
under the WTO’s SPS Agreement and what the implications are for the EU and India.
1.4 WTO’s SPS Agreement: Can India Raise SPS Issues in Exports to the EU
under this Agreement?
The Agreement on the Application of Sanitary and Phytosanitary Measures (known as the
"SPS Agreement") entered into force with the establishment of the WTO on 1 January, 1995.
The Agreement sets out the basic rules for food safety and animal and plant health standards. It
allows countries to set their own standards but also mentions that regulations must be based on
scientific analysis. Regulations should be applied only to the extent necessary to protect human,
animal or plant life or health and they should not arbitrarily or unjustifiably discriminate
between countries where identical or similar conditions prevail.

4
According to the WTO, domestic policies related to food quality, health and food safety are
among the most common non-tariff barriers. The SPS measures are imposed by most countries
to
‘limit the damage caused by or to protect the health of individuals from risks arising from the
entry, establishment or spread of pests, diseases, disease-carrying organisms or disease-causing
organisms, additives, contaminants, toxins or disease-causing organisms in foods, beverages
or feedstuffs; diseases carried by animals, plants or products.’4
Under the WTO’s SPS Agreement, SPS measures are defined as any measure applied to protect
animal or plant life or health from risks arising from:
the entry, establishment or spread of pests, diseases, disease-carrying organisms or disease-
causing organisms;
additives, contaminants, toxins or disease-causing organisms in food, beverages or
feedstuff;
diseases carried by animals, plants or products thereof, or from the entry, establishment or
spread of pests.
SPS measures include all relevant laws, decrees, regulations, requirements and procedures
including, inter alia, end product criteria; processes and production methods; testing,
inspection, certification and approval procedures; quarantine treatments including relevant
requirements associated with the transport of animals or plants, or with the materials necessary
for their survival during transport; provisions on relevant statistical methods, sampling
procedures and methods of risk assessment; and packaging and labelling requirements directly
related to food safety. The SPS Agreement also encompasses measures to prevent or limit other
damage within the territory of a country from the entry, establishment or spread of pests.
Since India and the EU are both members of the WTO, the EU has to submit any changes in
the maximum residue limit (MRL) to the WTO and India can scientifically challenge it under
the WTO framework.
Further, the WTO member countries are encouraged to use international standards, guidelines
and recommendations, where they exist. Specifically, the agreement encourages harmonisation
on the basis of standards, guidelines and recommendations set by three international
organisations, including the Codex Alimentarius Commission, the International Office of
Epizootics (OIE), and the relevant international and regional organisations operating within the
framework of the International Plant Protection Convention (see the text of the WTO SPS
Agreement). Article 12 of the SPS Agreement established the Committee on Sanitary and
4 Annex A on Definitions of the WTO Agreement on the Application of Sanitary and Phytosanitary Measures
(called the SPS Agreement) accessible at https://www.wto.org/english/tratop_e/sps_e/spsagr_e.htm
(accessed on 2 August, 2016)

5
Phytosanitary Measures to provide a regular forum for consultation, implement the provisions
of the Agreement and further the objective of harmonisation of standards across countries.
It is important to note that globally acceptable standards such as the Codex Alimentarius can
be higher than the national requirements of many countries, especially developing countries,
but the SPS Agreement explicitly permits governments to choose not to use international
standards. However, if countries align themselves to globally acceptable standards such as the
Codex Alimentarius standards, then it is likely that a majority of the SPS issues in international
trade could be resolved. The bigger concern is that, time and again, many countries, especially
developed countries, impose more stringent standards than international standards with a view
to protect their nations against potential health threats arising from the consumption of certain
types of food products originating in developing countries (Nielsen and Anderson, 2001),
which can act as a major non-tariff barrier to exports from developing countries (Henson and
Loader, 2000). Many of these developing countries, including India, have small farm sizes, and
poor farmers. While these farmers are keen to export, they may not have the right technology
and training or access to the right inputs, including seeds and fertilisers, which could enable
them to meet the conditions imposed by importing countries. In such cases, there is need for
collaboration, sharing of information and sometimes support for upgrading food safety
standards. The EU-India CITD programme aims to provide such support and this study tries to
identify areas where there are support requirements.
While WTO acknowledges that some trade restrictions may be necessary to ensure food safety
and animal and plant health protection, SPS restrictions can be used by member countries to
protect their domestic producers from economic competition. To reduce possible arbitrariness
in decisions and encourage consistent decision-making, the agreement clarifies which factors
should be taken into account in the assessment of the risk involved. It points out that measures
to ensure food safety and to protect the health of animals and plants should be based as far as
possible on the analysis and assessment of objective and accurate scientific data. Therefore,
there is a need to collect and collate the data for challenging an SPS measure.
One key issue that needs consideration here is that due to differences in climate, existing pests
or diseases, or food safety conditions, it is not always appropriate to impose the same SPS
requirements on food, animal or plant products coming from different countries. Therefore,
SPS measures sometimes vary, depending on the country of origin of the food, animal or plant
product concerned. This is taken into account in the SPS Agreement and thus, using this
provision, an importing country/region such as the EU, can consider an exporting country like
India more risky than other trading partners such as the US. For example, India has been
identified as one of the third countries5 with the risk of foot and mouth disease (FMD). This
implies that the dairy products from India have to undergo various heat treatments before being
exported to the EU.6
5 Third countries are countries that are outside the EU. 6 For more details, see COMMISSION REGULATION (EU) No 605/2010. Available at http://eur-
lex.europa.eu/LexUriServ/LexUriServ.do?uri=OJ:L:2010:175:0001:0024:EN:PDF (accessed on 6 April,
2017)
6
The WTO member countries are required to notify other countries of any new or changed SPS
requirements that can affect trade. They have to set up offices (called "Enquiry Points") to
respond to requests for more information on new or existing measures. They also have to share
information on how they apply their food safety and animal and plant health regulations. This
enables member countries to understand the national standards of their trading partners. The
information about SPS measures undertaken by the EU is available to Indian policymakers and
industry through this route.
The EU-India CITD programme serves as a platform to help Indian stakeholders understand
EU food safety standards within the framework of the WTO’s SPS agreement. While India and
the EU are yet to sign a comprehensive trade agreement, the next chapter highlights how trade
agreements can help to address product specific issues.

7
Chapter 2: Agriculture Trade between India and the EU:
Trends, Regulatory Scenario and Treatment in Trade Agreements
World Bank statistics for the year 20137 indicate that around 60 per cent of India’s land area
was under cultivation. Given the size of the Indian sub-continent, it is larger than many
developing and developed countries in real terms.
India’s crop production has increased over the years and India has transformed itself from a
food deficit country to a food surplus country.8 Crop production in India is dominated by food
grains, with cereals and pulses accounting for 63.6 per cent of the gross cropped area in 2013-
14. Fruits and vegetables accounted for 8.3 per cent of the total cropped area in the same year.
9 Globally, India is the largest producer of dairy products such as milk and fruits such as
mangoes. It is the second largest producer of rice, groundnuts and many vegetables.10 With its
large and growing production of fruits, vegetables and dairy products, India has changed its
agriculture trade policies over the years and the country is now exporting a number of
agricultural commodities to the rest of world.
World trade in agricultural products was valued at approximately USD 3.3 trillion in 2015.11
In 2015, the EU12 was the largest exporter13 of agricultural commodities with a share of 10 per
cent in the world export of agricultural commodities while India was the ninth largest exporter
with a share of 2.2 per cent.14 With a share of 10 per cent in total imports of agriculture
commodities in 2014, the EU was the largest importer while India had the 10th position with a
share of one per cent.15 The share of agricultural commodities16 in India’s total trade basket
7 Accessible at http://data.worldbank.org/indicator/AG.LND.AGRI.ZS (accessed on 8 November, 2016) 8 Hoda and Gulati (2013) 9 NITI Aayog (2015) 10 Annual Report of the Ministry of Food Processing Industries for 2014-15 accessible at
http://mofpi.nic.in/sites/default/files/annualreport201415eng.pdf_0.pdf (accessed on 9 November, 2016) 11 Calculated using the World Trade Organization’s Statistical Review, Table No. A14 accessible at
https://www.wto.org/english/res_e/statis_e/wts2016_e/wts16_chap9_e.htm (accessed on 19 December,
2016) 12 European Union (EU) since 2013 refers to EU 28 including Austria (1995), Belgium (1958), Bulgaria
(2007), Croatia (2013), Cyprus (2004), Czech Republic (2004), Denmark (1973), Estonia (2004), Finland
(1995), France (1958), Germany (1958), Greece (1981), Hungary (2004), Ireland (1973), Italy (1958),
Latvia (2004), Lithuania (2004), Luxembourg (1958), Malta (2004), Netherlands (1958), Poland (2004),
Portugal (1986), Romania (2007), Slovakia (2004), Slovenia (2004), Spain (1986), Sweden (1995) and the
United Kingdom (1973). Historical trade data collected for the EU corresponds to those countries that were
members of the EU during the period for which the data is collected. For instance, data for the period before
2013 will not include Croatia and it will represent EU 27 only. 13 Considering intra-EU and extra-EU agricultural trade 14 For details, see WTO (2016),“World trade statistical review 2016”accessible at
https://www.wto.org/english/res_e/statis_e/wts2016_e/wts2016_e.pdf (accessed on 7 December, 2016) 15 For details see Commodity-wise Trade Profile of the WTO accessible at
https://www.wto.org/english/res_e/statis_e/world_commodity_profiles15_e.pdf (accessed on 23 November,
2016) 16 For the purpose of this study, harmonised system (HS) of classification is used for analysing trade in
agricultural commodities. These include all categories from HS 04 to HS 21 excluding HS05, 06, 13, 14
and 16. A list of commodities at the 2-digit level is given in Appendix A2.1. Certain categories include one
or two relevant items (for instance, HS 06 include tubers); however, these are a very small proportion of
trade and, therefore, they are not included in the overall calculation. The classification includes both fresh
and processed agricultural products, as defined under the HS Codes.

8
was 6.06 per cent in 2015-16.17 The EU is India’s largest trading partner for trade in agricultural
commodities.18 India has a positive balance with the EU for agricultural commodities (fresh
and processed). Some of the key items of agricultural export from India to the EU are frozen
shrimps and prawns, cashew nuts, fresh grapes and husked rice. The positive trade balance with
the EU makes EU a key export market for Indian exporters, farmers and processors. Detailed
bilateral agricultural trade data for India and EU are presented in Section 2.2.
Realising the importance of the EU as a key export market, joint efforts have been made by the
Indian Government and the EU to facilitate trade in agricultural commodities. For instance,
India and the EU have constituted joint working groups on agriculture and marine products,
technical barriers to trade and SPS issues, and food processing industries. These joint working
groups meet regularly to enhance sector-specific co-operation.19 The EC funded CITD is
another example of government-to-government collaboration.
India imports technology from the EU. For instance, Lemken GmbH and Co. from Germany
and Maschio Gaspardo Group from Italy are important suppliers of agricultural machinery to
India and these companies are expanding their presence in the Indian market. Further, a number
of food businesses from the EU member states are present in India. These include Unilever plc
[United Kingdom (UK)], Danone (France), Lactalis Group (France) and Associated British
Foods (UK). Some of them have established wholly-owned subsidiaries in India while others
have entered into joint ventures with Indian companies. Collaboration with companies from
the EU has enabled Indian companies to access best global practices. This has also helped EU
companies to access the large and growing Indian market.
The above discussions highlight that bilateral trade, investment from the EU and collaboration
and knowledge sharing in agricultural products is important for both India and the EU.
However, despite efforts from both sides, there are several barriers to trade in agricultural
commodities between India and the EU. First, of course, is the tariff barrier. According to the
WTO, the average tariff rates on agricultural products (most favoured nation) applied is 33.4
per cent for India and 12.2 per cent for the EU.20 However, in certain categories such as dairy
products, the EU imposes a higher average tariff (42.1 per cent) as compared to India (33.5 per
cent). For certain products, there is a Generalised Scheme of Preferences (GSP),21 which is
discussed in the product-specific cases studies.
17 Calculated from the Directorate General of Foreign Trade (DGFT) database 18 Calculated from the Directorate General of Foreign Trade (DGFT) database 19 See http://www.mea.gov.in/Portal/ForeignRelation/European_Union_13_01_2016.pdf (accessed on 9
November, 2016) 20 For details see https://www.wto.org/english/res_e/booksp_e/tariff_profiles15_e.pdf (accessed on 10
November, 2016) 21 The EU's Generalised Scheme of Preferences (also known as Generalised System of Preferences GSP)
allows developing countries to pay less or no duties on their exports to the EU. The EU grants GSP to some
Indian commodities (which are discussed in product-specific case studies), which leads to lower tariffs and
hence India benefits from EU's preferred treatment. For details see:
http://ec.europa.eu/trade/policy/countries-and-regions/development/generalised-scheme-of-preferences/
(accessed on 3 March 2017).
9
The second and more crucial issue affecting trade in agricultural commodities is related to the
SPS measures adopted by different countries. As mentioned earlier, SPS measures are legal
and warranted under the WTO. However, often the standards imposed by developed countries,
including the EU, are higher than those imposed by developing countries such as India and it
is difficult for developing countries to meet them due to technical and resource constraints. In
such circumstances, these measures become barriers to trade. There are different national and
local bodies in each country administering these standards. It, therefore, is important to
understand the institutional and regulatory structures in India and the EU before analysing the
trends and patterns in trade.
2.1 Institutional Structure and Regulations for Ensuring Quality of Food
Products
In both India and the EU, there are multiple authorities involved in health and food safety
standards. This section presents the risk analysis system in the EU and the institutional and
regulatory structure related to food standards in India.
2.1.1 Risk Analysis in the EU
The General Food Law created a European food safety system in which responsibility for risk
assessment (science) and for risk management (policy) are kept separate. The Food Law is
based on three inter-related components of risk analysis:
a. Risk assessment, which is dealt with by the European Food Safety Authority (EFSA)
b. Risk management – The Directorate-General for Health and Food Safety (DG SANTE) is
the risk manager
c. Risk communication – Rapid Alert System for Food and Feed (RASFF) and European
Union Notification System for Plant Health Interceptions (EUROPHYT) are the tools for
risk communication
The EFSA deals with risk assessment and also has a duty to communicate its scientific findings
to the public. It is funded by the EU and operates independently of the European legislative
and executive institutions (Commission, Council, and Parliament) and EU member states.22
The risk manager, DG SANTE, is a Directorate-General of the EC. The DG SANTE is
responsible for the implementation of EU laws on the safety of food and other products, on
consumers' rights and on the protection of people's health.23
The RASFF was put in place to provide food and feed control authorities with an effective tool
to exchange information on measures taken to eliminate serious risks detected in relation to
food or feed. This exchange of information helps EU member states to act rapidly and in a co-
22 For details see https://www.efsa.europa.eu/en/aboutefsa (accessed on 13 February, 2017) 23 For details see http://ec.europa.eu/dgs/health_food-safety/about_us/who_we_are_en.htm (accessed on 13
February, 2017)
10
ordinated manner in response to a health threat caused by food or feed. Its effectiveness is
ensured by keeping its structure simple: it consists essentially of clearly identified contact
points in the EC, EFSA and European Economic Area (EEA) and at the national level in
member countries, exchanging information in a clear and structured way by means of
templates.
The RASFF has been established as a network involving the member states, the EC as member
and manager of the system and the EFSA. Whenever a member of the network has any
information relating to the existence of a serious direct or indirect risk to human health arising
from food or feed, this information is immediately notified to the Commission under the
RASFF. The Commission immediately passes on this information to members of the network
(all the nations that are involved in it within the EU).
The other system of risk communication is the EUROPHYT. It is a notification and rapid alert
system dealing with interceptions of consignments of plants and plant products (including fruits
and vegetables) imported into the EU or being traded within the EU itself for plant health
reasons. EUROPHYT has been established and is run by the Directorate General for Health
and Consumers of the EC. It provides essential support to implement preventive measures by
ensuring that data on risks to plant health from trade in plants and plant products is up-to-date
and accurate.24 EUROPHYT is a web-based network and database. It connects Plant Health
Authorities of the EU member states and Switzerland, the EFSA and the DG SANTE of the
EC. The main features of this Network are given in Box 2.1.
24 http://ec.europa.eu/food/plant/plant_health_biosecurity/europhyt/index_en.htm (accessed on 28 June, 2016)
Box 2.1: Features of the EUROPHYT Network
Notification of interceptions: Plant health authorities of the EU member states and
Switzerland enter data about interceptions they have made of non-compliant
consignments into EUROPHYT electronically, via a direct web-link.
A Rapid Alert System: EUROPHYT immediately notifies the plant health authorities of
member states and Switzerland of each interception. In the case of interceptions of
imports from non-EU countries, the plant health authority of the exporting country also
receives immediate notification in the form of an e-mail.
Database and information system: All notifications are stored in a structured database.
Members of the EUROPHYT network have full access to the data, making it possible
to analyse trends and produce statistics.
Reports: Standard weekly, monthly and annual reports are produced for different users
Source: http://ec.europa.eu/food/plant/plant_health_biosecurity/europhyt/network/index_en.htm
(accessed on 28 June, 2016)
11
The main objective of EUROPHYT is to help protect the territory of the EU from the
introduction and spread of new pests and plant diseases to reduce or eliminate the economic
and/or environmental impact of harmful organisms and reducing the need for pesticide use.
2.1.2 Institutional Structure and Regulatory Framework in India
Food safety is a shared responsibility in India as in the case of the EU. India has a quasi-federal
government structure. Like the EC, which works closely with its member states, the Indian
central government works with state governments on issues related to food safety and
standards. There is nevertheless a key difference. While the EU has uniform standards for
domestic consumption, imports and exports, in India, there are different standards and
regulatory bodies for agriculture and processed food meant for the internal market/domestic
consumption (including imports) and agriculture commodities and processed food meant for
exports. Some of the important bodies engaged in international trade and food safety
regulations include the following:
Food Safety and Standards Authority of India (FSSAI), under the Ministry of Health
and Family Welfare, regulates the domestic market and imports, but cannot regulate exports
and does not have any jurisdiction over farmers. Thus, FSSAI in India has no role in exports
or in ensuring traceability from farm to the final consumer, unlike in the EU and its member
states.
Ministry of Agriculture & Farmers Welfare is the key authority for promoting
agriculture and farmers’ welfare.
Directorate of Plant Protection, Quarantine and Storage, under the Ministry of
Agriculture & Farmers Welfare, regulates issues such as pest management, plant
quarantine, and plant protection for imports and exports. Export consignments have to
obtain a sanitary and phytosanitary certificate from the Directorate of Plant Protection,
Quarantine and Storage to ensure that the product is free of pests or insects for exports to
the EU, the authorities also confirm if the consignments have undergone the pest treatments
prescribed by the EU. At present, there are 57 laboratories (or stations) under the
Directorate of Plant Protection, Quarantine and Storage that are authorised to undertake the
inspections. Once the products are approved, the Directorate also ensures that there is no
infestation while the products are transported from their facilities to Indian ports.
Export Inspection Council (EIC) of India was set up by the Government of India under
Section 3 of the Export (Quality Control and Inspection) Act, 1963 (22 of 1963). The EIC
is a regulatory authority operating under the Department of Commerce, Ministry of
Commerce and Industry, and it is India’s official export inspection and certification body.
Its function is to ensure the development of India’s export trade through quality control and
pre-shipment inspection. The EIC is the official control agency for export of certain
agriculture produce such as fish and fishery products, animal casings, feed additives and
pre-mixture, Basmati rice, crushed bones gelatin ossein, peanuts and peanut products to the
EU. A health certificate is needed from the EIC to export products such as peanuts and
peanut products to the EU.

12
Agricultural and Processed Food Products Export Development Authority (APEDA)
was established by the Government of India under the Agricultural and Processed Food
Products Export Development Authority Act passed by Parliament in December, 1985.
APEDA is under the Department of Commerce, Ministry of Commerce and Industry. It
acts as a promotional body for Indian exports for various agricultural products such as
fruits, vegetables, dairy products, cereals, and groundnuts. When established, APEDA was
only a promotional body, not a regulatory one. Recently, due to issues faced by exporters
of various products (such as table grapes and peanuts), APEDA has been the nodal agency
to set up a traceability system known as TraceNet for various products such as grapes,
mangoes and peanuts. Under this system, processes for exports to the EU and other
countries are laid down by APEDA and products are tested in APEDA approved
laboratories to meet EU requirements.
Apart from the government bodies mentioned above, there are several different boards, some
of which have a regulatory role and some of which merely have a promotional role. These
include the Spices Board of India, which looks after the promotion, quality control and
regulation of Indian spice exports. The approval of Spice Board is needed for the export of
certain spices such as turmeric (haldi). The Tea Board of India promotes export of tea and
provides certain subsidies to tea exporters; the Marine Products Export Development Authority
(MPEDA) looks after the export promotion of marine products from India, while the Coffee
Board promotes export of coffee.
In India, exports of agriculture products have to face higher standards as compared to
domestically produced goods and imports, especially for exports to developed country markets
such as the EU and the US. The food standards for the products meant for domestic
consumption and imports are regulated by the FSSAI, which does not have any jurisdiction
over exports and farmers. Exports have to adhere to the importing country standards, and these
standards may vary depending on the importing country. Unlike the EU, which has more rigid
standards than the Codex Alimentarius, the FSSAI has pegged its standards with the Codex
Alimentarius. Across most agricultural products, in India, domestic standards are usually lower
and less rigid compared to those in countries such as the US, Japan and Canada and regions
such as the EU. More recently, a number of developing countries have imposed higher food
safety standards than India (for example, Bhutan, South Africa and Kenya) while some other
countries may have lower standards than India.
Focusing on the key differences in the implementation of food safety standards in India and
the EU, the EFSA has laid down clear guidelines for various categories of products and for
good agricultural practices to be followed at the farm level. It has established a traceability
system to the farm level. In India, the FSSAI is yet to have guidelines for some product
categories (such as organic products) and its guidelines are not applicable at the farm level.
APEDA is trying to develop the traceability system and in a number of products it has
developed the system successfully. Existing literature shows that the incidence of the use of
chemicals in Indian farming is high and few farms follow good agricultural practices which
can lead to product rejection in export markets and this is an SPS barrier.

13
The EFSA regularly conducts scientific research on approved MRLs for different chemicals,
and based on such research, the MRLs are revised. India is yet to conduct such research on a
regular basis and there are hardly any consumer nutrition surveys to understand the adverse
impact of the consumption of food with high chemical residue content.
The tracking system in the EU is highly sophisticated. The EU has various portals (such as the
RASFF and the EUROPHYT) for listing rejections of imported food products, which Indian
exporters and APEDA and other agencies can check regularly. Although various Indian
exporters check the EUROPHYT and RASFF portals at an individual level to keep track of
rejected shipments, India is yet to have such an online system of tracking imports and exports.
In India, APEDA tracks information about shipments rejected at various ports in the EU and
passes on the information to exporters. The Directorate of Plant Protection, Quarantine and
Storage follows the EUROPHYT interceptions and, in some cases, is appraised by exporters
regarding the issues raised by the EC. The WTO Centre of the Indian Institute of Foreign Trade
tracks SPS issues raised in the WTO. India is yet to develop an indigenous portal on the lines
of EUROPHYT or RASFF.
Indian exporters exporting to developed countries such as the EU and the US often have to also
adhere to private standards of global retailers and manufacturers in those countries, which are
stricter than the country standards. Although these standards are voluntary, importers want
exporters to adhere to them. In the case of India, there are hardly any private standards and the
bulk of food items are still sold through the informal or non-corporate sector in the domestic
market.
As developed countries are becoming stricter on food safety standards, several authorities
within India are now responsible for administering these standards for exports. The procedure
for export of products from India varies across different products and has been explained in
detail in Chapters 3 to 11. Overall, there are three key agencies involved in providing product
approval for exports in the selected products covered in this report. These are the EIC, APEDA
and the Directorate of Plant Protection, Quarantine and Storage. Exporters have to follow the
standards and procedures for inspection set by all these agencies in approved laboratories. The
laboratories can be approved by APEDA or EIC. The EIC has the broad mandate to inspect the
quality of exported products and ensure that they meet the importing country’s requirements.
In certain product categories like peanuts, grapes and okra, APEDA has set up a traceability
system. In the case of peanuts specifically an exporter has to register with EIC for export
control and APEDA for TraceNet while they also register with an export promotion council
under the Ministry of Commerce and Industry known as Indian Oilseeds and Produce Export
Promotion Council (IOPEPC). Thus, the exporter has to register with three agencies namely
EIC, IOPEPC and APEDA for different activities. The Directorate of Plant Protection,
Quarantine and Storage, under the Ministry of Agriculture & Farmers Welfare, regulate issues
such as pest management, plant quarantine, and plant protection for imports and exports.
Overall, despite the presence of a sound regulatory framework, Indian exporters have been
facing a number of SPS issues in key markets such as the EU. These are discussed in details in
14
the case studies. The next section provides a snapshot of bilateral trade in agricultural products
between India and the EU.
2.2 Bilateral Trade in Agricultural Products
Bilateral trade data for India and the EU for agricultural products can be obtained from various
sources. These are given below:
Eurostat Database: The EU has a database known as the Eurostat, which reports statistics
on EU’s import of agricultural products from India. However, there is an issue with this
database. In the case of agricultural commodities exported from India to the EU,
disaggregated data at the 8-digit level is not available. For example, Eurostat data for
mangoes is not available separately but in the combined category under ‘fresh or dried
guavas, mangoes and mangosteens’ [Harmonised System (HS) 08045000]. For Basmati
rice, the 8-digit category is also not clearly identifiable in this database. Since the project
requirement has been to study specific products such as mangoes and Basmati rice, this
database could not be used. It has been used for certain products such as dairy products for
which disaggregated data is available.
Directorate General of Commercial Intelligence and Statistics Database: The
Directorate General of Commercial Intelligence and Statistics (DGCI&S), Kolkata,
Ministry of Commerce and Industry, Government of India, is the primary organisation for
the collection, compilation and dissemination of India’s trade statistics. The DGCI&S also
provides the data for each product category as is desired by the client, but there is a charge
associated with it.
The Directorate General of Foreign Trade (DGFT) Database: The DGFT, which is also
under the Ministry of Commerce and Industry, sources data from the DGCI&S and the data
is made available for free access but in a prescribed format. The data is available as per the
Harmonised System of Classification, disaggregated to the 8-digit level. As per the standard
data collection norm of the Indian government, the data is collected and presented for the
financial year (April to March).25 This database has been used in the report.
APEDA Database: APEDA provides data for both production and export of agricultural
commodities. However, the data is available for broad commodities rather than their
disaggregated classifications. It is worth mentioning that there are certain discrepancies
between the data provided by DGFT and APEDA for some product categories.
Taking into account the limitations and advantages of statistics collated by the above
sources and the requirements of this study, the data for this study has primarily been taken
from the DGFT and APEDA.
According to DGFT data, India’s total trade with the EU in agricultural commodities
amounted to Indian rupee (INR) 191.28 billion in 2015-16. In the same year, India’s exports
to the EU amounted to INR 161.9 billion and imports were valued at INR 29.3 billion, over
25 Financial year in India is from 1st April to 31st March of each year.

15
five-fold less. Overall, India’s positive trade balance in the case of agricultural commodities
is large and it had been rising until 2014 (see Figure 2.1).
Figure 2.1: India’s Trade in Agricultural Commodities with the EU during 2003-04 and
2015-16 (in INR Million)
Source: Author’s compilation from the DGFT Database.
The EU’s share in India’s total export of agricultural commodities was 13.1 per cent in 2015-
16, but it has declined over the last decade from 19.9 per cent in 2005-06.26 India’s share in the
EU’s import of agricultural products was only 2.6 per cent in 2015. In the same year, India was
the 9th largest import source for the EU, after Brazil, the US, Argentina, China, Turkey,
Switzerland, Indonesia and Ukraine.27
In terms of individual commodities at the 2-digit level, the top items of export from India to
the EU in 2015-16 were coffee, tea, mate and spices, edible fruits and nuts, cereals, animal or
vegetable fats and oils and oil seeds, among others. The top items of imports from the EU
include animal or vegetable fats and oils and their cleavage products; preparations of edible
fats; animal or vegetable waxes and edible vegetables and certain roots and tubers. While
overall India has a positive trade balance, in the case of certain product categories such as dairy
products and cocoa and cocoa preparations, India has a negative trade balance (see Table 2.1).
26 Calculated from the data provided by the DGFT 27 For details see https://ec.europa.eu/agriculture/sites/agriculture/files/trade-analysis/statistics/outside-
eu/countries/agrifood-india_en.pdf (accessed on 29 November, 2016)

16
Table 2.1: India’s Trade with the EU in Selected Agricultural Commodities in 2015-16
(in INR Million)
HS
Code
Commodity Exports Imports Total
Trade
4 Dairy produce; birds' eggs; natural honey; edible prod.
of animal origin, not elsewhere spec. or included
1013.8 1981.0 2994.8
7 Edible vegetables and certain roots and tubers 10078.8 5281.1 15359.8
8 Edible fruit and nuts; peel or citrus fruit or melons 25671.3 1957.8 27629.0
9 Coffee, tea, mate and spices 47689.6 1125.3 48814.9
10 Cereals 21692.4 843.4 22535.8
11 Products of the milling industry; malt; starches;
insulin; wheat gluten
846.3 842.5 1688.8
12 Oil seeds and olea, fruits; misc. grains, seeds and fruit;
industrial or medicinal plants; straw and fodder
14554.5 1758.5 16313.1
15 Animal or vegetable fats and oils and their cleavage
products; pre. edible fats; animal or vegetable waxes
16454.5 7490.0 23944.5
17 Sugars and sugar confectionery 4613.3 2573.7 7186.9
18 Cocoa and cocoa preparations 918.3 2037.3 2955.6
19 Preparations of cereals, flour, starch or milk; pastry
cook products
2685.9 1032.9 3718.8
20 Preparations of vegetables, fruit, nuts or other parts of
plants
10375.0 1003.2 11378.2
21 Miscellaneous edible preparations 5338.4 1427.3 6765.8
Total 161932.1 29354 191286.1
Source: Author’s compilation from the DGFT Database.
Within agricultural commodities, the top ten items of export to the EU and the top ten items
imported from the EU are presented in Table 2.2 and Table 2.3.
Table 2.2: India’s Top Ten Items of Agricultural Export to the EU in 2015-16 (in INR
Million)
Rank HSCode Commodity Exports (in INR Ml.)
1 10063020 Basmati rice 19299.6
2 15153090 Castor oil and its fractions other than edible grade 12469.3
3 08013220 Cashew kernel, whole 10356.8
4 08061000 Grapes fresh 9077.5
5 09011149 Coffee rob cherry other grade 6742.0
6 09024020 Tea black, leaf in bulk 6239.9
7 09011141 Coffee rob cherry 6074.7
8 12074090 Other sesamum seeds w/n broken 6039.1
9 07122000 Onions dried 3911.2
10 12119032 Psyllium husk (Isobgul husk) 3822.1
Total Agricultural Export 161932.1
Share of Top Ten products in Total Agriculture Export 51.9
Source: Compiled by authors from DGFT database.
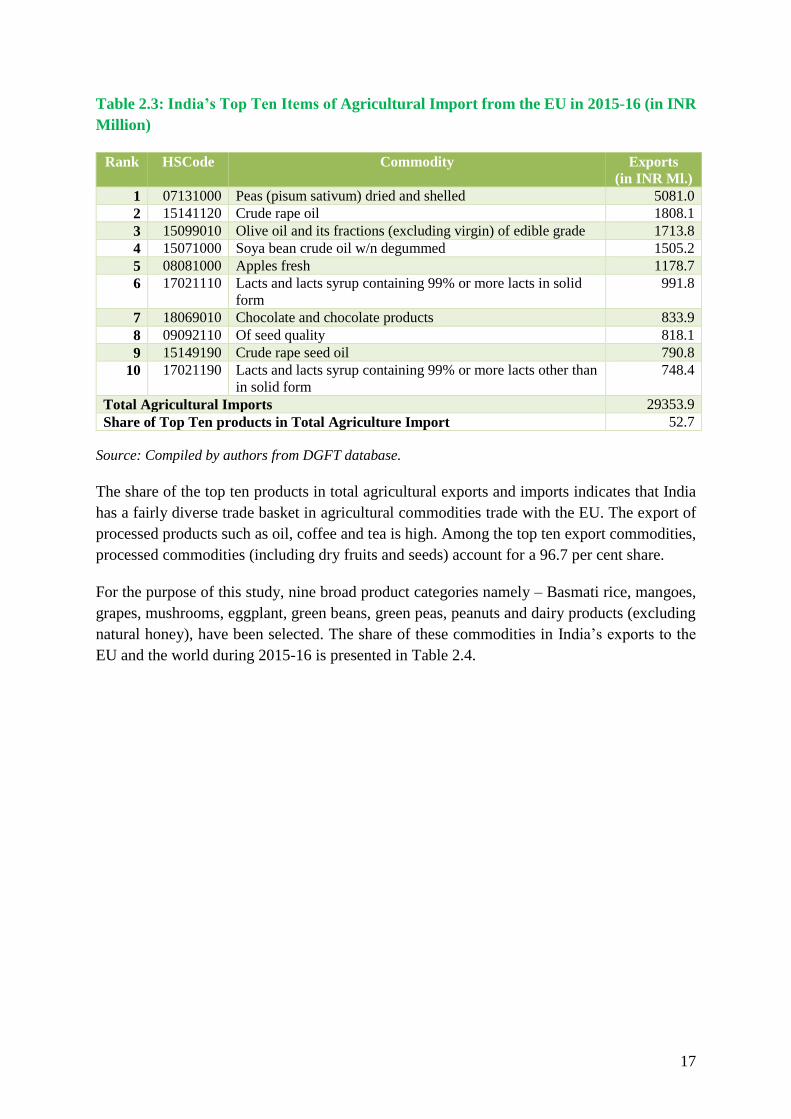
17
Table 2.3: India’s Top Ten Items of Agricultural Import from the EU in 2015-16 (in INR
Million)
Rank HSCode Commodity Exports
(in INR Ml.)
1 07131000 Peas (pisum sativum) dried and shelled 5081.0
2 15141120 Crude rape oil 1808.1
3 15099010 Olive oil and its fractions (excluding virgin) of edible grade 1713.8
4 15071000 Soya bean crude oil w/n degummed 1505.2
5 08081000 Apples fresh 1178.7
6 17021110 Lacts and lacts syrup containing 99% or more lacts in solid
form
991.8
7 18069010 Chocolate and chocolate products 833.9
8 09092110 Of seed quality 818.1
9 15149190 Crude rape seed oil 790.8
10 17021190 Lacts and lacts syrup containing 99% or more lacts other than
in solid form
748.4
Total Agricultural Imports 29353.9
Share of Top Ten products in Total Agriculture Import 52.7
Source: Compiled by authors from DGFT database.
The share of the top ten products in total agricultural exports and imports indicates that India
has a fairly diverse trade basket in agricultural commodities trade with the EU. The export of
processed products such as oil, coffee and tea is high. Among the top ten export commodities,
processed commodities (including dry fruits and seeds) account for a 96.7 per cent share.
For the purpose of this study, nine broad product categories namely – Basmati rice, mangoes,
grapes, mushrooms, eggplant, green beans, green peas, peanuts and dairy products (excluding
natural honey), have been selected. The share of these commodities in India’s exports to the
EU and the world during 2015-16 is presented in Table 2.4.

18
Table 2.4: Export of Selected Commodities to the EU and the World in 2015-16 (in INR million)
Commodity and Code Exports to EU World Export EU’s Share
1. Dairy Excluding Natural Honey, which is HS 0409
HS 04 Dairy produce; birds' eggs; natural honey; edible products of animal origin, not
elsewhere specified or included
1002.8 14393.8 7.0
2. Mangoes fresh and processed
HS 08045020 Mangoes fresh 338.8 3206.3 10.6
HS 08045030 Mangoes sliced dried 314.4 449.4 70.0
HS 08045040 Mango pulp 1728.5 7961.8 21.7
HS 08129010 Mango slices in brine 5.3 12.7 42.0
HS 11063030 Flour of mango 5.8 17.4 33.3
HS 12079920 Mango kernel w/n broken 0 0
HS 20079910 Jams, jellies, marmalade, etc., of mango 3329.3 7429.0 44.8
HS 20089911 Mango squash 233.5 610.1 38.3
HS 20098910 Mango juice 9.8 55.9 17.7
3. Grapes fresh and processed excluding wine (HS 22042190, 22042990, 22059000) and must (HS 20096100, 22043000)
HS 08061000 Grapes fresh 9077.4 13622.5 66.6
HS 08062090 Sultanas and other dried grapes 7.3 102.4 7.2
HS 20092900 Other grape fruit juice value>20 0 0.2
4. Peas fresh, processed and preserved
HS 07081000 Peas shelled or unshelled, fresh or chilled 23.4 53.9 43.4
HS 07102100 Peas shelled or unshelled, frozen 0.4 176.1 0.3
HS 07131000 Peas (pisum sativum) dried and shelled 0 243.2 0

19
Commodity and Code Exports to EU World Export EU’s Share
HS 20054000 Peas (pisom sativum) prepared/preserved, not frozen 0 1.7 0.0
5. Green bean
HS 07082000 Beans shelled or unshelled, fresh or chilled 12.4 16.3 76.5
HS 07102200 Beans shelled or unshelled, frozen 18.3 64.3 28.5
HS 07133100 Beans of the spp vigna mungo, hepper or vigna radiata, wilczek dried and
shelled
79.8 732.4 10.9
6. Basmati Rice
HS 10063020 Basmati rice 19299.5 227185.9 8.5
7. Peanut
HS 120241 Ground-nut, not roasted or otherwise cooked, whether or not shelled or
broken-in shell
6.7 1105.0 0.6
HS 120242 Ground-nut, not roasted or otherwise cooked, whether or not shelled or
broken-in, shelled whether or not broken
71.2 38673.5 0.2
8. Eggplant
HS 07093000 Aubergines (egg plants) fresh or chilled 0.01 0.9 0.8
9. Mushroom
HS 07095100 Mushrooms, fresh or chilled 0.1 0.3 43.5
HS 07115100 Mushrooms of genus agaricus provisionally preserved 0 21.8 0
HS 07123100 Mushrooms of genus agarigvs, dried, whole, cut, sliced, broken 190.4 247.8 76.8
HS 20031000 Mushrooms, prepared/preserved 392.9 699.6 56.2
HS 20039090 Other mushrooms and truffles 0 0.7 0.0
Source: Compiled by authors from the DGFT database.

20
2.3 Assessment of SPS Provisions in Trade Agreements: The Case of the EU and
India 28
With the proliferation of regional and bilateral trade agreements, trading partners to bilateral
free trade agreements (FTAs) often attempt to resolve specific SPS issues affecting market
access in their agreements. While developed countries such as the EU and the US tend to ensure
regulatory synergies and compliance through their trade agreements, India’s approach so far
has been to reiterate the WTO SPS Agreement. The next section discusses how the EU
addresses the SPS issues under its trade agreements while the following section examines how
India addresses the SPS measures in its trade agreements. The chapter concludes by examining
if an EU-India bilateral trade agreement can help to address the SPS barriers faced by Indian
exporters in the EU.
2.3.1 Can SPS Barriers be Addressed through FTAs: EU’s Approach
The EU’s approach in its FTAs has been to carve out a larger policy space for social and
precautionary aspects, as opposed to pure science-based risk assessment emphasised under the
WTO. An assessment done by the London School of Economics and Political Science notes
that this approach of the EU can be said to favour an “SPS-minus” approach, “in the sense that
it wants an interpretation of precaution that allows for social as well as science-based risk
assessment” (Heydon and Woolcock, 2009: pp. 7).
There are certain variations in EU’s SPS chapters in trade agreements. The SPS Chapters in
EU’s FTAs with Korea and CARIFORUM (subgroup of the African, Caribbean and Pacific
Group of States) are brief and fairly simple and do not have additional obligations beyond the
WTO SPS Agreement. The three key EU FTAs where product-specific issues relating to
equivalence, certification, etc., have been addressed, are the EU-Chile FTA, EU-Canada
Comprehensive Economic and Trade Agreement (CETA) and the Transatlantic Trade and
Investment Partnership (TTIP) with the US (this agreement is yet to be signed and the proposed
text is referred to in the discussions). Of these, the EU-Chile FTA is the only one in force. The
EU-Canada CETA is yet to be ratified by the EU, and some product-specific annexes have not
yet been fully agreed on. The TTIP negotiations are still in progress and hence, product-specific
annexes are not available. Table 2.5 presents a comparative analysis of these agreements.
Overall, it appears that the EU-Canada approach is the most ambitious, which could be because
of the similarity in regulations in the two countries.
It is clear from the assessment of the EU FTAs that when negotiating SPS chapters in any
bilateral or plurilateral negotiation, it is important to focus on product-specific issues. In case
any SPS measures are raised, the disease specific concerns that relate to those measures are to
be reflected in the form of an Annexure or an Appendix.
28 This section has been prepared by R.V. Anuradha, Partner, and Ronjini Ray, Associate at Clarus Law
Associates
21
The underlying concept of “equivalence”, however, is fundamentally premised on similarity in
regulations in both the importing and exporting countries. This is more possible and likely
when both countries are at the same level of development and have similar regulatory systems.
This is reflected, for instance, in the EU-Canada CETA, where each country has recognised
specific laws and regulations of the other as equivalent to its own. On the other hand, the EU-
Chile FTA, which was signed in 2002, is yet to show any significant potential for resolving
issues of recognition and equivalence. In fact, as noted in Table 2.5, while the FTA provides
the blueprint for definitive criteria and timelines for assessment, it has in fact resulted in
equivalence for only molluscs under fishery products.
The other interesting contrast between the EU-Canada CETA and EU-Chile FTAs is that while
the former provides for definitive approval of establishments that would be certified for exports
into the EU, the Chile FTA only provides for provisional approval, which is in the nature of a
temporary approval process.
One of the main problems that exporters into the EU often face is the MRLs permitted in food
and animal feedstuff after the application of approved pesticides. Internationally, the Codex
Alimentarius Commission develops and maintains international standards for MRLs, but levels
for many substances are still to be developed and agreed upon in international standard setting
bodies such as the Codex Alimentarius (for example, the standards for ethnic sweets using milk
as an ingredient). The SPS Agreement encourages countries to base their MRLs on those that
the Codex Alimentarius Commission has set. Nevertheless, it is not uncommon for countries,
in particular the EU, to set its own, stricter MRLs. When a government establishes MRLs that
is more stringent than the relevant Codex Alimentarius standard, the government must do so
consistently with Article 3 of the SPS Agreement, which calls for the government to provide
either a scientific justification for that stricter standard or apply the standard in accordance with
Article 5 of the SPS Agreement. While questions are often raised with regard to EU MRLs, no
FTA that the EU has entered into so far addresses this aspect.
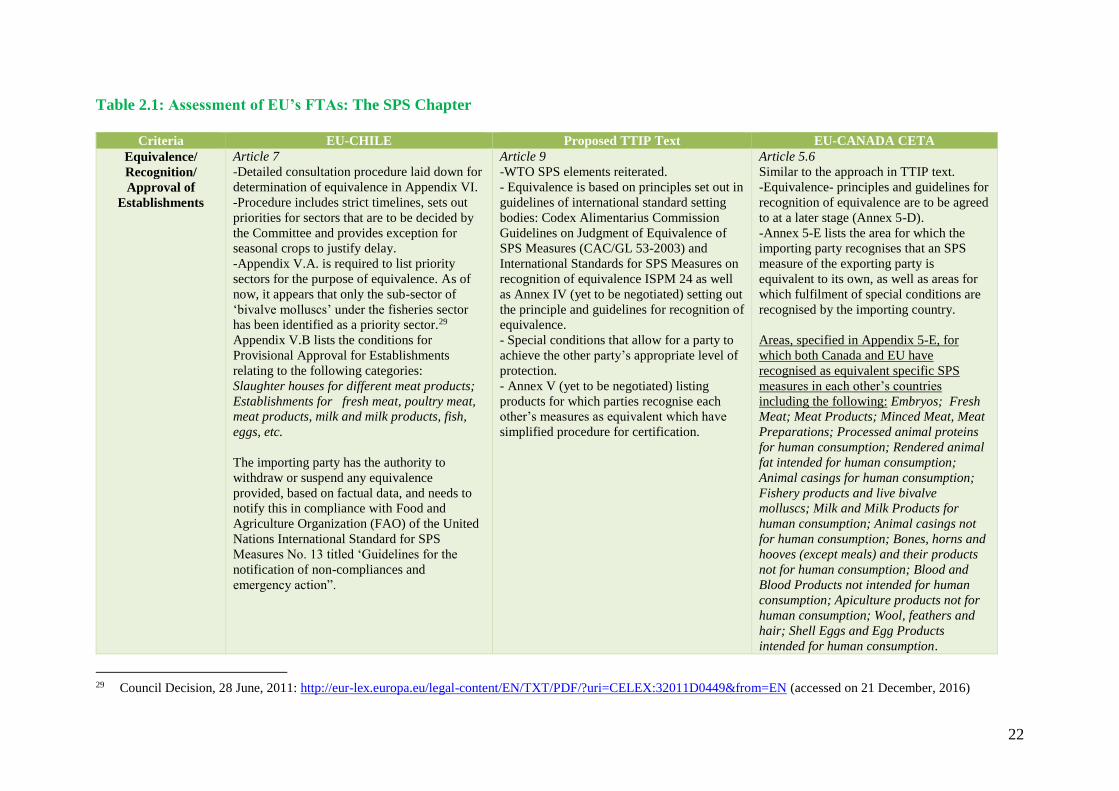
22
Table 2.1: Assessment of EU’s FTAs: The SPS Chapter
Criteria EU-CHILE Proposed TTIP Text EU-CANADA CETA
Equivalence/
Recognition/
Approval of
Establishments
Article 7
-Detailed consultation procedure laid down for
determination of equivalence in Appendix VI.
-Procedure includes strict timelines, sets out
priorities for sectors that are to be decided by
the Committee and provides exception for
seasonal crops to justify delay.
-Appendix V.A. is required to list priority
sectors for the purpose of equivalence. As of
now, it appears that only the sub-sector of
‘bivalve molluscs’ under the fisheries sector
has been identified as a priority sector.29
Appendix V.B lists the conditions for
Provisional Approval for Establishments
relating to the following categories:
Slaughter houses for different meat products;
Establishments for fresh meat, poultry meat,
meat products, milk and milk products, fish,
eggs, etc.
The importing party has the authority to
withdraw or suspend any equivalence
provided, based on factual data, and needs to
notify this in compliance with Food and
Agriculture Organization (FAO) of the United
Nations International Standard for SPS
Measures No. 13 titled ‘Guidelines for the
notification of non-compliances and
emergency action”.
Article 9
-WTO SPS elements reiterated.
- Equivalence is based on principles set out in
guidelines of international standard setting
bodies: Codex Alimentarius Commission
Guidelines on Judgment of Equivalence of
SPS Measures (CAC/GL 53-2003) and
International Standards for SPS Measures on
recognition of equivalence ISPM 24 as well
as Annex IV (yet to be negotiated) setting out
the principle and guidelines for recognition of
equivalence.
- Special conditions that allow for a party to
achieve the other party’s appropriate level of
protection.
- Annex V (yet to be negotiated) listing
products for which parties recognise each
other’s measures as equivalent which have
simplified procedure for certification.
Article 5.6
Similar to the approach in TTIP text.
-Equivalence- principles and guidelines for
recognition of equivalence are to be agreed
to at a later stage (Annex 5-D).
-Annex 5-E lists the area for which the
importing party recognises that an SPS
measure of the exporting party is
equivalent to its own, as well as areas for
which fulfilment of special conditions are
recognised by the importing country.
Areas, specified in Appendix 5-E, for
which both Canada and EU have
recognised as equivalent specific SPS
measures in each other’s countries
including the following: Embryos; Fresh
Meat; Meat Products; Minced Meat, Meat
Preparations; Processed animal proteins
for human consumption; Rendered animal
fat intended for human consumption;
Animal casings for human consumption;
Fishery products and live bivalve
molluscs; Milk and Milk Products for
human consumption; Animal casings not
for human consumption; Bones, horns and
hooves (except meals) and their products
not for human consumption; Blood and
Blood Products not intended for human
consumption; Apiculture products not for
human consumption; Wool, feathers and
hair; Shell Eggs and Egg Products
intended for human consumption.
29 Council Decision, 28 June, 2011: http://eur-lex.europa.eu/legal-content/EN/TXT/PDF/?uri=CELEX:32011D0449&from=EN (accessed on 21 December, 2016)

23
Criteria EU-CHILE Proposed TTIP Text EU-CANADA CETA
There is a provision relating to approval of
establishments by the importing country,
the criteria for which is specified in
Appendix 5F.
Regionalisation/
Compartmentalizati
on
Article 6
Procedure for decisions on regionalisation is
laid out in Appendix IV. A and B for
animal/fish diseases listed in Appendix III.A30
and for pests listed in Appendix III.B.31
Animal Diseases
-Granting of special status is based on
Appendix IV.C which lays down criteria for
such status.
- Importing party can seek guarantees for
specific diseases not listed in Appendix III.A
in accordance with the recommendations of
standard setting organisations.
-Specific timelines for technical consultation
on zoning determinations. .
Pests
- Parties seeking regionalisation on pest status
require explanation and supporting data in
Article 10
Animal, Animal Products/By-products
- Health status of zones in each party with
respect to specific diseases is listed out in
Annex II and criteria for recognising zoning
is laid out in Annex III.
- Full explanation/data and technical
consultations may be requested by the
importing party regarding determinations of
zoning of the exporting party.
- Special status can be granted to diseases not
listed in Annex II based on OIE Terrestrial
Code.
- Importing party can seek guarantees only
for diseases listed in Annex IV.
- Specific timelines for technical consultation
on zoning determination.
Plants and plant products
Article 5.5
-Similar to the proposed TTIP Text; level
of detailing differs.
Animal, Animal Products/By-products
- Importing party cannot request
technical consultations/data with regard to
determination of regionalisation but may
adopt an additional measure to achieve its
appropriate level of protection.
- No specific timelines for technical
consultation on determining zoning.
- Granting of special status is not
based on OIE Terrestrial Code but based
on Annex 5-E
Plants and plant products
- Recognition of pest-free areas is
not based on FAO/IPPC international
standards but as per guidelines in Annex 5-
C (which is yet to be agreed).
30 Appendix III.A: Foot-and-mouth disease; Swine vesicular disease; Vesicular stomatitis; African horse sickness; African swine fever; Bluetongue; Highly pathogenic
Avian influenza; Newcastle disease (NCD); Peste des petits ruminants; Rinderpest; Classical swine fever; Contagious bovine pleuro-pneumonia; Sheep and goat pox;
Rift Valley fever; Lumpy skin disease; Venezuelan equine encephalomyelitis; Glanders; Dourine; Enterovirus encephalomyelitis; Infectious haematopoietic necrosis
(IHN); Viral haemorrhagic septicaemia (VHS); Infectious Salmon Anaemia (ISA); Bonamia ostreae; Morteilla refringens 31 Appendix III.B: As regards the situation in Chile: (1) Pests not known to occur in any part of Chile; (2) Pests known to occur in Chile and under official control; (3) Pest
known to occur in Chile, under official control and for which pest free areas are established. As regards the situation in the European Community: (1) Pests not known to
occur in any part of the Community and relevant for the entire Community, or for part of it. (2) Pests known to occur in the Community and relevant for the entire
Community. (3) Pests known to occur in the Community and for which pest free areas are established.

24
Criteria EU-CHILE Proposed TTIP Text EU-CANADA CETA
accordance with FAO International Standards
for Phytosanitary Measures No. 4 & 8
- Timelines for consultations relating to
decisions on pest-free areas.
- Recognition of concept of pest-free areas in
accordance with FAO/IPPC international
standards
- Timelines for consultations relating to
decisions on pest-free areas.
- No timelines for consultations
relating to decisions on pest-free areas.
Import
Requirements/
Verification/
Certification
Article 10 (Verification); Article 11 (Import
(checks and inspection fees)
- Specific commodities, listed in Appendix I.A
and I.B, are not subject to import
authorisations. (Article 8.4)
- Appendix VII specifies guidelines for
carrying out verification.
- Laboratory tests for products listed in
Appendix I.A at the request of the party and
participation in periodical inter-comparative
tests
- Parties may also share results of verifications
with third countries
- Appendix VIII.A and VIII.B set out
principles of import checks and its frequency
rates respectively.
- Parties may reciprocally reduce such
frequencies.
- Fees shall not be higher than the actual cost
of service and should be equal to fee for
inspection of similar domestic products.
- Appendix VI laying down procedure for
equivalence specifies a “Residue plan” when
determining equivalence.
Article 11 (Audit & Verification); Article 13
(Import Checks)
- Audits and verification shall be
proportionate to the risks identified and shall
be subject to technical consultations if
requested by a party.
- Audits and verifications must also be in
accordance with Annex VII and
internationally agreed guidelines including
Codex Alimentarius Commission Guidelines
on inspection and certification systems
(CAC/GL 26-1997) and International
Standards for SPS Measures on import
regulatory system ISPM 20.
- Annex IX setting out principles of import
checks, fees, and frequency rates.
- Inform exporting party in case of rejection
with detailed information including
laboratory results
- Fees shall not be higher than the actual cost
of service
- Provision on interception of pests,
inspection only in exceptional cases, and in
case of non-compliance of consignment
requirement of notification of such non-
compliance and opportunity to contribute to
relevant information.
-No mention of MRL
Article 5.8 (Audit & Verification); Article
5.10 (Import Checks)
- EU-Canada is not as elaborate as
TTIP proposed text.
Differences from TTIP:
- Audits and Verification procedure: No
specific reference to internationally agreed
guidelines.
-Import checks do not have provisions for
interception of pests; inspection only in
exceptional cases; in case of non-
compliance of consignment, requirement
of notification of such non-compliance and
opportunity to contribute to relevant
information, and requirement to provide
laboratory results in case of rejection.
- No mention of MRL
Institutional
Mechanisms
Article 16
- Not as extensive as EU-Canada FTA
or TTIP proposed text
Article 18
Joint Management Committee for discussion
of various SPS aspects including resolving
Article 5.14
- Same as Proposed TTIP Text;
except the following:
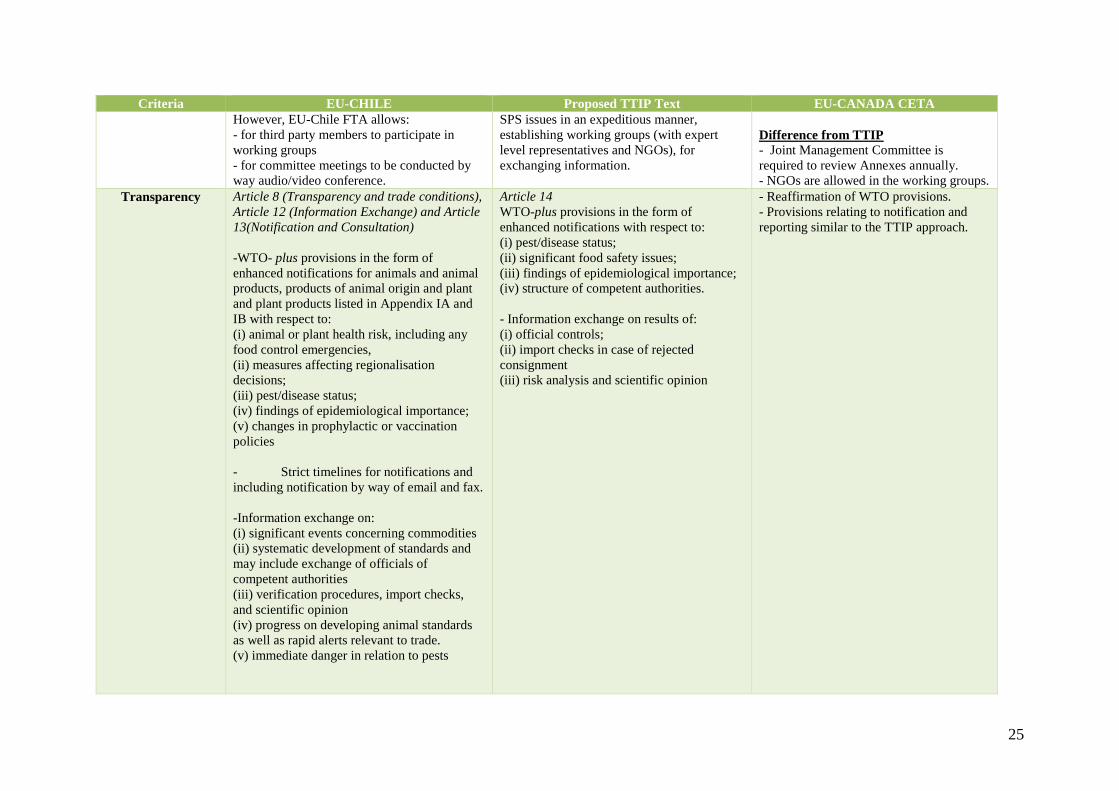
25
Criteria EU-CHILE Proposed TTIP Text EU-CANADA CETA
However, EU-Chile FTA allows:
- for third party members to participate in
working groups
- for committee meetings to be conducted by
way audio/video conference.
SPS issues in an expeditious manner,
establishing working groups (with expert
level representatives and NGOs), for
exchanging information.
Difference from TTIP
- Joint Management Committee is
required to review Annexes annually.
- NGOs are allowed in the working groups.
Transparency Article 8 (Transparency and trade conditions),
Article 12 (Information Exchange) and Article
13(Notification and Consultation)
-WTO- plus provisions in the form of
enhanced notifications for animals and animal
products, products of animal origin and plant
and plant products listed in Appendix IA and
IB with respect to:
(i) animal or plant health risk, including any
food control emergencies,
(ii) measures affecting regionalisation
decisions;
(iii) pest/disease status;
(iv) findings of epidemiological importance;
(v) changes in prophylactic or vaccination
policies
- Strict timelines for notifications and
including notification by way of email and fax.
-Information exchange on:
(i) significant events concerning commodities
(ii) systematic development of standards and
may include exchange of officials of
competent authorities
(iii) verification procedures, import checks,
and scientific opinion
(iv) progress on developing animal standards
as well as rapid alerts relevant to trade.
(v) immediate danger in relation to pests
Article 14
WTO-plus provisions in the form of
enhanced notifications with respect to:
(i) pest/disease status;
(ii) significant food safety issues;
(iii) findings of epidemiological importance;
(iv) structure of competent authorities.
- Information exchange on results of:
(i) official controls;
(ii) import checks in case of rejected
consignment
(iii) risk analysis and scientific opinion
- Reaffirmation of WTO provisions.
- Provisions relating to notification and
reporting similar to the TTIP approach.

26
Criteria EU-CHILE Proposed TTIP Text EU-CANADA CETA
Other/Assistance WTO-plus co-operation requirement since the
SPS Agreement only requires co-operation on
the development of guidelines for the
implementation of risk analysis.
The EU-Chile FTA requires the following:
- Co-operation between the ‘auditor’ and the
‘auditee’ in accordance with the provisions set
out in this Appendix VII on verifications
- Co-operation on agriculture and rural sectors
and SPS measures focused on capacity
building, mutual exchange of information,
technical assistance and enhancing quality
agricultural products, etc. (Article 24 under
Part III on Economic Cooperation in the
Association Agreement)
- Extremely specific co-operation
requirements in relation to implementation of
electronic certification procedures in
accordance with Annex VIII. (Article 12)
- Parties shall co-operate to ensure
efficient management of available
resources. (Article 5.7)
Source: Compiled by authors from the EU-Chile FTA accessible at http://eur-lex.europa.eu/resource.html?uri=cellar:f83a503c-fa20-4b3a-9535-
f1074175eaf0.0004.02/DOC_2&format=PDF; EU-Canada Comprehensive Economic and Trade Agreement (CETA) accessible at
http://trade.ec.europa.eu/doclib/docs/2014/september/tradoc_152806.pdf; and the Provisional Transatlantic Trade and Investment Partnership (TTIP) for
details see http://trade.ec.europa.eu/doclib/press/index.cfm?id=1230; (accessed on 20 December, 2016).

27
2.3.2 India’s Approach with regard to SPS in FTAs
India’s approach in its comprehensive agreements with Korea, Japan and Malaysia has been to
reiterate the WTO SPS Agreement. The most significant WTO-plus approach is reflected in
the India-Singapore Comprehensive Economic Co-operation Agreement (CECA), which has a
specific chapter titled “Standards and Technical Regulations, Sanitary and Phytosanitary
Measures”. As the title suggests, this presents a combined approach to both SPS measures and
technical barriers to trade.
The key WTO-plus elements in the India-Singapore CECA are as follows:
Exchange of information requirements where considerations of health, safety or
environmental protection warrant more urgent action with strict timelines whereas the
WTO SPS Agreement only has a general obligation of notification of SPS measures.
Article 5.7 specifies the procedure for determining and implementing equivalence set out
in the respective Sectoral Annex and specifies that such an Annex will provide:
(a) the procedures for determining and implementing the equivalence of each party’s
mandatory requirements;
(b) the procedures for accepting the results of the conformity assessment and approval
procedures; and
(c) the regulatory authorities designated by each party.
Annex 5-B on food products has relevance for SPS measures. The annex includes Appendix
1 on egg products including pasteurised egg powder of whole egg, egg yolk and egg
albumen, which identifies regional authorities and their roles as well as conformity
assessment authorities and their procedure/arrangement. It also includes a similar Appendix
for milk powder, casein, whey protein concentrate, natural and processed cheese.
Establishment of a joint committee on mutual recognition, whose functions include
resolving questions, disputes and disagreement over registration, and establishing
modalities on information exchange.
Thus, the India-Singapore CECA provides for the development of sector-specific annexes in
which the countries would need to specify equivalence based on agreement between the parties.
However, no such annexes have so far been developed.
2.4 The Way Forward
Overall, an analysis of different trade agreements and domestic policies shows that the SPS
requirements in developed economies such as the EU may be rigid but trade agreements
provide a platform to address and resolve product specific issues. A significant challenge that
a country such as India is likely to face is regulatory equivalence with the EU at an overall
level. What may instead make sense is to negotiate specific compliance requirements for
exports to the EU. At present India does not have any mutual recognition agreement (MRA)

28
with the EU but the EU has recognised product specific compliance by EIC for specific food
products. However, in the absence of an MRA, the EU reserves the right to not acknowledge
the inspection and the testing procedures. For example, recently, the EC decided to test up to
50 per cent of India’s shrimp consignments for residues such as chloramphenicol and
nitrofurans, which was earlier 10 per cent.32 According to the EC, this decision has been taken
as the analytical tests undertaken by official control laboratories showed that the level of
compliance of aquaculture products from India for human consumption as regards the presence
of certain residues is unsatisfactory. If the two nations had an MRA such issues may not arise.
Since January 1, 2017, the EU has implemented the Registered Exporter System (REX) where
the exporter with a REX number will be able to self-certify the ‘Statement of Origin’ of their
goods being exported to the EU under the GSP scheme. This will help Indian exporters for
products covered under the GSP scheme since this system is without any fee or charges.
Specifically, under a bilateral agreement the EU may be requested to have a Registered
Exporter System for its partner country, applicable to all food products and not only for GSP
products. While both India and EU are taking measures, recognition of compliance
requirements in a bilateral trade agreement such as the EU-India Bilateral Trade and Investment
Agreement (BTIA) is likely to provide greater certainty for Indian exporters of agricultural
products to the EU.
One of the areas in which the EU is likely to show reluctance is the emphasis on international
standards and scientific justification for deviation from international standards. In this regard,
it will be important for India to address product specific issues where it may need further clarity
or explanation for EU’s standards. Further, to challenge the EU, India will need to collect more
data on MRLs for products in other developed countries. This is discussed in the case studies
in the following chapters.
With regard to MRLs, close monitoring of EU regulations is required. While it may not be
possible to successfully address SPS issues in a bilateral trade agreement, what the trade
agreement can do is to put in place a system for information exchange and sharing of
experiences on any specific SPS export barriers that a country may face. Further, such
agreements can provide for a mechanism to speedily address problems of detention of food
exports which again can lead to spoilage and contamination, especially in case of perishable
exports, since these can lead to loss of revenue for both exporters and importers as discussed
in the case studies.
Since, it is unlikely that India and EU may sign a trade agreement in the short run, India may
push for product specific equivalence agreement with the EC. The WTO’s SPS Agreement
encourage member countries to recognise each other’s conformity assessment systems based
on international standards so that products certified in one country are accepted without the
need for further inspection/testing by other countries through equivalence or MRA. Codex
32 COMMISSION IMPLEMENTING DECISION (EU) 2016/1774 of 4 October 2016. Available at
http://eur-lex.europa.eu/legal-content/EN/TXT/PDF/?uri=CELEX:32016D1774&from=EN (accessed on 11
April, 2017)
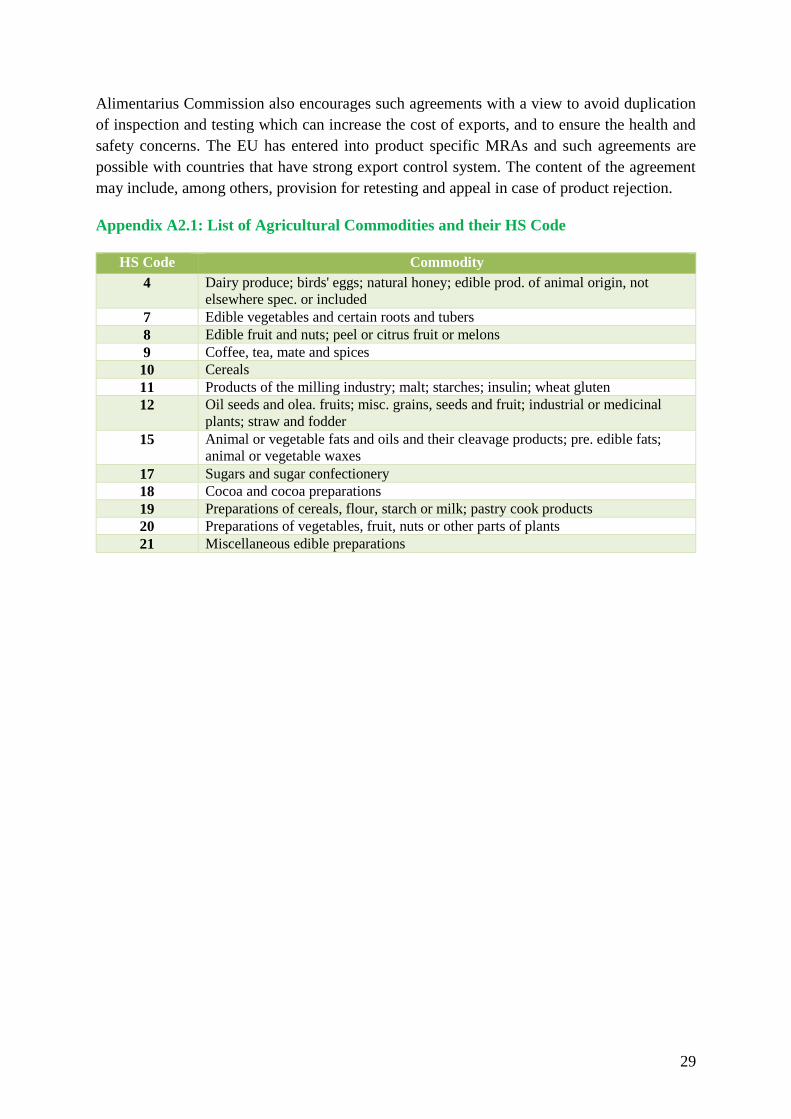
29
Alimentarius Commission also encourages such agreements with a view to avoid duplication
of inspection and testing which can increase the cost of exports, and to ensure the health and
safety concerns. The EU has entered into product specific MRAs and such agreements are
possible with countries that have strong export control system. The content of the agreement
may include, among others, provision for retesting and appeal in case of product rejection.
Appendix A2.1: List of Agricultural Commodities and their HS Code
HS Code Commodity
4 Dairy produce; birds' eggs; natural honey; edible prod. of animal origin, not
elsewhere spec. or included
7 Edible vegetables and certain roots and tubers
8 Edible fruit and nuts; peel or citrus fruit or melons
9 Coffee, tea, mate and spices
10 Cereals
11 Products of the milling industry; malt; starches; insulin; wheat gluten
12 Oil seeds and olea. fruits; misc. grains, seeds and fruit; industrial or medicinal
plants; straw and fodder
15 Animal or vegetable fats and oils and their cleavage products; pre. edible fats;
animal or vegetable waxes
17 Sugars and sugar confectionery
18 Cocoa and cocoa preparations
19 Preparations of cereals, flour, starch or milk; pastry cook products
20 Preparations of vegetables, fruit, nuts or other parts of plants
21 Miscellaneous edible preparations

30
Chapter 3: The Case of Fresh Mango and Mango Pulp Exports to the EU
India is one of the largest producers of fresh mangoes and mango pulp. The country is known
to have some unique commercially grown varieties of the fruit, including varieties such as
Alphonso and Kesar, which have a large export market. However, over the last few years,
exports of fresh mangoes from India have faced rejections in the EU market and a subsequent
ban on entry due to the presence of fruit flies. APEDA worked with exporters and state
government agencies such as the Maharashtra State Agriculture Marketing Board to put a
strong corrective mechanism in place and the EU has now lifted the ban on imports of fresh
mangoes from India. Mango pulp is also a key export item from India to the EU.
This case study covers both fresh mango exports and exports of mango pulp and focuses on the
experiences of the exporters and the issues that they face. This study is based on a primary
survey of 50 respondents including farmers, processers, exporters, Maharashtra State
Agriculture Marketing Board (MSAMB), APEDA, Directorate of Plant Protection, Quarantine
& Storage, Department of Agriculture and state government officials. The interviews were
conducted in Delhi, Mumbai, Pune and Ahmedabad.
The images depict Alphonso mangoes (left) and Kesar mangoes (right).
3.1 Overview of Fresh Mango and Mango Pulp Production in India
In India, mango is one of the most important commercially grown fruit crops. Indian mangoes
come in various shapes, sizes and colours with a wide variety of flavours, aroma and taste.
India is home to about 1,000 varieties of mangoes. However, only a few varieties are
commercially cultivated throughout India. Some of the commercially grown varieties of
mangoes include Chausa, Totapuri, Alphonso, Kesar, Neelum, Dashehari and Langra. Certain
states grow certain specific varieties of mangoes; these are given in Table 3.1. Of these
varieties, Alphonso, Kesar and Totapuri varieties are widely exported.
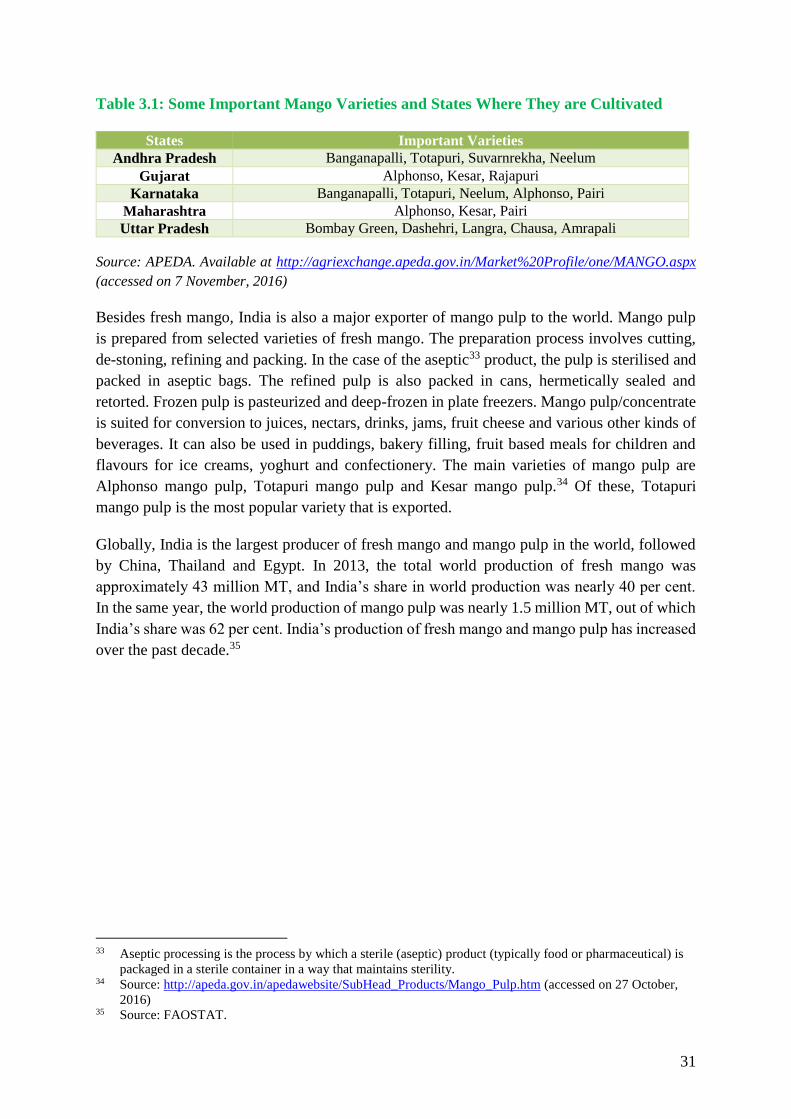
31
Table 3.1: Some Important Mango Varieties and States Where They are Cultivated
States Important Varieties Andhra Pradesh Banganapalli, Totapuri, Suvarnrekha, Neelum
Gujarat Alphonso, Kesar, Rajapuri Karnataka Banganapalli, Totapuri, Neelum, Alphonso, Pairi
Maharashtra Alphonso, Kesar, Pairi Uttar Pradesh Bombay Green, Dashehri, Langra, Chausa, Amrapali
Source: APEDA. Available at http://agriexchange.apeda.gov.in/Market%20Profile/one/MANGO.aspx
(accessed on 7 November, 2016)
Besides fresh mango, India is also a major exporter of mango pulp to the world. Mango pulp
is prepared from selected varieties of fresh mango. The preparation process involves cutting,
de-stoning, refining and packing. In the case of the aseptic33 product, the pulp is sterilised and
packed in aseptic bags. The refined pulp is also packed in cans, hermetically sealed and
retorted. Frozen pulp is pasteurized and deep-frozen in plate freezers. Mango pulp/concentrate
is suited for conversion to juices, nectars, drinks, jams, fruit cheese and various other kinds of
beverages. It can also be used in puddings, bakery filling, fruit based meals for children and
flavours for ice creams, yoghurt and confectionery. The main varieties of mango pulp are
Alphonso mango pulp, Totapuri mango pulp and Kesar mango pulp.34 Of these, Totapuri
mango pulp is the most popular variety that is exported.
Globally, India is the largest producer of fresh mango and mango pulp in the world, followed
by China, Thailand and Egypt. In 2013, the total world production of fresh mango was
approximately 43 million MT, and India’s share in world production was nearly 40 per cent.
In the same year, the world production of mango pulp was nearly 1.5 million MT, out of which
India’s share was 62 per cent. India’s production of fresh mango and mango pulp has increased
over the past decade.35
33 Aseptic processing is the process by which a sterile (aseptic) product (typically food or pharmaceutical) is
packaged in a sterile container in a way that maintains sterility. 34 Source: http://apeda.gov.in/apedawebsite/SubHead_Products/Mango_Pulp.htm (accessed on 27 October,
2016) 35 Source: FAOSTAT.

32
Figure 3.1: Mango Production in India (in 1000 metric tons (MT)
Source: APEDA. Available at http://agriexchange.apeda.gov.in/India%20Production/India_
Productions.aspx?cat=fruit&hscode=1050 (accessed on 27 October, 2016)
In India, the major mango producing states are Uttar Pradesh, Andhra Pradesh, Karnataka,
Gujarat and Bihar. There are two main clusters in India for mango pulp production which are
located in Chittoor in the state of Andhra Pradesh and Krishnagiri in the state of Tamil Nadu.
Some of the processing units are located in the states of Maharashtra and Gujarat.36 The share
of various states in the production of mango is given in Figure 3.2. In 2014-15, Uttar Pradesh,
Andhra Pradesh and Telangana together accounted for nearly 50 per cent of total mango
production in the country.
Figure 3.2: Share of Various States in Mango Production (2014-15)
Source: APEDA database, available at http://agriexchange.apeda.gov.in/India%20Production/India_
Productions.aspx?cat=fruit&hscode=1050 (accessed on 27 October, 2016)
36 Source: http://apeda.gov.in/apedawebsite/SubHead_Products/Mango_Pulp.htm (accessed on 27 October,
2016)
13734.06
18526.99
0
2000
4000
6000
8000
10000
12000
14000
16000
18000
20000
2006-07 2007-08 2008-09 2009-10 2010-11 2011-12 2012-13 2013-14 2014-15
Uttar Pradesh
23%
Andhra
Pradesh
15%
Telangana
10%
Karnataka
9%
Bihar
7%
Gujarat
7%
Rest of India
29%

33
3.2 Export of Fresh Mango and Mango Pulp from India
India and China, despite being the largest producers of mangoes in the world, produce primarily
for their own domestic markets. India mainly exports mangoes in two forms – fresh mango
(HS Code: 08045020) and mango pulp (HS Code: 08045040). India exports a larger quantity
of mango pulp compared to fresh mango. In 2014-15, India exported only 2 per cent of the
fresh mango that was produced, but exported nearly 80 per cent of mango pulp that was
processed in the country.37
The EU is not a major producer of fresh mango and its consumption of fresh mango in the past
was not very high. However, since 2012, its consumption of fresh mango has increased.38
Important varieties of mango consumed in the EU include Keitt, Kent, Tommy Atkins, Osteen
(grown in the EU) and Palmer. The Keitt and Kent varieties are largely exported to the EU
from Brazil. The leading countries exporting fresh mangoes to the EU are Brazil (37 per cent
of all extra-EU imports), Peru (27 per cent) and Ivory Coast (7.6 per cent). Within the EU, the
Netherlands, Spain and Belgium are the leading export hubs for fresh mangoes. The
Netherlands re-exports mangoes primarily to Germany, France and the UK and Spain exports
to Portugal and France.39
The EU is also the second largest regional market for mango pulp after the Arabian Peninsula.
EU is estimated to import 20 per cent of the world’s total imports of mango pulp and imports
are increasing. The largest user of mango pulp in the EU is the fruit juice industry, but it is also
used in other segments, such as ice cream, baked goods and baby foods. India is the largest
supplier of mango pulp to the EU, followed by Thailand, Mexico and Brazil. The share of
Brazilian mango pulps in the EU’s imports has been rising over the past few years.40
Indian varieties of fresh mangoes are mainly preferred by non-resident Indians (NRIs) and
South Asian customers in the EU. Within the EU, the major countries importing fresh mango
from India include the UK, France, Germany and Italy. Major EU member states importing
mango pulp from India include the Netherlands, Spain and Portugal.41
India’s export of fresh mango to the world has been falling steadily from 63,441.29 MT in
2011-12 to 36,329.01 MT in 2015-16.42 Further, India’s export of fresh mango to the EU has
fallen from 3,890.31 MT in 2012-13 to 1,668.21 MT, due to a fall in exports to the UK, France
and Italy. The export of mango pulp to the EU fell from 44,486.17 MT in 2013-14 to 23,077.26
37 Source: APEDA. Available at http://agriexchange.apeda.gov.in/indexp/genReport_combined.aspx
(accessed on 7 November, 2016) 38 Source: https://www.cbi.eu/sites/default/files/market_information/researches/product-factsheet-europe-
fresh-mangoes-2015.pdf (accessed on 7 November, 2016) 39 Source: https://www.cbi.eu/sites/default/files/market_information/researches/product-factsheet-europe-
fresh-mangoes-2015.pdf (accessed on 7 November, 2016) 40 Source: https://www.cbi.eu/sites/default/files/market_information/researches/product-factsheet-europe-
mango-puree-2015.pdf (accessed on 2 November, 2016) 41 Source: APEDA (accessed on 27 October, 2016) 42 Source: APEDA. Available at http://agriexchange.apeda.gov.in/indexp/genReport_combined.aspx#content
(accessed on 27 October, 2016)

34
MT in 2015-16 due to a fall in demand from the Netherlands and Finland.43 Table 3.2 and 3.3
also show that the export of fresh mango and mango pulp to other markets such as Saudi Arabia
has also been falling.
Table 3.2 and 3.3 depicts the top importing countries of India’s fresh mango and mango pulp
respectively.
Table 3.1: Top Importers of Fresh Mango from India
Country Qty. 2012-13
(MT)
Qty. 2013-14
(MT)
Qty. 2014-15
(MT)
Qty. 2015-16
(MT)
UAE 37598.64 23046.65 29231.9 19973.6
Nepal 2237.62 1106.44 3574.93 8273.99
UK 3304.48 3381.08 329.81 1496.28
Saudi
Arabia
1665.43 1721.91 2171.49 1399.08
Qatar 1522.89 770.08 998.1 1016.25
Kuwait 828.16 4601.44 787.28 748.35
Bahrain 497.49 634.54 658.71 747.79
Singapore 650.27 545.95 562.95 579.96
Canada 437.88 459.49 669.26 459.34
Oman 353.45 345.3 605.2 426.84
USA 242.2 242.42 271.79 266.45
Malaysia 223.35 226.14 202.31 169.76
Japan 0 0.02 4.85 152.98
Source: APEDA. Available at http://agriexchange.apeda.gov.in/indexp/genReport_combined.
aspx#content (accessed on 27 October, 2016)
Table 3.2: Top Importers of Mango Pulp from India
Country Qty. 2012-13
(MT)
Qty. 2013-14
(MT)
Qty. 2014-15
(MT)
Qty. 2015-16
(MT)
Saudi Arabia 43447.95 44390.28 47178.1 42055.43
Netherlands 11236.2 14228.56 12018.46 12004.53
Yemen
Republic
25202.64 37175.2 26179.82 10793.77
Kuwait 4760.74 2921.47 8696.23 8891.61
UAE 11737.42 9096.73 9822.37 8496.68
USA 3783.81 3605.17 4204.9 4503.87
UK 3198.55 3323.64 4882.71 4870.16
Sudan 6304.53 6317.9 6192.2 6155.16
Germany 1559.15 24248.64 1830.31 2979.96
China 2875.81 3371.07 4105.69 2736.76
Egypt 3617.26 943.22 1779 2240.82
Canada 2708.02 1953.46 2858.51 1728.29
Iran 1631.98 988.4 819 1687.2
Source: APEDA. Available at http://agriexchange.apeda.gov.in/indexp/genReport_combined
.aspx#content (accessed on 27 October, 2016)
43 Source: APEDA (accessed on 27 October, 2016)

35
3.3 The Fresh Mango and Mango Pulp Supply Chains
The supply chain for fresh mangoes is illustrated below. It is important to note that APEDA
has set up a traceability system for exports of fresh mangoes to the EU. Due to the presence of
fruit flies in mangoes, exports of fresh mangoes from India have to meet the requirements of
importing countries. For example, in the case of the US, there is gamma irradiation treatment,
while the EU requires hot water treatment or vapour heat treatment at a certain prescribed
temperature. The facilities for such treatments are available in the country. For example, after
APEDA made it mandatory to give hot water treatment to mangoes, it was made available at
two existing facilities at Ratnagiri and Sindhudurg in the Konkan region of Maharashtra.
Further, APEDA also sanctioned a new INR 28 million facility in Mumbai, which was
established by the MSAMB in Vasi, Navi Mumbai.44
When fresh mangoes are exported to the EU market, the export process has to follow certain
requirements (see Figure 3.3). First, the mangoes are sourced only from GLOBALG.A.P.
certified farmers. The exporter then takes the consignment to APEDA approved facilities and,
after sorting and grading, the product is again inspected where tests are carried out to check the
sugar content and pesticide residues, along with other quality inspections. After ripening, the
product is given either hot water treatment or vapour heat treatment. It is worth mentioning
here that these tests are done both in India and again at the EU port of entry. It was pointed out
during the survey that often the testing procedures in India and the EU are different and can
yield different results. This creates a problem for exporters.
It was also pointed out that most EU consumers (unless NRIs) are indifferent to the taste of
mangoes originating from South Africa or Brazil or India. The Asian population has a
preference for Indian mangoes. Hence, Indian mangoes are largely sold in grocery stores run
by Asians or those that keep indigenous Asian products. It is the retail outlets that pick up the
products depending on their quality, which is judged by the physical attributes of the products,
namely its size and colour.
44 See http://www.financialexpress.com/markets/commodities/mangoes-to-run-under-hot-water-before-
export-to-eu/33890/ (accessed on 4 November, 2016)

36
Figure 3.1: Supply Chain of Fresh Mangoes for Export to the EU
Source: Based on inputs received during the survey
The supply of mango pulp follows a client-driven format. For mango pulp, the mangoes are
sourced from the mandis45 and they are processed (tinned, frozen etc.) as per the requirements
of European clients. Most of the clients are European processors/manufacturers. The supply
chain of mango pulp is given in Figure 3.4.
45 Mandis are large, unorganised marketplaces, popular in South Asia, where farmers sell their produce (such
as fruits and vegetables) to various middlemen (such as exporters, processors, etc.).

37
Figure 3.2: Supply Chain of Mango Pulp for Export to the EU
Source: Based on inputs received during the survey
3.4 The Survey and SPS Issues Faced
For this case study, 30 exporters and 12 mango farmers were interviewed across Maharashtra
and Gujarat. Out of the 30 exporters, 21 were engaged in the export business while 9 were
exporters-cum-processors. Three cold chain players and pack house service providers, who
were also exporters, were also interviewed. Seventeen exporters exported fresh mangoes,
whereas 8 exported mango pulp and 5 exported both fresh mangoes and mango pulp.
Most of the exporters interviewed faced issues regarding pests in the shipment, damage
inflicted upon the product (especially Alphonso mango) due to the hot water treatment and fall
in revenue due to the ban on mango imports from India. It is important to note that there are no
issues related to MRLs in mangoes, either fresh or pulp. The key issue for fresh mango is fruit
fly infestation while that for pulp is the sugar content in mangoes, which can be a barrier in the
future. Some issues faced by exporters are given below in detail.
3.4.1 The Case of Fruit Flies in Fresh Mangoes
In May 2014, the EU banned exports of fresh mangoes from India due to the presence of fruit
flies in incoming consignments.46 It is worth noting that India has been exporting mangoes to
46 In the EU, interceptions related to plant health are reported under the European Union Notification System
for Plant Health Interceptions, called the EUROPHYT. It is a web-based network that aims to protect the
territory of the EU from the introduction and spread of new pests and plant diseases that may get carried

38
the EU for a long time and the EU has raised concerns about fruit flies through the EUROPHYT
portal. However, as shown in the Table 3.4, in spite of repeated alerts raised by the EU, cases
of fruit fly infested consignments continued, which led to the ban.
The EC conducted audits in the year 2013 to check the continued interceptions of harmful
organisms in consignments of mango exported from India to the EU, as well as non-compliant
wood packaging material (WPM). The audits had taken place to assess the system of
phytosanitary tests and regulations that were in place in India for the export of mangoes and
other horticultural products (such as eggplant). The audit showed a significant lack of
compliance to phytosanitary health standards imposed by the EU and the presence of fruit flies
in mango shipments being exported to the EU.47 In this context, it is worth mentioning that
APEDA conducted a review of the cases before 2010, after which there was a fall in the number
of interceptions. However, since no major step was taken, the number of cases again increased
after 2010.
Table 3.1: Number of Interceptions in the Case of Mangoes from the EU
Year Number of Interceptions
2005 2
2006 1
2007 13
2008 10
2009 17
2010 8
2011 22
2012 18
2013 37
2014 (The Year of the Ban, in May) 4
2015 5
Source: Compiled by authors from the EUROPHYT database (http://ec.europa.eu/food/plant/plant_
health_biosecurity/europhyt/interceptions/index_en.htm) (accessed on 3 October, 2016)
In total, there were 137 interceptions from 2005 to 2015. Most of the cases were for different
varieties of fruit flies (such as Tephritidae, Bactrocera Zonata and Bactrocera dorsalis). In
India, plant health comes under the Directorate of Plant Protection, Quarantine and Storage
under the Ministry of Agriculture & Farmers Welfare. While the Directorate of Plant
Protection, Quarantine and Storage actively follows the EUROPHYT website and APEDA has
regular meetings with exporters, no remedial action was taken to prevent fruit fly infestation
during the period since 2011, which led to the ban.
The issue of hatching of flies in fruits and vegetables is not unique to India. Other countries
such as Pakistan also face the issue of fruit flies in mangoes. Pakistan has faced 382
into the EU market through export consignments from other countries. To avoid the export of such pests
and diseases, consignments are tested at the port and in the case of a threat, a notification is raised to the
exporting countries. For details see http://ec.europa.eu/food/plant/plant_health_biosecurity/europhyt_en
(accessed on 25 October, 2016). 47 Source: ec.europa.eu/food/fvo/act_getPDF.cfm?PDF_ID=10719 (accessed on 7 November, 2016)

39
notifications in total between 2005 and 2015 on the EUROPHYT portal. Figure 3.5 compares
the interceptions for India and Pakistan.
Figure 3.1: Interceptions Raised by the EU for India and Pakistan
Source: Compiled by authors from the EUROPHYT database (http://ec.europa.eu/food/plant/plant_
health_biosecurity/europhyt/interceptions/index_en.htm) (accessed on 7 November, 2016)
As shown in Figure 3.5, in some of the years, Pakistan has had a much higher number of
interceptions for pests than India. In 2013, interceptions faced by mango exported from
Pakistan were more than three times that faced by exports from India (Pakistan: 136
interceptions; India: 37 interceptions). In 2014, the EU banned imports of mangoes from India,
but no such ban was imposed on exports from Pakistan. This is because when the EC sent a
warning letter to Pakistan, it stopped exporting mangoes, introduced new hot water treatment
plants48 and made the hot water treatment mandatory for exports.49 It is also worth noting that
in 2013, India exported approximately 4,000 MT of fresh mangoes to the EU50, whereas
Pakistan exported approximately 12,000 MT.51
The survey participants pointed out that the ban on import of fresh mangoes from India despite
the lower number of interceptions highlights the non-transparency in the EC system. They also
presented their own views on what may have led to this situation. One view is that Pakistan
48 Source: http://nation.com.pk/business/15-Jul-2014/govt-introduces-hot-water-treatment-plants-for-
mangoes(accessed on 3 March 2017) 49 Source: http://gulftoday.ae/portal/53d50e1d-0801-4bb5-9ab5-dfaac9945cc6.aspx (accessed on 3 March
2017) 50 Source: APEDA. Available at http://agriexchange.apeda.gov.in/indexp/genReport_combined.aspx#content
(accessed on 7 November, 2016) 51 Source: Pakistan Bureau of Statistics, Government of Pakistan. Available at http://www.pbs.gov.pk/trade-
tables (accessed on 4 November, 2016)
0
20
40
60
80
100
120
140
160
2005 2006 2007 2008 2009 2010 2011 2012 2013 2014 2015
India Pakistan

40
policymakers, unlike Indian policymakers, lobby hard with countries such as the UK to
facilitate their exports.
One way of controlling the growth of pests and fruit flies is by spraying pesticides. However,
most developed countries have strict MRLs. Therefore, some exporting countries use in-farm
practices such as netting wherein each product is protected from flies by covering it with a fruit
net/bag (see Image 3.1). This technique is costly and farmers are often reluctant to adopt these
methods. The other alternative is to subject the fruit to post-harvest treatment such as hot water
treatment, which is now followed in countries such as India and South America.
Image 3.1: The Process of Netting/Bagging Mangoes to Protect them from Fruit Flies
Source: The image has been taken from http://www.thedailystar.net/country/eco-friendly-bagging-
method-save-mangoes-pests-84862 (accessed on 25 October, 2016)
One of the key barriers that exporters face is that different countries that import fresh mangoes
from India have set up different remedies for treating fruit flies. While the US prescribes that
the fruit should undergo gamma irradiation, in the EU, hot water treatment is prescribed
(immerse the fruit for 60 minutes in water heated at 48 degrees Celsius). After the ban in May
2014, based on a discussion with the EU authorities, the Directorate of Plant Protection,
Quarantine and Storage, the Ministry of Agriculture & Farmers Welfare and APEDA issued
an advisory in March 2015 to Indian mango exporters to adopt one of the following measures
for consignments meant for the EU market:52
52 For details see http://apeda.gov.in/apedawebsite/Announcements/EUMango.pdf (accessed on 26 October,
2016)

41
1. Hot water immersion treatment at 48 degree Celsius for 60 minutes (fruit size up to 500
grams)
2. Vapour heat treatment either at 46.5 degree Celsius for 30 minutes or 47.5 degree Celsius
for 20 minutes.
The survey participants argued that these prescriptions are based on research conducted on
South American mangoes. Compared to varieties such as Tommy Atkins and Keitt from South
America, which have a thick skin, Indian Alphonso and Kesar that are exported to the EU have
thinner skin and the fruit, according to them, is not able to withstand the hot water treatment.
The participants also pointed out that the prescribed temperature and time duration for hot
water treatment may be fit for a particular variety of mango (for example, Alphonso grown in
Karnataka can withstand it); however, it is not suitable for the variety grown in Maharashtra.
Further, it depends on the stage of ripening at which the mango is plucked and treated. If the
mango is ripe, it will not be able to withstand the treatment. The meetings with APEDA and
experts show that for a long time, APEDA had been proposing the hot water treatment, but
exporters raised concerns about accepting the treatment until the EU imposed a ban. APEDA
requested the MSAMB to conduct a study to assess the appropriate procedure for hot water
treatment that would ensure minimum spoilage of the fruit. This was commissioned to Dr.
Balasaheb Sawant Konkan Krishi Vidyapeeth (Agricultural University) in Dapoli, Ratnagiri.
However, the study result was not available on the public domain until November 2016.
Representatives from the survey team visited the university to request a copy of the report, but
the scientists said that they were not authorised to release it.
Exporters gave various opinions about the study outcome and the APEDA approved process
for treatment of fresh mangoes for the EU market. While some said that they have no issues
and are able to abide by the procedures laid down by APEDA, others pointed out that their
whole consignment was destroyed as the hot water treatment damaged the skin of the mangoes.
Others had interesting stories on how they eradicated fruit flies without exposing the fruit to
excess heat and water. One such exporter conducted the treatment by immersing the fruit for
50 minutes at 47.5 degree Celsius or one hour immersion at 46.5 degrees, which was suitable
for these varieties. They said that the pests were killed successfully without inflicting major
damage to the fruit. It is interesting to note that he managed that under strict monitoring by the
Directorate of Plant Protection, Quarantine and Storage. Another exporter pointed out that he
first cooled the mangoes to its minimum approved temperature and then put them in hot water.
Some exporters purchase the mangoes when they are 20-30 per cent ripe and then perform the
hot water treatment to avoid any spoilage. In any case, all exporters maintained that due to the
hot water treatment, mangoes have to be transported by air to the EU and it affects their shelf
life.
Three exporters also raised the issue of where gamma irradiation and hot water treatment
should be done – in India or at the port of destination. For example, Pakistan does not have a
gamma irradiation facility and the treatment is done in the US port of entry. However, APEDA
and most of the exporters feel that the treatment should be in India.
42
As illustrated in the fresh mango supply chain, mangoes meant for the EU market have to go
through several rounds of inspection and treatments. They undergo laboratory testing in the EU
port of entry as well. The hot water treatment, quick freezing, poor supply chain and
transportation delays can all have adverse implications for the shelf life of the product and the
cost of multiple testing and transportation by air is also high. The exporters also referred to the
issues that they have to face due to compliance with different SPS requirements of different
countries.
3.4.2 Wider Challenges that affect Compliance with the EU SPS measures
There are certain other challenges which make it difficult to comply with the EU’s SPS
measures or the solution imposed to address the EU’s SPS measures. For example, a number
of exporters pointed out that compared to Indian Alphonso mangoes which have thin skin,
mangoes from South America have a thicker skin and a longer shelf life. Therefore, they are
able to sustain treatment like hot water treatment without getting spoilt unlike Indian mangoes.
To counter this concern of the exporters, it is important for the Department of Commerce to
make public the scientific study showcasing that hot water treatment is not harmful for Indian
Alphonso mangoes. This will remove all concerns and controversies.
There are certain infrastructural bottlenecks that act as a challenge to comply with the
requirements of the SPS measures and it escalate the costs for the farmers and exporters. For
example, there are limited APEDA approved facilities for sorting, grading and laboratory
testing; and they are also not uniformly spread across different states. Gujarat state government
officials pointed out that for hot water or vapour treatment, an exporter from Gujarat has to
take the product to Maharashtra as the facility is not available in Gujarat. Similarly, gamma
irradiation facilities are located only in a few states. All this adds to the spoilage and cost
incurred by exporters.
Moreover, to comply with requirements to address the fruit flies infestation issue, all post-
harvest activities are to be done in APEDA approved facilities. Getting the approval for a
facility also involves time and cost. It takes about 3-5 months on an average to obtain a licence
for sorting, grading and testing facilities while the hot water treatment plant takes about 2 and
a half months. Further, while the cost of obtaining the licence is around INR 50,000, often the
facilities have to be re-constructed to suit EU requirements. The cost of setting up the required
infrastructure sometimes comes to INR 50-100 million.
3.4.3 Sugar Content in Mango Pulp: A Potential SPS Barrier
Secondary data as well as the survey revealed that in the past few years, the export of mango
pulp from India to the EU has been falling and the EU has shifted the demand to mango pulp
coming in from Brazil, Peru and Mexico.53 This is due to the fact that mango pulp imported
from India has a higher sugar concentrate than those imported from South America. Sugar
content in mango pulp can be a food safety issue if limits are set based on health concerns in
53 Source: https://www.cbi.eu/sites/default/files/market_information/researches/product-factsheet-europe-
mango-puree-2015.pdf (accessed on 7 November, 2016)

43
the EU. The sugar in mango pulp used in fruit juices contains fructose, which causes obesity
and type-2 diabetes. The sugar content per portion is higher in juices than in whole fruits.54
Many countries have also introduced a tax on sugar-based beverages such as carbonated drinks,
energy drinks, etc., to discourage consumption. Such a tax is imposed on a beverage if its sugar
content exceeds the prescribed limit. A number of EU member countries are discussing sugar
tax and buyers are specifying sugar limits which act as a barrier for Indian exporters. Although
this has not been raised as an SPS issue now, it will be an issue in the near future and therefore,
it is important to have a proactive strategy rather than reactive strategy and investigate how to
address this issues as was pointed out that the exporters and state government officials.
Fruit juice consumption in the EU is the highest in the UK, but consumption has been
decreasing over the past 2-3 years.55 The survey revealed that EU importers have shifted their
main sourcing from India to South American countries because the sugar content in pulp from
those countries is lower. They have also imposed strict requirements on sugar levels in the
pulp. However, the sugar in mango pulp processed in India consists of natural sugars, not
artificially added sugars, and there is hardly anything that the processors can do to decrease the
content. This issue has to be addressed at the field level with the right variety of crop.
3.5 The Way Forward
The above case study highlight that key issue faced by mango exporters is fruit flies infestation.
The attack of pest on crops not only leads to export bans, loss of export revenue but also loss
of revenue to farmers due to crop losses. This issue can be more permanently addressed through
in-farm practices such as netting, growing crops in a controlled environment like poly houses
and post-harvest practices such as hot water treatment. India may continue with the present
policy of hot water treatment in the short run, even though some exporters feel that it can impact
the quality adversely. In the long run, India may explore alternative farming practices which
are discussed in this chapter. Through the EU technical assistance programme, training
programme can be organised for farmer groups about methods like netting/bagging and they
may be encouraged to adopt these to protect their crop. There is scope of collaboration with
the EU for agricultural extension programmes and research on different methods of preventing
fruit fly infestation.
It was pointed out during the survey that there should be more research on alternative method
to address the concerns related to fruit flies. There is need for research to explore methods
such as phosphine gas treatment given to the fruit to prevent hatching of fruit flies. However,
without proper research on whether such treatment is suitable for the Indian variety of mangoes
no measures should be adopted and the research should be first made available in public domain
before adopting the measure.
Further, the survey showed that it is important for APEDA to publish research findings such
as the study done by Dr. Balasaheb Sawant Konkan Krishi Vidyapeeth Agriculture University
54 Source: http://aijn.org/files/default/aijn2014-full.pdf (accessed on 3 November, 2016) 55 Source: http://aijn.org/files/default/aijn2014-full.pdf (accessed on 3 November, 2016)
44
in Dapoli, Ratnagiri on hot water treatment. The study may be made available in public domain.
In the case of exports of okra to the EU, both APEDA and the Directorate of Plant Protection,
Quarantine and Storage had taken the right decision to stop exports of pest-infected produce.
A similar strategy should be followed by APEDA for key export items like mangoes.
There are several studies conducted on pests that infect Indian mangoes and measures that can
be taken to eliminate them. One particular study identifies various breeds of flies and other
pests that are persistent in the Western Ghats. The study lists the characteristics and physical
attributes of pests that are recognised to enable farmers identify them and take appropriate
measures (Drew, et al., 2002). Another study by the Indian Council of Agricultural Research
(ICAR) has been published, which lays down the guidelines on the proper management of pests
and care of mangoes (ICAR, 2012). Such studies should be used to train exporters and farmers.
There is need to generate awareness through training of Indian customs officers so that the
product is not unnecessarily held up at the customs, causing delays and financial losses.
It was pointed out during the survey that hatching of flies is not just conditional on the outside
environment and fruit health but also the kind of packaging used for the product. Hence, there
is need to develop good quality packaging material. India can take technical advice and
expertise from the EU for developing the right kind of packaging to prevent the proliferation
of fruit flies, especially when the goods are in transit.

45
Chapter 4: The Case of Export of Indian Table Grapes to the EU
In April 2010, containers of Indian table grapes were detained at various EU member
countries’ ports on grounds that these grapes contained more than the permissible quantity of
chlormequat chloride (ccc) also known as chlorocholine chloride, a chemical, which is
hazardous to health. This resulted in huge losses to Indian exporters and farmers. However,
this incident did not stop the export of table grapes from India to the EU in subsequent years.
In 2015-16, export of table grapes from India touched an all-
time high – India exported 84,482 tonnes of grapes to EU
compared to 41,783 tonnes exported in the previous year,
registering a growth of 102 per cent.56 Today, India is a
large exporter of grapes to the EU. The journey from
rejection to a tremendous growth in exports was possible
through the joint efforts of the Indian central and state
governments’ agriculture and horticulture departments, the
agriculture marketing boards, APEDA, exporters and
farmers. While the success stories of farmers co-operatives
such as Mahagrapes in the export of grapes is well
documented, the overall story of grape exports from India is
presented here.
At the outset, it is worth mentioning that there are three
broad categories of fresh and processed grapes (excluding
wine) traded as per the harmonised system (HS) of
classification – fresh grapes (HS 08061000), sultanas and other dried grapes (HS 08062090)
and other grape fruit juice (HS 20092900.)57 Of this, India’s trade with the world and the EU
in sultanas and grape fruit juice is negligible. Therefore, this chapter focuses on fresh grapes
(or table grapes).
This case study is based on an analysis of secondary information and a primary survey
conducted in the major grape exporting states of India, namely Maharashtra and Gujarat,
covering cities such as Ahmedabad, Pune, Nasik, and Mumbai. In total, 28 interviews were
held, which included 16 exporters and grower exporters and 12 grape farmers. There were
also interactions with state government departments, trade and export promotion bodies such
as APEDA and the Maratha Chambers of Commerce, Grapes Exporters Association of India,
Maharashtra Rajya Draksha Bagaitdar Sangh (Maharashtra State Grape Growers
Association).
56 For details see http://economictimes.indiatimes.com/articleshow/52215590.cms?utm_source=contento
finterest&utm_medium=text&utm_campaign=cppst (accessed on 23 August, 2016). 57 See Chapter 2 for details of India’s export to the EU.
Thompson Seedless Grapes

46
4.1 Overview of the Table Grape Industry in India
In India, grapes were cultivated over an area of 118,000 hectares in 2014 with an annual
production of more than 1,000,000 tonnes.58 Compared to other grape producing countries,
India still lags behind in terms of its average production; however, due to favourable
agricultural conditions, it is one of the top countries in terms of the average yield of grapes.
China is the largest producers of grapes in the world followed by Italy, the US, France and
Spain (See Figure 4.1).
Figure 4.1: Average Production of Grapes in 2004-14 for Selected Countries (in MT)
Source: Compiled by Authors from Statistics provided by the Food and Agriculture Organization of the
United Nations, accessible at http://faostat3.fao.org/browse/Q/*/E (accessed on 20 August, 2016)
As regards yield, with a yield of 21088.21 kilogram per hectare, India ranked second after
Egypt in terms of the average yield between 2004 and 2014. This highlights India’s potential
as an exporter of grape in the world market.
India specialises in the production of colourless varieties of grapes. These include the white
seeded variety and the white seedless variety, which account for 70 per cent of commercially
grown grapes in India. Among these, Thompson Seedless and its clones Tas-A-Ganesh, Sonaka
and Manik Chaman occupy 55 per cent of the total production area, followed by Anab-e-Shahi
and its clone (15 per cent). Certain coloured varieties are also grown in India which seeded
varieties such as Bangalore Blue and Gulabi (Muscat). The coloured seedless varieties are
58 http://www.fao.org/docrep/003/x6897e/x6897e06.htm (accessed on 12 April, 2016)
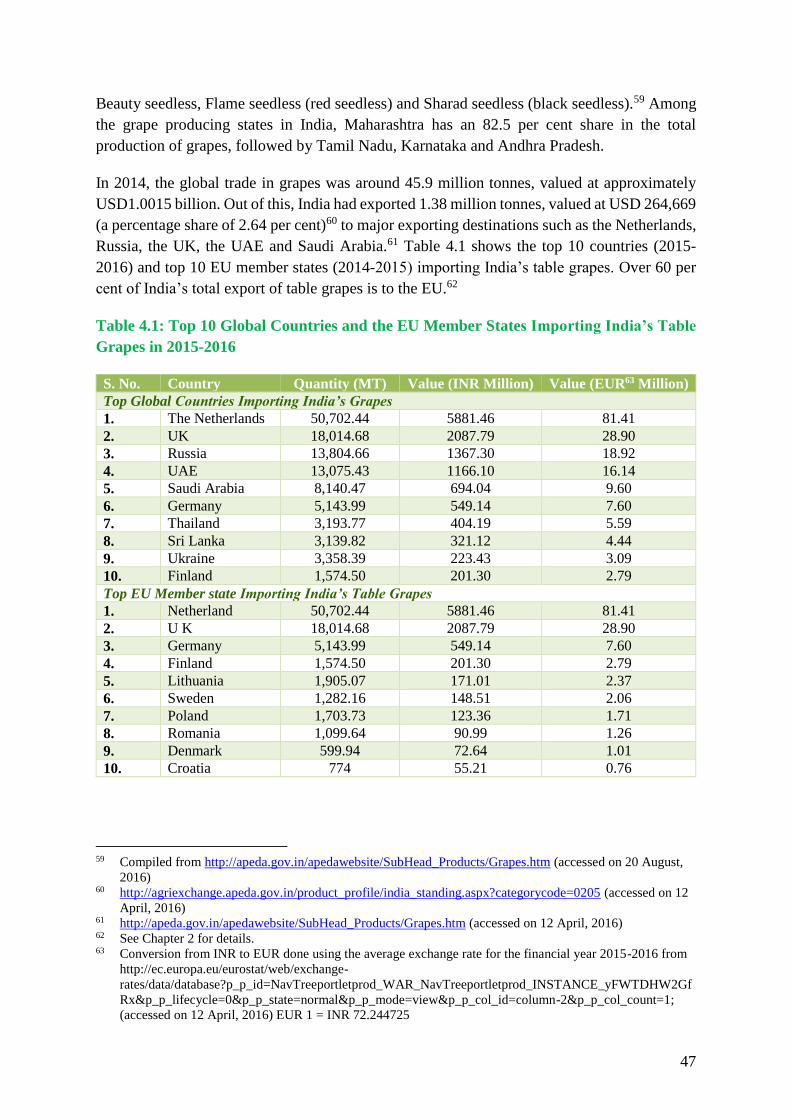
47
Beauty seedless, Flame seedless (red seedless) and Sharad seedless (black seedless).59 Among
the grape producing states in India, Maharashtra has an 82.5 per cent share in the total
production of grapes, followed by Tamil Nadu, Karnataka and Andhra Pradesh.
In 2014, the global trade in grapes was around 45.9 million tonnes, valued at approximately
USD1.0015 billion. Out of this, India had exported 1.38 million tonnes, valued at USD 264,669
(a percentage share of 2.64 per cent)60 to major exporting destinations such as the Netherlands,
Russia, the UK, the UAE and Saudi Arabia.61 Table 4.1 shows the top 10 countries (2015-
2016) and top 10 EU member states (2014-2015) importing India’s table grapes. Over 60 per
cent of India’s total export of table grapes is to the EU.62
Table 4.1: Top 10 Global Countries and the EU Member States Importing India’s Table
Grapes in 2015-2016
S. No. Country Quantity (MT) Value (INR Million) Value (EUR63 Million)
Top Global Countries Importing India’s Grapes
1. The Netherlands 50,702.44 5881.46 81.41
2. UK 18,014.68 2087.79 28.90
3. Russia 13,804.66 1367.30 18.92
4. UAE 13,075.43 1166.10 16.14
5. Saudi Arabia 8,140.47 694.04 9.60
6. Germany 5,143.99 549.14 7.60
7. Thailand 3,193.77 404.19 5.59
8. Sri Lanka 3,139.82 321.12 4.44
9. Ukraine 3,358.39 223.43 3.09
10. Finland 1,574.50 201.30 2.79
Top EU Member state Importing India’s Table Grapes
1. Netherland 50,702.44 5881.46 81.41
2. U K 18,014.68 2087.79 28.90
3. Germany 5,143.99 549.14 7.60
4. Finland 1,574.50 201.30 2.79
5. Lithuania 1,905.07 171.01 2.37
6. Sweden 1,282.16 148.51 2.06
7. Poland 1,703.73 123.36 1.71
8. Romania 1,099.64 90.99 1.26
9. Denmark 599.94 72.64 1.01
10. Croatia 774 55.21 0.76
59 Compiled from http://apeda.gov.in/apedawebsite/SubHead_Products/Grapes.htm (accessed on 20 August,
2016) 60 http://agriexchange.apeda.gov.in/product_profile/india_standing.aspx?categorycode=0205 (accessed on 12
April, 2016) 61 http://apeda.gov.in/apedawebsite/SubHead_Products/Grapes.htm (accessed on 12 April, 2016) 62 See Chapter 2 for details. 63 Conversion from INR to EUR done using the average exchange rate for the financial year 2015-2016 from
http://ec.europa.eu/eurostat/web/exchange-
rates/data/database?p_p_id=NavTreeportletprod_WAR_NavTreeportletprod_INSTANCE_yFWTDHW2Gf
Rx&p_p_lifecycle=0&p_p_state=normal&p_p_mode=view&p_p_col_id=column-2&p_p_col_count=1;
(accessed on 12 April, 2016) EUR 1 = INR 72.244725

48
Source: http://agriexchange.apeda.gov.in/product_profile/exp_f_india.aspx?categorycode=0205
(accessed on 12 April, 2016)
The table above indicates that the EU is a key importer of Indian grapes. According to the data
published by the DGFT, Ministry of Commerce and Industry, in 2014-15, the share of the EU
in the total export of grapes from India was around 61 per cent. The export of grapes from India
to the EU doubled in 2016, as compared to 2015. In 2015, 41783 metric tons (MT) (3288
containers) of grapes were sent to the EU while in 2016, the number increased to 84495.4 MT
(6471 containers). Maharashtra accounted for a major portion of these exports.64
As regards the major importing countries in the EU, Table 4.2 shows that the Netherlands, the
UK and Germany are the top three destinations, accounting for 88 per cent of the total grapes
exported to the EU in the year 2015-16.
Table 4.2: Export of Table Grapes from India to EU Member States in 2015-16
Country Qty. (In MT) No. of Containers
Netherlands 48773.261 3723
United Kingdom 18319.525 1412
Germany 7537.195 579
Finland 1866.4 157
Belgium 1389.15 111
Sweden 1319.302 104
Denmark 1104.28 88
Norway 958 82
Ireland 829.542 53
Lithuania 811.413 50
Switzerland 327.36 27
Latvia 278.706 17
France 198.87 14
Austria 145.436 11
Czech Republic 145.212 11
Italy 132 9
Poland 118.773 8
Romania 100.368 6
Estonia 81.039 5
Slovenia 48.024 3
Luxembourg 11.5 1
Total 84495.356 6471
Source: Daily MIS Report for Export of Grapes available at the GrapeNet system of APEDA accessible
at http://www.apeda.gov.in/apedawebsite/Grapenet/GrapeNet_new.htm (accessed on 26 August,
2016). Please note: There is slight discrepancy in the data provided in Table 4.1 and 4.2 as the data
sources are different.
64 This is taken from the Daily Management Information System report generated by GrapeNet and uploaded
on their websites. These figures were accessed from
http://www.apeda.gov.in/apedawebsite/Grapenet/GrapeNet_new.htm (accessed on 26 August, 2016). The
figures are updated from time to time.

49
As mentioned earlier, in India, the most prominent variety of the export is Thomson Seedless,
which is the white/colourless variety. Among the 12 farmers who were interviewed, 9 cultivate
only Thompson seedless, and the remaining cultivated other varieties like Sharad seedless
along with Thompson seedless, for exports.
The survey found that India has not been successful in the cultivation and export of coloured
varieties of grapes. Discussions with exporters and farmers indicated that although exports of
grapes is increasing, globally there is a growing preference for coloured varieties of table
grapes and India is facing stiff competition in this regard from countries such as South Africa
and Chile, which have developed those grapes and are fast penetrating markets such as the EU.
EU member countries as well as countries in Asia such as China are increasingly demanding
coloured varieties of grapes. Further, some of these new varieties, which are exported by
countries such as South Africa and Chile, also have a longer shelf life. The preference for
coloured grapes with a longer life span often ensures better price realisation to the exporters of
those countries as supermarket chains in the EU prefer to source such grapes. Thus, Indian
table grapes are facing and will continue to face stiff competition in the EU market in the future
from other exporting countries, which can adversely affect the prices and quantity of export in
the future. Further, the EU market for grapes such as Thompson seedless is fast getting
saturated.
Before one examines the barriers to exports, it is important to understand the export process
and the supply chain.
4.2 Export Process and the Supply Chain
There are three broad categories of grape exporters in India:
(a) Grower exporters such as the Sahyadri Farms and Bafna Group
(b) Growers’ co-operative such as Mahagrapes
(c) Exporters/traders such as Freshtrop Fruits Limited and ONS Express Private Limited.
Often, the grower exporters are either large farmers or they are farmer producer companies.
Exporters/traders are primarily involved in procuring crops from a cluster of farms and
exporting them to the EU member states, after ensuring that the product meets EU market
requirements. The primary survey found that some of the companies such as Deepak Fertilisers
and Petrochemical Corporation Limited that are engaged in providing extension services (for
example, fertilisers) to grape growers/farmers in states such as Maharashtra are now engaged
in exports of grapes and other fruits to the EU and other countries as they have a well-
established network with farmers/grape growers.
To understand the supply chain of grapes from a farmer in India to a consumer in the EU
member state, it is important to understand the agricultural sector in India, which is different
from the sector in many EU member states. Unlike in the EU member states, the agricultural
sector in India is dominated by a large number of small-sized, fragmented land holdings. As a
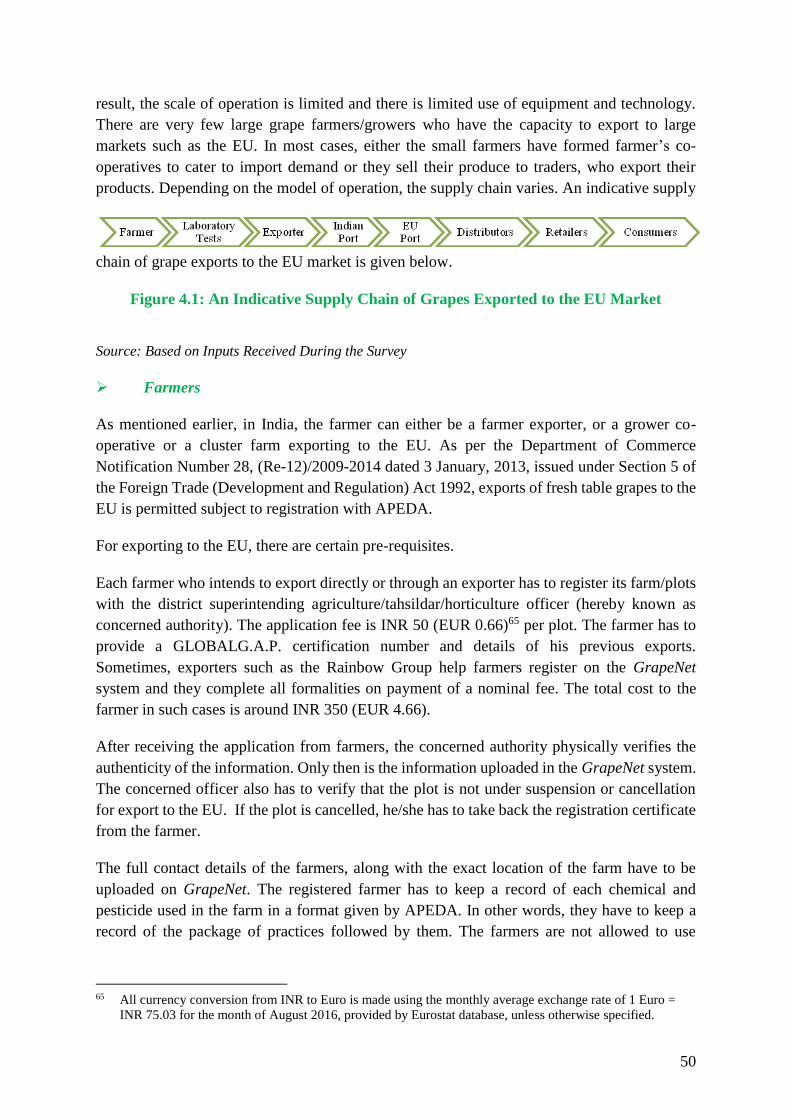
50
result, the scale of operation is limited and there is limited use of equipment and technology.
There are very few large grape farmers/growers who have the capacity to export to large
markets such as the EU. In most cases, either the small farmers have formed farmer’s co-
operatives to cater to import demand or they sell their produce to traders, who export their
products. Depending on the model of operation, the supply chain varies. An indicative supply
chain of grape exports to the EU market is given below.
Figure 4.1: An Indicative Supply Chain of Grapes Exported to the EU Market
Source: Based on Inputs Received During the Survey
Farmers
As mentioned earlier, in India, the farmer can either be a farmer exporter, or a grower co-
operative or a cluster farm exporting to the EU. As per the Department of Commerce
Notification Number 28, (Re-12)/2009-2014 dated 3 January, 2013, issued under Section 5 of
the Foreign Trade (Development and Regulation) Act 1992, exports of fresh table grapes to the
EU is permitted subject to registration with APEDA.
For exporting to the EU, there are certain pre-requisites.
Each farmer who intends to export directly or through an exporter has to register its farm/plots
with the district superintending agriculture/tahsildar/horticulture officer (hereby known as
concerned authority). The application fee is INR 50 (EUR 0.66)65 per plot. The farmer has to
provide a GLOBALG.A.P. certification number and details of his previous exports.
Sometimes, exporters such as the Rainbow Group help farmers register on the GrapeNet
system and they complete all formalities on payment of a nominal fee. The total cost to the
farmer in such cases is around INR 350 (EUR 4.66).
After receiving the application from farmers, the concerned authority physically verifies the
authenticity of the information. Only then is the information uploaded in the GrapeNet system.
The concerned officer also has to verify that the plot is not under suspension or cancellation
for export to the EU. If the plot is cancelled, he/she has to take back the registration certificate
from the farmer.
The full contact details of the farmers, along with the exact location of the farm have to be
uploaded on GrapeNet. The registered farmer has to keep a record of each chemical and
pesticide used in the farm in a format given by APEDA. In other words, they have to keep a
record of the package of practices followed by them. The farmers are not allowed to use
65 All currency conversion from INR to Euro is made using the monthly average exchange rate of 1 Euro =
INR 75.03 for the month of August 2016, provided by Eurostat database, unless otherwise specified.

51
chemicals that are under development trials and are not registered with the Central Insecticide
Board and Registration Committee.
The farm registration with APEDA is valid for three years. However, all registered grape
farmers have to renew their farm registration every year and this is done during the months of
October-November. Late registration fee is charged for delay in registration (for example, if
the farmer registers in December). The registration certificate is issued after the completion of
the registration process.
After registration, the details of the crop have to be provided including the variety, details of
the spray schedule and whether it matches with the schedule prescribed by the National
Research Centre (NRC) for grapes.66
Since 1997, retailers in Europe established standards for good agricultural practices (GAP)
called EurepGAP. These standards are applicable and accepted all over Europe. In 2007, to
reflect the global outreach, EurepGAP was renamed as GLOBALG.A.P. All farms supplying
to the EU have to obtain a GLOBALG.A.P. certificate. If an exporter is sourcing from farm
clusters, he has to ensure that the farms are GLOBALG.A.P. certified; otherwise, the products
will not be acceptable in the EU market. In India, since the size of the land holding is mostly
small, most farmers apply for GLOBALG.A.P. certificate in a group or a cluster.
Once the crop is ready for harvest, the exporters contact the farmers and they notify APEDA
approved laboratories to collect samples and test them for EU requirements. Authorised
representatives of APEDA approved laboratories collect the samples from the farm and test
them for EU safety norms.
Laboratory Tests
The survey found that crops are tested for about seven pests and diseases including powdery
mildew, downy mildew, anthracnose, mealy bugs, thrips, jassids and mites. Apart from these,
tests are performed for any other pests or diseases or any other quality observations.67 Further
tests are conducted to check for pesticide residue. In 2016, around 42 residues had to be
checked for. The list is provided by the EFSA to APEDA.68
After the samples are drawn and tests are conducted, the laboratory sends the reports to the
exporter and identifies whether the product is fit for export to the EU. A template of the
laboratory report is presented in Table 3. In this particular case, the sample collected from
66 The National Research Centre for Grapes under the Indian Council of Agricultural Research was
established in 1997 in Pune for strategic and applied research on safe grape production and productivity;
transfer of technology and capacity building of stakeholders for enhanced and sustained production of
grapes and National Referral Laboratory for Food Safety and Pesticide residue in fruits. 67 A detailed list of the pesticides that are tested for and their different nomenclatures are given in Appendix
4A.1. 68 For details, see the Procedure for Export of Fresh Table Grapes to the European Union for 2015-16,
released in September 2015 accessible at
http://traceability.apeda.gov.in/hortinet/Notice/procedureforexportofgrapes2015-16.pdf (accessed on 21
August, 2016)

52
farmer ABC located in Nashik contained more than the prescribed limit of Forchlorfenuron
(plant growth regulator). As a result, the product failed the laboratory test. The second farmer,
DEF passed the laboratory test and, hence, his crop was certified fit for export to the EU market.
Table 4.1: Template of Laboratory Report Sent to the Exporter by APEDA approved
Labs
Date of Sample 14/02/2016
Farmer Name ABC
Location Nashik
Farm Regi. No. MH00000001 First Sample
Exporter Name XYZ
Variety Thompson
Result
Sr. No. Detected Pesticide
Result
(Mg/Kg)
MRL
(Mg/Kg)
% per
residue Remark
1 Buprofezin 0.037 1 3.70
Fail
2 Cymoxanil 0.01 0.02 50.00
3 Famoxadone 0.256 2 12.80
4 Forchlorfenuron 0.015 0.01 150.00
5 Chlormequat chloride 0.02 0.05 40.00
6 Trifloxystrobin 0.01 3 0.33
Total Pesticide % against MRL 256.83%
Date of Sample 16/02/2016
Farmer Name DEF
Location Nashik
Farm Regi. No. MH00000005 First Sample
Exporter Name UVW
Variety Thompson
Result
Sr. No. Detected Pesticide
Result
(Mg/Kg)
MRL
(Mg/Kg)
% per
residue Remark
1 Buprofezin 0.037 1 3.70
Pass
2 Cymoxanil 0.01 0.02 50.00
3 Famoxadone 0.256 2 12.80
5
Chlormequat
chloride 0.02 0.05 40.00
6 Trifloxystrobin 0.01 3 0.33
Total Pesticide % against MRL 106.83%
Source: Compiled by authors from survey inputs.
Exporters
Once the laboratory issues a green signal to samples collected from a particular farmer, the
exporter settles the price of the crop with the farmer. The crop is then harvested and the
exporters bring the product to APEDA approved pack houses. In the export supply chain,
processing facilities such as pack houses, and pre-cooling and storage facilities have to be
approved by APEDA, adhering to EU standards.

53
Fresh table grapes that do not clear laboratory tests are either sold in the domestic market or
are exported to other countries, which have less stringent food safety standards compared to
the EU.
In the pack houses, the grapes are sorted
according to physical attributes such as
size and colour. The survey also found
that good quality produce is exported to
the EU market while poorer quality may
be sold by farmers in the domestic market
or may be exported to other countries. The
price of grapes varies based on the quality.
It was pointed out during the survey that
farmers are paid INR 40-60 per kg for the general variety and INR 70-80 per kg for the premium
variety (which is usually exported to the EU). Apart from this, the exporter incurs the cost of
laboratory testing, transportation and packaging and labelling the products. The cost of
laboratory testing in India is around INR 8000-9000 and the same product has to be tested again
in the EU states, which entail an additional cost of around INR 40,000. The exporters sell the
products to their EU agents, commonly known as importers. None of the exporters or growers
interviewed sold their produce directly to supermarket chains. They get around Great British
Pound (GBP) 2 per kg in the UK. Given the cost that they have to incur in the export of the
produce, it is evident that Indian exporters operate on a very thin margin. It was also pointed
out during the survey that the exporter’s income is based on the exchange rate of the currency
rather than the price of grapes. Most of them make money when the value of the Indian currency
is low vis-à-vis British Pound or Euro.
The survey found that APEDA has been successful in establishing full supply chain
traceability. Grapes are packed in boxes as per EU requirements and each box has a lot number,
which is generated according to the date and month of harvest, farmer registration number, etc.
This lot number is instrumental in tracing the product back to the farmer (see Image 4.1).
Once these products are packed in pack houses, they are dispatched in reefer vehicles to
customs ports. Most of the export of grapes to the EU is from Mumbai’s Jawaharlal Nehru Port
(JNP).
Indian Customs
The customs officers check all the documents and match them with EU requirements. If all the
documents are in place, the products are dispatched to the EU. Grapes are mostly sent through
the sea route and transportation takes around 21 days.
EU Ports
Depending on the market, the port of entry at the EU is chosen. For instance, for the
Netherlands and other countries in mainland Europe, it is the Port of Rotterdam; for the UK, it
Image 4.1: Packaging and Labelling of Tables
Grapes Exported to the EU
54
is the Port of Felixstowe; for Germany, it is Hamburg Port, and so on. Once the containers
arrive at the EU port, samples are drawn at the port and sent for laboratory testing. These
samples are randomly drawn. Only if the samples are approved do the products get clearance
from the EU authorities. The clearance is done by the exporter’s agent or importer in the EU.
In case there is any health and safety related issue, the problem is communicated to the
importer, who further communicates it to the exporter in India. It is also flagged on the RASFF
of the EU for issues related to pesticides and EUROPHYT for issues related to occurrence of
pests. When multiple consignments are detected with health hazards, the issues are directly
flagged to APEDA.
Between 1 January, 2000, and 30 April, 2016, around 40 notifications have been raised on the
RASFF portal. A majority (17) of the notifications were raised in the year 2010 and amongst
the EU member states, the maximum notifications were from the Netherlands. The notifications
were classified as given below –
i. Alerts, which represent serious risk to the market. There were 6 alerts raised for table
grapes.
ii. Information, which implies that a risk has been identified, which does not require rapid
action either because the risk is not considered serious or the product is not on the market
at the time of notification. There were 30 notifications classified under this category.
iii. Information for attention, which are related to a product that: (a) is present only in the
notifying member country; or (b) has not been placed on the market; or (c) is no longer on
the market. If the products clear the laboratory tests in the EU port of entry, then they are
approved for sale in the EU market. The report is given to the importer. There were 4
notifications classified under this category.
Importers, retailers and consumers
The importer can also be an agent or a distributor. The importer then sells the product to
retailers, which include large supermarket chains in the EU. Large retailers in the EU have tie-
ups with importers. None of them source directly from Indian exporters. The survey found that
better quality products are taken by the supermarkets such as Tesco PLC, while inferior quality
is sold in the wholesale markets of the EU.
4.3 The ‘ccc’ Issue – Why Indian Table Grapes were detained in EU Ports in 2010
In 2010, when Indian grapes reached an EU port, samples were drawn for health and safety
checks. These tests revealed that the grapes contained more than the permissible level of
chlormequat chloride (ccc). The ccc is a plant growth regulator sprayed on crops to ensure that
the plant does not grow beyond a certain height. The popular belief in India is that if the plant
growth is regulated, then the yield is better. In India, ccc is sprayed 45 days after pruning,
generally in the month of October.

55
The permissible level of ccc in 2010 was not in the list of chemicals given by APEDA to the
laboratories to test in grapes exported to the EU. Hence, none of APEDA approved laboratories
in India tested the MRL for ccc. The outcome was that Indian grapes failed to meet the
laboratory tests in the EU because ccc levels were beyond the permissible level.
The survey found that different stakeholders have different views on what happened in 2010.
These are presented below:
Exporter’s View: All the exporters surveyed claimed that they did not have any notification
from APEDA to test the MRLs of ccc nor were they aware that the EU had imposed such a
limit. As a result, Indian laboratories did not test for the presence of ccc in Indian grapes.
Exporters pointed out that if they were aware of the requirement, they would have adhered to
it. Although the exporters and farmers blamed APEDA for the miscommunication, they also
said that the importers did not communicate to them the MRL for ccc nor did they regularly
monitor the EC websites of RASFF. Thus, there was an information gap.
Exporters exported their consignment under the impression that they had done the necessary
laboratory testing and the reports had given export clearances. However, the test conducted at
the EU port of entry on the same consignment rejected the consignments because ccc residue
was over the permissible level of MRL, which was 0.05 mg/kg. As a consequence of the
rejections, Indian exporter suffered tremendous losses. While the overall loss to the industry
during the period was estimated to be around INR 2500 million (EUR 33.3 million), the loss
of individual companies ranged between INR 25 million (EUR 0.33 million) to INR 100
million (EUR 1.33 million) depending on the size of the export consignments.69
When asked what they did with the containers that were detained at EU ports, some exporters
said that they diverted the rejected products to other markets such as the Russian, East European
and the Middle Eastern markets, since these were less restrictive. Some exporters brought the
products back to India and sold them in the Indian market, while there were others who had to
destroy the products at the port to save the additional cost of reverse shipment since grapes are
perishable commodities.
When asked about how the rejection at the EU ports affected exporters and farmers, both
farmers and exporters said that they had lost a significant amount of money. Some of them
were unable to repay bank loans on time and became defaulters. Some of them brought back
the shipment or stopped exports and then sold the produce in the domestic market. Further,
farmers pointed out that if an exporter sources grapes from a farmer and if the produce gets
rejected in the EU, then the farmer does not get a good price for the next harvest’s produce.
The farmers pointed out that they have to face volatile prices (they also get low prices if the
harvest is good), and the risk of unforeseen thunderstorm and rain, which can damage the crop,
etc., increasing their production risks. Other agents in the supply chain such as pack house
69 See http://timesofindia.indiatimes.com/city/pune/Grape-export-suffers-loss-of-Rs-250-
crore/articleshow/6216912.cms (accessed on 22 August, 2016) and findings from primary interactions.

56
owners were also financially affected by the EU’s rejection and saw a business slowdown for
two years.
Most exporters argued that it was the responsibility of APEDA and NRC to have
communicated the EU requirement to the testing laboratories. Some further added that the
Department of Commerce was perhaps negotiating with the EC on behalf of exporters to reduce
the ccc MRL; as a result, no communication was made on this issue. Whatever may have been
the case, since the laboratories did not test for ccc, farmers and exporters suffered a huge
financial loss. Consequently, some of them such as Sahyadri Farms filed cases against APEDA
either directly or through the Maharashtra Rajya Draksha Bagaitdar Sangh.
After this rejection, a series of meetings and interactions was held with APEDA and farmers
and exporters and the latter became aware of the ccc requirement. Further, APEDA approved
laboratories started testing for ccc MRLs as per the EC’s requirements. While, in the survey,
exporters do mention that the EC follows stringent health and safety standards, they also said
that they would try to adhere to those standards if they were made aware of them. They pointed
out that the fact that the export of table grapes from India to the EU has been rising since 2010
indicates that exporters and farmers can adhere to EC standards.
Further, it is an export requirement that there should be complete supply chain traceability from
farmers to the retailer and the survey found that grape exporters and farmers (including small
sized exporters and farmers) have been successful in establishing traceability.
APEDA’s View: According to APEDA, the ccc issue came to the notice of Indian policymakers
and APEDA as early as 2004 when around 2500-3000 containers of table grapes were detained
in Germany and the Netherlands. After a discussion with exporters and other stakeholders, a
residue monitoring protocol was installed and GrapeNet was put in place.70 There are a number
of chemicals that are restricted by the EU and if all the chemicals are to be tested in the
laboratories, then it would entail a huge cost to exporters and may make export non-viable
economically. Therefore, only those chemicals are tested that are identified under the residue
monitoring protocol. The list of chemicals to be tested under the residue monitoring protocol
is updated every year after discussions with exporters. Exporters are asked to consult their
importers to get information from the EU. None of the exporters had raised the issue of ccc.
In 2010, when the containers were detained in EU ports, ccc was not in the residue monitoring
protocol list and hence, APEDA approved laboratories did not test the MRLs of ccc. APEDA
immediately raised this issue with the EU authorities and came to know that importers had
asked for this requirement. While APEDA has tried to provide full support to exporters and
farmers, in this case, exporters and farmers did suffer losses.
It was after this incident that APEDA, following discussions with farmers, launched the online
system called GrapeNet to enable traceability throughout the grape supply chain from farmers
to retailers/wholesalers. GrapeNet also ensures effective communication and information flow
70 http://www.apeda.gov.in/apedawebsite/Grapenet/GrapeNet_new.htm (accessed on 21 December, 2016)
57
between policy makers in India and the EU, the nodal agency in India, exporters and farmers.
Besides, it provides access to data that helps scientifically argue SPS cases.
The GrapeNet system is updated from time to time to incorporate changing export requirements
in the EU and ensure that farmers are updated with EU import norms. The system also ensures
a high level of compliance with EC’s import norms, which entails checks and balances at
several stages. With the GrapeNet, the farmers also became aware of good agricultural
practices and have started implementing these.
View from the EU: According to the EC, the food safety regulations are put in place to protect
EU consumers, EU producers as well as companies exporting to the EU. Every country/group
of countries has the right to fix the level of MRLs depending upon food safety requirements.
The MRLs for ccc for the EU came into effect in the year 2000 and it was included in Annex
1 to Directive 91/414/EEC on 1 December, 2009. This was communicated to APEDA. Further,
Regulation (EC) No. 396/2005 of the European Parliament71 provides for “submission of
applications for MRL” under Articles 6, 7, 8 and 9 of the Act.
Article 6, (1) of the Regulation (EC) No. 396/2005 states that
“Where a Member state envisages granting an authorisation or a provisional
authorisation for the use of a plant protection product in accordance with Directive
91/414/EEC, that Member state shall consider whether, as a result of such use, an
existing MRL set out in Annex II or III to this Regulation needs to be modified,
whether it is necessary to set a new MRL, or whether the active substance should be
included in Annex IV. If necessary it shall require the party requesting the
authorisation to submit an application in accordance with Article 7.”
Article 6, (2) further specifies that
“All parties demonstrating, through adequate evidence, a legitimate interest in
health, including civil society organisations, as well as commercially interested
parties such as manufacturers, growers, importers and producers of products
covered by Annex I may also submit an application to a Member state in accordance
with Article 7.”
Article 7 spells out the “Requirements relating to applications of MRL”
However, there were no concerns raised by India against the MRL of ccc prior to the year 2010.
Further, the EC points out that even though there has been a study by EFSA regarding the MRL
of ccc, its opinions as that of risk assessors are only part of the process. The final decision is
taken by risk managers, in that case the EC/DG SANTE, and every decision needs to be
71 Regulation and of the Council of 23 February, 2005 on Maximum Residue Levels of Pesticides in or on
Food and Feed of Plant and Animal Origin and Amending Council Directive 91/414/EEC accessible at
http://eur-lex.europa.eu/LexUriServ/LexUriServ.do?uri=OJ:L:2005:070:0001:0016:en:PDF (accessed on 23
August, 2016)
58
justified. Keeping in view that all age groups consume table grapes in the EU, the EC has set
the standards to suit the consumption levels of children as well as adults.
59
4.4 The Recent ‘ccc’ Issue
The issue of MRL for grapes again came up in July 2016 via EU’s notification to the WTO
Committee on Sanitary and Phytosanitary Measures (SPS) Notification No. G/SPS/N/EU/168
(160-3636) dated 7 July, 2016.72 In that, the EC proposed to lower the MRL for ccc in table
grapes from 0.05 mg/kg to 0.01 mg/kg. The proposed date of adoption of the new limit is
February 2017. APEDA is in the process of discussing the issue with the Indian Department of
Commerce and EC. The survey showed that approximately 24.5 per cent of Indian table grapes
exported to the EU may not meet this requirement if the MRL limits are lowered to 0.01mg/kg.
This can adversely affect/lower Indian exports of grapes to the EU. Further, while every
country has a right to protect its consumers, in Japan, the MRL for ccc is 0.10 mg/kg and for
Australia and New Zealand, it is 0.75 mg/kg. In these countries, there are strong consumer
protection regulations and food safety standards. Yet the MRLs for ccc are not as stringent as
that proposed by the EC.
On a 6-point rating scale, the survey respondents were asked to rank the EU as an export market
with 1 being a “very easy market to export” and 6 being “the most difficult market to export”.
On an average, the EU was given a rating of 5, i.e., “very difficult market to export”. It was
pointed out during the survey that this is because the EU seems to have the most rigid MRLs
among India’s export destination for table grapes. APEDA and exporters feel that the EU needs
to justify the MRL limits through scientific study. EFSA has conducted a study in March 2016
entitled “Review of Existing Maximum Residue Levels for Chlormequat according to Article
12 of the Regulation EC No. 396/2005”73 but this study does not cover table grapes. Hence,
the scientific justification for this policy is not available to Indian exporters and policymakers.
Further, although Codex Alimentarius Commission has not fixed or recommended the MRL in
the case of table grapes, for other products it has recommended the MRL of 0.05 mg/kg as safe.
A study conducted by the EFSA also found that the residue concentrates of ccc is safe up to
1.06 mg/kg.74
In October 2016, India expressed concerns regarding proposed amendments to Regulation (EC)
No. 396/2005 to change maximum residue levels (MRLs) for bitertanol, tebufenpyrad and
chlormequat in certain products including table grapes. In the case of table grapes specifically,
India highlighted its particular concern with the lowering of MRLs for chlormequat in table
grapes from 0.05mg/kg to 0.01mg/kg, which would seriously impact Indian grape exports to
the EU, which accounted for almost 25 per cent of India's grape exports. India further noted
that according to an EFSA study conducted in 2010, residue concentrates of chlormequat in
table grapes were safe up to 1.06mg/kg. Codex had not fixed any acceptable daily intake limits
for chlormequat in table grapes, but had recommended an MRL of 0.05mg per kg. India further
highlighted that other countries had set higher MRLs for chlormequat in table grapes, such as
Australia and New Zealand at 0.75mg/kg or Japan at 0.1mg/kg. The scientific reference
72 For details see http://ec.europa.eu/health/endocrine_disruptors/docs/wto_eu166_en.pdf (accessed on 7
September, 2016) 73 For details see https://www.efsa.europa.eu/en/efsajournal/pub/4422 (accessed on 7 September, 2016) 74 For details see http://www.bezpecnostpotravin.cz/UserFiles/File/Kvasnickova2/EFSA_chlormequat.pdf
(accessed on 5 September, 2016.

60
included in the EU notification did not provide any specific recommendation on grapes. Thus
the proposed lower MRL had no scientific justification, was not based on any relevant
international standard and would have negative trade effects.75
In its reply (dated 4 October 2016) to the comments submitted by India regarding SPS
Notification G/SPS/N/EU/168, the EU recognised the efforts made by Indian producers and
regulatory bodies to comply with the existing value of 0.05mg/kg. In the meantime, the EU
was informed that trial data supporting the current value of 0.05mg/kg were submitted by the
manufacturer and scheduled for evaluation by the Joint Food and Agriculture Organization
(FAO)/World Health Organization (WHO) Meeting on Pesticide Residues (JMPR) in 2017.
The EU is considering maintaining the MRL of 0.05 mg/kg for a temporary period to allow the
assessment by JMPR and establishment of a Codex MRL. If no concerns are raised by EFSA,
the EU could incorporate the codex maximum residue level (CXL) into EU legislation. As per
the EC, the SPS Notification will be amended accordingly.
In the year 2010, when the Indian consignments were rejected in the EU, India did not have
scientific data to prove its case nor was there a mechanism to trace consignments to farms.
Today, the situation is different. Experts from APEDA and other trade bodies pointed out that
India should ask the EC to provide scientific justification for proposing the residue levels for
ccc so that it is not trade restrictive.
4.5 Other SPS Related Issues Faced by Grape Exporters
Constantly Changing Standards: The EU changes it regulations frequently causing
difficulties to farmers and exporters. For example, on 14 March, 2016, the EC sent a
notification to the WTO Committee on Sanitary and Phytosanitary Measures76
(G/SPS/N/EU/158) indicating its intention to reduce the maximum residue levels for 3-
decen-2-one, acibensolar-S-methyl and hexachlorobenzene in products such as table
grapes, eggplants, beans, peas and rice from 0.1 to 0.01 respectively. According to the
notification,
“lower MRL levels are set after updating the limit of determination and /or deleting old
uses which are not authorized any more in the European Union or for which there is not
enough data for an MRL to be set.”77
75 Source: WTO Committee on Sanitary and Phytosanitary Measures Document G/SPS/GEN/204/Rev.17
Dated 7 March 2017. Available at
http://spsims.wto.org/en/OtherDocuments/Search?DoSearch=True&DocumentSymbol=G%2FSPS%2FGE
N%2F204%2FRev.17&DistributionDateFrom=07%2F03%2F2017&DistributionDateTo=07%2F03%2F201
7&SubmittingMembers=&SubmittingObservers=&SubmittingObserverOrganizations=&Secretariat=&Dev
elopmentStatus=&GeographicGroups=&Title=&Keywords=&DocumentTypes= (accessed on 17 April,
2017) 76 Link to the portal for the notifications: https://docs.wto.org/dol2fe/Pages/FE_Search/FE_S_S005.aspx
(accessed on 16 September 2016) 77 https://docs.wto.org/dol2fe/Pages/FE_Search/DDFDocuments/231008/q/G/SPS/NEU170.pdf (accessed on
21 September, 2016). See Page 1 of the document.

61
Again on 5 April, 2016, the EC sent a notification to the WTO Committee on Sanitary and
Phytosanitary Measures (G/SPS/N/EU/160)78 regarding lowering the MRL for cymoxanil,
phosphine and phosphide salt, sodium 5-notriguaicolate and others for products like table
grapes, mangoes and eggplant, among others, giving the same reasons as mentioned above.
On the same day, another notification was given to the WTO Committee on Sanitary and
Phytosanitary Measures (G/SPS/N/EU/161)79 in which EC proposed new residue
definitions for substances such as acrinathrin, befenthrin and carbetamide and lowered the
level of MRL for these substances for produce such as table grapes. The changes in the
MRLs of grapes are compiled in Table 4A.1 in Annexure A4.1.
Issues with Health and Safety Norms: Export requirements for the EU are often more
stringent than Codex Alimentarius standards or the standards of other developed countries
(see Hoekman, 1998 and Henson and Loader, 2000). Moreover, private retailers also
impose their own standards, which are even more stringent than EU standards, partly as a
means to differentiate the products in their stores from other stores in the EU. As a result,
to secure a market, Indian exporters have to meet various standards.
Lack of Harmonisation in Testing: Laboratory tests are conducted both in India and the
EU, which results in the imposition of costs twice over. The survey found that the average
cost for the laboratory test in India is around INR 8000-9000 (EUR 106.62-119.95); in the
EU the cost can go up to INR 40,000 (EUR 533.11). Additionally, the test reports may vary
as different methods of sampling are followed. There are other issues related to
harmonisation of standards for testing. If the product is only tested in EU member countries
and fails the test, exporters have to bear the cost of transportation to the EU member state
and then to other destinations. If the grapes fail the test in India, [then exporters can directly
export it to other markets from India. Thus, survey participants differed in their opinions
on whether there should be only one laboratory testing or not.
Issues with GrapeNet: The concerned authority of the state governments in grapes growing
states (state horticulture department, district superintending
agriculture/tahsildar/horticulture officer) pointed out that in the traceability system, they
have to take sole responsibility for any incorrect or incomplete information. During the
interview with some of these officials, it was pointed out that they do not have simple
equipment like internet enabled mobile tablets to upload information from the fields. They
have to visit the field several times and the work is time consuming as they have to
manually enter the data in their system. There are also chances of making errors in the
process.
78 http://www.spsvietnam.gov.vn/Data/File/Notice/586/NEU160.pdf (accessed on 21 September, 2016) 79 http://www.spsvietnam.gov.vn/Data/File/Notice/585/NEU161.pdf (accessed on 21 September, 2016)

62
4.6 The Way Forward
The survey reveals that one of the major challenges facing Indian table grape exporters is the
limited potential that the EU market offers. While the saturation of the EU market has been
offset to an extent by the emergence of new markets such as Thailand, China, Russia and the
Middle East, the shift in preference towards coloured varieties of grapes demands a shift away
from the present domination of colourless varieties in India. A government initiative to accept
offers from countries like South Africa to export varieties of coloured grape saplings will
benefit grape farmers as well as ensure increased grape exports from India.
Many exporters pointed out during the survey that the government needs to more pro-active in
its approach. Apart from providing support to wipe out the information gaps that have resulted
in inflicting large losses on grape farmers, the government also needs to step in to ensure the
adoption of improved technology as well as to train farmers and district level officers on
various aspects such as fertiliser and pesticide use. The EU-India CITD programme offers
opportunities for such training.
It is also necessary to step up research to develop new varieties of grapes using safe agricultural
practices. Often, policies and remedies that are followed in other countries are adopted without
taking into account their suitability to Indian climatic and other conditions. Adequate funding
also needs to be provided for research that enables India to counter claims related to, for
instance, MRL for chemicals. India should have a robust database and scientific research to
counter proposals such as the one submitted by the EC to the WTO in July 2016. Agricultural
universities should be encouraged to do research on such issues.
Policymakers, exporters and processors pointed out that if EC comes up with changes in MRLs
as has happened in the case of ccc in July 2016, India should raise the issue in the WTO
requesting scientific justification for such proposals. The EC on its part should provide the
scientific justification. It needs to be pointed out that the EFSA study of March 201680 does not
cover table grapes. The only EFSA report relevant to table grapes as of date and which is
available in the public domain is the EFSA 2010 study on “Risk for Public Health due to the
Presence of Chlormequat in Table Grapes from India”, which concludes that:
“The calculated acute threshold residue concentration for chlormequat on table
grapes is 1.06 mg/kg. Consequently EFSA concludes that no acute consumer health risk is
expected if table grapes with a mean chlormequat residue concentration of 1.06 mg/kg are
consumed. The calculation is based on the most critical European consumer groups (German
Child, body weight 16.15 kg) eating in one eating occasion 211.5 g of table grapes (13.1 g
grapes per kg body weight). The calculation also takes into account a possible inhomogeneous
distribution of the residues within the lot of grapes analysed.”81
80 See https://www.efsa.europa.eu/en/efsajournal/pub/4422 (accessed on 21 December, 2016) 81 See Page 1 of the Statement of EFSA on “Risk to Public Health Due to Presence of Chlormequat in Table
Grapes from India”, European Food Safety Authority, Parma, Italy accessible at
https://www.efsa.europa.eu/en/efsajournal/pub/1590 (accessed on 7 September, 2016)

63
If EC wants to revise the MRL to 0.01 mg/kg for table grapes, a scientific study that justifies
such a move should be made available to Indian policymakers, APEDA, exporters and farmers
or else this should be considered an SPS barrier.
Besides, APEDA needs to involve state-level departments in capacity building initiatives. It
was pointed out that technical assistance should percolate down to the farmers, exporters and
state-level officers rather than being confined to central level agencies.
Another aspect that needs attention is the issue related to the disadvantage that Indian table
grapes suffer from because of the absence of a trade agreement with the EU that results in
exports from India attracting a tariff while exports from countries with which the EU has an
agreement attracts no tariff. Since India does not have a trade agreement with the EU, exports
of table grapes face an eight per cent tariff vis-à-vis zero tariff of grapes from countries which
have a trade agreement with the EU. The EU-India Broad-based Trade and Investment
Agreement may be useful in overcoming this barrier. Further, the agreement can be
instrumental in harmonising standards across India and the EU. With mutual recognition of
standards and laboratory certifications, testing can take place in one country only. While it is
possible that exporters are likely to resist testing in EU member countries given the cost of
transportation and the risk of getting their consignments rejected, this will offer exporters the
choice to decide what they want to do.
The survey also highlighted the lack of marketing initiatives to boost the export of Indian table
grapes. APEDA needs to market Indian grapes more aggressively in emerging markets like
China.
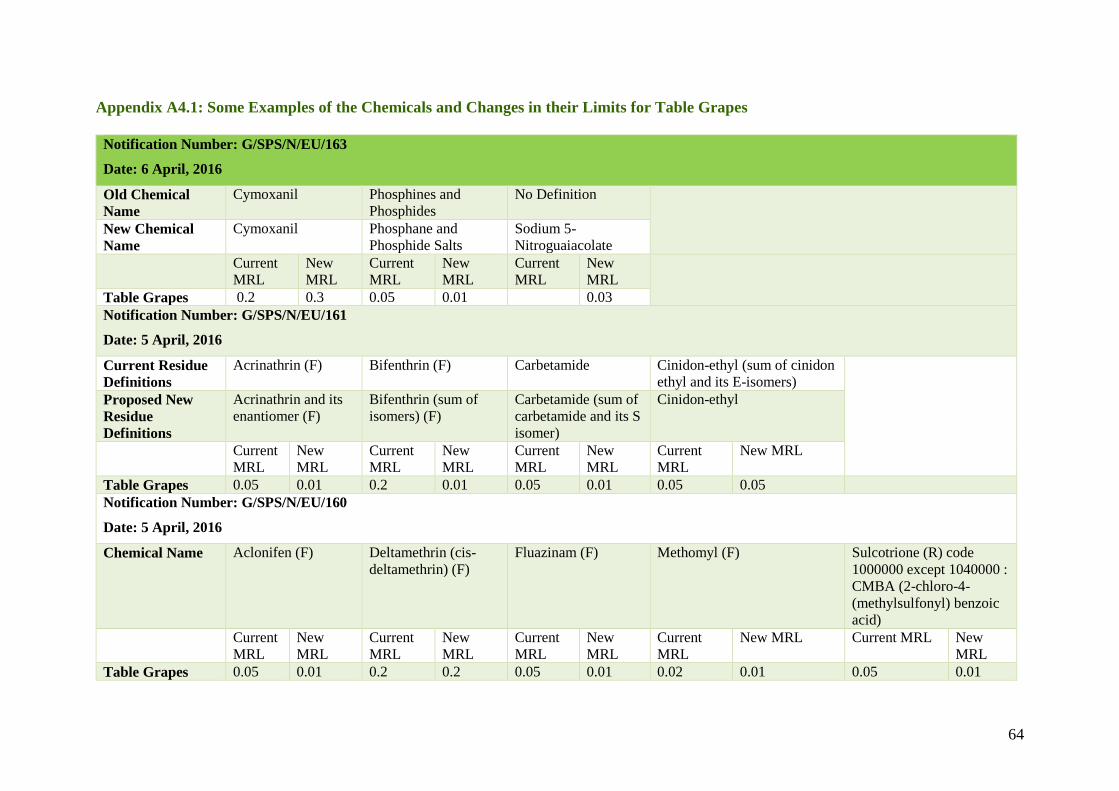
64
Appendix A4.1: Some Examples of the Chemicals and Changes in their Limits for Table Grapes
Notification Number: G/SPS/N/EU/163
Date: 6 April, 2016
Old Chemical
Name
Cymoxanil Phosphines and
Phosphides
No Definition
New Chemical
Name
Cymoxanil Phosphane and
Phosphide Salts
Sodium 5-
Nitroguaiacolate
Current
MRL
New
MRL
Current
MRL
New
MRL
Current
MRL
New
MRL
Table Grapes 0.2 0.3 0.05 0.01 0.03
Notification Number: G/SPS/N/EU/161
Date: 5 April, 2016
Current Residue
Definitions
Acrinathrin (F)
Bifenthrin (F) Carbetamide Cinidon-ethyl (sum of cinidon
ethyl and its E-isomers)
Proposed New
Residue
Definitions
Acrinathrin and its
enantiomer (F)
Bifenthrin (sum of
isomers) (F)
Carbetamide (sum of
carbetamide and its S
isomer)
Cinidon-ethyl
Current
MRL
New
MRL
Current
MRL
New
MRL
Current
MRL
New
MRL
Current
MRL
New MRL
Table Grapes 0.05 0.01 0.2 0.01 0.05 0.01 0.05 0.05
Notification Number: G/SPS/N/EU/160
Date: 5 April, 2016
Chemical Name Aclonifen (F) Deltamethrin (cis-
deltamethrin) (F)
Fluazinam (F) Methomyl (F) Sulcotrione (R) code
1000000 except 1040000 :
CMBA (2-chloro-4-
(methylsulfonyl) benzoic
acid)
Current
MRL
New
MRL
Current
MRL
New
MRL
Current
MRL
New
MRL
Current
MRL
New MRL Current MRL New
MRL
Table Grapes 0.05 0.01 0.2 0.2 0.05 0.01 0.02 0.01 0.05 0.01

65
Notification Number: G/SPS/N/EU/158
Date: 14 March, 2016
Chemical Name 3-decen-2-one Acibenzolar-S-methyl Hexachlorobenzene
(F)
Current
MRL
New
MRL
Current
MRL
New
MRL
Current
MRL
New
MRL
Table Grapes 0.1 0.01 0.01 0.01 0.01
Notification Number: G/SPS/N/EU/144
Date: 16 September, 2015
Chemical Name Atrazine (F) Potassium
Thiocyanate
Current
MRL
New
MRL
Current
MRL
New
MRL
Table Grapes 0.05 0.05 0.01
Notification Number: G/SPS/N/EU/136
Date: 29 June, 2015
Old Chemical
Name
Diethofencarb Mesotrione Metosulam Propiconazole Spiroxamine (R)
New Chemical
Name
Diethofencarb Mesotrione Metosulam Propiconazole (F) Spiroxamine (A) (R)
Curren
t MRL
New
MRL
Current
MRL
New
MRL
Current
MRL
New MRL Current
MRL
New MRL Current
MRL
New MRL
Table Grapes 1 0.01 0.05 0.01 0.01 0.01 0.3 0.3 1 0.6
Source: Extracted from https://docs.wto.org/dol2fe/Pages/FE_Search/FE_S_S005.aspx (accessed on 16 September, 2016)

66
Chapter 5: Export of Basmati Rice from India: Opportunities and Constraints in
the EU Market
India is the largest producer of Basmati rice in
the world and it is an important commodity for
trade between India and the EU. India has
export potential in this product and there is
demand for Indian Basmati rice in the EU. To
understand the opportunities and barriers in
the export of Basmati rice from India, a survey
was conducted in Punjab, Haryana, Uttar
Pradesh and Delhi. It included in-depth
meetings with APEDA, EIC, All India Rice
Exporters Association (AIREA), and exporters
and processors. The survey covered 18
companies, out of which 17 are processors-
cum-exporters and one is only an exporter.
Among them, 11 companies export only Basmati rice, whereas the remaining 7 export both
Basmati and non-Basmati varieties of rice. All the exporters have more than a decade of
experience of exporting to the EU.
5.1 Introduction
“Basmati” is a variety of long grain aromatic rice grown in specific geographical areas of the
Himalayan foothills of the Indian sub-continent. This variety of rice is identified by three
distinct qualities: (a) long slender grain, (b) distinct aroma and flavour, and (c) post-cooking
elongation (at least twice its original size). India is the largest producer of Basmati rice in the
world followed by Pakistan.
This fragrant variety of rice has a high commercial value and demand in the international
market, because of which, over time, many traders and farmers have indulged in fraudulent
practices by mixing Basmati rice with similar looking non-Basmati rice or lower quality
Basmati rice (Fridez, 2016). To prevent this, India has a Geographical Indication (GI) for
Basmati rice in the WTO.82 According to the WTO ruling; only certain varieties of rice grown
in India and Pakistan can be labelled as Basmati.83 Only 23 varieties84 of long grain aromatic
82 A geographical indication (GI) is a name or sign used on certain products which corresponds to a specific
geographical location or origin (e.g. a country). The use of a geographical indication may act as a
certification that the product possesses certain qualities, is made according to traditional methods, or enjoys
a certain reputation, due to its geographical origin. 83 https://www.researchgate.net/profile/Dr_Joginder_Singh2/publication/274376252_Sustaining_rice_
crop_through_exploring_potentialities_of_basmati_with_reference_to_Indian_Punjab/links/551cccde0cf20
d5fbde55b27.pdf (accessed on 16 June, 2016) 84 A 24th variety is in the process of being recognised, according to the information provided by All India Rice
Exporters Association.
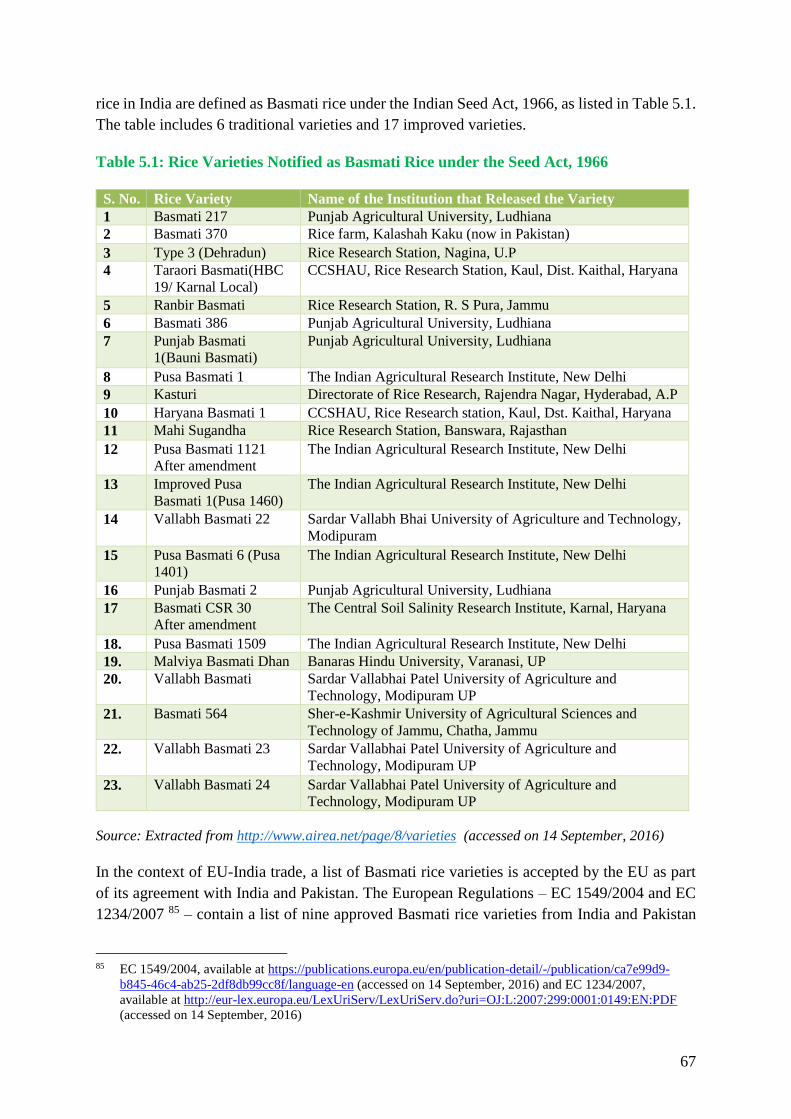
67
rice in India are defined as Basmati rice under the Indian Seed Act, 1966, as listed in Table 5.1.
The table includes 6 traditional varieties and 17 improved varieties.
Table 5.1: Rice Varieties Notified as Basmati Rice under the Seed Act, 1966
S. No. Rice Variety Name of the Institution that Released the Variety
1 Basmati 217 Punjab Agricultural University, Ludhiana
2 Basmati 370 Rice farm, Kalashah Kaku (now in Pakistan)
3 Type 3 (Dehradun) Rice Research Station, Nagina, U.P
4 Taraori Basmati(HBC
19/ Karnal Local)
CCSHAU, Rice Research Station, Kaul, Dist. Kaithal, Haryana
5 Ranbir Basmati Rice Research Station, R. S Pura, Jammu
6 Basmati 386 Punjab Agricultural University, Ludhiana
7 Punjab Basmati
1(Bauni Basmati)
Punjab Agricultural University, Ludhiana
8 Pusa Basmati 1 The Indian Agricultural Research Institute, New Delhi
9 Kasturi Directorate of Rice Research, Rajendra Nagar, Hyderabad, A.P
10 Haryana Basmati 1 CCSHAU, Rice Research station, Kaul, Dst. Kaithal, Haryana
11 Mahi Sugandha Rice Research Station, Banswara, Rajasthan
12 Pusa Basmati 1121
After amendment
The Indian Agricultural Research Institute, New Delhi
13 Improved Pusa
Basmati 1(Pusa 1460)
The Indian Agricultural Research Institute, New Delhi
14 Vallabh Basmati 22 Sardar Vallabh Bhai University of Agriculture and Technology,
Modipuram
15 Pusa Basmati 6 (Pusa
1401)
The Indian Agricultural Research Institute, New Delhi
16 Punjab Basmati 2 Punjab Agricultural University, Ludhiana
17 Basmati CSR 30
After amendment
The Central Soil Salinity Research Institute, Karnal, Haryana
18. Pusa Basmati 1509 The Indian Agricultural Research Institute, New Delhi
19. Malviya Basmati Dhan Banaras Hindu University, Varanasi, UP
20. Vallabh Basmati Sardar Vallabhai Patel University of Agriculture and
Technology, Modipuram UP
21. Basmati 564 Sher-e-Kashmir University of Agricultural Sciences and
Technology of Jammu, Chatha, Jammu
22. Vallabh Basmati 23 Sardar Vallabhai Patel University of Agriculture and
Technology, Modipuram UP
23. Vallabh Basmati 24 Sardar Vallabhai Patel University of Agriculture and
Technology, Modipuram UP
Source: Extracted from http://www.airea.net/page/8/varieties (accessed on 14 September, 2016)
In the context of EU-India trade, a list of Basmati rice varieties is accepted by the EU as part
of its agreement with India and Pakistan. The European Regulations – EC 1549/2004 and EC
1234/2007 85 – contain a list of nine approved Basmati rice varieties from India and Pakistan
85 EC 1549/2004, available at https://publications.europa.eu/en/publication-detail/-/publication/ca7e99d9-
b845-46c4-ab25-2df8db99cc8f/language-en (accessed on 14 September, 2016) and EC 1234/2007,
available at http://eur-lex.europa.eu/LexUriServ/LexUriServ.do?uri=OJ:L:2007:299:0001:0149:EN:PDF
(accessed on 14 September, 2016)

68
which includes Basmati 370, Type-3 (Dehradun), Basmati 217, Ranbir Basmati, Taraori
Basmati (HBC-19), Basmati 386, Kernel (Basmati), Super Basmati and Pusa Basmati
(European Commission, 201086; Fridez, 2016).
UK-based associations such as Rice Association, British Rice Millers Association and the
British Retail Consortium (BRC) along with the Local Authorities Co-ordinators of Regulatory
Services (LACORS) and the Association of Public Analysts (APA), the Federation of European
Rice Millers and the Indian and Pakistani rice industry associations such as the All India Rice
Exporters Association (AIREA) and the Rice Exporters Association of Pakistan (REAP) agreed
on a ‘Code of Practice on Basmati Rice’,87 which is a voluntary code that lays down minimum
specifications for Basmati rice sold in the UK as regards import, milling and packaging to
protect consumers from adulterated rice. This code has been approved for an additional six
varieties of Basmati rice, namely, Basmati 198, Basmati 385, Haryana Basmati (HKR 228/IET
10367), Kasturi (IET 8580), Mahi Suganda and Punjab Basmati (Bauni Basmati). It also lists
around 20 rice varieties that are not approved as Basmati rice and which may be used in
fraudulent practices as fake Basmati (Fridez, 2016). This code also allows for a certain level of
tolerance in mixing Basmati with non-approved varieties of Basmati rice, where the maximum
level for non-approved varieties of Basmati rice was fixed at 7 per cent. Basmati rice exporters
have to conduct a deoxyribonucleic acid (DNA) analysis to determine the authenticity of the
Basmati rice and to check the proportion in which non-approved varieties are present.
In India, the EIC is the nodal agency for ensuring that all Basmati rice exports from India to
the EU meet EU standards. The EIC monitors, supervises and audits rice mills and conducts
DNA and other tests in EIC approved laboratories.
5.2 Production of Basmati Rice
In India, the production of Basmati rice has increased from 7217.67 thousand MT in 2010 to
8773.78 thousand MT in 2014.88 Over the past 5-10 years, medium and large landholders have
been cultivating Basmati rice on landholdings larger than the all India average landholding
size. In the past, exporters sourced the Basmati rice from mandis, as pointed out by most of the
exporters, processors and manufacturers that participated in the survey. However, of late, some
companies are entering into contract farming and have started directly sourcing from farmers.
Studies have shown that contract farming is encouraging small and marginal farmers to
cultivate Basmati rice (Rangnekar et al., 2010).
The total area under production of Basmati rice has increased from approximately 1.6 million
hectares in 2012-13 to 2.1 million hectares in 2014-15, which is an increase of almost 31 per
86 Link to the report: http://ec.europa.eu/agriculture/external-studies/2010/basmati/fulltext_en.pdf (accessed
on 14 September, 2016) 87 Code of Practice on Basmati Rice; available at
www.riceassociation.org.uk/.../10/Basmati%20Rice%20Code%20of%20Practice.pdf (accessed on 14
September, 2016) 88 Source: http://www.airea.net/page/60/statistical-data/state-wise-basmati-rice-production (accessed on 12
September, 2016)

69
cent.89 The total production and state-wise production of Basmati rice is given in Table 5.2.
The largest production of Basmati rice is in Punjab (with a share of approximately 40 per cent),
followed by Haryana (39 per cent) and Uttar Pradesh (17 per cent).
Table 5.1: State-wise Area and Production of Basmati Rice in 2012-2013 and 2014-2015
States 2012-2013 2014-2015
AREA
(’000 ha)
PRODUCTION
(’000 MT)
AREA
(’000 ha)
PRODUCTION
(’000 MT)
Punjab 590.01 2292.75 857.68 3498.88
Haryana 711.11 2898.98 832.54 3701.88
Uttar Pradesh 318.75 1270.09 354.39 1260.69
Uttarakhand 18.30 54.16 20.34 66.41
Jammu and Kashmir 37.28 92.66 68.45 240.77
Himachal Pradesh 1.00 3.40 0.45 2.15
Delhi 1.00 4.09 0.70 3.00
Total 1677.45 6616.13 2134.55 8773.78
Source: Extracted from APEDA report Basmati Acreage & Yield Estimation in Punjab, Haryana, Delhi,
Uttarakhand, Himachal Pradesh, Western Uttar Pradesh and Parts of Jammu & Kashmir, Volume 6,
Table 3, page 6; available at http://apeda.gov.in/apedawebsite/trade_promotion/BSK-2014/Report-
Volume-VI.pdf (accessed on 15 June, 2016)
5.3 International Trade and Key Markets for Basmati Rice
In the global market, rice is traded under two broad categories, namely, fragrant and non-
fragrant. Within the category of fragrant rice, India is the leading exporter of Basmati rice to
the global market, followed by Pakistan. Indian Basmati rice exports mainly consist of varieties
such as Pusa Basmati, Basmati 370 and Taraori Basmati.
Basmati exports from India have increased steadily from 1.16 million MT in 2004-05 to an
estimated 3.70 million MT in 2014-15. In 2014-15, India exported Basmati rice worth EUR
3,563,100,47290 (INR 275.97 billion).91 In the year 2013-14, India exported 3,757,271.44 MT
quantity of Basmati rice, which decreased to 3,702,260.12 MT in 2014-2015. In 2015-2016,
India’s export of Basmati rice to the world increased to a total of 4,045,796.25 MT.92 In 2014-
15, approximately 42 per cent of Basmati rice produced in India was exported. Some of the
well-known Basmati rice brands exported from India include Daawat, India Gate, Kohinoor,
Lal Qilla, Amira, Hanuman Basmati, Mezban and Aeroplane.
89 Source: APEDA 90 Converted from INR using the average exchange rate for 2014, calculated using the monthly rates from
http://ec.europa.eu/eurostat/web/exchange-
rates/data/database?p_p_id=NavTreeportletprod_WAR_NavTreeportletprod_INSTANCE_yFWTDHW2Gf
Rx&p_p_lifecycle=0&p_p_state=normal&p_p_mode=view&p_p_col_id=column-2&p_p_col_count=1;
(accessed on 12 September, 2016); EUR 1= INR 77.45465 91 Source: AIREA 92 Source: APEDA. Available at
http://agriexchange.apeda.gov.in/indexp/Product_description_32head.aspx?gcode=0601 (accessed on 12
September, 2016)
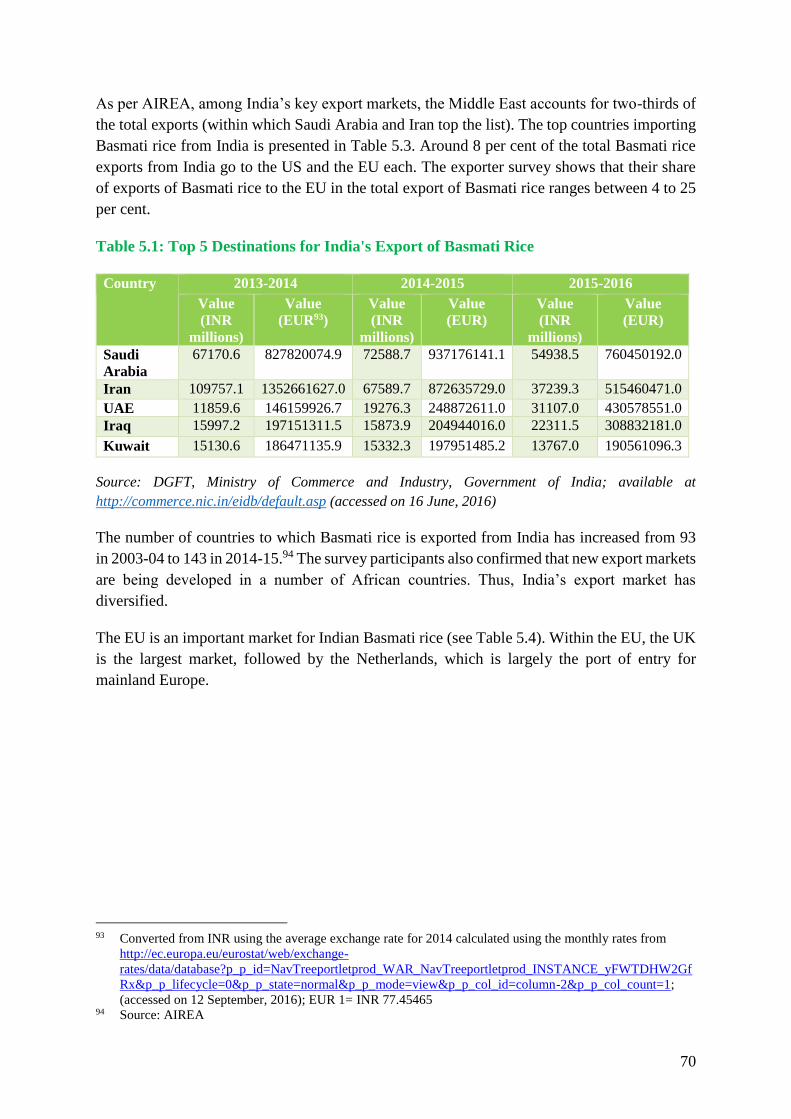
70
As per AIREA, among India’s key export markets, the Middle East accounts for two-thirds of
the total exports (within which Saudi Arabia and Iran top the list). The top countries importing
Basmati rice from India is presented in Table 5.3. Around 8 per cent of the total Basmati rice
exports from India go to the US and the EU each. The exporter survey shows that their share
of exports of Basmati rice to the EU in the total export of Basmati rice ranges between 4 to 25
per cent.
Table 5.1: Top 5 Destinations for India's Export of Basmati Rice
Country 2013-2014 2014-2015 2015-2016
Value
(INR
millions)
Value
(EUR93)
Value
(INR
millions)
Value
(EUR)
Value
(INR
millions)
Value
(EUR)
Saudi
Arabia
67170.6 827820074.9 72588.7 937176141.1 54938.5 760450192.0
Iran 109757.1 1352661627.0 67589.7 872635729.0 37239.3 515460471.0
UAE 11859.6 146159926.7 19276.3 248872611.0 31107.0 430578551.0
Iraq 15997.2 197151311.5 15873.9 204944016.0 22311.5 308832181.0
Kuwait 15130.6 186471135.9 15332.3 197951485.2 13767.0 190561096.3
Source: DGFT, Ministry of Commerce and Industry, Government of India; available at
http://commerce.nic.in/eidb/default.asp (accessed on 16 June, 2016)
The number of countries to which Basmati rice is exported from India has increased from 93
in 2003-04 to 143 in 2014-15.94 The survey participants also confirmed that new export markets
are being developed in a number of African countries. Thus, India’s export market has
diversified.
The EU is an important market for Indian Basmati rice (see Table 5.4). Within the EU, the UK
is the largest market, followed by the Netherlands, which is largely the port of entry for
mainland Europe.
93 Converted from INR using the average exchange rate for 2014 calculated using the monthly rates from
http://ec.europa.eu/eurostat/web/exchange-
rates/data/database?p_p_id=NavTreeportletprod_WAR_NavTreeportletprod_INSTANCE_yFWTDHW2Gf
Rx&p_p_lifecycle=0&p_p_state=normal&p_p_mode=view&p_p_col_id=column-2&p_p_col_count=1;
(accessed on 12 September, 2016); EUR 1= INR 77.45465 94 Source: AIREA

71
Table 5.2: India’s Export of Basmati Rice to the EU
Country
2013-14 2014-15 2015-16
Quantity
(MT)
Value (INR
millions)
Quantity
(MT)
Value (INR
millions)
Quantity
(MT)
Value (INR
millions)
United
Kingdom
118,888.2 7,858.5 136,347.3 8,998.1 187,701.7 9,328.4
Netherlands 43,532.1 2,990.2 52,231.1 3,647.6 54,731.0 2,498.8
Belgium 34,498.9 2,417.7 29,900.0 2,221.4 37,516.0 2,191.1
Italy 39,840.0 2,849.2 31,467.4 2,179.7 36,805.6 1,815.3
France 18,971.6 1,270.3 18,009.2 1,104.9 21,951.4 1,063.8
Germany 9,295.4 833.6 13,513.5 1,188.0 15,005.7 983.6
Sweden 4,313.1 354.5 5,702.4 444.5 8,005.5 489.3
Poland 2,316.0 152.0 4,718.3 261.6 6,591.6 260.0
Spain 5,695.4 447.7 3,142.1 226.3 2,806.6 160.5
Portugal 3,952.0 270.8 4,328.0 236.8 2,763.0 109.5
Denmark 452.7 37.8 962.8 75.0 1,474.3 90.2
Greece 1,590.0 120.4 1,748.1 123.9 1,372.0 73.1
Austria 448.0 50.7 871.6 81.4 835.9 63.9
Ireland 236.0 20.1 428.0 31.9 953.5 56.1
Cyprus 706.0 56.6 572.9 44.1 767.2 46.4
Finland 82.0 7.4 81.0 6.4 297.0 19.6
Czech
Republic
33.6 2.8 219.0 14.0 279.9 14.4
Lithuania 69.0 7.0 170.0 12.8 154.0 11.6
Malta 20.0 1.7 25.0 2.2 107.0 7.2
Bulgaria 25.0 2.1 25.0 2.0 118.0 6.2
Romania 44.0 4.0 93.0 7.2 111.0 6.0
Estonia 39.0 3.5 43.0 3.5 55.0 3.1
Croatia 10.0 0.8 59.0 4.2 42.2 2.3
Latvia 38.0 3.3 39.0 3.3 17.0 1.3
Hungary 0.0 0.0 333.0 23.2 0.0 0.0
Slovak
Republic
75.0 5.8 0.0 0.0 0.0 0.0
Slovenia 4.0 0.3 0.0 0.0 0.0 0.0
Luxembourg 0.0 0.0 0.0 0.0 0.0 0.0
Total 285,174.9 19,768.8 305,029.6 20,944.1 380,462.0 19,301.9
Source: Compiled from APEDA. Available at http://agriexchange.apeda.gov.in/indexp/Product_
description_32head.aspx?gcode=0601 (accessed on 12 September, 2016)
There has been a rise in the quantity of Basmati rice exports to the EU between 2013 and 2016.
There was a rise in the value of export to the EU between 2013-14 and 2014-15, but a fall in
value between 2014-15 and 2015-16. In the survey, out of 18 exporters, nine exporters said that
their exports to the EU have increased in the past five years; five said that their exports to the
EU have decreased and four said that there was no change in their exports. Those who said that
exports to the EU have increased have given varied figures for the rate of increase, ranging
between 4 and10 per cent each year.
72
5.4 The Export Process
Basmati rice in India is grown in select districts such as Dehradun (Uttarakhand), Sangrur
(Punjab), Kangra (Himachal Pradesh) and Muzaffarnagar (Uttar Pradesh). Farmers from these
districts bring paddy to nearby mandis, where an auction takes place to buy the paddy. In the
mandi, details of the farmers and their produce are supposed to be recorded; however, the
recording system is not uniform across mandis and procurement officers and agents usually do
not ask for these details. Each mandi has a particular account number and there is a ‘lot’
number, which is allotted for produce from each farmer. In some mandis, the recording system
is manual.
Representatives from the procurement team of processing companies/rice mills select the
products from the mandi, fix the price, purchase the Basmati rice and bring them to the
processing unit. In the past, processors and exporters were not allowed to source the produce
directly from farmers due to restrictions imposed by states’ Agricultural Produce Market
Committee (APMC) Acts. Now, many states have revised their APMC Acts to allow direct
sourcing and contract farming. But, it is still a relatively new concept, and in fact, in the survey,
only one company was directly sourcing produce from farmers.
At the mandi, procurement officers or agents employed by various processors and exporters do
a physical check of the product by hand; they have fairly good knowledge about the quality of
rice that they are procuring. After this, the produce is sent to rice mills/processing units. At
these units, another round of quality checks takes place. The products are tested for chemicals
such as aflatoxin, heavy metals, pesticide residue, and tests such as genetically modified
organism (GMO) testing (which is done in EU approved laboratories such as the Eurofins
Group (Luxembourg) SGS (Switzerland), etc.,)95 and DNA testing, as is required by the EU
buyers. Most of the large exporting companies also have their own EIC approved laboratories
for in-house testing. The list of various EIC approved laboratories is given by EIC.96 They
test for quality, weight of the paddy, size of the grain, etc. The product is then cleaned, stored
in silos and processed. After this, grading and sorting take place. Another round of testing takes
place at this stage. For exporting to the EU, the Authenticity Certificate97 is issued by the EIC
for duty exemption on 8 specific varieties of Basmati rice (the 8 varieties of husked brown rice,
namely, Basmati 370, Basmati 386, Type-3 (Dehradun), Taraori Basmati (HBC-19), Basmati
217, Ranbir Basmati, Pusa Basmati and Super Basmati).98 The EIC approves plant based on
HACCP implementation. In this context, it is important to note that all FBOs are mandated to
have HACCP by the FSSAI, whether they export or not.99
95 European laboratories such as SGS, Eurofins Scientific and Bureau Veritas have established branches in
India where the testing is done. These companies issue quality certificates to products being exported. 96 List of laboratories can be found at http://www.eicindia.gov.in/Approved-Units/Approved-
Units/Lab_List.aspx (accessed on 15 September, 2016) 97 Source: http://www.eicindia.gov.in/Services/Compliance/authenticity.pdf (accessed on 15 September,
2016) 98 Source: http://apeda.gov.in/apedahindi/Announcements/On-line-Registration-BR.pdf (accessed on 15
September, 2016) 99 This information is provided by EIC.
73
EIC also has a scheme for quality check and pre-shipment inspection, which requires exporters
to conform to certain standards of shipping and packaging when exporting Basmati rice.100
Since January 1, 2017, the EU has implemented the REX system where the exporter with a
REX number will be able to self-certify the ‘Statement of Origin’ of their goods being exported
to the EU under the GSP scheme. Since basmati rice is under GSP this will benefit the
exporters. The nodal agency for REX is DGFT. Earlier EIC used to issue “Certificate of origin”
for GSP benefits. The registration-cum-allocation certificate (RCAC) is issued by APEDA;
exporters have to register online with APEDA for the certification.101 Thus, a basmati rice
exporter has to register with DGFT, EIC, APEDA and FSSAI for its export processes to be
complete.
After the testing and certification process is completed, produce meeting the quality standards
of the EU is transported to a dry port. Examples of dry ports for Basmati rice include Dadri
(Uttar Pradesh), Tughlakabad (Delhi) and Rewari (Haryana). According to AIREA, Sonipat
and Delhi are the major Basmati rice exporting centres. Sonipat is the hub for packaging, but
most exporters have their offices in Delhi.
From the dry port, the produce is taken in containers to sea ports such as JNP in Mumbai. From
there, the shipments are exported to EU ports (for example, Port of Rotterdam in the
Netherlands and Port of Felixstowe in the UK), where buyers receive the produce. A large part
of Basmati exports from India is brown rice. At the EU port, customs clearance agents and
buyers such as Sona Food Traders (Germany), Bestway Group (UK), Saki GmbH (Germany)
and Tilda Ltd. (UK) receive the produce and the brown rice is milled in local mills and
converted to white rice.
The survey found that some of these buyers visit local processing facilities in India before
importing to ensure that EU regulations are met and quality is not compromised. From the mills
in EU member states, the Basmati rice goes to retailers and then to final consumers. If the
Basmati rice shipment fails to meet EU regulations at the port of entry in the EU, it gets rejected
and does not enter the market.
Information on EU regulations is provided to exporters and processors by buyers in the EU,
EIC and APEDA. When a consignment is detained at an EU port, the exporters get notifications
from buyers and customs clearance agents.
The above information can be summarised in a supply chain for Basmati rice as given in Figure
5.1.
100 Source: http://www.eicindia.gov.in/Services/Compliance/basmatirice.pdf (accessed on 15 September, 2016) 101 Source: http://apeda.gov.in/apedawebsite/Announcements/Trade_Notice_Basmati_Rice_10_11_2014.pdf
(accessed on 15 September, 2016)

74
Figure 5.1: Supply Chain of Basmati Rice
Source: Compiled by authors from the survey findings
5.5 SPS Issues Related to Exports of Basmati Rice
There are some SPS issues related to export of Basmati rice. These are discussed below.
Aflatoxin Contamination of Basmati Rice: Aflatoxins are produced by fungi Aspergillus
flavus and Aspergillus parasiticus that contaminate a variety of agricultural commodities
including rice when exposed to heavy rain, humidity or poor storage conditions (see
Mukhtar, et. al. 2016). For the EU, maximum levels of aflatoxins102 (aflatoxins B1, B2,
G1, G2 and M1) were laid down in Commission Regulation (EC) No 1881/2006103 (the
limit for aflatoxin B1 in maize and rice to be subjected to sorting or other physical treatment
before human consumption or use as an ingredient in foodstuffs was set at 5 mg/kg). In the
RASFF portal,104 there were 12 notifications between 2000 and 2016 of rice from India
being contaminated by aflatoxin B1 (the excess in aflatoxin B1 ranged from 5.5 mg/kg to
9.5 mg/kg).
In the survey conducted, five exporters revealed that their shipments got rejected at
different points of time because they contained aflatoxins beyond the permissible limits set
by the EU. Since the shipments got rejected at EU ports, the options left with the exporters
were to either get the shipments back to India or to export them to other countries, where
the aflatoxin levels are more relaxed.
102 Source: http://ec.europa.eu/food/safety/chemical_safety/contaminants/catalogue/aflatoxins_en.htm
(accessed on 20 September, 2016) 103 Link to the Regulation: http://eur-lex.europa.eu/legal-content/EN/TXT/?uri=CELEX:02006R1881-
20140701 (accessed on 20 September, 2016) 104 Source: https://webgate.ec.europa.eu/rasff-window/portal/?event=searchResultList (accessed on 4 October,
2016)
75
Rejection of Products for not Meeting the Prescribed MRLs: Between 1 January, 2000
and 30 April, 2016, there were 42 notifications on Basmati rice exported from India in the
RASFF portal for not meeting the EU standards. Out of these 42 notifications, in 39 cases,
the risk decision was reported as ‘undecided’, i.e., it was not decided whether the risk was
serious or not serious. Yet, 25 out of the 42 notifications faced ‘border rejection’, which
means that the consignment was refused entry into the EU for reason of a risk to human
and animal health or to the environment. The maximum notifications were raised in the
year 2014 (16 notifications). Among the EU member states, Italy raised the maximum
number of notifications (34), followed by France (5).
Out of the 42 notifications recorded for Basmati rice, the most common cause for rejection
was the presence of pesticides, beyond the permissible limit. 36 notifications were for
pesticide residues, 5 were for the presence of insects in the shipment (such as weevils and
beetles) and one notification was for the presence of foreign body (screws) in the shipment.
Out of all the notifications, aflatoxins had the maximum notifications (11), followed by
Carbendazim (10), Acephate (7), Triazophos (2), Hexaconazole (2) and other
miscellaneous pesticides (such as bromide, chlorpyrifos, ochratoxin and profenofos) (one
notification each). A sample of the notifications extracted from the RASFF portal is given
in Table 5.5. The survey also confirmed that there are some pesticides, which were
regularly higher than the EU MRLs such as Carbendazim in spite of the consignments being
tested in India. Foot rot, a fungal disease, can affect basmati rice and carbandazim is used
to check this disease in India. There have been cases where ‘organic’ basmati rice
consignments have been rejected in the EU for the presence of carbandazim.105
In the case of tricyclazole, different countries have fixed different import tolerance limit.
For example, the US has fixed the import tolerance in Indian rice at 3 parts per million
(ppm)106 while the EU has a MRL of 1 ppm107 and Japan has allowed MRL of 3 ppm.108
Thus, the EU has the most restrictive limit among developed countries.
The notification given by the EC on the portal of the ‘WTO Committee on Sanitary and
Phytosanitary Measures’, confirmed the survey findings that EU lowers the MRLs for
different chemicals and pesticides frequently (see Appendix A5.1 for Basmati rice). A
number of exporters pointed out that the MRLs set by the EU is lower than what Codex
Alimentarius Commission recommends and, in some cases, lower than what the EFSA has
found as minimum recommended standards. They also argued that they were unable to
locate the scientific reason or research behind the MRLs for certain substances.
The exporters also pointed out that every time the MRLs change, they have to conduct new
tests in laboratories to ensure that the chemicals in their products conform to the new
standards. This proves very costly for exporters as conducting such tests at short notice is
expensive; moreover, many laboratories in India are not equipped to conduct such tests at
105 See http://www.globaltimes.cn/content/734529.shtml for details (accessed on 14 February, 2017) 106 Source: https://www.globalmrl.com/db#query (accessed on 15 February, 2017) 107 Source: http://ec.europa.eu/food/plant/pesticides/eu-pesticides-
database/public/?event=pesticide.residue.displayMRL&language=EN (accessed on 15 February, 2017) 108 Source: http://www.m5.ws001.squarestart.ne.jp/foundation/agrdtl.php?a_inq=44800 (accessed on 14
February, 2017)

76
short notice. One exporter pointed out that that the MRLs were changed and new MRLs
were implemented after a particular shipment had already been dispatched from India to
the EU. In general, this should not be the case as the implementation of MRL changes take
effect after 6 months of the notification being made by the EU to the WTO.
One exporter surveyed in our study faced such a barrier. One of their shipments of Basmati
rice got rejected in Cyprus due to the presence of a high level of acephate pesticide. Earlier,
all their shipments passed through, but because of the change in regulations, which they
were not aware of, this particular shipment got rejected. The buyer in Cyprus (the importer)
notified the exporter and sent them a report of the test conducted by the Cyprus government.
The exporter was told that the shipment had to be destroyed or shifted out of Cyprus or
returned to the exporter. The exporter decided to re-ship the consignment again to other
countries, since the particular shipment in which they faced a problem regarding the
acephate pesticide only went through stringent checks in Cyprus and Italy, and not in other
countries. They received the shipment and sent it again to other buyers. All the re-
packaging and re-shipping to other export destinations led to extra costs that were incurred
by the exporter. This is an example of the impact of the SPS measures on the exporter.
Further, it reflects that the measures are not equally restrictive across different ports on
entry.
See Table 5.5 for a sample of border rejection details for Basmati rice.
Table 5.1: Some Examples of Border Rejection for Basmati Rice
Notification Date
(DD/MM/YYYY)
Notification
Issuing Country
Hazard
Category
Substance/Hazard Risk
Decision
30/07/2010 Italy Foreign
Bodies
Infested with Insects Undecided
18/10/2011 Italy Pesticide
Residues
Unauthorised substance
Carbendazim
Undecided
18/10/2011 Italy Foreign
Bodies
Infested with Insects
(beetles)
Undecided
13/02/2012 Italy Pesticide
Residues
Unauthorised substance
Carbendazim
Undecided
06/09/2012 Italy Pesticide
Residues
Unauthorised substance
Triazophos
Serious
21/02/2014 Cyprus Pesticide
Residues
Unauthorised substance
acephate
Not Serious
25/03/2014 Italy Pesticide
Residues
Unauthorised substance
acephate
Not Serious
03/02/2015 Italy Pesticide
Residues
Unauthorised substance
profenofos
Undecided
10/03/2016 Italy Composition High Content of
Aluminium
Not Serious
29/09/2016 Netherlands Mycotoxins Ochratoxin A Serious
15/03/2017 Italy Mycotoxins Aflatoxins Serious
21/03/2017 Finland Pesticide
Residues
Unauthorised substance
acephate
Undecided
Source: Compiled from the RASFF Portal. Available at https://webgate.ec.europa.eu/rasff-
window/portal/ (accessed on 6 April, 2017)

77
Recent Lowering of the MRL for Tricyclazole: The debate on banning the chemical
tricyclazole in the EU has been taking place for a long time (see Commission Decision
2008/770/EC109) due to the harm it may cause to human health. However, the risk
assessment was inconclusive due to lack of scientific data. This fact was reiterated in the
Standing Committee on Plants, Animals, Food and Feed held in Brussels (28 November
2016-29 November 2016), in which it was discussed that since the EU does not have
enough data it will continue with the lowering of MRL for tricyclazole rather than imposing
a ban. The data collection process in the EU is underway.110
Meanwhile, on 14 October 2016, the EU confirmed the non-approval of tricyclazole as an
active substance in the Commission Implementing Regulation (EU) 2016/1826111 and made
the ban on tricyclazole binding on its member states. It consulted its trading partners
through the WTO and it was decided that, given the long shelf life of rice and products
made of rice, there should be a transitional arrangement for rice grown in 2016 or before to
allow normal marketing and consumption of rice. However, this transitional arrangement
would not be applicable on products treated with tricyclazole in 2017 and thereafter. In the
case of Basmati rice, because it undergoes a specific procedure of maturation before being
placed on the market, a reasonable period was allowed for transition so that the member
states and EU FBOs could prepare themselves to meet the new MRL requirements.
On 16 November 2016, the Committee on Sanitary and Phytosanitary Measures of the
WTO passed a notification112 on reduction of the MRL of tricyclazole in certain products
(including Basmati rice) from 1 mg/kg to 0.01 mg/kg113 in the EU. The proposed date of
adoption and publication of the notification is June 2017.
Certain countries exporting rice (other than Basmati rice) to the EU such as Cambodia have
already decided to ban tricyclazole. In March 2017, Cambodia’s Ministry of Agriculture,
Forestry and Fisheries announced that it will ban all agricultural pesticides containing the
fungicide tricyclazole, following the EU’s new MRL on the same.114
This issue is not specific to the EU as an important destination. In 2013, Indian rice exports
faced SPS issues in the US (and a subsequent fall in export quantity) due to the presence of
residues of tricyclazole.115 In the case of India specifically it is a common practice to use
109 See http://eur-lex.europa.eu/legal-content/EN/TXT/PDF/?uri=CELEX:32008D0770&from=EN (accessed
on 7 April, 2017) 110 Summary Report: https://ec.europa.eu/food/sites/food/files/plant/docs/sc_phyto_20161128_ppr_sum.pdf
(accessed on 6 April, 2017) 111 See http://eur-lex.europa.eu/legal-content/EN/TXT/PDF/?uri=CELEX:32016R1826&from=EN (accessed
on 7 April, 2017) 112 Notification G/SPS/N/EU/173. Available at
http://spsims.wto.org/en/ModificationNotifications/View/136174?FromAllNotifications=True (accessed on
6 April, 2017) 113 Source: https://members.wto.org/crnattachments/2016/SPS/EEC/16_4739_00_e.pdf (accessed on 6 April,
2017) 114 Source: http://www.khmertimeskh.com/news/36979/ministry-bans-tricyclazole-imports/ (accessed on 6
April, 2017) 115 Source: Survey and http://economictimes.indiatimes.com/markets/commodities/united-states-finds-
pesticide-residue-in-basmati-exports-plunge/articleshow/20851768.cms (accessed on 6 April, 2017)
78
tricyclazole in Basmati rice and exporters highlighted that up to 60 per cent of the rice
exported from India can face this issue. Pakistan also faces similar issues.
Diseases Related to Basmati Rice: In India, Basmati rice cultivation is susceptible to
certain diseases. In the past, bacterial blight (BB) disease, caused by Xanthomonas oryzae
pv. oryzae (Xoo), affected Basmati rice production in the years 1979 and 1980. Studies
have shown that this disease can cause a yield loss of up to 50 per cent and lower the quality
of the produce. The genetic set up of Indian Basmati rice makes it vulnerable to the disease
and BB resistance through genetic modification may be difficult (see Pandey et al., 2013).
Bakanae caused by Fusarium fujikuroi (Nirenberg) is another serious disease affecting rice
in India. The incidence of the disease has increased recently due to climate changes,
particularly in North-West India, specifically Punjab, Haryana and Uttar Pradesh. A study
conducted by Bashyal et al. (2016) showed that in their sample of 61 villages in Punjab,
Haryana and Uttar Pradesh, almost all the villages observed the bakanae disease.
Pests like the Khapra beetle (Trogoderma granarium) and the saw-toothed grain beetle
(Oryzaephilus surinamensis) affect Basmati rice exports. In the RASFF portal, there were
five cases between 2000 and 2016 where the shipments were not allowed to be distributed
in the EU markets (particularly Cyprus, Finland and Italy) because they were infested with
insects. Out of these five notifications, two were issued (one in 2011 and the other in 2014)
due to the presence of beetles. The shipments were not allowed to enter the EU as they
posed a serious health hazard. They were detained and declared obsolete.
It is worth mentioning that pest infected rice is also a concern for exports to the US. In
2015, APEDA released a notification stating that from April 2016 onwards, export of rice
to the US would only be allowed from rice mills and processing units registered with the
Directorate of Plant Protection, Quarantine and Storage. For this, the concerned rice mills
and processing units would have to apply for registration to the Directorate of Plant
Protection, Quarantine and Storage.116
Presence of heavy metals: One exporter said that their shipments got rejected due to the
presence of heavy metals such as arsenic, lead and cadmium in the produce. This is a cause
for concern as the rice is tested for the presence of heavy metals in Indian laboratories
before shipping to the EU. This also indicates the variations in laboratory testing results
that have been discussed above.
116 Source: http://apeda.gov.in/apedawebsite/Announcements/rice_mills.pdf (accessed on 3 October, 2016)

79
5.6 The Way Forward
The above discussions show that Indian Basmati rice exports to the EU faces a number of SPS
issues related to the MRLs of various chemicals and pesticides used in cultivation. A number
of issues such as that related to the MRL of tricyclazole in the crop are at the farm level. Such
issues have to be addressed by using the right chemicals and pesticides in the right quantities
that are approved in the importing countries. Since the exporters and processors source from
the mandis, they have limited control over the farm practices. Nevertheless, they need to know
about the changes in the MRL for various chemicals and pesticides before exporting their
products. In this area, there is a knowledge gap and exporters and processors need to know the
EC’s requirements. Further, there is need for training farmers in good agriculture practices as
is done by countries such as Cambodia under FAO and EU funded projects.
The government can take measures as has been taken by countries such as Cambodia by
banning the chemicals which are banned in key markets and by training the farmers in use of
alternative chemicals and pesticides or providing them information on how to limit the use of
the chemicals and pesticides to the approved MRLs. The government may also collect scientific
facts and data to argue the case in the WTO. Since this product goes through official laboratory
testing and export inspection process, it will not be difficult to get the data on chemicals and
pesticides used. Further, using this data, the Department of Commerce can work together with
the Ministry of Agriculture and Farmers Welfare to help the farmers in accessing the right
inputs to counter the SPS barriers.
Ideally, a product going through an efficient export inspection process should not face
rejections on grounds on higher than acceptable MRLs. Further, a number of rejections were
in the year 2014 – India and the EU initiated the CITD programme during that time. However,
organisations such as AIREA till the date of their survey on September 2016 had not
participated in any training or capacity building programmes. It was suggested by AIREA that
a training programme for Basmati rice exporters can be held in cities such as Karnal (Haryana),
Sonipat (Haryana) and New Delhi under the EU-India CITD programme so that exporters and
processors are made aware of the new MRLs and to help them meet the levels stipulated by the
EU. It will be beneficial for Indian Basmati rice exporters if the EU-India CITD programme
has a provision where a list of substances that have to be tested through EIC approved
laboratories can be provided to exporters and AIREA as a part of the training and capacity
building programme. This will make the exporters and processors more aware of the issues and
they will try to ensure that they pick up the right products from the mandis.
There are a couple of issues related to laboratory test procedures in the EU and India. These
issues can be resolved through (a) implementing uniform laboratory standards across India (b)
informing laboratories promptly about any changes in EC food safety standards (c) greater
collaboration between laboratories in India and the EU and (d) through sharing of information
about scientific testing procedures in the EU.
The survey also showed that some of the concerns such as those related to aflatoxin may arise
due to poor storage and transportation. This is also confirmed by Indian government

80
discussions in the WTO.117 To identify where there is aflatoxin contamination in the supply
chain, it is important to set up a traceability system and APEDA can set up this system. The
EU member states such as the Netherlands, which have a highly developed and efficient
logistics sector with superior technologies for storage and transportation, can provide such
scientific training.
Given that the EU has established a system for common standards and practices across all its
member states, it is somewhat difficult to understand why Indian consignments of Basmati rice
had in the past been rejected in a port in an EU member state like Italy but was able to enter
through a port in the Netherlands and the UK. Thus, in practice, there are variations in checking
across ports. The EU may do a root cause analysis of the problem and resolve it.
It is important for Indian exporters and processors to meet the EU standards or else the products
will get rejected at the port of entry. Exporters who have taken the initiative to ensure quality
standards have seen a growth in exports to developed country markets. Box 5.1 highlights how
a company has ensured adherence to quality standards. Thus, if a company wants to export it
will adhere to the export standards, irrespective of any official export requirements. In this
context, Indian exporters should become more responsible which will reduce the need for
export inspection. Further, as pointed out by the EIC, all FBOs are now required to be HACCP
certified by FSSAI, and, therefore, there is no need for plant approval for Basmati rice
processors/exporters based on HACCP implementation.
Box 5.1: How an Exporter is Ensuring Compliance with EU Standards
Once a lot of Basmati rice is prepared at our rice mill, we depute an inspection
agency/laboratory which is acceptable to the EU buyer. The inspection agency/laboratory
inspects the lot and samples the cargo and seals the lot. The sample taken out by the
inspection agency is divided into 4 smaller samples of 1 kg each. One sample is sent to the
buyer for testing and approval, one is kept by us for our record, one is taken by the inspection
agency for physical testing and the other is sent to a European laboratory such as Neotron
(in Italy) or RIZLAB (in France). The buyer at his end checks the sample for all parameters
and gets it tested for DNA, pesticide and other EU requirements. In the meantime, the EU
laboratory gives its results to us regarding pesticide residue. The inspection agency gives
their approval only for the physical characteristics and not testing. All testing is done by the
buyer and EU laboratories. Only after the buyer approves the sealed samples of the
inspection agency sent by us do we send the shipment from India.
Source: Taken from the survey
117 For details see Das, 2008.

81
Appendix A5.1: Some Examples of Chemicals and the Change in their Limits for Basmati Rice
Notification Number: G/SPS/N/EU/163
Date: 6 April, 2016
Old Chemical
Name
Cymoxanil Phosphines and
Phosphides
No Definition
New Chemical
Name
Cymoxanil Phosphane and
Phosphide Salts
Sodium 5-
Nitroguaiacolate
Current
MRL
New
MRL
Current
MRL
New
MRL
Current
MRL
New
MRL
Rice 0.05 0.01 0.1 0.05 0.03
Notification Number: G/SPS/N/EU/161
Date: 5 April, 2016
Current
Residue
Definitions
Acrinathrin (F)
Bifenthrin (F) Carbetamide Cinidon-ethyl (sum of
cinidon ethyl and its E-
isomers)
Proposed New
Residue
Definitions
Acrinathrin and its
enantiomer (F)
Bifenthrin (sum of
isomers) (F)
Carbetamide (sum of
carbetamide and its S
isomer)
Cinidon-ethyl
Current
MRL
New
MRL
Current
MRL
New
MRL
Current
MRL
New
MRL
Current
MRL
New MRL
Rice 0.05 0.01 0.05 0.01 0.05 0.01 0.1 0.05
Notification Number: G/SPS/N/EU/160
Date: 5 April, 2016
Chemical
Name
Aclonifen (F) Deltamethrin (cis-
deltamethrin) (F)
Fluazinam (F) Methomyl (F) Sulcotrione (R) code
1000000 except 1040000 :
CMBA (2-chloro-4-
(methylsulfonyl) benzoic
acid)
Current
MRL
New
MRL
Current
MRL
New
MRL
Current
MRL
New
MRL
Current
MRL
New MRL Current MRL New MRL
Rice 0.05 0.01 2 1 0.05 0.02 0.02 0.01 0.05 0.02

82
Notification Number: G/SPS/N/EU/144
Date: 16 September, 2015
Chemical
Name
Atrazine (F) Potassium Thiocyanate
Current
MRL
New
MRL
Current
MRL
New
MRL
Rice 0.1 0.05 0.01
Notification Number: G/SPS/N/EU/136
Date: 29 June, 2015
Old Chemical
Name
Diethofencarb Mesotrione Metosulam Propiconazole Spiroxamine (R)
New Chemical
Name
Diethofencarb Mesotrione Metosulam Propiconazole (F) Spiroxamine (A) (R)
Current
MRL
New
MRL
Current
MRL
New
MRL
Current
MRL
New
MRL
Current
MRL
New
MRL
Current
MRL
New MRL
Rice 0.05 0.01 0.05 0.01 0.1 0.01 0.7 1.5 0.05 0.01
Source: Extracted from https://docs.wto.org/dol2fe/Pages/FE_Search/FE_S_S005.aspx (accessed on 16 September, 2016)

83
Chapter 6: Case of the Dairy Sector in India: Scope for Export to the EU Market
In this chapter milk export refers to export of milk products such as skimmed milk powder
(SMP) and whole milk powder (WMP) and milk based products such as butter, cheese, ethnic
sweets and ready-to-eat food. With a share of 18 per cent in global milk production, India is
the largest producer of milk in the world, followed by the US, China, Pakistan and Brazil.118
India also has a large consumption base for milk and milk products. Due to high domestic
demand, export of milk products such as SMP/WMP was banned in India for a couple of years.
It is only recently that the Indian government has allowed export of milk products such as SMP
and WMP. Given that India has a large production base, has established a fairly robust export
control process and there is a demand for Indian ethnic milk products in key markets, this case
study focus on the scope for exporting milk products to the EU.
This study is based on a primary survey conducted in India covering the major milk producing
states, namely Gujarat and Uttar Pradesh. Interviews were conducted with milk based product
exporters in Mumbai, Pune, Delhi and Kolkata. The survey covered milk co-operatives such as
the Gujarat Co-operative Milk Marketing Federation Limited (GCMMF) (with brands such as
‘Amul’ and ‘Sagar’) and Mother Dairy Fruit & Vegetable Private Limited, private companies
such as Parag Milk Foods Limited, foreign joint venture companies such as Schreiber Dynamix
Dairies Limited, ethnic sweet and ready-to-eat manufacturers such as Haldiram Bhujiawala
Limited, Bikanerwala Food Private Limited, Tasty Bite Eatables Limited and Gits Food
Products Private Limited. In total, 10 producers and exporters were surveyed. In-depth
meetings were also held with industry bodies such as the National Dairy Development Board
(NDDB), state government departments in states like Gujarat, APEDA and EIC. Meetings were
also conducted with the Department for Environment, Food and Rural Affairs (UK).
Image: From Co-operative to Private Farming
Source: Image http://indianexpress.com/article/india/india-news-india/mother-dairy-revises-milk-
prices-in-delhi-ncr-by-one-rupee-2917263/; http://www.mid-day.com/articles/a-very-moo-ving-
encounter/212535 (accessed on 30 September, 2016)
118 For details see http://www.fao.org/agriculture/dairy-gateway/milk-production/en/#.V2lIuZN96fU (accessed
on 31 May, 2016)
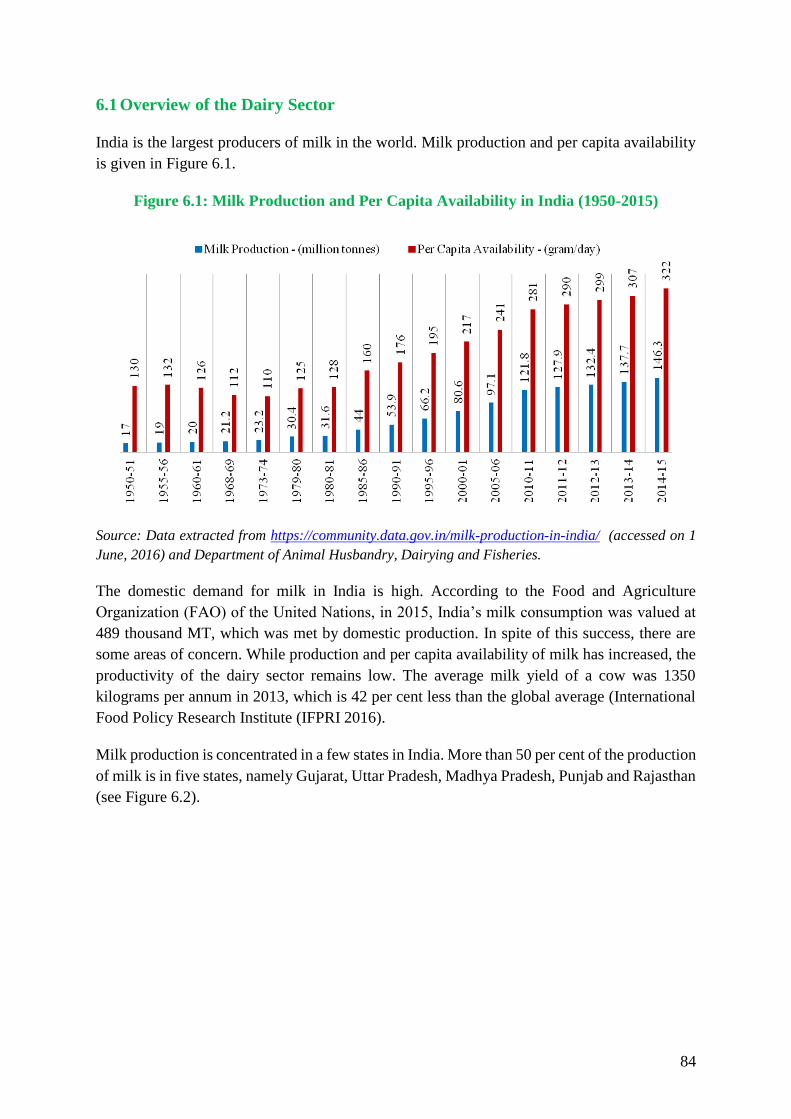
84
6.1 Overview of the Dairy Sector
India is the largest producers of milk in the world. Milk production and per capita availability
is given in Figure 6.1.
Figure 6.1: Milk Production and Per Capita Availability in India (1950-2015)
Source: Data extracted from https://community.data.gov.in/milk-production-in-india/ (accessed on 1
June, 2016) and Department of Animal Husbandry, Dairying and Fisheries.
The domestic demand for milk in India is high. According to the Food and Agriculture
Organization (FAO) of the United Nations, in 2015, India’s milk consumption was valued at
489 thousand MT, which was met by domestic production. In spite of this success, there are
some areas of concern. While production and per capita availability of milk has increased, the
productivity of the dairy sector remains low. The average milk yield of a cow was 1350
kilograms per annum in 2013, which is 42 per cent less than the global average (International
Food Policy Research Institute (IFPRI 2016).
Milk production is concentrated in a few states in India. More than 50 per cent of the production
of milk is in five states, namely Gujarat, Uttar Pradesh, Madhya Pradesh, Punjab and Rajasthan
(see Figure 6.2).
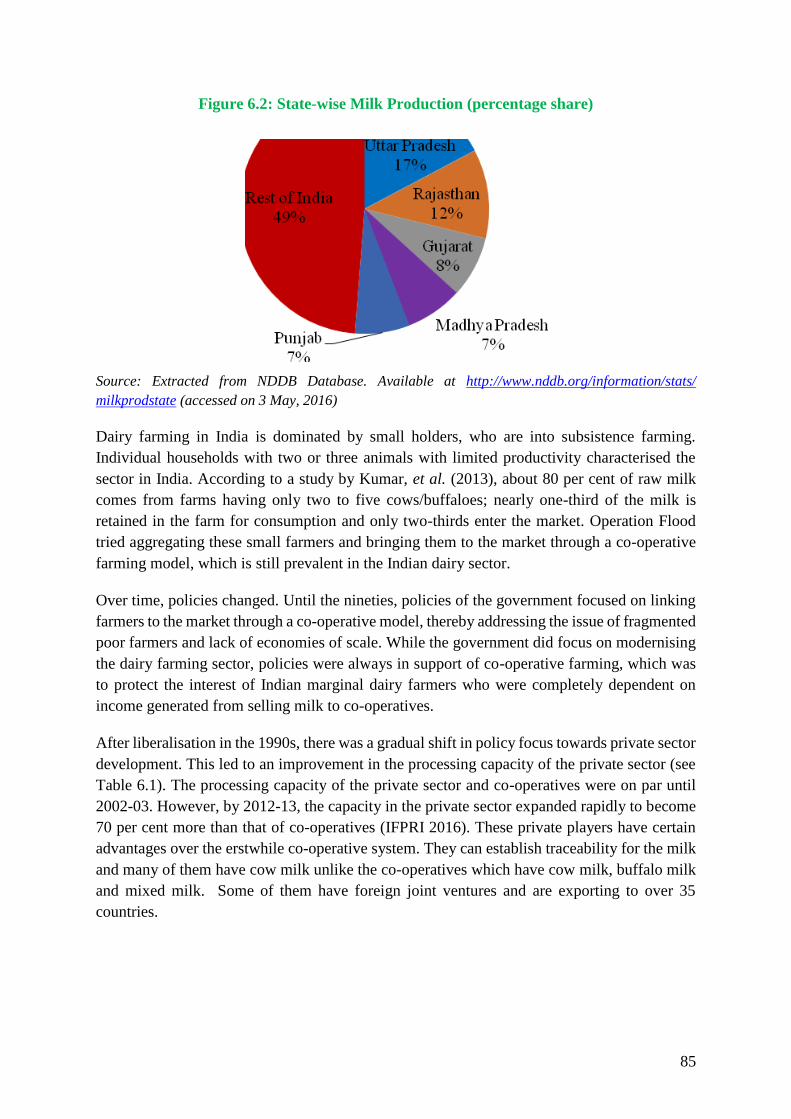
85
Figure 6.2: State-wise Milk Production (percentage share)
Source: Extracted from NDDB Database. Available at http://www.nddb.org/information/stats/
milkprodstate (accessed on 3 May, 2016)
Dairy farming in India is dominated by small holders, who are into subsistence farming.
Individual households with two or three animals with limited productivity characterised the
sector in India. According to a study by Kumar, et al. (2013), about 80 per cent of raw milk
comes from farms having only two to five cows/buffaloes; nearly one-third of the milk is
retained in the farm for consumption and only two-thirds enter the market. Operation Flood
tried aggregating these small farmers and bringing them to the market through a co-operative
farming model, which is still prevalent in the Indian dairy sector.
Over time, policies changed. Until the nineties, policies of the government focused on linking
farmers to the market through a co-operative model, thereby addressing the issue of fragmented
poor farmers and lack of economies of scale. While the government did focus on modernising
the dairy farming sector, policies were always in support of co-operative farming, which was
to protect the interest of Indian marginal dairy farmers who were completely dependent on
income generated from selling milk to co-operatives.
After liberalisation in the 1990s, there was a gradual shift in policy focus towards private sector
development. This led to an improvement in the processing capacity of the private sector (see
Table 6.1). The processing capacity of the private sector and co-operatives were on par until
2002-03. However, by 2012-13, the capacity in the private sector expanded rapidly to become
70 per cent more than that of co-operatives (IFPRI 2016). These private players have certain
advantages over the erstwhile co-operative system. They can establish traceability for the milk
and many of them have cow milk unlike the co-operatives which have cow milk, buffalo milk
and mixed milk. Some of them have foreign joint ventures and are exporting to over 35
countries.

86
Table 6.1: Key Trends in the Dairy Farming Sector
Variable 1992-93 2002-03 2012-13
Number of Dairy Plants
Co-operative 194 212 263
Private 250 403 765
Others 65 63 37
Total 509 678 1065
Processing Capacity (000 Litres/day)
Co-operative 24207 28394 43251
Private 24432 32415 73252
Others 7270 12170 3046
Total 55909 72979 119549
Source: Extracted from IFPRI 2016, Table 2.1, Page 5.
According to the APEDA’s Annual Report (2014-15),119 APEDA and Russia’s Federal Service
for Veterinary and Plant Control (Rosselkhoznadzor) have agreed to increase co-operation to
boost food exports from India, which includes dairy products to Russia through technical
consultations and e-certification systems. Russia has lifted restrictions on the import of milk
products, cheese and other dairy products from India. Further, APEDA in consultation with the
EIC recommended names of leading dairy plants for inclusion of their units for inspection by
Federal Service for Veterinary and Plant Control (Rosselkhoznadzor) of Russia for market
access.120 Following this, another report121 found that only two private farms were approved as
Rosselkhoznadzor approved only Indian farms that owned at least 1,000 cattle.
Besides milk products like SMP/WMP and milk based products such as cheese, there is a
growing market in the world for Indian ethnic sweets and ready-to-eat products (that contain
dairy components). Companies such as Gits Food Products Private Limited and Tasty Bite
Eatables Limited export ready-to-eat Indian processed foods such as dal makhani, palak
paneer, tarka dal, chana masala, ready-to-make precooked food and Indian ethnic sweets such
as gulab jamun and jalebi. According to the survey, the market share of ready-to-eat food in
the EU is growing by 10-20 per cent, but Indian ethnic sweet manufacturers using dairy
products have seen stagnation in growth due to the certain restrictions imposed by the EU on
the import of dairy products for health and safety reasons which are discussed in Section 6.2.
119 Accessible at http://apeda.gov.in/apedawebsite/Annual_Reports/Apeda_Annual_Report_English_2014-
15.pdf (accessed on 11 April, 2017) 120 Accessible at http://apeda.gov.in/apedawebsite/Annual_Reports/Apeda_Annual_Report_English_2014-
15.pdf (accessed on 11 April, 2017) 121 Published by Business Standard, accessible at http://www.business-standard.com/article/companies/russia-
opens-dairy-market-but-indian-exporters-face-pricing-barrier-116050300295_1.html (accessed on 11 April,
2017)
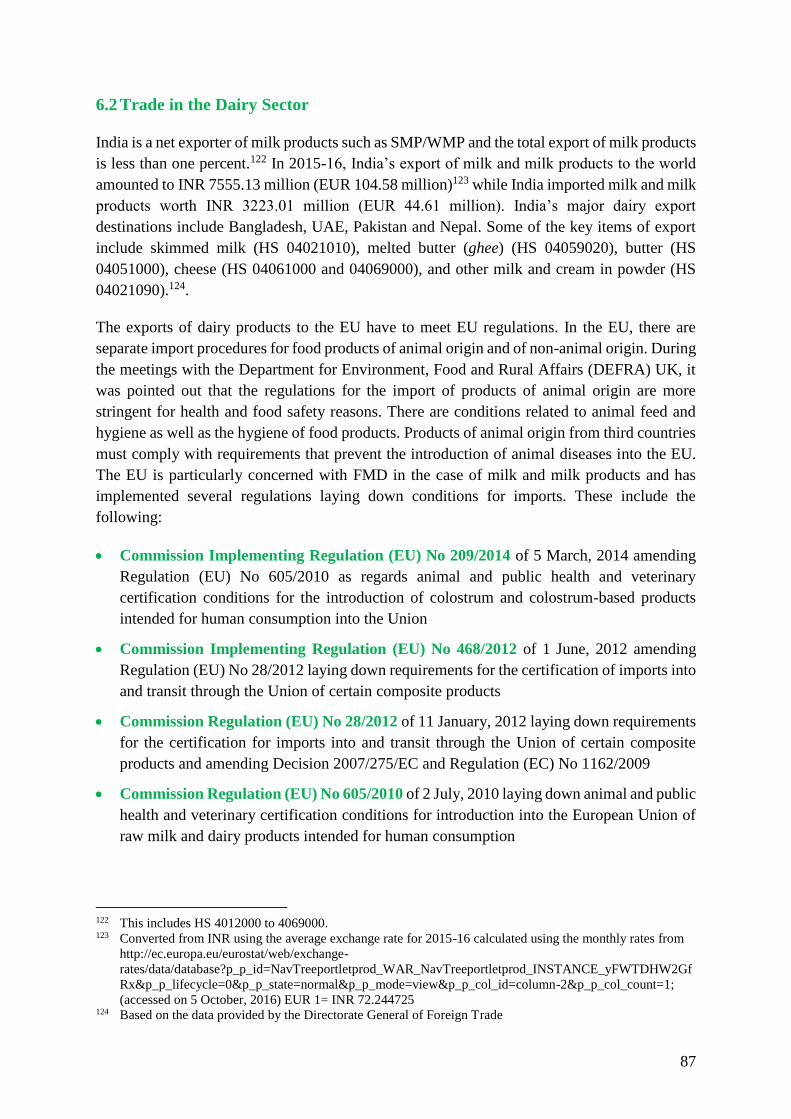
87
6.2 Trade in the Dairy Sector
India is a net exporter of milk products such as SMP/WMP and the total export of milk products
is less than one percent.122 In 2015-16, India’s export of milk and milk products to the world
amounted to INR 7555.13 million (EUR 104.58 million)123 while India imported milk and milk
products worth INR 3223.01 million (EUR 44.61 million). India’s major dairy export
destinations include Bangladesh, UAE, Pakistan and Nepal. Some of the key items of export
include skimmed milk (HS 04021010), melted butter (ghee) (HS 04059020), butter (HS
04051000), cheese (HS 04061000 and 04069000), and other milk and cream in powder (HS
04021090).124.
The exports of dairy products to the EU have to meet EU regulations. In the EU, there are
separate import procedures for food products of animal origin and of non-animal origin. During
the meetings with the Department for Environment, Food and Rural Affairs (DEFRA) UK, it
was pointed out that the regulations for the import of products of animal origin are more
stringent for health and food safety reasons. There are conditions related to animal feed and
hygiene as well as the hygiene of food products. Products of animal origin from third countries
must comply with requirements that prevent the introduction of animal diseases into the EU.
The EU is particularly concerned with FMD in the case of milk and milk products and has
implemented several regulations laying down conditions for imports. These include the
following:
Commission Implementing Regulation (EU) No 209/2014 of 5 March, 2014 amending
Regulation (EU) No 605/2010 as regards animal and public health and veterinary
certification conditions for the introduction of colostrum and colostrum-based products
intended for human consumption into the Union
Commission Implementing Regulation (EU) No 468/2012 of 1 June, 2012 amending
Regulation (EU) No 28/2012 laying down requirements for the certification of imports into
and transit through the Union of certain composite products
Commission Regulation (EU) No 28/2012 of 11 January, 2012 laying down requirements
for the certification for imports into and transit through the Union of certain composite
products and amending Decision 2007/275/EC and Regulation (EC) No 1162/2009
Commission Regulation (EU) No 605/2010 of 2 July, 2010 laying down animal and public
health and veterinary certification conditions for introduction into the European Union of
raw milk and dairy products intended for human consumption
122 This includes HS 4012000 to 4069000. 123 Converted from INR using the average exchange rate for 2015-16 calculated using the monthly rates from
http://ec.europa.eu/eurostat/web/exchange-
rates/data/database?p_p_id=NavTreeportletprod_WAR_NavTreeportletprod_INSTANCE_yFWTDHW2Gf
Rx&p_p_lifecycle=0&p_p_state=normal&p_p_mode=view&p_p_col_id=column-2&p_p_col_count=1;
(accessed on 5 October, 2016) EUR 1= INR 72.244725 124 Based on the data provided by the Directorate General of Foreign Trade

88
Commission Regulation (EC) No 1162/2009 of 30 November, 2009 laying down
transitional measures for the implementation of Regulations (EC) No 853/2004, (EC) No
854/2004 and (EC) No 882/2004 of the European Parliament and of the Council
Commission Decision of 17 April, 2007 concerning the list of animals and products to be
subject to controls at border inspection posts under Council Directives 91/496/EEC and
97/78/EC
Council Directive 97/78/EC of 18 December, 1997 laying down the principles governing
the organisation of veterinary checks on products entering the Community from third
countries
Council Directive 96/23/EC of 29 April 1996 on measures to monitor certain substances
and residues thereof in live animals and animal products and repealing Directive
85/358/EEC and 86/469/EEC and Decisions 89/187/EEC and 91/664/EEC
Various directives provide the list of third countries125 including India that can export milk
products such as SMP/WMP and milk-based products to the EU, after meeting certain health
and food safety requirements.
India’s residue monitoring plan for milk products such as SMP/WMP and milk-based products
is in line with the Council Directive 96/23/EC of 29 April, 1996.126 Besides obtaining a health
certificate for milk products such as SMP/WMP and milk-based products exported to EU
member states, India is also required to comply with certain other requirements, including heat
treatment, storage and traceability requirements and safety guarantees (also see Box 6.1).127
The EC lays down regulations for all stages of the dairy supply chain, such as production,
processing and distribution of animal products meant for human consumption (Council
Directive 2002/99/EC). In addition, Regulation (EC) No 178/2002, Regulation (EC) No
852/2004, Regulation (EC) No 853/2004, Regulation (EC) No 854/2004 and Regulation (EC)
882/2004 form the legal base for the public health rules for trade and introduction into the EU.
Regulation (EU) No 605/2010 lays down different import conditions depending on the animal
health status of the exporting country as regards foot-and-mouth disease and rinderpest.128
Thus, the process of export of milk products and milk based products to the EU is complex and
several requirements have to be adhered to.
125 Third countries are countries that are outside the EU. 126 The residue monitoring plan for 2017-18, as released by the EIC is accessible at
http://www.eicindia.gov.in/Services/Pre-Compliance/PDF/RMP%202017-18%20Milk%20Products.pdf
(accessed on 11 April, 2017) 127 Source: http://eur-lex.europa.eu/LexUriServ/LexUriServ.do?uri=OJ:L:2010:175:0001:0024:EN:PDF
(accessed on 7 October, 2016) 128 Source: http://eur-lex.europa.eu/legal-content/EN/TXT/PDF/?uri=CELEX:32014R0209&from=EN
(accessed on 7 October, 2016)
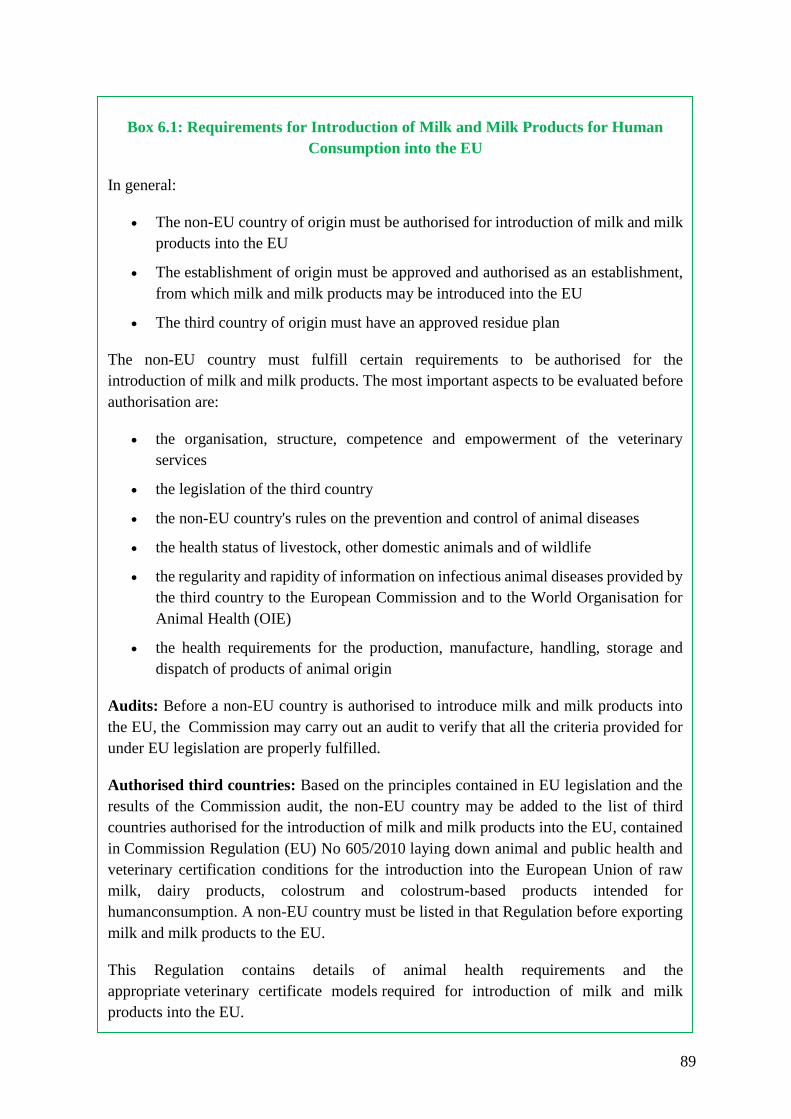
89
Box 6.1: Requirements for Introduction of Milk and Milk Products for Human
Consumption into the EU
In general:
The non-EU country of origin must be authorised for introduction of milk and milk
products into the EU
The establishment of origin must be approved and authorised as an establishment,
from which milk and milk products may be introduced into the EU
The third country of origin must have an approved residue plan
The non-EU country must fulfill certain requirements to be authorised for the
introduction of milk and milk products. The most important aspects to be evaluated before
authorisation are:
the organisation, structure, competence and empowerment of the veterinary
services
the legislation of the third country
the non-EU country's rules on the prevention and control of animal diseases
the health status of livestock, other domestic animals and of wildlife
the regularity and rapidity of information on infectious animal diseases provided by
the third country to the European Commission and to the World Organisation for
Animal Health (OIE)
the health requirements for the production, manufacture, handling, storage and
dispatch of products of animal origin
Audits: Before a non-EU country is authorised to introduce milk and milk products into
the EU, the Commission may carry out an audit to verify that all the criteria provided for
under EU legislation are properly fulfilled.
Authorised third countries: Based on the principles contained in EU legislation and the
results of the Commission audit, the non-EU country may be added to the list of third
countries authorised for the introduction of milk and milk products into the EU, contained
in Commission Regulation (EU) No 605/2010 laying down animal and public health and
veterinary certification conditions for the introduction into the European Union of raw
milk, dairy products, colostrum and colostrum-based products intended for
humanconsumption. A non-EU country must be listed in that Regulation before exporting
milk and milk products to the EU.
This Regulation contains details of animal health requirements and the
appropriate veterinary certificate models required for introduction of milk and milk
products into the EU.

90
As per the EC’s Food and Veterinary Office (FVO) residue mission report released in 2009129,
no dairy establishments were approved for export to the EU. The report concluded that the
residue controls in milk products did not provide guarantees equivalent to those laid down in
Council Directive 96/23/EC.130 The report made certain recommendations. For example, with
129 See Page 4 of the Food and Veterinary Office (FVO) residue mission report accessible at
http://admin.indiaenvironmentportal.org.in/files/FVO%20Final%20Report%20India%20September2009%5
B1%5D.pdf (accessed on 11 April, 2017) 130 See Page 27 of the Food and Veterinary Office (FVO) residue mission report accessible at
http://admin.indiaenvironmentportal.org.in/files/FVO%20Final%20Report%20India%20September2009%5
B1%5D.pdf (accessed on 11 April, 2017)
Authorised establishments: All imports of milk and milk products into the EU must come
from an approved establishment that has been authorised and listed for that purpose. The
third countries are responsible to keep the lists of establishments up to date and to inform
the Commission of any changes. Lists of establishments in non-EU countries that are
authorised to produce fresh meat are published on the Commissions webpage.
Veterinary certificates: The veterinary certificate is required to ensure that milk and milk
products can be introduced safely and must accompany all consignments of milk and milk
products entering the EU. The veterinary certificates for milk and milk products are laid
down in Commission Regulation (EU) No 605/2010.
Public Health: Certain public health requirements must be met. For example, a non-EU
country is required to have an approved "residue" monitoring plan.
Border Inspection and traceability: Milk and milk products entering the EU are inspected
at an EU Border Inspection Post (BIP) - listed in Annex I to Commission Decision
2009/821/EC - where Member States' official veterinarians ensure the milk and milk
products fulfills all the requirements provided for in the EU legislation. Council Directive
97/78/EC lays down the principles governing the organisation of veterinary checks on
products of animal origin entering the EU from non-EU countries.
TRACES (TRAde Control and Expert System) is an informatics system managing import
controls at BIPs and ensuring traceability and uniform controls within the EU.
The importers must follow the procedures laid down in Commission Regulation (EC) No
136/2004 before, during and after the entry of the goods of animal origin into the EU via a
BIP.
Source: Extracted from https://ec.europa.eu/food/animals/animalproducts/milk_en (accessed on
13 April, 2017)

91
respect to milk products, the report recommended that formaldehyde should not be added to
milk samples.131
In order to see whether the exporting country has incorporated the FVO recommendation and
is meeting the standards set in the commission regulations and Council Directives, the EC
conducted an audit in India in May 2011 and published the audit report.132 The objective of the
audit was to evaluate the implementation of national measures aimed at the control of residues
and contaminants in animal products to assess whether these systems offer adequate assurance
that the products are within the specified residue limits laid down in EU legislation. Attention
was paid to examining the implementation of corrective actions promised in response to
recommendations made in the FVO residue mission report and adherence to the standards laid
down in the Council Directive 96/23/EC. The audit report concluded that the recommendation
related to formaldehyde was followed by the competent authority, which is the EIC. Further,
the report highlighted that the sample testing procedures, etc. complied with the requirements
laid under the Council Directive 96/23/EC.
A study by FAO133 also points out to the importance of recognition of export certification
systems in the case of trade in dairy products. The study suggests that export certification
systems should be built up to also include standards like GAP and HACCP. However, there
are several concerns related to export certification system due to which its implementation in
the dairy sector is becoming an issue. These are discussed in Section 6.4.
There are some key issues faced in export of dairy products from India to the EU. India has
been identified as one of the third countries with risk of FMD and, therefore, import conditions
for milk products are rigid for India. For example, imports will be allowed only if such dairy
products have undergone, or been produced from raw milk that has undergone, heat treatment
involving a sterilisation process, ultra high temperature (UHT) treatment and various high
temperature short-time pasteurisation treatments (HTST).134
In the context of exports from India, companies that are interested in exporting processed milk
and milk products to the EU have to get their units inspected and approved by the EIC. Products
of animal origin require a separate health certificate and health attestation. While there are
random checks for all the other categories of food products at EU ports, there is a prescribed
level of check for products of animal origin in countries such as the UK.135
131 Until it has been demonstrated that this measure does not affect the analytical result. See Recommendation
Number 7, Page 29 of the Food and Veterinary Office (FVO) residue mission report accessible at
http://admin.indiaenvironmentportal.org.in/files/FVO%20Final%20Report%20India%20September2009%5
B1%5D.pdf (accessed on 11 April, 2017) 132 The report is accessible at http://ec.europa.eu/food/audits-analysis/audit_reports/details.cfm?rep_id=2737
(accessed on 11 April, 2017). 133 For details see http://www.fao.org/docrep/meeting/008/y5871e/y5871e0m.htm (accessed on 12 April, 2017) 134 Source: http://eur-lex.europa.eu/LexUriServ/LexUriServ.do?uri=OJ:L:2010:175:0001:0024:EN:PDF
(accessed on 7 October, 2016) 135 The various Council Directives by the EU on rules and regulations that have to be followed to produce and
trade in products of animal origin with the EU are given on
http://ec.europa.eu/food/animals/animalproducts/milk/index_en.htm (accessed on 5 October, 2016)

92
To some extent, India has been able to harmonise certain standards with international standards
such as the Codex Alimentarius and the standards of OIE in the case of milk products.
Discussions with the NDDB highlight that India has already achieved compliance with the
Codex standards with respect to Code of Practice for the Prevention and Reduction of Lead
Contamination in Foods and aflatoxin M1. Yet, there are still differences across the other
standards that have been followed in India and those that are prescribed by Codex Alimentarius.
6.3 The Survey Findings
All survey participants and government officials stressed that India is self-sufficient in the
production of milk. The surplus milk products such as SMP/WMP are exported to neighbouring
countries such as Nepal and Bangladesh.
A difference of opinion emerged during the survey between Indian co-operatives and the large
private players regarding dairy trade (especially exports) with the EU. Co-operatives such as
the GCMMF, which is exporting to over 55 countries, pointed out that it is not commercially
viable for Indian companies to export to the EU as the EU is self-sufficient in milk production
and the export requirements are very stringent. Evidence collected during the survey suggest
that the co-operatives, along with some private companies, have made a representation to the
Indian government to keep milk and milk products out of any trade negotiations with the EU.
They have argued that India is self-sufficient in milk production and consumption. The dairy
industry is an important source of livelihood for rural families and the co-operative model has
helped uplift their economic conditions. Most of the country’s milk is produced by small,
marginal farmers and landless labourers and it will be difficult for them to export by meeting
rigid export standards. Further, it will be difficult for these farmers to compete with large
farmers from EU member states, who are highly subsidised.
Compared to this, some of the Indian private sector companies and joint venture players pointed
out that they have highly developed dairy plants that adhere to international standards, some of
them have foreign collaborations and they are open to increasing dairy trade (especially
exports) with the EU. They are confident that their products will sell well in EU markets, given
that they are already supplying products to global companies. Moreover, exporting to the EU
will bring about quality consciousness and help keep standards in check, and it will also bring
credibility to the brand internationally. Some of them have already entered into joint ventures
with EU and US based companies. For example, Parag Milk Foods Limited - has entered into
a joint venture with the German brand Hochland Deutschland GmbH to import and market its
cream cheese brand ‘Almette’ in India, which will be co-branded as 'Go Almette'. Such joint
ventures give Indian companies access to global technology and best practices. Using the same
technology and best practices they would like to export to the EU - partnerships with global
companies and brands will allow the Indian companies to be a part of the global production
network and supply chain. Thus, some private players are keen on a liberal trade environment
with the EU and other countries such as Australia, the US and Canada.
Given the large size of the Indian Diaspora in Europe, the US and Canada, there is a large
demand for ethnic Indian sweets (like rasgulla, ras malai), ready-to-eat food products (such as

93
palak paneer) and ready-to-cook sweets (such as gulab jaamun) that use milk as an ingredient.
Indian companies are either exporting or are keen to export these products to the EU market to
cater largely to NRIs and the population from other South Asian countries. Within the EU, the
UK is the largest market. Other key markets are Italy, Germany and Belgium.
The survey found that most Indian companies, especially private players, import machinery
and technology from EU member states such as the Netherlands, Sweden, Italy and Germany.
6.4 Some Concerns
At present, there is no export of milk products such as SMP/WMP to the EU. This is despite
the fact that India is the largest producer of milk and India has implemented a fairly robust
export inspection regime. The survey also showed that Indian companies are interested in
exporting milk-based products such as ethnic sweets and ready-to-eat food products, but are
facing a number of SPS issues. The data in the RASFF portal shows that there is one
notification of border rejection for butter in Greece in 2008 for not providing a health certificate
during 1 January, 2000 to 30 April, 2016. Further, there were 3 notifications in 2007 for mutter
paneer dish (peas and cottage cheese) and curried spinach and cheese from India due to the
presence of bacteria and undeclared substances (soya) in the shipment. 136
As highlighted in the previous sections, India has undertaken measures to strengthen its export
inspection system. Despite the continuing effort, India has experienced a decline in milk
exports to not only developed country markets but also to some of its key developing country
markets such as Bangladesh. For example, as per the data published by DGFT, in 2015-16,
India’s export of SMP and other milk and cream powders registered a decline of 66 per cent
and 83 per cent respectively, compared to 2014-15. This is a cause for concern.
Some of the key issues in exports to the EU are:
Traceability up to the farm: A key barrier to export is the lack of traceability to the farms.
While some private companies have been able to ensure traceability, large Indian co-
operatives are unable to ensure traceability. A study by the FAO137 also highlights that in a
large country like India, where farms are of small size and raw materials are procured by
processing units or exporters through traders, the concept of traceability is sometimes not
possible. There are also concerns related to whether the milk is cow milk, buffalo milk or
mixed milk, which has been also been raised by countries such as the US.138 The EU
consumers have preference for cow milk while the survey participants pointed out that most
milk producing companies in states like Gujarat and Uttar Pradesh have buffalo milk.
EU standards are often more stringent than Codex Standards: Dairy products are
tested for, among other things, pesticides, pathogens, heavy metals, lead and aflatoxins.
Indian companies pointed out that India has been able to reach the Codex Alimentarius
136 Link to the RASFF Portal: https://webgate.ec.europa.eu/rasff-window/portal/ (accessed on 21 September,
2016) 137 For details see http://www.fao.org/docrep/meeting/008/y5871e/y5871e0m.htm (accessed on 10 April, 2017) 138 See also, http://dairyknowledge.in/sites/default/files/ch6.pdf (accessed on 10 April, 2017)
94
standards as far as milk and milk products are concerned. However, there are concerns as
the EU has higher standards and keeps revising their standards. For instance, in the case of
aflatoxin M1 the limit in the EU is 0.05 ppm, which is more stringent that the prescribed
limit under Codex, which is 0.5 ppm. As mentioned earlier, India is at par with the Codex
standard in this regard. In the context of trade with the EU, even larger units (especially
those sourcing from small farmers and co-operatives) pointed out that it is difficult to
achieve the level of compliance demanded by the EU.
In April 2016, through its notification to the WTO’s Committee on Sanitary and
Phytosanitary Measures139, the MRL for cymoxanil was reduced from 0.05 mg/kg to 0.01
mg/kg, the MRL for acrinathrin (F) (proposed new residue definition: acrinathrin and its
enantiomer (F)) was reduced from 0.05 mg/kg to 0.01 mg/kg, the MRL for bifenthrin (F)
(proposed new residue definition: bifenthrin (sum of isomers (F)) was reduced from 0.2
mg/kg to 0.01 mg/kg and the MRL for fluazinam (F) was reduced from 0.05 mg/kg to 0.01
mg/kg. In 2015, the MRL for diethofencarb was reduced from 0.05 mg/kg to 0.01 mg/kg.
The survey participants argued that since they have to source milk from small and mid-
sized farmers, it becomes difficult if EU constantly changes MRLs to make them more
stringent.
High risk status in FMD: During the survey, all companies, irrespective of whether they
want to export, are exporting or would not like to export, pointed out that the process of
exporting milk and milk based products from India to the EU is complex due to the
perceived risk of FMD and consequently rigid regulations. An EC 2008 report140
concluded that India belongs to the countries with the highest incidence of FMD.
Quality Issues: According to EU requirements, there are several concerns regarding milk
product quality controls, residue monitoring controls and hygiene in producing
establishments. Animal health related issues also exist for non-heat treated products. An
audit of the Commission was undertaken in 2008 and further exchanges of information
have taken place since then. According to the 2008 EC audit report, the EU import
standards were not met in India, both from the public health and animal health perspectives.
However, they also pointed out that India should request an authorisation to export dairy
products to the EU to regain access to the EU market.141
Other issues related to exports: For exports to the EU there are other requirements related
to type of feed to animals. For instance, there are certain chemicals such as chlormequat,
which are present in cereals that might be fed to livestock. At present, the MRL permitted
by the EU for cattle, sheep and goat milk is 0.6 mg/kg, which is less stringent than the
Codex standard, which is 0.5 mg/kg. However, in August 2016, the EFSA proposed that
these levels should be revised to include chlormequat and its salt, thus, making it more
stringent. In a recent report, the EFSA has recommended setting an MRL ranging from 0.06
139 See https://docs.wto.org/dol2fe/Pages/FE_Search/FE_S_S005.aspx (accessed on 21 September, 2016) 140 See http://ec.europa.eu/food/audits-analysis/audit_reports/details.cfm?rep_id=2038 (accessed on 13 April,
2017) 141 See http://ec.europa.eu/food/audits-analysis/audit_reports/details.cfm?rep_id=2038 (accessed on 13 April,
2017)

95
to 3 mg/kg.142 If the recommendation is enacted, it is likely to affect the export of dairy
products from India to the EU adversely.
Further, there are concerns related to methods of milking (manual versus mechanised).
Some survey participants pointed out that in the EU there is a preference for use of
mechanised methods of milking cows which is not possible for small farmers with 2-3
cows. In order to recognise the export certification system, some countries require dairy
companies to install specific infrastructure such as milking machines for milk production,
a large number of change rooms, flake ice machines, etc. This is not always possible in a
co-operative farming model as at the primary production level the implementation may not
be possible. Since milk is processed before it is exported, such requirements, according to
some survey participants, should be applicable at the level of processing and not at the level
of primary production of milk.
Issues faced by companies exporting milk-based products: Indian companies that use
dairy products as ingredients in the ethnic sweets and ready-to-eat meals have to make sure
that the companies from which the ingredients are procured, adhere to the EU requirements
and standards (Das, 2008). Only a certain percentage of dairy products is allowed as an
ingredient in products such as palak paneer (spinach and cottage cheese). In order to adhere
to EU regulations, producers have to either decrease the dairy component (for example,
reduce the paneer in palak paneer) or substitute ingredients, both of which involve
compromising on taste.
To counter the SPS barriers, the survey found that many exporters are setting
manufacturing base in other countries to export processed milk-based ethnic sweets to the
EU. For example, in the case of ras malai, the patty is made in India and then it is sent to
Canada, where milk is added to complete the processing. The product is then exported to
the EU. Thus, the value addition is in Canada and the Indian companies have to share their
processing techniques with their counterparts in Canada. One of the companies surveyed is
planning to open a unit in the EU to overcome this hurdle.
As in the case of other products, some companies pointed to the variation in test results
across laboratories in the EU. Overall the survey participants pointed out that Indian
companies have to adhere to much higher standards for exports compared to the domestic
market, which should at least be at par with standards set by international bodies.
6.5 The Way Forward
India today is not able to export milk products to the EU, despite the fact that there is demand
for milk based ethnic sweets and ready-to-eat milk based products. There is limited scope for
exporting milk products such as SMP/WMP to the EU in the near future and the EU market is
saturated and offers a highly competitive price for such products. Hence the recommendations
142 See http://www.europarl.europa.eu/sides/getAllAnswers.do?reference=E-2016-005545&language=EN
(accessed on 20 September, 2016)

96
mostly focus on how to export milk based products like paneer, ethnic sweets and Indian ready-
to-eat meals. In the context of Indian ethnic sweets, there are no specific international standards
and India may push for development of such standards. If India wants to export to the EU, the
country has to adhere to the process listed in Box 6.1. All the plants providing the raw material
(i.e. the dairies) and using the raw material (which can be an ethnic sweet manufacturer) have
to ensure that they are compliant with the EU requirements. It is difficult for India to challenge
these requirements in the WTO until India itself reaches the Codex and other internationally
approved standards. All the companies that were interviewed said that they follow international
standards, namely HACCP standards, as well as the International Organisation for
Standardization (ISO) 22000 guidelines.
The survey also found that if India wants to export to the EU, the country needs to strengthen
its processing facilities in the dairy sector and ensure traceability to the farm and cattle. Under
Operation Flood, the EU has helped India to strengthen its production. Under the EU-India
CITD programme, training can be offered to Indian co-operatives and private companies that
are interested in exporting to the EU market to improve their milking, milk storage and
manufacturing facilities so that the facilities meet EU standards. The survey also found that
there are variations in milk processing in terms of hygiene and the EU-India CITD programme
can offer training in this regard. There is need for training of farmers, co-operatives, veterinary
doctors on cattle feed and how sick animals should be looked after, given that India is a high
risk country on ground of certain diseases such as FMD. There is also need for sharing of more
information on residue monitoring plan.
There is an urgent need to upgrade to international processing practices. Collaboration with the
EU companies and contract manufacturing for EU companies have helped in the past, and it is
likely to help Indian companies upgrade their facilities in the dairy sector and meet international
standards and best practices. Some private companies have expressed interest to engage in
trade with the EU. They are of the opinion that increasing exports to the EU will increase their
value addition and increase international recognition of their brands. These companies are able
to ensure traceability and implement control over cattle feed as per the EU requirements. Some
of them are already entering into foreign collaborations to upgrade their technology and get
access to global best practices. They are also establishing manufacturing units in other
countries to cater to the EU requirements.
In countries such as Australia, the Department of Agriculture and Water Resources has
compiled a business-friendly document for the dairies and industry so that they understand and
follow the EU certification requirements in the dairy sector.143 Such documents are useful for
exporters and similar document may be compiled by EIC or APEDA. APEDA may also help
in drawing up a TraceNet system for exporters of milk products.
An important issue affecting India’s export potential adversely in dairy products is that despite
several efforts from the relevant government departments, India is not declared free from FMD
143 See http://www.agriculture.gov.au/SiteCollectionDocuments/aqis/exporting/dairy/goods-for-
eu/understanding-certification-requirements-eu.pdf (accessed on 13 April, 2017)

97
by the OIE. The government of India initiated a location specific FMD Control Programme,
after which the FMD outbreak decreased substantially from 879 in 2012 to 109 in 2015.144 The
Ministry of Agriculture and Farmers Welfare has conceived ‘FMD Mukta Bharat’ programme
and have made it a part of the Rashtriya Krishi Vikas Yojana (RKVY) during 2016-17.145 India
can take assistance from the EU in this regard as the government has been planning to increase
the scope of this programme. There is also a need for data collection for reporting progress in
the WTO. Given that India faces SPS issues in exporting dairy products to the EU, collection
and availability of scientific data will enable India to raise its concerns in the Committee on
Sanitary and Phytosanitary Measures.146
While the government is undertaking corrective action, it is also important to continuously
monitor the quality of raw milk and production conditions. For this, scientific research should
focus on efficient testing procedures for India. Quality management is also important. GPH
based on the HACCP system for milk production and processing should be followed
throughout the milk supply chain. 147 These quality management systems are important for
improving the exportability of Indian dairy products to markets such as the EU.
Further, depending on the local requirements, different states in India can develop model dairy
farms for enabling training, health care for animals and breeding, among other things. In these
farms there can be common infrastructure such as mechanised milking facilities which small
and mid-sized farmers can use. These concepts are already being adopted in places such as
Punjab148 where the government is inviting private banks for funding such projects. The EU-
India CITD programme can also be instrumental in fostering such developments, including the
training needs. Efforts should be made to improve the overall environment for dairy sector
development in these model farms. Existing studies highlight that the quality of raw milk is
determined by feed quality, sanitation, environmental pollution, and the availability of power
and clean water. 149 Thus, environment protection agencies should be engaged with the relevant
government department and agencies in the dairy sector to ensure a clean environment for dairy
development.
144 See http://pib.nic.in/newsite/PrintRelease.aspx?relid=148556 (accessed on 11 April, 2017) 145 For details see http://timesofindia.indiatimes.com/india/Govt-pledges-foot-mouth-disease-free-India-
extends-scheme-to-16-more-states/articleshow/53614701.cms (accessed on 11 April, 2017) 146 Source: WTO Committee on Sanitary and Phytosanitary Measures Document G/SPS/GEN/204/Rev.17
Dated 7 March 2017. Available at
http://spsims.wto.org/en/OtherDocuments/Search?DoSearch=True&DocumentSymbol=G%2FSPS%2FGE
N%2F204%2FRev.17&DistributionDateFrom=07%2F03%2F2017&DistributionDateTo=07%2F03%2F201
7&SubmittingMembers=&SubmittingObservers=&SubmittingObserverOrganizations=&Secretariat=&Dev
elopmentStatus=&GeographicGroups=&Title=&Keywords=&DocumentTypes= (accessed on 12 April,
2017) 147 Other studies have also pointed this out. For details see
http://www.suruchiconsultants.com/pageDownloads/downloads/4_policy%20paper%20on%20export%20of
%20dairy%20products.pdf (accessed on 13 April, 2017) 148 http://timesofindia.indiatimes.com/city/chandigarh/amarinder-meets-industry-captains-in-
mumbai/articleshow/58117737.cms (accessed on 13 April, 2017) 149 For details see
http://www.suruchiconsultants.com/pageDownloads/downloads/4_policy%20paper%20on%20export%20of
%20dairy%20products.pdf (accessed on 13 April, 2017)
98
The NDDB has developed several programmes for traceability and improving productivity.
One such programme is the Information Network for Animal Productivity & Health (INAPH)
that facilitates traceability in the dairy sector. There has to be a better dissemination of
knowledge regarding the programme at the ground level. Dairy farmers have to be sensitised
about these techniques and training has to be provided. There can be joint training programmes
with the EC for training farmers to facilitate traceability. There is scope for collaboration with
similar departments in other countries for research on animal health and improving yield. The
programmes are also useful in tracking animal health and therefore, the Ministry of Agriculture
and Farmers Welfare should ensure a wider reach of the programme. To conclude, Indian
government has renewed its focus on hygienic milk production and marketing and such efforts
have to begin at the farm level. Once the issues are addressed at the farm then only there can
be exports or India can take up the SPS issue with its trading partners.

99
Chapter 7: The Case Study of Exports of Green Peas from India to the EU
Both India and the EU are large producers of green peas and most of their production is for
the domestic market. Within the EU, France is the world’s largest exporter of green peas.
Although India is also a key exporter, its exports of green
peas to the EU in different forms (such as fresh, frozen and
dehydrated) is very low.
Based on in-depth meetings with APEDA, marketing
boards such as the MSAMB, Vegetables and Fruit
Exporters Association (VAFA), exporters (12 exporters)
and processors (4), this case study tries to examine the
reasons for low exports and the potential for future
exports.
7.1 Overview of Green Peas Production
Green Peas (Pisum sativum), also known as garden peas, is cultivated in various regions of the
world, including India, in cool climatic conditions. Various varieties of green peas are grown
in India such as the Alaska, Lucknow Boniya, Asauji, Early Superb, Arkel, Boneville, T-19,
Khapar Kheda, and NP-29, to name a few. Each of these has its own speciality. For example,
NP-29 is suitable for dehydration.150
Globally, the major green pea producing countries are China, India, Canada, Russia, France
and the US (FAO, 2012).151 The global production of green peas has increased from
approximately 12 million MT in 2003 to 17 million MT in 2013. Within this, China was the
largest producer of green peas in 2013 with nearly 61 per cent of the share in total world
production, followed by India with approximately 23 per cent of the share in world production.
The share of the EU in world production of green peas in 2013 was approximately 5 per cent.152
Within the EU, France is the largest producer of green peas, and its share in total world
production in 2013 was 2 per cent, followed by the UK. However, the production for both
France and the UK (and for the EU in general) has been declining, while it has been increasing
steadily in China and India. Within the EU, production in Spain has been increasing153 (Table
7.1). The consumption of green peas in the EU has been rising in recent years and the market
is becoming highly competitive.154
150 http://nhb.gov.in/pdf/vegetable/peas/pea011.pdf (accessed on 9 June, 2016) 151 http://plants.usda.gov/plantguide/pdf/pg_pisa6.pdf (accessed on 6 June, 2016) 152 Source: FAOSTAT. Available at http://faostat3.fao.org/browse/Q/QC/E (accessed on 20 October, 2016) 153 Source: FAOSTAT. Available at http://faostat3.fao.org/browse/Q/QC/E (accessed on 19 October, 2016) 154 https://www.cbi.eu/sites/default/files/market_information/researches/product-factsheet-europe-fresh-beans-
peas-leguminous-vegtables-2015.pdf (accessed on 10 November, 2016)

100
Table 7.1: Producers of Green Peas: EU, Selected EU Member States and Other Countries (in MT)
Year EU France UK Spain China India
2003 1306793 420660 399050 55225 6800000 2061800
2004 1222843 364649 315100 69387 7300000 1901200
2005 1168589 359608 312800 54759 7900000 1944800
2006 1192695 351791 299690 77793 8400000 2270000
2007 1102294 337488 238510 73937 8900000 2402000
2008 1283969 349830 364320 75438 9353000 2491000
2009 1651315 664410 400890 91847 9592000 2916000
2010 1459402 570500 372830 83530 9910000 3029400
2011 1266421 258452 424723 85300 10267000 3517000
2012 893061 241154 132500 79500 10500000 3744800
2013 896124 228987 152570 85600 10600000 4006200
Source: FAOSTAT. Available at http://faostat3.fao.org/browse/Q/QC/E (accessed on 19 October, 2016)
Table 7.2 provides data on the productivity, yield and area harvested of green peas in India, which shows that production is increasing.
Table 7.2: Productivity, Yield and Area Harvested of Green Peas in India
Year Area harvested (Ha) Yield (Kg/Ha) Production (MT)
2004 285200 66662 1901200
2005 276300 70387 1944800
2006 286100 79343 2270000
2007 297000 80875 2402000
2008 313000 79585 2491000
2009 348000 83793 2916000
2010 364900 83020 3029400
2011 370000 95054 3517000
2012 408200 91739 3744800
2013 420900 95182 4006200
Source: FAOSTAT. Available at http://faostat3.fao.org/browse/Q/QC/E (accessed on 19 October, 2016)

101
In India, the major pea growing states are Uttar Pradesh, Madhya Pradesh, Jharkhand and
Punjab. In 2014-15, Uttar Pradesh alone accounted for more than 50 per cent of India’s total
pea production. The top 3 states producing peas in India (Uttar Pradesh, Madhya Pradesh and
Jharkhand) together accounted for more than 70 per cent of India’s total production in 2014-
15.
Figure 7.1: Share of Different States in Production of Pea, 2014-2015 (in percentage)
Source: APEDA. Available at http://agriexchange.apeda.gov.in/India%20Production/India
_Productions.aspx?cat=Vegetables&hscode=1082 (accessed on 19 October, 2016)
7.2 Export of Peas from India
Peas from India are exported in fresh or chilled form (HS Code: 07081000), frozen form (HS
Code: 07102100), dried form (HS Code: 07131000) and preserved/processed (but not frozen)
form (HS Code: 20054000).
Although India is a major producer of green peas, its export of green peas to the world is quite
low. In 2014-15, out of the total pea production of 4,651,540 MT, only 35,077.67 MT was
exported, which is less than one per cent of production.155 A large part of the exports of dried
and shelled peas are to Myanmar, of fresh and chilled shelled and unshelled peas are to Pakistan
and Saudi Arabia, of frozen peas to the Middle Eastern countries including Saudi Arabia,
Kuwait and the UAE, and of preserved peas to Saudi Arabia and Kuwait. Export of peas to the
EU is negligible, and almost zero in the preserved/processed (but not frozen) category. Out of
the above mentioned categories, frozen peas account for the largest proportion of export from
India to the world.
155 Source: APEDA (accessed on 20 October, 2016)
Uttar Pradesh
53%
Madhya Pradesh
13%
Jharkhand
8%
Himachal Pradesh
6%
Punjab
5%
West Bengal
3%
Haryana
2%
Rest of India
10%
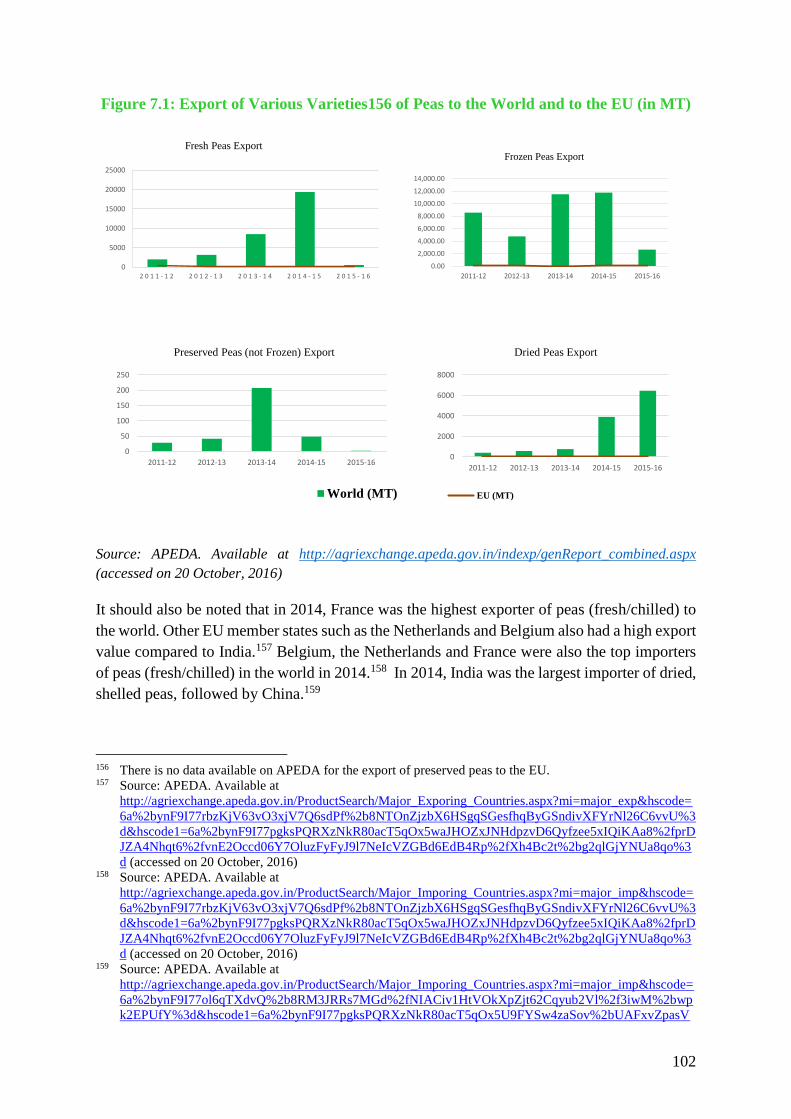
102
Figure 7.1: Export of Various Varieties156 of Peas to the World and to the EU (in MT)
Source: APEDA. Available at http://agriexchange.apeda.gov.in/indexp/genReport_combined.aspx
(accessed on 20 October, 2016)
It should also be noted that in 2014, France was the highest exporter of peas (fresh/chilled) to
the world. Other EU member states such as the Netherlands and Belgium also had a high export
value compared to India.157 Belgium, the Netherlands and France were also the top importers
of peas (fresh/chilled) in the world in 2014.158 In 2014, India was the largest importer of dried,
shelled peas, followed by China.159
156 There is no data available on APEDA for the export of preserved peas to the EU. 157 Source: APEDA. Available at
http://agriexchange.apeda.gov.in/ProductSearch/Major_Exporing_Countries.aspx?mi=major_exp&hscode=
6a%2bynF9I77rbzKjV63vO3xjV7Q6sdPf%2b8NTOnZjzbX6HSgqSGesfhqByGSndivXFYrNl26C6vvU%3
d&hscode1=6a%2bynF9I77pgksPQRXzNkR80acT5qOx5waJHOZxJNHdpzvD6Qyfzee5xIQiKAa8%2fprD
JZA4Nhqt6%2fvnE2Occd06Y7OluzFyFyJ9l7NeIcVZGBd6EdB4Rp%2fXh4Bc2t%2bg2qlGjYNUa8qo%3
d (accessed on 20 October, 2016) 158 Source: APEDA. Available at
http://agriexchange.apeda.gov.in/ProductSearch/Major_Imporing_Countries.aspx?mi=major_imp&hscode=
6a%2bynF9I77rbzKjV63vO3xjV7Q6sdPf%2b8NTOnZjzbX6HSgqSGesfhqByGSndivXFYrNl26C6vvU%3
d&hscode1=6a%2bynF9I77pgksPQRXzNkR80acT5qOx5waJHOZxJNHdpzvD6Qyfzee5xIQiKAa8%2fprD
JZA4Nhqt6%2fvnE2Occd06Y7OluzFyFyJ9l7NeIcVZGBd6EdB4Rp%2fXh4Bc2t%2bg2qlGjYNUa8qo%3
d (accessed on 20 October, 2016) 159 Source: APEDA. Available at
http://agriexchange.apeda.gov.in/ProductSearch/Major_Imporing_Countries.aspx?mi=major_imp&hscode=
6a%2bynF9I77ol6qTXdvQ%2b8RM3JRRs7MGd%2fNIACiv1HtVOkXpZjt62Cqyub2Vl%2f3iwM%2bwp
k2EPUfY%3d&hscode1=6a%2bynF9I77pgksPQRXzNkR80acT5qOx5U9FYSw4zaSov%2bUAFxvZpasV
0
2000
4000
6000
8000
2011-12 2012-13 2013-14 2014-15 2015-16
Dried Peas Export
EU (MT)
0
50
100
150
200
250
2011-12 2012-13 2013-14 2014-15 2015-16
Preserved Peas (not Frozen) Export
World (MT)
0.00
2,000.00
4,000.00
6,000.00
8,000.00
10,000.00
12,000.00
14,000.00
2011-12 2012-13 2013-14 2014-15 2015-16
Frozen Peas Export
0
5000
10000
15000
20000
25000
2 0 1 1 - 1 2 2 0 1 2 - 1 3 2 0 1 3 - 1 4 2 0 1 4 - 1 5 2 0 1 5 - 1 6
Fresh Peas Export

103
It can be seen from Figure 7.2 that fresh peas’ exports saw a sudden increase in the year 2014-
15, and fell in the year 2015-16. This is due to the fact that fresh pea exports to Pakistan
increased from 7457.77 MT in 2013-14 to 18615.04 MT in 2014-15 and became zero in the
year 2015-16. This trend is similar to the export of eggplant from India to Pakistan, which
suddenly rose in 2013-14 and fell in 2014-15. Dried peas exports from India also saw a sudden
rise after 2013-14. This is due to the fact that exports to Sri Lanka and Bangladesh increased
substantially in 2014 (although, exports to Bangladesh became zero in 2015-16).
The export of preserved peas from India is very low and its export to the EU is negligible. As
in the case of fresh and dried peas, preserved peas exports increased suddenly in 2013-14 due
to a rise in exports to the UAE, which fell in 2014-15. Thus, overall, there has been a sporadic
rise and a sudden fall in exports to other countries and India does not seem to have a steady
export market for green peas.
7.3 Fresh Peas Supply Chain
Figure 7.3 depicts the typical export value chain of fresh peas from India. Fresh peas are grown
by a number of small and medium-sized farmers across India. Since the export quantity of peas
is small, exporters fill the containers with other vegetables and export it all together.
The survey found that exporters purchase the product from farmers, farmer associations, farmer
producer groups or mandis. In the survey, exporters pointed out that they prefer to purchase
the peas from aggregators, farmer producer groups and mandis, because there is wide variation
in quality of peas sold, and exporters choose to purchase only products of good quality that are
fit for the export market. The mandis and aggregators sort the products, which enables
exporters to select better quality produce. Working directly with a large number of farmers is
costly and time consuming, and farmers tend to charge a higher price for products if they are
selling directly to exporters. Since exporters purchase from mandis and aggregators, it is
difficult to ensure traceability.
The agents, on behalf of exporters, physically sort out the stock and choose the appropriate
quality products, and then move on to negotiate the price. Once the price is agreed upon, they
purchase the products and further sort it by export destination. For example, the best quality
produce is sorted for the EU while some which do not meet EU’s quality standards are exported
to the Middle East and South Asian countries. Once exporters sort and grade the products, they
are then taken to APEDA approved pack houses for further checks. Although fresh peas have
to go through phytosanitary checks, APEDA has given procedures for Exports of Vegetables
in the report titled “Procedures for Exports of Vegetables”.160 However, it is not mandatory for
exporters to follow these.
LO%2b8zCDGGvBz9ogF3I4%2frHWS2lFYQm8Fbli23S%2b6h5wuvDTnqybhrHxV%2bWZHnZASdMB
gddvUDI6Z8U6b3ZM6XwjSVp%2fdy3w%3d%3d (accessed on 20 October, 2016) 160 Link to the report: http://apeda.gov.in/apedawebsite/HACCP/procedure-for-ffv-exports-2015.pdf (accessed
on 18 October, 2016)

104
After getting the necessary clearances for exports, the produce is transported in reefer vehicles
to the airport – most of the fresh and frozen pea exports go through the air transport mode. The
shipments reach EU airports, from where importers/buyers collect them and complete the
customs clearances. The peas are then sold to wholesalers or retailers, who in turn sell it to
consumers, based on their preference for fresh, frozen or chilled peas.
In the case of processed or frozen peas, the processing is done in India. Most of the companies
in the processed food segment that export to the EU have state-of-the-art technology and have
also got various certifications from EU bodies such as the BRC and SGS. Some exporters of
frozen and chilled peas, such as Taj Frozen Foods India Limited, are also certified by these EU
bodies
Figure 7.1: Value Chain in Green Peas for Export to the EU
Source: Compiled by authors from the survey findings

105
7.4 SPS Issues in Green Peas
The survey showed that Indian exports have not faced any SPS barriers in the EU. This is also
substantiated by data in EU’s EUROPHYT and RASFF portals. There are zero interceptions
on the EUROPHYT portal and no notifications for non-compliance on the RASFF portal for
green peas between the year 2005 and September 2016.
Although exporters could not give any information on SPS barriers in green peas, some studies
show that green peas in India have faced issues regarding adulteration. A common adulterant
in green pea is the Malachite green dye, which is a hazardous substance, used as a colouring
agent (Ashok et al., 2014) to increase the glow of the pea and make it bright green. It is a dye
which has proven to be carcinogenic for humans if consumed over a long period of time
(Lakshmi et al., 2012). Another adulterant used is argemone seed, which is used to add bulk
and weight to the pea.
7.5 The Way Forward
Exporters, APEDA and other exporters’ associations such as the VAFA were not aware of any
SPS barriers. However, the survey found that there are areas where India and the EU can
collaborate to mutually benefit both.
The EU produces superior quality peas and there is scope for improvement in the quality of
peas produced in India. In this regard, the EU can share knowledge about good cultivation
practices and better varieties of peas. EU representatives can come to India to engage in
knowledge sharing with farmers and exporters. India can learn from EU best practices. This
can be facilitated under the aegis of the EU-India CITD programme. This will enable India and
the EU to partner and venture into new export markets and increase their export potential.
Further, India can acquire better technology to improve the shelf life of products such as
dehydrated peas, and better packaging techniques. In India, fresh peas are grown only in one
season; however, there is year-round demand. Therefore, India can learn from the EU in terms
of storage and packaging techniques.
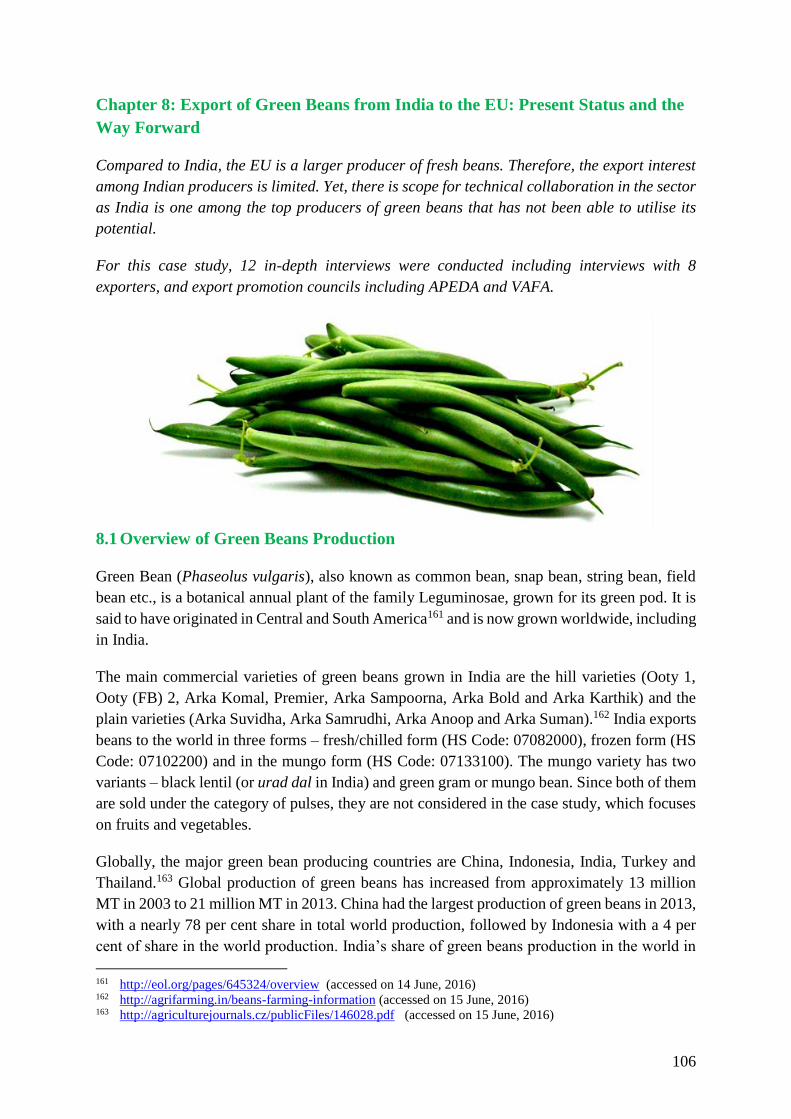
106
Chapter 8: Export of Green Beans from India to the EU: Present Status and the
Way Forward
Compared to India, the EU is a larger producer of fresh beans. Therefore, the export interest
among Indian producers is limited. Yet, there is scope for technical collaboration in the sector
as India is one among the top producers of green beans that has not been able to utilise its
potential.
For this case study, 12 in-depth interviews were conducted including interviews with 8
exporters, and export promotion councils including APEDA and VAFA.
8.1 Overview of Green Beans Production
Green Bean (Phaseolus vulgaris), also known as common bean, snap bean, string bean, field
bean etc., is a botanical annual plant of the family Leguminosae, grown for its green pod. It is
said to have originated in Central and South America161 and is now grown worldwide, including
in India.
The main commercial varieties of green beans grown in India are the hill varieties (Ooty 1,
Ooty (FB) 2, Arka Komal, Premier, Arka Sampoorna, Arka Bold and Arka Karthik) and the
plain varieties (Arka Suvidha, Arka Samrudhi, Arka Anoop and Arka Suman).162 India exports
beans to the world in three forms – fresh/chilled form (HS Code: 07082000), frozen form (HS
Code: 07102200) and in the mungo form (HS Code: 07133100). The mungo variety has two
variants – black lentil (or urad dal in India) and green gram or mungo bean. Since both of them
are sold under the category of pulses, they are not considered in the case study, which focuses
on fruits and vegetables.
Globally, the major green bean producing countries are China, Indonesia, India, Turkey and
Thailand.163 Global production of green beans has increased from approximately 13 million
MT in 2003 to 21 million MT in 2013. China had the largest production of green beans in 2013,
with a nearly 78 per cent share in total world production, followed by Indonesia with a 4 per
cent of share in the world production. India’s share of green beans production in the world in
161 http://eol.org/pages/645324/overview (accessed on 14 June, 2016) 162 http://agrifarming.in/beans-farming-information (accessed on 15 June, 2016) 163 http://agriculturejournals.cz/publicFiles/146028.pdf (accessed on 15 June, 2016)
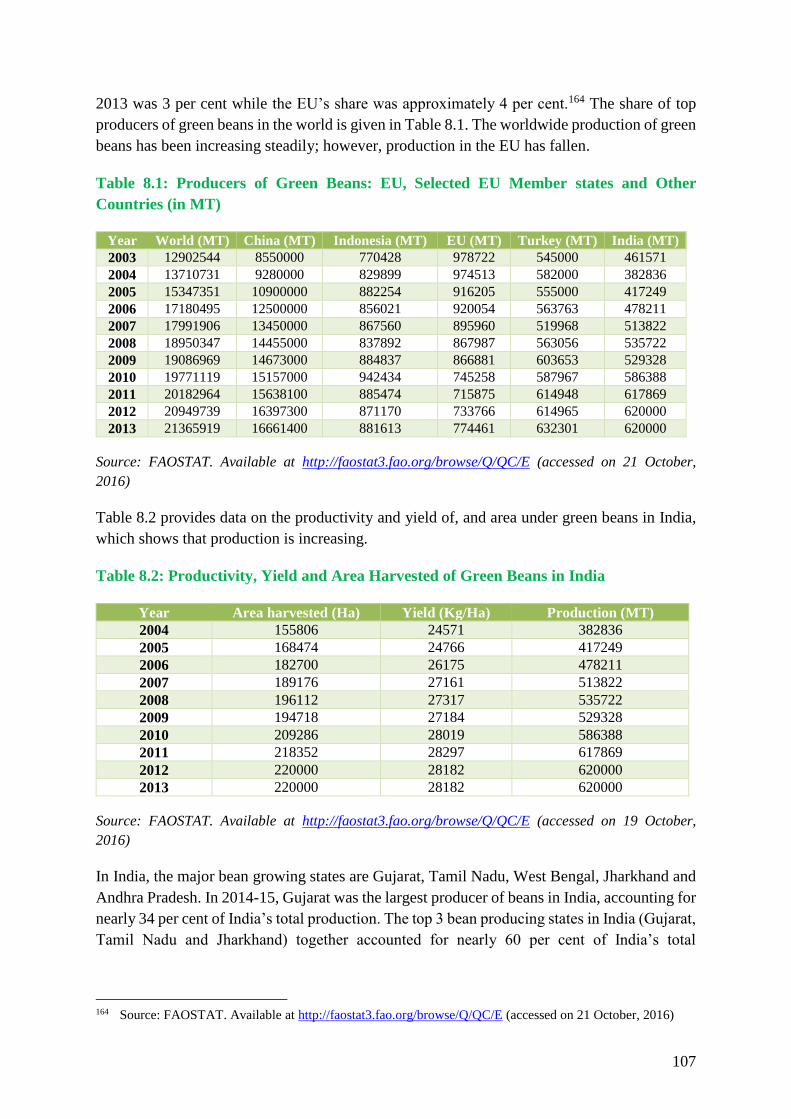
107
2013 was 3 per cent while the EU’s share was approximately 4 per cent.164 The share of top
producers of green beans in the world is given in Table 8.1. The worldwide production of green
beans has been increasing steadily; however, production in the EU has fallen.
Table 8.1: Producers of Green Beans: EU, Selected EU Member states and Other
Countries (in MT)
Year World (MT) China (MT) Indonesia (MT) EU (MT) Turkey (MT) India (MT)
2003 12902544 8550000 770428 978722 545000 461571
2004 13710731 9280000 829899 974513 582000 382836
2005 15347351 10900000 882254 916205 555000 417249
2006 17180495 12500000 856021 920054 563763 478211
2007 17991906 13450000 867560 895960 519968 513822
2008 18950347 14455000 837892 867987 563056 535722
2009 19086969 14673000 884837 866881 603653 529328
2010 19771119 15157000 942434 745258 587967 586388
2011 20182964 15638100 885474 715875 614948 617869
2012 20949739 16397300 871170 733766 614965 620000
2013 21365919 16661400 881613 774461 632301 620000
Source: FAOSTAT. Available at http://faostat3.fao.org/browse/Q/QC/E (accessed on 21 October,
2016)
Table 8.2 provides data on the productivity and yield of, and area under green beans in India,
which shows that production is increasing.
Table 8.2: Productivity, Yield and Area Harvested of Green Beans in India
Year Area harvested (Ha) Yield (Kg/Ha) Production (MT)
2004 155806 24571 382836
2005 168474 24766 417249
2006 182700 26175 478211
2007 189176 27161 513822
2008 196112 27317 535722
2009 194718 27184 529328
2010 209286 28019 586388
2011 218352 28297 617869
2012 220000 28182 620000
2013 220000 28182 620000
Source: FAOSTAT. Available at http://faostat3.fao.org/browse/Q/QC/E (accessed on 19 October,
2016)
In India, the major bean growing states are Gujarat, Tamil Nadu, West Bengal, Jharkhand and
Andhra Pradesh. In 2014-15, Gujarat was the largest producer of beans in India, accounting for
nearly 34 per cent of India’s total production. The top 3 bean producing states in India (Gujarat,
Tamil Nadu and Jharkhand) together accounted for nearly 60 per cent of India’s total
164 Source: FAOSTAT. Available at http://faostat3.fao.org/browse/Q/QC/E (accessed on 21 October, 2016)

108
production in 2014-15.165 Figure 8.1 gives the share of various states in India’s total bean
production.
Figure 8.1: Share of Different States in Production of Beans, 2014-2015 (in percentage)
Source: APEDA. Available at http://agriexchange.apeda.gov.in/India%20Production/India_
Productions.aspx?hscode=1067 (accessed on 21 October, 2016)
8.2 Export of Beans from India
Under this study, two varieties of beans exported from India are considered – beans exported
in the fresh or chilled form and beans exported in the frozen form. Compared to India’s
production, India’s export of beans to the world and to the EU is very low. In 2014-15, India’s
production of beans was approximately 2.2 million MT, out of which approximately 850 MT
was exported (which is less than one per cent of production). The top export destinations for
green beans from India in 2014-15 were the US and Sri Lanka. India’s bean export to the EU
in 2014-15 was 20 per cent of the total bean export to the world by India. India exports a larger
quantity of frozen green beans compared to fresh/chilled green beans to the world and to the
EU.166
In the EU, the UK, Germany, Ireland and Belgium are the top importers of Indian beans,
although the quantity is very low. Major export destinations of Indian green beans are the South
Asian countries (such as Maldives, Sri Lanka and Bangladesh) and countries from the Middle
East (such as the UAE and Qatar).
EU member states such as France and the Netherlands are the top exporters of fresh and chilled
green beans in the world, and Spain, Belgium and the UK are some of the major importing
165 Source: APEDA. Available at http://agriexchange.apeda.gov.in/India%20Production/India_
Productions.aspx?hscode=1067 (accessed on 21 October, 2016) 166 Source: APEDA
Gujarat
34%
Tamil Nadu
16%Jharkhand
9%
Karnataka
7%
West Bengal
6%
Andhra Pradesh
5%
Bihar
5%
Rest of India
18%

109
countries of fresh and chilled green beans in the world.167 Uganda and Kenya are the countries
from where EU member states primarily import green beans.
Figure 8.1: Export of Various Varieties of Green Beans to the World and
to the EU (in MT)
Source: APEDA. Available at http://agriexchange.apeda.gov.in/indexp/genReport_combined.
aspx#content (accessed on 21 October, 2016)
Figure 8.2 shows that export of fresh/chilled green beans from India is lower than the export
of frozen beans. The export of fresh/chilled beans to the world has been more or less steady,
except when it rose in 2013-14 and fell in 2014-15. The export of fresh/chilled beans to the EU
has increased in the past couple of years due to increased exports to the UK and France. On the
other hand, the export of frozen beans to the world has fallen since 2011 and its export to the
EU increased in 2012 and has remained steady since then.
Overall, it can be seen that the export of green beans in both the varieties is very low compared
to production.
Focusing on the EU market, the EU imports fresh green beans from developing countries such
as Morocco and Kenya. Countries like Senegal are now growing suppliers of green beans to
the EU. France is a large producer of preserved beans within the EU while most imports are
through the Netherlands. Kenya has penetrated the UK market for beans rapidly. These
developing countries generally provide round the year supply to EU retail chains. Studies show
that EU buyers and retailers are becoming increasingly strict on quality and residue levels and
they prefer to buy produce from large suppliers, for reasons of supply certainty, product
traceability and uniformity.168
8.3 Supply Chain for Fresh Beans in India, Exports to the EU and Some
Concerns
The supply chain of green beans is similar to green peas and hence, one can refer to Figure 7.3
in Chapter 7. For this case study, in-depth interviews were conducted with 8 exporters. Most
167 Source: APEDA 168 https://www.cbi.eu/sites/default/files/market_information/researches/product-factsheet-europe-fresh-beans-
peas-leguminous-vegtables-2015.pdf (accessed on 10 November, 2016)
0.00
500.00
1,000.00
1,500.00
2011-12 2012-13 2013-14 2014-15 2015-16
Frozen Beans Export
EU (MT)
0
100
200
300
2011-12 2012-13 2013-14 2014-15 2015-16
Fresh/Chilled Beans Export
World (MT)

110
exporters interviewed were large exporters (such as Keventer Agro Limited and Kay Bee
Exports), but their green beans export to the EU was low and depended on the requirement of
importers. Most of the exports were to the UK and some to other countries like Italy. All
exporters have been exporting to the EU since before 2007 (except one, who started exporting
a year ago). All exporters interviewed claimed that their consignments had never been
prevented from entering the EU, nor have they faced any SPS barriers.
Secondary data also confirmed that there have been no major SPS barriers faced by Indian
green beans exporters in the EU. Between 2000 and 2016, there have been only three
notifications on the RASFF portal – one in 2009, one in 2012 and one in 2016. All three cases
were notified to the EU by the UK. The shipments were detained at UK ports because the beans
contained pesticide residues (of methyl and triazophos) higher than the prescribed limits. On
the EUROPHYT portal, between 2005 and September 2016, there was one interception in 2014
and one in 2015 for the pest Lepidoptera (a fly or a moth).
Except for the above mentioned isolated cases of non-compliance, Indian exporters exporting
green beans to the EU have not faced any major SPS barriers.
One important SPS barrier that can arise in the production and export of green beans is
adulteration. Just like in green peas, a major export barrier for green beans can be the Malachite
green dye, which is added to enhance the green glowing colour of the vegetable. The coloured
dye has been proven to be carcinogenic for humans if consumed over a long period of time.169
While this issue has been detected in some export consignments, these consignments were not
for the EU market.
8.4 The Way Forward
India is not a major exporter of green beans to the EU, and the survey participants and APEDA
were not aware of any SPS barriers while exporting to the EU.
There are areas where India and the EU could collaborate for mutual benefit. EU’s production
of green beans is higher and of a better quality than India’s. In this context, EU officials can
come to India to engage with Indian farmers as well as exporters for knowledge and technology
sharing. The EU-India CITD programme can bring together representatives from both regions
to raise the production and quality of beans produced in India. This will enable both India and
the EU to together venture into new export markets. Further, India can learn from the EU in
terms of the latest technologies used for improving the shelf life of green beans such as
freezing, freeze-dry technology for dehydrating the product and advanced packaging
technologies for ensuring that the products can be stored for longer.
169 http://www.ijsit.com/admin/ijsit_files/FOOD%20ADULTERATION_1.2.4.pdf (accessed on 8 June, 2016)

111
Chapter 9: Case Study of Indian Eggplant: A Vegetable that Faced a
Ban in the EU
In May 2014, the EU banned import of eggplant from India, along with mango and three other
fresh vegetables, namely, snake gourd, bitter gourd and taro, after detecting a high incidence
of pests (such as thrips and moths). While the ban on
mangoes was lifted in January 2015, the ban on
eggplants was lifted on 31 December, 2016.
This case study highlights the issues in eggplant
cultivation and exports that led to the ban. It points
out ways in which India and the EU can work together
to address the problem and how India can learn from
the EU’s experiences of pest-free eggplant
production. It also highlights that it is important for
Indian policymakers to focus on safe agriculture and best practices.
The study is based on in-depth interviews with APEDA, marketing boards such as the MSAMB,
VAFA, processors, exporters and farmers, to understand the cause of the rampant presence of
pests in the crop and the measures taken by them to overcome the problem. In total, 12
interviews were conducted in West Bengal, which is the largest producer of eggplant and
Maharashtra (Mumbai and Pune), which is the export hub, with stakeholders engaged in the
export of fresh and/or frozen eggplant.
9.1 Production of Eggplant
Eggplant (Solanum melogena L.), also known by other names such as brinjal and aubergine, is
said to have originated in India and is known to have been cultivated for over 4,000 years.
There are approximately 2,500 varieties of eggplant of various shapes extending from oval or
egg shaped to long or club shaped; and colours ranging from white, yellow, green, and purple
to nearly black,170 and almost all of these varieties are grown in India. The cultivation of
eggplant requires a tropical climate (high rainfall and high temperatures);171 therefore, it is
suitable for cultivation in Asia, Africa and the Mediterranean region. Asia alone accounts for
approximately 90 per cent of world eggplant production.172
Globally, China is the largest producer of eggplant followed by India. The global production
of eggplant has increased from approximately 32 million MT in 2005 to 50 million MT in 2013.
China’s share in global production was approximately 60 per cent in the year 2013 (with 28.43
million MT production), followed by India with a share of approximately 30 per cent (with
13.44 million MT production). In Europe, Turkey is the largest producer of eggplant, and its
170 http://www.davidpublishing.com/davidpublishing/Upfile/12/13/2012/2012121309101961.pdf (accessed on
1 June, 2016) 171 Source: http://203.64.245.61/fulltext_pdf/EB/2001-2010/eb0122.pdf (accessed on 13 October, 2016) 172 Source: FAOSTAT. Available at http://faostat3.fao.org/browse/Q/QC/E (accessed on 13 October, 2016)

112
share in world production in 2013 was only two per cent (with 0.82 million MT),173 followed
by Italy. While the overall production in EU, Turkey and Italy are declining, the production in
other EU member countries such as Spain and the Netherlands is increasing. However, the rate
of increase for India and China has been higher over the years (Table 9.1).
Table 9.1: Producers of Eggplant: EU, Selected EU Member states and Other Countries
(in MT)
Year EU Turkey Spain Netherlands Italy China India
2003 854,358 935,000 175,629 39,000 368,992 16,000,000 7,830,000
2004 882,423 900,000 175,534 41,000 366,461 16,500,000 8,477,300
2005 782,968 930,000 163,783 42,000 338,803 17,000,000 8,600,800
2006 810,339 924,165 167,991 40,000 338,361 17,500,000 9,364,300
2007 776,783 863,737 179,826 41,000 334,966 22,000,000 9,453,000
2008 852,606 813,686 198,768 43,000 321,795 23,722,000 9,678,000
2009 867,334 816,134 207,269 46,000 316,809 25,885,000 10,377,600
2010 809,431 846,998 190,195 46,000 302,551 26,740,000 10,563,000
2011 791,689 821,770 215,769 46,000 243,319 26,507,000 11,896,000
2012 757,209 799,285 245,900 47,000 217,690 27,698,600 12,634,000
2013 722,503 826,941 206,300 48,000 220,153 28,433,500 13,444,000
Source: FAOSTAT. Available at http://faostat3.fao.org/browse/Q/QC/E (accessed on 14 October,
2016)
India grows various varieties of eggplants, including high yielding varieties and hybrid
varieties. Most of the superior varieties grown were developed by public sector institutions
under the aegis of the ICAR and state agricultural universities. In the past decade, both the area
harvested and the production of eggplant has increased (see Table 9.2).
Table 9.2: Area, Production and Productivity of Eggplant in India
Year Area Harvested (Ha) Yield (Kg/Ha) Production (MT)
2005 526,500 163,358 8,600,800
2006 559,700 167,309 9,364,300
2007 568,000 166,426 9,453,000
2008 561,000 172,513 9,678,000
2009 600,300 172,874 10,377,600
2010 612,400 172,485 10,563,000
2011 680,000 174,941 11,896,000
2012 692,000 182,572 12,634,000
2013 722,000 186,205 13,444,000
Source: FAOSTAT. Available at http://faostat3.fao.org/download/Q/QC/E (accessed on 14 October,
2016)
Eggplant is grown in almost all parts of India. The major eggplant producing states are West
Bengal, Odisha, Gujarat, Madhya Pradesh and Bihar. Figure 9.1 shows that more than 50 per
173 Source: FAOSTAT. Available at http://faostat3.fao.org/download/Q/QC/E (accessed on 13 October, 2016)

113
cent of eggplant production in India is concentrated in three states, namely West Bengal,
Odisha and Gujarat.
Figure 9.1: Share of Different States in the Production of Eggplant, 2014-2015
(in percentage)
Source: APEDA. Available at http://agriexchange.apeda.gov.in/India%20Production/India_
Productions.aspx?hscode=1070 (accessed on 13 October, 2016)
9.2 Export of Eggplant from India
Globally, the top eggplant producing nations are also its major consumers, and this is true for
both India and China. Hence, the share of export of eggplants as a percentage of total
production for these nations is very low. In 2013, the total production of eggplant in India was
13,444,000 MT174, of which only 1,883.67 MT175 was exported, which is less than one per cent.
In the case of the EU, the consumption of eggplant has increased over time. EU member states
and neighbouring countries such as Turkey produce eggplant. Intra-EU trade accounts for the
bulk of EU’s trade in eggplant. For example, Germany and France get eggplant from countries
such as Spain and the Netherlands. The main countries from which EU imports eggplant
include Turkey, Kenya, Dominican Republic and Uganda. In 2013, India and China ranked
27th and 37th respectively among extra-EU countries from which the EU imports eggplant.176
EU imports more eggplant from ASEAN countries such as Thailand177 and Malaysia compared
to India and China, although their share in global production is very low. It is also important to
note that some of these countries have got in experts from EU member countries such as the
Netherlands and are able to grow a number of fruits and vegetables that meet EU’s standards
(see ICRIER, 2015).
The data on exports of fresh and frozen eggplant from India (Table 9.3) show that exports are
low except for the year 2013-14, when there was a sudden surge in export to Pakistan. Within
174 Source: FAOSTAT. Available at http://faostat3.fao.org/browse/Q/QC/E (accessed on 13 October, 2016) 175 Source: APEDA. Available at http://agriexchange.apeda.gov.in/indexp/genReport_combined.aspx#content
(accessed on 13 October, 2016) 176 Source: WITS (accessed on 13 October, 2016) 177 Source: WITS (accessed on 13 October, 2016)
West Bengal
24%
Odisha
17%
Gujarat
12%
Madhya Pradesh
9%
Bihar
9%
Chhattisgarh
5%
Maharashtra
4%
Rest of India
20%

114
the EU, the UK is the main import destination. Table 9.3 also shows that the import destination
for Indian eggplant varies. Although India is not able to export fresh eggplant to the EU after
the imposition of the ban in the year 2014, there are some exports of frozen and processed
eggplant to countries like Spain. This can be attributed to the fact that some Indian exporters
(such as Taj Frozen Foods India Limited) are exporting frozen processed eggplant. It was
pointed out during the survey that the process of boiling and subsequently freezing the eggplant
using modern technology can help eradicate pest infections and related issues.
Table 9.1: Top Importing Nations of Eggplant from India
Country Qty. 2012-13
(MT)
Qty. 2013-14
(MT)
Qty. 2014-15
(MT)
Qty. 2015-16
(MT)
Qatar 0 0.65 0 6.34
United Arab Emirates
(UAE)
2.27 1.68 1.51 3.11
Maldives 0.95 0.2 2.67 2.1
Nepal 0 2.98 0 1
Kuwait 0 0.61 2.73 0.1
Spain 0 0 0 0.04
Canada 0 0 4.84 0
Oman 0 0 0.7 0
Germany 9.46 5.25 0 0
United Kingdom 227.09 52.89 0 0
Hong Kong 0 0 0.92 0
Pakistan 0 1815.62 17.8 0
Russia 0 0 0.09 0
Bahrain 0 0 1.35 0
United States 0 0 15 0
Sweden 19.35 3.8 0 0
Singapore 0 0 6.13 0
Total Exports to the World 259.16 1,883.67 53.74 12.70
Source: APEDA. Available at http://agriexchange.apeda.gov.in/indexp/genReport_combined.
aspx#content (accessed on 14 October, 2016)
The next section examines the supply chain for eggplant. It also highlights why it is difficult
for exporters to have control over the crop, inputs used and farming methodology.
9.3 The Eggplant Supply Chain
Figure 9.2 below depicts the typical export value chain of fresh eggplants. The survey found
that eggplant is grown by a large number of small and mid-sized farmers across a number of
states in India. The quantity of export is small and often the exporter has to fill in the container
with other vegetables like bitter gourd along with eggplant. Before the ban in the EU, eggplants
could be exported in both fresh and frozen forms. After the ban, only a small quantity of frozen
eggplant is exported.
The survey found that exporters buy the products either from aggregators or mandis. Most
exporters use both options. It was pointed out by exporters that while making a purchase,

115
farmers and aggregators charge a premium price if they mention that the product is for export.
All exporters pointed out that they would not like to directly source products from farmers
because there is wide variation in the quality of the produce and exporters only need superior
quality products for export markets. If the exporters source from mandis or aggregators, they
can selectively buy only the better quality products. Contrarily, if they had to directly source
from farmers, they had to work with a large number of farmers (more than 100) at a time, which
is difficult and costly. Exporters and their association further argued that if the volume of export
is low, it is not financially viable to directly source from farmers and to establish supply chain
traceability to farmers, as farm sizes are very small in India.
The exporters or their company agents physically inspect the product with aggregators and in
the mandis, select the best products and then negotiate the price. Once the price is agreed upon,
they purchase the products and further sort it by export destination. For example, the best
quality produce is exported to the EU while some, which do not meet EU’s quality standards,
are exported to the Middle East and South Asian countries. Once exporters sort and grade the
product, it is then taken to APEDA approved pack houses for further checks. To meet
phytosanitary requirements of importing countries – in this case the EU and its member states
– a phytosanitary certificate is issued by the Directorate of Plant Protection, Quarantine and
Storage, which can only be issued if the consignment is processed and packed in APEDA
approved pack houses and inspected by plant quarantine inspectors. In addition, export
consignments are sampled in APEDA approved laboratories for checking the MRLs for
agrochemicals to ensure compliance with EU regulations. The vegetables banned in the EU or
those that have previously faced problems, namely bitter gourd, brinjal (eggplant), curry leaves,
drumstick and green chillies, have to strictly follow this process.
Once the phytosanitary inspection is done and the certificate is issued, the produce is
transported in reefer vehicles to the airport; most eggplant exports are through air transport.
Shipments are collected by importers/buyers at European airports for customs clearances.
In the case of processed or frozen eggplants, the processing is done in India. Most of the
companies in the processed food segment exporting to the EU have state-of-the-art technology
and have various certifications from EU bodies such as the BRC and SGS. Some of the
exporters of fresh eggplant such as Kay Bee Exports are also certified by these EU bodies.

116
Figure 9.1: Value Chains in Fresh Eggplant for Export to the EU
Source: Compiled by authors from the survey findings
Aggregators / Middlemen
Aggregators / Middlemen
Mandi/Agriculture
Market
APEDA Approved Pack
Houses Farmer
Association
Exporter
Sorting/Grading Phytosanitary Inspection
Reefer Vehicle Airport
Airport in EU Member
state
Buyers/Importers Wholesale/Retail
Consumers
Farmers Consumers

117
9.4 Ban on Export of Eggplant from India
In April 2014, the Standard Committee of Plant Health of the European Commission
recommended a ban on the import of eggplant (along with three other vegetables namely, snake
gourd, bitter gourd and taro) and mango from India to tackle the issue of shortcomings in
phytosanitary certification and high incidence of pests that had increased after 2010. The ban
was put in place for imports coming in from May 2014 and was a result of the recommendation
of the Standing Committee’s meeting on 25-26th March, 2014.178 The emergency measures
were introduced by the European Commission Implementing Decision of 24 April 2014 "On
Measures to Prevent the Introduction into and the Spread within the Union of Harmful
Organisms as regards Certain Fruits and Vegetables Originating in India" (2014/237/EU).179
Between 2005 and 2014, there were 108 interceptions on the EUROPHYT portal for eggplant
being exported from India. The consignments were rejected at various EU ports due to the
presence of pests such as melon thrips, silverleaf whiteflies, eggplant fruit and shoot borers
(EFSB), and moths. Figure 9.3 charts the number of interceptions that were issued for Indian
eggplant consignments between 2005 and 2015. The graph shows that the number of
interceptions varies across years, but they seems to show a downward trend after 2007 and was
zero in 2010. After 2011, there has been a steep increase in the incidence of pests and that led
to the ban in the year 2014.
Figure 9.1: Number of Interceptions for Eggplant on the EUROPHYT Portal
Source: EUROPHYT Portal. Available at http://ec.europa.eu/food/plant/plant_health_biosecurity/
europhyt/interceptions/index_en.htm (accessed on 23 September, 2016)
The EC conducted audits in the years 2010, 2013 and 2014 to check into the continued
interceptions of harmful organisms in the consignments of eggplant exported from India to the
178 Summary Report of the Meeting: http://ec.europa.eu/food/plant/docs/sc_plant-health_20140325_sum.pdf
(accessed on 17 October, 2016); Agenda of the Meeting: http://ec.europa.eu/food/plant/docs/sc_plant-
health_20140325_agenda.pdf (accessed on 17 October, 2016) 179 http://publications.europa.eu/en/publication-detail/-/publication/e36a4914-5617-4a19-9cb2-
57eec3116d7e/language-en (accessed on 13 February, 2017)
EU Imposes
Ban

118
EU, as well as non-compliant wood packaging material (WPM). The audits had taken place to
assess the system of phytosanitary tests and regulations that were in place in India. It is
interesting to note that, in 2010, since there were zero interceptions for Indian eggplant, the
audit cleared exports of Indian eggplant to the EU. The audit of 2013 discovered additional
shortcomings with respect to the facilities for export inspections, and the conduct of the checks
themselves.180 This caused several consignments being intercepted on arrival in the EU with
quarantine pests, mainly insects like thrips, houseflies, moths and whiteflies. Despite
assurances and action taken by India after the 2010 audit, the number of interceptions increased
sharply in 2012 and 2013. This led to the ban of imports from India in the year 2014. The EC
performed another audit of export controls in September 2014. A continuous review was
carried out throughout the whole period of the ban on mango and four vegetables including
eggplant and eventually the decision was reviewed in December 2015; this revision lifted the
ban on mangoes, but the ban on eggplant and the other vegetables continued to be in place.181
Later, in October 2016, the EU authorities informed India that emergency measures were
reviewed on the basis of information provided by India and there was a decrease in the number
of import interceptions. The decrease in the number of interceptions indicated that the
phytosanitary export certification system of India had improved. As a result, it was announced
that the EC decided not to prolong the emergency measures set out in Decision 2014/237/EU,
and the ban was lifted on 31 December 2016.
The analysis of the types of pests that infected eggplant consignments shows that some breeds
of pests were more common than others (see Figure 9.4). Different varieties of thrips and EFSB
were the most commonly occurring pests. Among the breed of thrips, melon thrips were the
most common pests, with 23 notifications between the years 2005-2015.
180 Source: ec.europa.eu/food/fvo/act_getPDF.cfm?PDF_ID=10719 (accessed on 17 October, 2016) 181 Source:
https://eeas.europa.eu/delegations/india/documents/press_release_eu_stops_some_fruit_and_vegetable
_imports_from_india.pdf (accessed on 17 October, 2016)
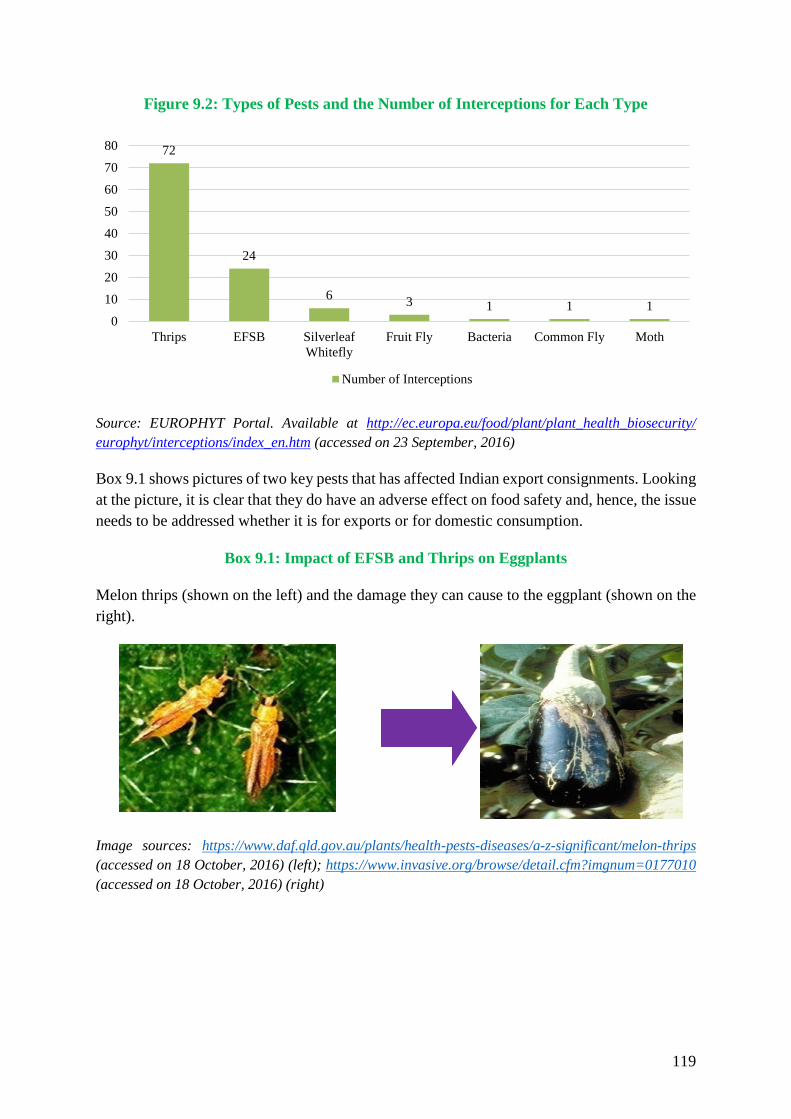
119
Figure 9.2: Types of Pests and the Number of Interceptions for Each Type
Source: EUROPHYT Portal. Available at http://ec.europa.eu/food/plant/plant_health_biosecurity/
europhyt/interceptions/index_en.htm (accessed on 23 September, 2016)
Box 9.1 shows pictures of two key pests that has affected Indian export consignments. Looking
at the picture, it is clear that they do have an adverse effect on food safety and, hence, the issue
needs to be addressed whether it is for exports or for domestic consumption.
Box 9.1: Impact of EFSB and Thrips on Eggplants
Melon thrips (shown on the left) and the damage they can cause to the eggplant (shown on the
right).
Image sources: https://www.daf.qld.gov.au/plants/health-pests-diseases/a-z-significant/melon-thrips
(accessed on 18 October, 2016) (left); https://www.invasive.org/browse/detail.cfm?imgnum=0177010
(accessed on 18 October, 2016) (right)
72
24
63 1 1 1
0
10
20
30
40
50
60
70
80
Thrips EFSB Silverleaf
Whitefly
Fruit Fly Bacteria Common Fly Moth
Number of Interceptions
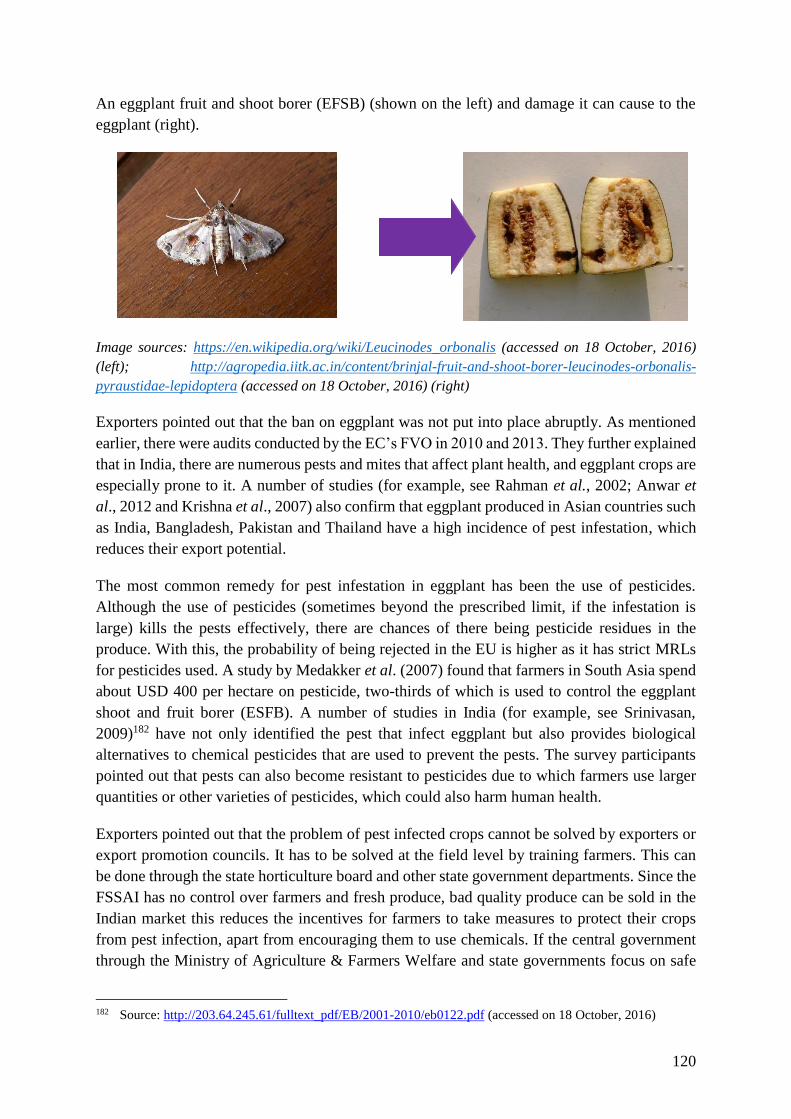
120
An eggplant fruit and shoot borer (EFSB) (shown on the left) and damage it can cause to the
eggplant (right).
Image sources: https://en.wikipedia.org/wiki/Leucinodes_orbonalis (accessed on 18 October, 2016)
(left); http://agropedia.iitk.ac.in/content/brinjal-fruit-and-shoot-borer-leucinodes-orbonalis-
pyraustidae-lepidoptera (accessed on 18 October, 2016) (right)
Exporters pointed out that the ban on eggplant was not put into place abruptly. As mentioned
earlier, there were audits conducted by the EC’s FVO in 2010 and 2013. They further explained
that in India, there are numerous pests and mites that affect plant health, and eggplant crops are
especially prone to it. A number of studies (for example, see Rahman et al., 2002; Anwar et
al., 2012 and Krishna et al., 2007) also confirm that eggplant produced in Asian countries such
as India, Bangladesh, Pakistan and Thailand have a high incidence of pest infestation, which
reduces their export potential.
The most common remedy for pest infestation in eggplant has been the use of pesticides.
Although the use of pesticides (sometimes beyond the prescribed limit, if the infestation is
large) kills the pests effectively, there are chances of there being pesticide residues in the
produce. With this, the probability of being rejected in the EU is higher as it has strict MRLs
for pesticides used. A study by Medakker et al. (2007) found that farmers in South Asia spend
about USD 400 per hectare on pesticide, two-thirds of which is used to control the eggplant
shoot and fruit borer (ESFB). A number of studies in India (for example, see Srinivasan,
2009)182 have not only identified the pest that infect eggplant but also provides biological
alternatives to chemical pesticides that are used to prevent the pests. The survey participants
pointed out that pests can also become resistant to pesticides due to which farmers use larger
quantities or other varieties of pesticides, which could also harm human health.
Exporters pointed out that the problem of pest infected crops cannot be solved by exporters or
export promotion councils. It has to be solved at the field level by training farmers. This can
be done through the state horticulture board and other state government departments. Since the
FSSAI has no control over farmers and fresh produce, bad quality produce can be sold in the
Indian market this reduces the incentives for farmers to take measures to protect their crops
from pest infection, apart from encouraging them to use chemicals. If the central government
through the Ministry of Agriculture & Farmers Welfare and state governments focus on safe
182 Source: http://203.64.245.61/fulltext_pdf/EB/2001-2010/eb0122.pdf (accessed on 18 October, 2016)
121
agriculture and organic farming, much of the export barriers faced by eggplants can be
addressed.
The survey also showed that APEDA had worked with exporters and state governments to
address the concerns raised by the EC and had put certain systems in place to ensure that the
ban on the remaining vegetables including eggplant was lifted. In 2015, APEDA set up the
“Procedures for Exports of Vegetables”183 (referred to as APEDA, 2015), following the
rejection of Indian consignments in export destinations due to the presence of agrochemical
residues beyond prescribed limits and due to the incidence of pest infections. This system tries
to ensure some traceability of the product to the farm through designated procedures. However,
the survey found that traceability did not work in the case of eggplant vis-à-vis other products
like table grapes. For example, although APEDA has mentioned that the produce “shall be
harvested during the early hours and brought immediately to pack houses recognized by
APEDA”184, the survey found that this does not happen. Exporters continue to source the
products from aggregators and mandis. They have started keeping some records of farms
through their aggregators or from the mandis but these records are not as accurate as in the case
of grapes, where there is direct sourcing from farmers.
The survey found that it is extremely difficult to ensure that farms follow uniform pre-harvest
practices and that the producing farms are in contiguous areas. Apart from this, there are cases
where chemicals and pests seep in from adjoining farms. APEDA (2015) further states that a
consignment of vegetables may come in from at least 30 farms, and ensuring that all the farms
follow uniform pre-harvest practices and maintains the same pre-harvest interval so that the
samples drawn for residue analysis are homogenous is tough.185 This is also difficult to ensure.
Exporters often have to source the best quality from around 100 farms and it is impossible to
have them in one location/state. Thus, overall, the traceability to the farm is weaker in the case
of vegetables like eggplant compared to fruits such as grapes. In the case of mango, there is
some traceability issue related to tracing back to the farms, but the problem of fruit flies has
been solved by hot water treatment. Some pests tend to lay eggs and reproduce below the stems
and leaves of the eggplant, and exporters have not been successful in eradicating the problem
by washing and cleaning the vegetables. None of the exporters could mention any measures
that could be taken at the post-harvest stage to eradicate the pests from fresh produce. Some of
them did refer to focusing more on the export of processed eggplant.
The Directorate of Plant Protection and Quarantine had issued a “Standard Operating
Procedure for Export Inspection and Phytosanitary Certification of Vegetables and Fruits to
European Union countries”186 in March 2015. The list of APEDA approved pack houses are
provided to the DG SANTE by the Directorate of Plant Protection, Quarantine and Storage in
183 Link to the report: http://apeda.gov.in/apedawebsite/HACCP/procedure-for-ffv-exports-2015.pdf (accessed
on 18 October, 2016) 184 For detail see http://apeda.gov.in/apedawebsite/HACCP/procedure-for-ffv-exports-2015.pdf; Page 2 –
Procedure for Export of Vegetables. 185 See http://apeda.gov.in/apedawebsite/HACCP/procedure-for-ffv-exports-2015.pdf; Page 3, point number
3.10. 186 Link: http://plantquarantineindia.nic.in/pqispub/pdffiles/revsopexpinseu2015.pdf (accessed on 18 October,
2016)
122
India and there is a yearly audit of the pack houses. They have also set up a dedicated corridor
for fruits and vegetables at airports like the Chhatrapati Shivaji International Airport in
Mumbai, known as the green corridor, for faster transportation.
9.5 The Way Forward
The initiatives taken by Indian government agencies such as APEDA and the Directorate of
Plant Protection and Quarantine (as mentioned above) are indeed commendable. However, they
have not been successful in tackling the core issue of pest infestation, which arises at the field
level. This issue, which caused Indian eggplant to be banned in the EU, is yet to be addressed.
Pest infestation has always existed and a popular technique to tackle this has been the use of
pesticides and other chemicals. However, excessive use of chemicals compromises crop quality
and adversely affects human health. Moreover, the EU has strict regulations regarding pesticide
residues/MRLs levels. Therefore, there is need for India to focus more on safe agricultural
practices. The farmers are poor and they often lack training. They need help to access the right
inputs to eradicate pests. They also need help to develop eggplant varieties that are resistant to
pests. In this context, a number of efforts are being made in India through public-private
partnerships to help eggplant growers eradicate pests, but they have faced barriers due to policy
uncertainty. For example, the Maharashtra Hybrid Seeds Company (MAHYCO), a private
company in India, developed a hybrid eggplant containing a gene that provides resistance to
EFSB (see Medakker et al., 2007 for details). The technology used by this company helps
reduce the use of chemical pest control. MAHYCO got the technology for insect free
management from Monsanto Company. The technology was then sub-licensed by MAHYCO
to public research institutes in India (the Indian Institute of Vegetable Research, Tamil Nadu
Agricultural University, and the University of Agricultural Sciences, Dharwad), in Bangladesh
(the Bangladesh Agricultural Research Institute), and in the Philippines (the University of
Philippines, Los Banos).187 This hybrid variety of eggplant (known as Bt brinjal) was approved
for cultivation in October 2009. However, in 2010, due to protests by green activists (such as
Greenpeace India), the Indian Ministry of Environment and Forest banned the commercial
cultivation of the hybrid variety of eggplant developed by MAHYCO. The report of the
Ministry of Environment and Forest highlights some of the concerns related to this initiative,
including the role of Monsanto Company. The report also pointed out that the ban would
continue until independent scientific studies had established that it would not adversely affect
the environment or human health. However, the ban still continues, in spite of India’s success
in Bt cotton and despite the fact that other countries like Bangladesh are now successfully
growing Bt eggplant, which are exported to Indian states like West Bengal. Even after being
one of the largest growers of eggplant in India, the state of West Bengal faces competition from
Bangladesh and consumers in West Bengal find the quality of produce from Bangladesh better.
187 Link to the paper: http://www.iphandbook.org/handbook/chPDFs/ch17/ipHandbook-
Ch%2017%2025%20Medakker-Vijayaraghavan%20Eggplants%20in%20India.pdf (accessed on 18
October, 2016)

123
While there can be arguments in support of or against Bt/hybrid crops, which is beyond the
scope of this study, this example shows that there can be collaboration with foreign companies
in eggplant cultivation if the Government of India has a clear policy. EU companies and
research organisations have state-of-the art technology for pest control at the field level for
eggplant and other vegetables. There can be public-private partnerships between Indian
companies/research organisations and EU-based companies and research organisations related
to R&D for pest resistant crops, organic crops and in areas like safe agricultural practices.
However, this will need strong support from the government. If there is any food safety, health
and environment related concerns, it has to be scientifically examined and proven. The rise in
pest infected eggplant exports after the ban in 2014 also highlights that policy decisions may
have been hasty without any scientific justification, leading to lower quality of produce. In
contrast, countries such as Kenya have successfully adopted safe agricultural practices – they
have been able to reduce the incidence of both pests and the use of pesticides to control pests.
Today, Kenya exports eggplant to the EU. It is important for organisations like APEDA to
study Kenya’s success story.
The survey participants pointed out that the EU-India CITD programme offers scope for
training and it can be used to train growers and state horticulture department staff. This training
is needed in states such as West Bengal, Odisha and Gujarat, which are key eggplant growing
states. They also said that APEDA should take initiatives to work with scientific research
organisations, the Ministry of Agriculture & Farmers Welfare and state horticulture
departments to conduct scientific studies to see the advantages and disadvantages of Bt
eggplant and understand its export potential. If it has an export market and is pest resistant,
then APEDA should work with the Ministry of Agriculture & Farmers Welfare and push for
its cultivation for commercial purposes.
The EU is also a producer of eggplant and has technologies and follows best practices to ensure
that pest infestation is low and plant health is preserved. There can be partnerships between
APEDA and DG SANTE (or other EU counterparts) that would involve training at the farm
level and other forms of knowledge sharing.
Certain studies undertaken in India have been made into tackling pests without involving the
excessive use of chemicals. Srinivasan (2009) has provided various techniques to manage
infestation of many breeds of thrips, flies, etc., that are crop friendly and green. These measures
include choosing cultivars that repel insects, using bio-pesticides, setting sticky traps for insects
in the fields, following crop rotation, etc. Many such studies are available in the public domain
and can be used to train the farmers. Agricultural experts and scientists from India as well as
the EU can be brought in to give hands-on training to farmers. Experts from EU member states
such as the Netherlands can help India develop training programmes and knowledge sharing
initiatives for farmers.
India needs to move towards safe agricultural practices and organic farming. The present
government is already lays emphasis on organic farming. The survey found that farmers will
need training on bio-alternatives to conventional pest management chemicals for organic
farming. Small farmers often find it difficult to buy the net, stick trap, etc., for insects/pests due

124
to limited finance. Further, states like West Bengal have not amended the APMC Act and
farmers are not allowed to directly enter into contract manufacturing. These are some of the
policy issues that have to be addressed at the state level.
Finally, it is important for India to realise that the health of its consumers cannot be
compromised. Therefore, strict measures should be taken to address the issue of pest infected
crops and high pesticide residual levels in crops in the domestic market. Until the domestic
market become non-receptive to bad quality produce and strict emphasis is placed on consumer
health and food safety standards, India cannot be an exporter of vegetables despite its large
production base. It is also important to note that pest control through the right means will reduce
crop wastage.

125
Chapter 10: The Case Study of Indian Peanut Exports to the EU
Although India is a major exporter of peanuts to the world, the share of its exports in the EU
market is low and has declined significantly in recent years. This has occurred primarily due
to the detection of high levels of aflatoxin in India’s consignments. This case study assesses the
details of this problem, corrective measures adopted by India and the success of these
measures.
The case study involved in-depth interviews with exporters, processors, laboratory scientists,
and government institutions such as APEDA, EIC and the Indian Oilseeds and Produce Export
Promotion Council (IOPEPC). In total, one-to-one interviews were conducted with 7 exporters
and exporters-cum-processors in Gujarat and Maharashtra and a consultation was held with
the IOPEC and its members. Meetings were also held with 5 multinational companies, who are
using or want to use peanuts as ingredients in their manufacturing process in India.
10.1 Production of Peanuts in India
Peanut (also known as groundnut) is a species in the legume or the ‘bean’ family. Raw peanut
is valued for its protein and other mineral content, which is of high nutritional value.
In India, peanuts account for about 30 per cent of total oilseed production (Ministry of
Agriculture & Farmers Welfare, 2015). India is the second largest producer of peanuts in the
world. It plays a major role in bridging the vegetable oil deficit in the country.
Peanuts in India are available throughout the year due to a two-crop cycle harvested in March
and October and are mostly grown under rain-fed conditions. A large quantity is available for
exports every year and India is the second largest exporter of peanuts in the world after
Argentina. Indian peanuts are of different varieties: Bold or Runner, Java or Spanish and Red
Natal, to name a few. The peanut variety of Gujarat (Saurashtra) region is famous globally for
its unique flavour, taste and aroma.
India is the world’s second largest producer of peanuts after China. Other major producing
countries are Nigeria, the US and Argentina. Figure 10.1 shows peanut production shares by
country for the year 2015-16.

126
Figure 10.1: Peanut Production by Country in 2015-16 (in percentage)
Source: Intracen Market Insider - Peanuts Quarterly Bulletin http://www.intracen.org/uploadedFiles
/intracen.org/Content/Exporters/Market_Data_and_Information/Market_information/Market_Insider/
Edible_Nuts/Peanut%20Quarterly%20Bulletin%20June%202015.pdf (accessed on 7 November,
2016)
Although India leads the world both in area and production of peanuts, its productivity (0.81
MT/hectare) is lower than in countries like China (2.55 MT/hectare), Argentina (1.88
MT/hectare) and the US (3.36 MT/hectare) and the world average of 1.17 MT/hectare for 2013-
14 (Madhusudhana, 2013). Studies have shown that the low yield levels can be attributed to
cultivation in marginal lands with low inputs, low technology, poor plant population,
inadequate fertilisation and lack of plant protection (Madhusudhana, 2013). Further, the
processing technology is outdated, which affects the quality of produce.
The top peanut growing states in India are Gujarat, Andhra Pradesh, Tamil Nadu, Karnataka,
Maharashtra, Rajasthan, Madhya Pradesh, Odisha and Uttar Pradesh. The Indian peanut
processing sector is fragmented and comprises small-scale units with low capacity utilisation.
These are mainly located in Gujarat, Rajasthan, Andhra Pradesh and Karnataka. The traditional
mechanical crushing industry includes ghanis (traditional cold process method for extracting
oil) and small-scale expellers. The industry uses processing technologies such as (a) traditional
mechanical crushing, or expelling, used for oilseeds with relatively high oil-content; and (b)
solvent extraction for processing oilseeds and expeller cake.

127
10.2 Exports of Peanuts from India and the Export Value Chain
Peanuts are exported in various forms – peanuts in shell, kernels (deshelled) and blanched188
peanuts (whole or split). These can be used for direct consumption or as ingredients into
processing products for human food and bird/animal feed.
India is the second largest exporter of peanuts globally (Table 10.1) after Argentina. The
country exported approximately 537,000 MT of peanuts to the world worth INR 40,460 million
(EUR 526 million)189 during the year 2015-16. The main export destinations were Asian
countries including Indonesia, Malaysia, Thailand, Philippines and Pakistan. Iran and the UAE
from the Middle East are also among the top 10 countries importing Indian peanuts.190
Table 10.1: Top Global Exporters of Peanuts (Quantity in ’000 MT)
Country 2015-16 2014-15 Growth Share (%)
Argentina 550 554 -0.72 23.07
India 537 788 -31.85 22.53
USA 390 360 8.33 16.36
China 300 301 -0.33 12.58
Brazil 115 88 30.68 4.82
Senegal 100 53 88.68 4.19
Nicaragua 90 99 -9.09 3.78
Others 302 96 214.58 12.67
Total 2384 2339 1.92 100
Source: Data provided by Indian Oilseeds and Produce Export Promotion Council (IOPEPC) during
the survey.
India’s exports of oilseeds (in general, including peanuts) to the EU have increased since 2001.
However, there is a substantial decline in India’s export of peanuts to the EU, whose share has
declined to about one per cent in recent years from about 12 per cent in 2009.191 This is mainly
because Indian exports have been largely unable to comply with EU food safety and health
standards, which is discussed later. Table 10.2 shows that the export of peanuts from India to
the EU has declined significantly after the year 2011-12. Although there was a slight
improvement in volumes during 2013-14 and 2014-15, they reached a 10-year low of just about
1272 MT in 2015-16.
188 Blanching is the technical term for removing the seed coat from the peanut kernel. 189 Note: Currency Conversion rate: INR 1= EUR 0.013 190 Source: http://apeda.gov.in/apedawebsite/SubHead_Products/Ground_Nut.htm (accessed on 1 June, 2016) 191 http://www.business-standard.com/article/markets/peanut-exports-to-eu-decline-94-on-strict-quality-norms-
109092300012_1.html (accessed on 1 June, 2016)

128
Table 10.2: India's Export of Peanuts to the EU
Year 2006-07 2007-
08
2008-
09
2009-
10
2010-
11
2011-
12
2012-
13
2013-
14
2014-
15
2015-
16
Quantity
(MT)
5484 13836 15257 5334 14557 15175 2750 3780 4425 1272
Value
(EUR
million)
1740.31 7.21 8.63 3.47 9.75 13.98 3.19 3.53 4.08 1.33
Source: DGCI&S, APEDA Statistics, http://agriexchange.apeda.gov.in/indexp/18headgen
Reportmonth_combine.aspx (accessed on 7 November, 2016)
Table 10.3 shows the list of top exporters of peanuts to the EU. India ranks at number four for
the major categories of peanut exports to the EU, namely HS 120241 (peanuts, in shell
(excluding seed for sowing, roasted or otherwise cooked)) and HS 120242 (peanuts, shelled,
whether or not broken (excluding seed for sowing, roasted or otherwise cooked)). To the EU,
India mostly exports shelled peanuts.
Table 10.4 shows the top peanut countries in the EU importing from India. In 2015-16, the
Netherlands was the top country importing peanuts from India in the EU followed by Croatia
and Greece. The shares of countries like the UK, Germany and Belgium were high in the past
but have declined significantly recently.
Table 10.3: Top Exporters of Peanut to the EU in Comparison with Exports from India
Category Top three exporters
and India
2014-15 2015-16
Value (’000 EUR)
HS 120241
(Peanuts, In Shell (Excl. Seed For
Sowing, Roasted Or Otherwise
Cooked))
USA 35,257 47,020
China 28,614 28,532
Egypt 17,472 20,842
India 71 69
HS 120242 (Peanuts, Shelled, Whether
Or Not Broken (Excl. Seed For Sowing,
Roasted Or Otherwise Cooked))
Argentina 3,24,292 4,17,721
USA 1,42,424 95,952
China 75,937 79,661
India 6,379 5,181
Source: Eurostat database. Available at http://ec.europa.eu/eurostat/data/database (accessed on 12
September, 2016)
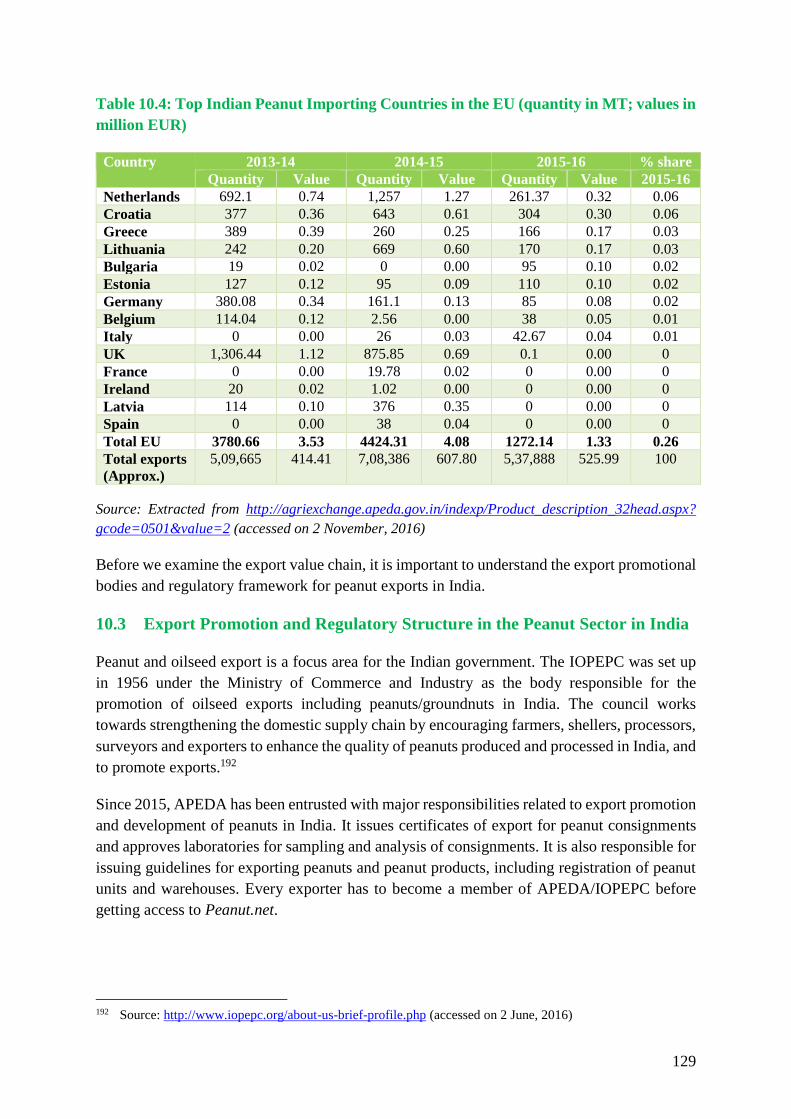
129
Table 10.4: Top Indian Peanut Importing Countries in the EU (quantity in MT; values in
million EUR)
Country 2013-14 2014-15 2015-16 % share
Quantity Value Quantity Value Quantity Value 2015-16
Netherlands 692.1 0.74 1,257 1.27 261.37 0.32 0.06
Croatia 377 0.36 643 0.61 304 0.30 0.06
Greece 389 0.39 260 0.25 166 0.17 0.03
Lithuania 242 0.20 669 0.60 170 0.17 0.03
Bulgaria 19 0.02 0 0.00 95 0.10 0.02
Estonia 127 0.12 95 0.09 110 0.10 0.02
Germany 380.08 0.34 161.1 0.13 85 0.08 0.02
Belgium 114.04 0.12 2.56 0.00 38 0.05 0.01
Italy 0 0.00 26 0.03 42.67 0.04 0.01
UK 1,306.44 1.12 875.85 0.69 0.1 0.00 0
France 0 0.00 19.78 0.02 0 0.00 0
Ireland 20 0.02 1.02 0.00 0 0.00 0
Latvia 114 0.10 376 0.35 0 0.00 0
Spain 0 0.00 38 0.04 0 0.00 0
Total EU 3780.66 3.53 4424.31 4.08 1272.14 1.33 0.26
Total exports
(Approx.)
5,09,665 414.41 7,08,386 607.80 5,37,888 525.99 100
Source: Extracted from http://agriexchange.apeda.gov.in/indexp/Product_description_32head.aspx?
gcode=0501&value=2 (accessed on 2 November, 2016)
Before we examine the export value chain, it is important to understand the export promotional
bodies and regulatory framework for peanut exports in India.
10.3 Export Promotion and Regulatory Structure in the Peanut Sector in India
Peanut and oilseed export is a focus area for the Indian government. The IOPEPC was set up
in 1956 under the Ministry of Commerce and Industry as the body responsible for the
promotion of oilseed exports including peanuts/groundnuts in India. The council works
towards strengthening the domestic supply chain by encouraging farmers, shellers, processors,
surveyors and exporters to enhance the quality of peanuts produced and processed in India, and
to promote exports.192
Since 2015, APEDA has been entrusted with major responsibilities related to export promotion
and development of peanuts in India. It issues certificates of export for peanut consignments
and approves laboratories for sampling and analysis of consignments. It is also responsible for
issuing guidelines for exporting peanuts and peanut products, including registration of peanut
units and warehouses. Every exporter has to become a member of APEDA/IOPEPC before
getting access to Peanut.net.
192 Source: http://www.iopepc.org/about-us-brief-profile.php (accessed on 2 June, 2016)

130
Additionally, all consignments of peanuts (feed and food) for export to the EU are required to
be sampled and analysed for aflatoxin levels193 in compliance with EU legislations and
accompanied with a health certificate completed and signed by an authorised representative of
the competent authority. The EIC, under the Indian Ministry of Commerce and Industry, is
responsible for issuing these certificates.
10.4 Procedure for Peanut Exports from India to the EU and the Export
Supply Chain
The procedure for peanuts exports from India is standardised. Each consignment of an exporter
is normally accompanied by a certificate of export, stuffing certificate and a laboratory test
report certifying that aflatoxin levels are within permissible limits. These are issued by APEDA
and EIC approved laboratories. The EIC issues the health certificate.
In 2011, APEDA developed a web-based traceability system called Peanut.net to ensure
controls in the supply chain by facilitating testing and certification of export cargo and to ensure
compliance with international standards. Peanut.net collects, stores and reports forward and
backward traces and quality assurance data entered by the stakeholders, i.e., exporters,
laboratories and APEDA within the peanut supply chain in India. It facilitates testing and
certification of peanut and peanut products for export from India with standards framed by
APEDA and regulations issued by the DGFT, Ministry of Commerce and Industry, on the basis
of consultation with exporters. The various processes included under Peanut.net are: -
Registration of peanut processing, shelling and grading units/warehouses by APEDA
Consignment creation and online application for certificate of export and stuffing certificate
by the exporter
Aflatoxin analysis, generation of test report and issue of stuffing certificate by APEDA
recognised laboratories
Issuance of certificate of export by APEDA
Issuance of stuffing certificate by recognised laboratories
When exporters decide to send a consignment of peanuts to the EU, they are obliged to encode
the consignment quantity in Peanut.net. They also select an APEDA approved laboratory to do
the necessary testing.
The Peanut.net tool automatically calculates the number of samples to be taken and this
information is forwarded to the chosen laboratory. The consignment is sampled by designated
193 Aflatoxins are a group of chemically similar toxic fungal metabolites (mycotoxins) produced by two species
of Aspergillus, a fungus which is especially found in areas with hot and humid climates (most common
species in Africa and Asia). Depending on the levels, the toxins can severely affect the liver and they are a
known human carcinogen. They can occur in foods, such as peanuts, tree nuts, maize, rice, figs and other
dried foods, spices and crude vegetable oils, and cocoa beans, as a result of fungal contamination before and
after harvest. Several types of aflatoxins are produced in nature. Aflatoxin B1 is the most common in food
and amongst the most potent genotoxic and carcinogenic aflatoxins.
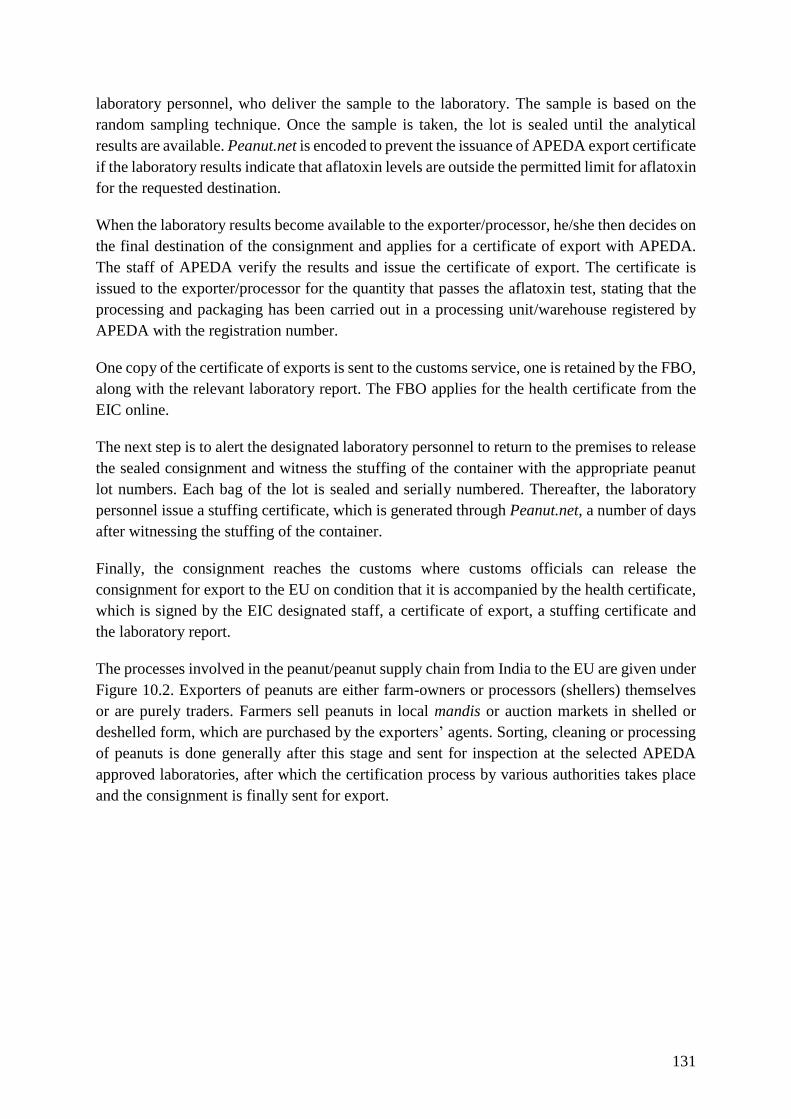
131
laboratory personnel, who deliver the sample to the laboratory. The sample is based on the
random sampling technique. Once the sample is taken, the lot is sealed until the analytical
results are available. Peanut.net is encoded to prevent the issuance of APEDA export certificate
if the laboratory results indicate that aflatoxin levels are outside the permitted limit for aflatoxin
for the requested destination.
When the laboratory results become available to the exporter/processor, he/she then decides on
the final destination of the consignment and applies for a certificate of export with APEDA.
The staff of APEDA verify the results and issue the certificate of export. The certificate is
issued to the exporter/processor for the quantity that passes the aflatoxin test, stating that the
processing and packaging has been carried out in a processing unit/warehouse registered by
APEDA with the registration number.
One copy of the certificate of exports is sent to the customs service, one is retained by the FBO,
along with the relevant laboratory report. The FBO applies for the health certificate from the
EIC online.
The next step is to alert the designated laboratory personnel to return to the premises to release
the sealed consignment and witness the stuffing of the container with the appropriate peanut
lot numbers. Each bag of the lot is sealed and serially numbered. Thereafter, the laboratory
personnel issue a stuffing certificate, which is generated through Peanut.net, a number of days
after witnessing the stuffing of the container.
Finally, the consignment reaches the customs where customs officials can release the
consignment for export to the EU on condition that it is accompanied by the health certificate,
which is signed by the EIC designated staff, a certificate of export, a stuffing certificate and
the laboratory report.
The processes involved in the peanut/peanut supply chain from India to the EU are given under
Figure 10.2. Exporters of peanuts are either farm-owners or processors (shellers) themselves
or are purely traders. Farmers sell peanuts in local mandis or auction markets in shelled or
deshelled form, which are purchased by the exporters’ agents. Sorting, cleaning or processing
of peanuts is done generally after this stage and sent for inspection at the selected APEDA
approved laboratories, after which the certification process by various authorities takes place
and the consignment is finally sent for export.
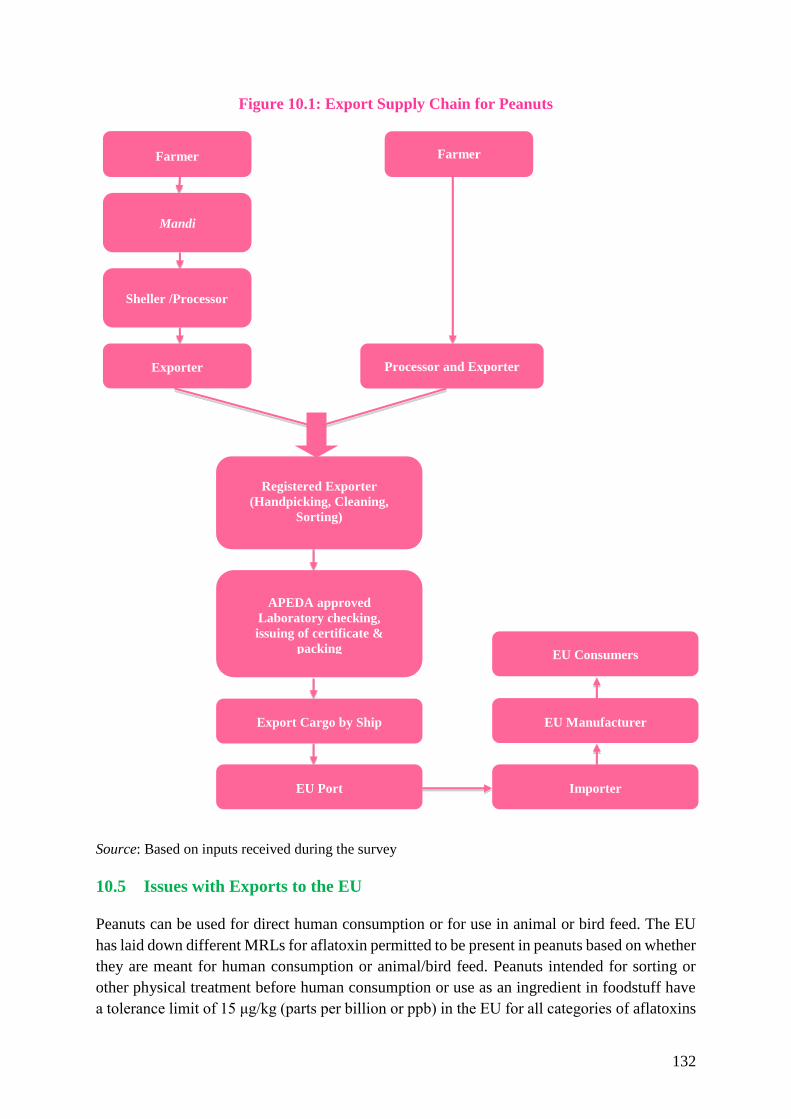
132
Figure 10.1: Export Supply Chain for Peanuts
Source: Based on inputs received during the survey
10.5 Issues with Exports to the EU
Peanuts can be used for direct human consumption or for use in animal or bird feed. The EU
has laid down different MRLs for aflatoxin permitted to be present in peanuts based on whether
they are meant for human consumption or animal/bird feed. Peanuts intended for sorting or
other physical treatment before human consumption or use as an ingredient in foodstuff have
a tolerance limit of 15 μg/kg (parts per billion or ppb) in the EU for all categories of aflatoxins
Farmer Farmer
Sheller /Processor
Mandi
Processor and Exporter Exporter
Export Cargo by Ship EU Manufacturer
Registered Exporter
(Handpicking, Cleaning,
Sorting)
EU Port Importer
APEDA approved
Laboratory checking,
issuing of certificate &
packing EU Consumers

133
(sum of B1, B2, G1 and G2) and 8 ppb for category B1 (Table 10.5).194 This includes
application for bird or animal feed. Peanuts and other oilseeds and processed products thereof
intended for direct human consumption or for use as an ingredient in foodstuff have a more
stringent requirement of 4 ppb for all aflatoxins (sum of B1, B2, G1 and G2) and 2 ppb for
aflatoxin B1.195
Table 10.1: Aflatoxin Tolerance Limit in the EU (by category)
Foodstuff Maximum levels (μg/kg)
B1 Sum of B1, B2,
G1 and G2
Peanuts, to be subjected to sorting, or other physical
treatment, before human consumption (can be used as animal
or bird feed, or for further processing, but not for direct
human consumption) or use as an ingredient in foodstuff with
the exception of: peanuts and other oilseeds for crushing for
refined vegetable oil production
8.0 15.0
Peanuts and other oilseeds and processed products thereof,
intended for direct human consumption or use as an ingredient
in foodstuff, with the exception of: crude vegetable oils
destined for refining - refined vegetable oils
2.0 4.0
Source: COMMISSION REGULATION (EC) No 1881/2006 of 19 December, 2006 setting maximum
levels for certain contaminants in foodstuff, 2006R1881, http://eur-lex.europa.eu/legal-
content/EN/TXT/PDF/?uri=CELEX:02006R1881-20140701&from=EN (accessed on 4 November,
2016)
Issues related to adherence to MRLs: The survey found that Indian exporters face
difficulties in adhering to these standards as the level of aflatoxin in Indian peanuts is very
high. Peanut and peanut products faced a significant number of notifications as is listed in
the RASSF portal of the EU. Between 8 March 2004 and 30 April 2016, there were 172
notifications that were raised for peanuts and peanut products (which includes products
such as peanut candies, peanut butter, etc.). Around 91 per cent (157 notifications) were for
the presence of aflatoxins beyond permissible limits. Among the EU member states, the
UK raised the maximum number of notifications, followed by the Netherlands. This is
despite the fact that there is a mandatory health certificate requirement for exports. The
other key reason for notifications was the absence of a health certificate from the EIC. It
was made mandatory for EU-bound export consignments to have this certificate after 2013;
yet, the consignments were sent from India without the health certificates.
Out of 172 notifications, 115 notifications were classified as ‘border rejection’, which
means that the product was refused entry into the EU for reason of a risk to human health
and to animal health or to the environment if it concerns feed. The risk category for all
194 Maximum levels of aflatoxins (aflatoxins B1, B2, G1, G2 and M1) are laid down in Commission
Regulation (EC) No. 1881/2006. 195 This is because sorting or other physical treatments generally make it possible to reduce the aflatoxin
content of peanut consignments.

134
notifications before 2012 was ‘undecided’, but post-2012, the risk category for most of the
notifications was ‘serious’.
It is worth mentioning that between the year 2000 and 2004, there were zero RASFF
notifications for peanut and peanut products. However, the notifications peaked in 2004
and then again in 2011 and 2012. Subsequent to this, the EIC started issuing the health
certificate. Although the number of notifications has reduced, they continue to remain high
as shown in Figure 10.3. The survey found that the high occurrence of notifications for
certain exporters led them to a situation where they lost their export licence temporarily
until the EIC carried out checks to ensure that they were complying with EU standards.196
Figure 10.1: Notifications for Peanuts and Peanuts Products on RASFF Portal,
Classified by Year
Source: RASSF Portal. Available at https://webgate.ec.europa.eu/rasff-window/portal/?event=Search
Form&cleanSearch=1 (accessed on 4 November, 2016)
The problem of aflatoxin contamination levels in India is serious. Even the permissible limits
of aflatoxin in the domestic peanut market, in accordance with the AGMARK standards, are
quite high for human consumption, at 30 ppb (B1+B2+G1+G2). Further, since a large part of
the peanuts processing industry is in the unorganised/non-corporate sector and is fragmented,
it is difficult to implement quality. Some of the processors are of the opinion that “anything
can sell in India” since there is lack of implementation of rigid food safety standards at certain
levels (for example, in the case of peanuts sold through hawkers). This makes it extremely
difficult to ensure a high quality standard for produce in the domestic supply chain. Image 10.1
shows a glimpse of aflatoxin damaged peanuts. High levels of aflatoxin can be harmful for
196 Causes for export rejections included absence of health certificates, absence of Common Entry Document
and parasitic infestation.
0
5
10
15
20
25
30
35
2004 2005 2006 2007 2008 2009 2010 2011 2012 2013 2014 2015
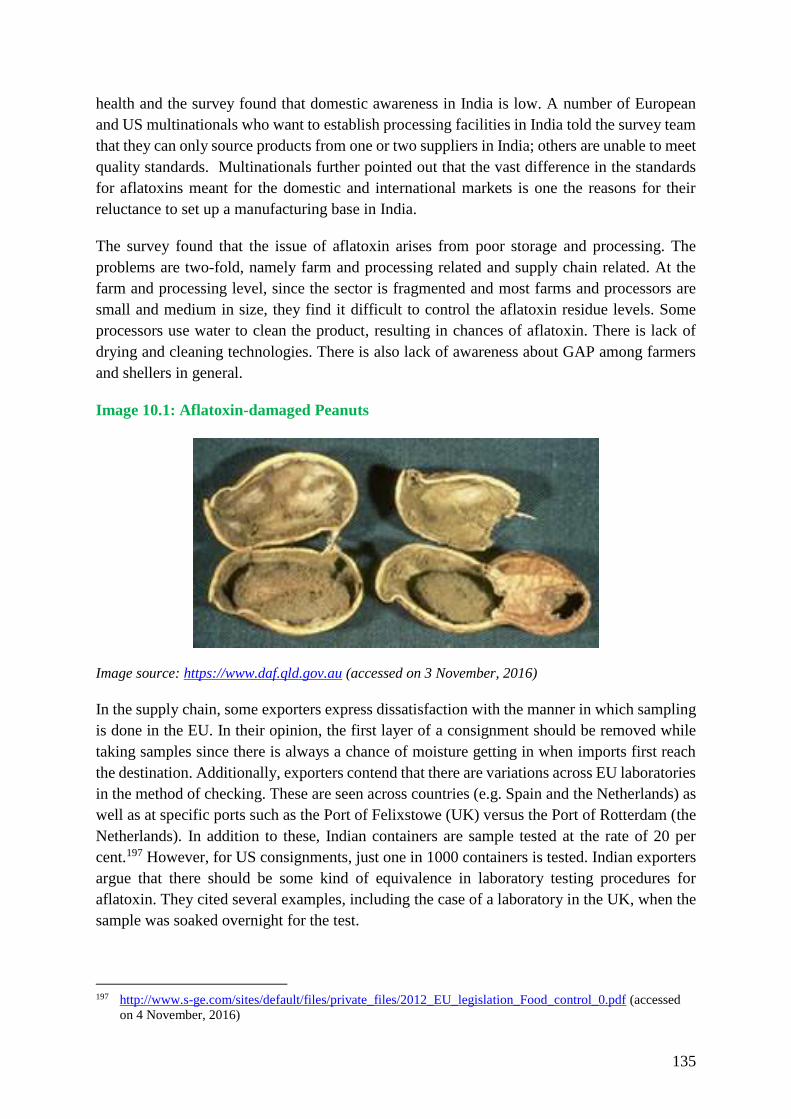
135
health and the survey found that domestic awareness in India is low. A number of European
and US multinationals who want to establish processing facilities in India told the survey team
that they can only source products from one or two suppliers in India; others are unable to meet
quality standards. Multinationals further pointed out that the vast difference in the standards
for aflatoxins meant for the domestic and international markets is one the reasons for their
reluctance to set up a manufacturing base in India.
The survey found that the issue of aflatoxin arises from poor storage and processing. The
problems are two-fold, namely farm and processing related and supply chain related. At the
farm and processing level, since the sector is fragmented and most farms and processors are
small and medium in size, they find it difficult to control the aflatoxin residue levels. Some
processors use water to clean the product, resulting in chances of aflatoxin. There is lack of
drying and cleaning technologies. There is also lack of awareness about GAP among farmers
and shellers in general.
Image 10.1: Aflatoxin-damaged Peanuts
Image source: https://www.daf.qld.gov.au (accessed on 3 November, 2016)
In the supply chain, some exporters express dissatisfaction with the manner in which sampling
is done in the EU. In their opinion, the first layer of a consignment should be removed while
taking samples since there is always a chance of moisture getting in when imports first reach
the destination. Additionally, exporters contend that there are variations across EU laboratories
in the method of checking. These are seen across countries (e.g. Spain and the Netherlands) as
well as at specific ports such as the Port of Felixstowe (UK) versus the Port of Rotterdam (the
Netherlands). In addition to these, Indian containers are sample tested at the rate of 20 per
cent.197 However, for US consignments, just one in 1000 containers is tested. Indian exporters
argue that there should be some kind of equivalence in laboratory testing procedures for
aflatoxin. They cited several examples, including the case of a laboratory in the UK, when the
sample was soaked overnight for the test.
197 http://www.s-ge.com/sites/default/files/private_files/2012_EU_legislation_Food_control_0.pdf (accessed
on 4 November, 2016)

136
Indian exporters also contend that the tolerance limits imposed by the EU should be increased.
They are of the opinion that under the WTO’s SPS Agreement, India should ask the EU to
provide scientific justification for the established aflatoxin levels. They also pointed out that
India should work closely in this regard with other countries such as the US and Argentina,
which export significant volumes to the EU, and their food safety regulations include a limit
of 20 μg/kg for total aflatoxins (B1, B2, G1 and G2) in peanuts for human consumption (FAO,
2004).
India, as a member of the Codex Alimentarius Commission, has proposed that the maximum
levels for total aflatoxins in ready-to-eat peanuts be set at 10 μg/kg at its 9th session on
‘Contaminants in Foods to Propose Maximum Level for Total aflatoxins in Ready-to-eat
Peanuts’ held in March 2015 in New Delhi. This has been agreed to by many countries of
Africa and Latin America. The argument has been that the extent of aflatoxin exposure from
peanuts is observed to be relatively low as compared to cereals as the average daily
consumption of peanuts is lower across countries/diet clusters. Further, the adoption of the
proposed limit would put peanuts in line with the limits set for tree nuts (CAC, 2015a and
2015b).
Unscrupulous activities at the domestic level: Some exporters revealed during the survey
that various processors and manufacturers indulge in unethical activities such as blanching
the peanut incorrectly to save on costs and adding water to peanuts to increase their weight.
A few exporters also indulged in practices such as packing up the peanuts before the
peanuts were completely dry. Even a little amount of moisture in the peanuts can damage
the whole cargo. All these activities contribute to the increased presence of aflatoxins in
the produce, which causes shipments to get rejected at EU ports.
Lack of co-ordination between multiple agencies: Domestically, exporters are concerned
about the problem of co-ordination between multiple authorities that handle the role of
issuing certificates, and promotional activities in the sector. The EIC issues the health
certificate required by the EU importers, and APEDA and IOPEPC both act as export
promotion councils under the Ministry of Commerce and Industry. Some exporters choose
to leave the IOPEPC and become APEDA members since they do not want to pay for two
separate council memberships. This has caused the IOPEPC to lose a significant amount of
funding. IOPEPC representatives feel that since they are involved only in the promotion of
oilseeds (unlike APEDA, which has various other products under its purview) and have
better contact with the exporters, they are better suited than APEDA to be the sole council
looking after peanut exports. A few exporters, on the other hand, feel that APEDA is doing
a better job as an export promotion council as compared to IOPEPC.
It is a burden for exporters also to be associated with multiple peanut export councils. They
contend that it is costly (in terms of effort, time consumption and funds) for them to deal
with the requirements of registration and other procedures set out by the different
organisations, and lack of co-ordination between them exacerbates the problems.

137
Other factors affecting exports: There are several other factors that also adversely affect
peanut exports. These include low yields, poor quality of produce and poor transport and
handling infrastructure, making it difficult for processors to procure regular supplies
throughout the year. Further, poor processing facilities and the unorganised nature of the
industry make it difficult to have an organised export supply chain. There is also limited
investment in technology (IARI, 2012).
10.6 The Way Forward
The discussions highlight that exports of peanut and peanut products have been facing SPS
issues for some time now and the Indian government has implemented various measures such
as health certificate by EIC and a traceability system by APEDA to reduce instances of product
rejection. Yet, the exports are being rejected on SPS issues, not only in the EU but in other
markets such as Indonesia and Vietnam. One of the key issues in this case is why the exports
are not able to meet the requirements of the importing countries in spite of a robust export
control system. Further, given that the EU-India CITD programme has been in place for some
time and still there are SPS issues with respect to exports of peanuts to the EU, Department of
Commerce as a nodal agency for export may investigate the cause for the issue, especially why
consignments are not adhering to the MRL limits. Further, it is important for the Department
of Commerce to work with EIC and APEDA to collect data and ask the EU to provide scientific
justification for its aflatoxin tolerance limits.
Given that aflatoxins can accumulate at the field level if the peanut is not completely dry and
at the processing level if wrong technology is used, it is necessary to train farmers and
processors, and provide them with the technology and knowledge associated with GAP. The
EU-India CITD programme can bring together scientists and other experts from the EU and
India can learn from EU best practices.
Aflatoxin accumulating fungi can infect peanuts in the production season as well as during
post-harvest handling and processing. Pre-harvest contamination is more prevalent in semi-arid
tropics such as India, especially when drought occurs just before harvest.198 Therefore, it is
essential to establish adequate controls to minimise the possibility of the presence of aflatoxins
in peanuts in excess of prescribed levels. Poor harvesting and storage conditions can lead to
rapid development of the fungi and thus, high levels of toxins can be produced.
India has to develop agricultural practices and technologies that can reduce the extent of
aflatoxin to permitted levels. While some good practices are acknowledged by state level
policymakers, their implementation has been partial. Measures such as crop rotation, advanced
sowing, harvesting at an appropriate stage, adoption of proper drying methods, and reducing
kernel moisture are recommended to prevent aflatoxin accumulation. Exporters feel that
198 Drought-stressed plants lose moisture from pods and seeds; physiological activity is greatly reduced. Both
factors increase susceptibility to fungal invasion.

138
adoption of good varieties of seeds and good agricultural practices can help reduce aflatoxin
levels to 20 ppb.
According to APEDA, awareness and concern for quality amongst Indian peanut shellers and
processors is growing steadily, and multiple sorting and grading is becoming a norm. Indian
manufacturers have the capability to prepare and supply edible peanuts conforming to the
highest standards.199 However, unscrupulous practices by some exporters have led to product
rejection. Exporters have a different view. They pointed out that best practices should be at the
farm, processing and storage levels. In the case of peanuts, it is extremely difficult for exporters
to have traceability to each of the small farms and there is need for training and technology at
the farm level. They argued that lack of awareness among farmers about recommended good
agricultural practices has been a major factor inhibiting the adoption of the recommended
practices. Additionally, the tropical climate and drought conditions, along with poor harvesting
and storage conditions in the country, exacerbate the aflatoxin problem.
Many exporters in the survey said that the EU’s levels for aflatoxins are very stringent
compared to the Codex Alimentarius standards and the levels imposed by other developed
countries. In this case, not only the Indian Government, but Indian exporters and processors
should come together and push the Indian government to raise the issue on WTO’s multilateral
platform. They can provide the government with scientific evidence and data to substantiate
the case. The EU, on its part, must provide scientific data and evidence to back its decision to
impose strict aflatoxin limits.
Since the levels of aflatoxin in peanuts for human consumption is more stringent, many Indian
traders shifted to bird feed exports wherein the limit is 15 ppb. However, this is not a solution
to the aflatoxin problem, whose intensity can increase in future if not tackled in a proper
manner.
While importing counties are becoming extremely price competitive and quality conscious,
some processors are of the view that “anything can be sold in the domestic market”. This
disincentivises farmers from investing in best practices as it increases their costs. The FSSAI
needs to focus on domestic quality standards for peanuts. If domestic standards are improved,
exports will be of good quality. Due to the quality issue, India is not able to develop as a
manufacturing hub for peanut processing. Only a few large exporters are able to export to the
EU and other countries with strict norms without problems; some of them also own the farms
to ensure control over the entire supply chain.
There is need to conduct sensitisation programmes for farmers and consumers to tackle the
issue from farm-to-the-plate. Consumer awareness about the harmful effects of aflatoxin
contamination can lead to demand for aflatoxin-free (up to permissible limit) peanuts in the
market and provide the needed push to farmers and other stakeholders to improve their field
and storage level practices. Simultaneously, the Indian FSSAI should reduce the established
199 http://apeda.gov.in/apedawebsite/SubHead_Products/Ground_Nut.htm (accessed on 1 June, 2016).

139
aflatoxin limits domestically as well to at least 20 ppb like in the US, and the government
should ensure that these are strictly adhered to.
Indian exporters are in a position to trace the product to processors and the area from which
the crop is sourced, but they are not able to trace the exact farm from which it is sourced. They
pointed out that peanuts sourced from several farms in close vicinity get mixed up. Therefore,
APEDA should work with state governments to sensitise farmers. Subsidising proper
equipment at the farm level for blanching200 and better (vacuum) packaging can help in
reducing the problem to some extent. There should also be better co-ordination between
authorities responsible for ensuring the development of the sector, and other promotional tasks.
Apart from these solutions, the methods of sample testing at various EU port authorities and
laboratories should also be looked into and checked for any variations and inconsistencies. The
methods should be implemented uniformly for all countries and information should be
available in the public domain.
200 With blanching, the level of aflatoxin decreases but the likelihood of rancidity increases; this may render
peanuts brittle and reduce their shelf life. The blanching process includes removing the seed coat from the
seed or kernel, and then removing damaged or discoloured seeds from the lot using electronic colour
sorters. It needs to be ensured that the equipment used for blanching is of good quality and functional. This
is because a breakdown during the blanching process may cause peanut quality losses and enhance aflatoxin
formation.

140
Chapter 11: The Case of Mushroom Exports to the EU
The EU is among the top markets for mushrooms
globally. India is building its capacity as a large
producer of mushrooms but most of its production is for
the domestic market. Although India is also an exporter,
its export volumes to the EU are low.
Based on in-depth meetings with exporters and
processors (5), this case study examines the reasons for
the low exports and assesses the potential for future
exports.
11.1 Introduction
Cultivated mushrooms are one of the highest-valued horticultural crops grown in the world.
They are consumed in both the fresh and processed forms. Advances in medical research and
culinary practices have contributed to increasing demand for fresh mushrooms. Fresh common
and specialty mushrooms meet the needs of health-conscious consumers for fat and cholesterol-
free, low-sodium foods. Being a rich source of several important nutrients and antioxidants
(protein, vitamins, folic acid, iron), they are good alternatives for vegetarians.
Mushrooms can be classified as edible and non-edible. Edible mushrooms comprise a wide
variety of species, the most commonly cultivated being the species Agaricus Bisporus,
commonly known as button or white mushroom.201 Other varieties include the Volvariella
volvacea (paddy-straw mushroom), Pleurotus ostreatus (oyster mushroom), Cantharellus
cibarius (Chanterelle), and Calocybe indica (milky mushroom).
11.2 Global Production of Mushrooms
The global market for mushrooms was valued at USD 29,427.92 million (EUR 21,953.27
million202) in 2013. This market is projected to grow at a CAGR of 9.5 per cent from 2014 to
reach USD 50,034.12 million (EUR 45,348.49 million) by 2019.203 Europe dominated the
201 http://nhb.gov.in/report_files/Button_Mushroom/BUTTON%20MUSHROOM.htm (accessed on 24 May,
2016) 202 Conversion from USD to EUR done using the average exchange rate for the financial year 2013-2014 from
http://ec.europa.eu/eurostat/web/exchange-
rates/data/database?p_p_id=NavTreeportletprod_WAR_NavTreeportletprod_INSTANCE_yFWTDHW2Gf
Rx&p_p_lifecycle=0&p_p_state=normal&p_p_mode=view&p_p_col_id=column-2&p_p_col_count=1;
EUR 1 = USD 1.34048333 203 http://www.prnewswire.com/news-releases/mushroom-market-by-type-button-shiitake-and-oyster-by-
application-fresh-mushrooms-and-processed-mushrooms-dried-frozen-and-canned--by-region---global-
trends--forecast-to-2019-300031170.html. Conversion from USD to EUR done using the average exchange
rate for the financial year 2015-2016 from http://ec.europa.eu/eurostat/web/exchange-
rates/data/database?p_p_id=NavTreeportletprod_WAR_NavTreeportletprod_INSTANCE_yFWTDHW2Gf
Rx&p_p_lifecycle=0&p_p_state=normal&p_p_mode=view&p_p_col_id=column-2&p_p_col_count=1;
(accessed on 7 June, 2016) EUR 1 = USD 1.103325
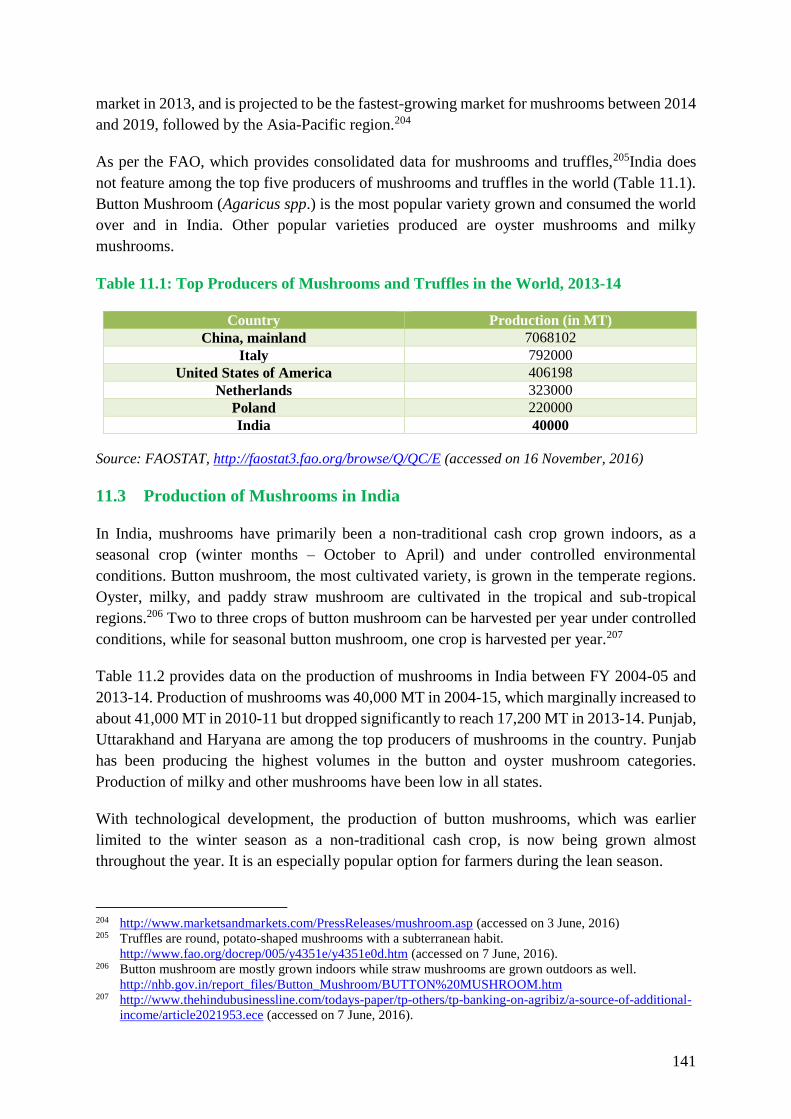
141
market in 2013, and is projected to be the fastest-growing market for mushrooms between 2014
and 2019, followed by the Asia-Pacific region.204
As per the FAO, which provides consolidated data for mushrooms and truffles,205India does
not feature among the top five producers of mushrooms and truffles in the world (Table 11.1).
Button Mushroom (Agaricus spp.) is the most popular variety grown and consumed the world
over and in India. Other popular varieties produced are oyster mushrooms and milky
mushrooms.
Table 11.1: Top Producers of Mushrooms and Truffles in the World, 2013-14
Source: FAOSTAT, http://faostat3.fao.org/browse/Q/QC/E (accessed on 16 November, 2016)
11.3 Production of Mushrooms in India
In India, mushrooms have primarily been a non-traditional cash crop grown indoors, as a
seasonal crop (winter months – October to April) and under controlled environmental
conditions. Button mushroom, the most cultivated variety, is grown in the temperate regions.
Oyster, milky, and paddy straw mushroom are cultivated in the tropical and sub-tropical
regions.206 Two to three crops of button mushroom can be harvested per year under controlled
conditions, while for seasonal button mushroom, one crop is harvested per year.207
Table 11.2 provides data on the production of mushrooms in India between FY 2004-05 and
2013-14. Production of mushrooms was 40,000 MT in 2004-15, which marginally increased to
about 41,000 MT in 2010-11 but dropped significantly to reach 17,200 MT in 2013-14. Punjab,
Uttarakhand and Haryana are among the top producers of mushrooms in the country. Punjab
has been producing the highest volumes in the button and oyster mushroom categories.
Production of milky and other mushrooms have been low in all states.
With technological development, the production of button mushrooms, which was earlier
limited to the winter season as a non-traditional cash crop, is now being grown almost
throughout the year. It is an especially popular option for farmers during the lean season.
204 http://www.marketsandmarkets.com/PressReleases/mushroom.asp (accessed on 3 June, 2016) 205 Truffles are round, potato-shaped mushrooms with a subterranean habit.
http://www.fao.org/docrep/005/y4351e/y4351e0d.htm (accessed on 7 June, 2016). 206 Button mushroom are mostly grown indoors while straw mushrooms are grown outdoors as well.
http://nhb.gov.in/report_files/Button_Mushroom/BUTTON%20MUSHROOM.htm 207 http://www.thehindubusinessline.com/todays-paper/tp-others/tp-banking-on-agribiz/a-source-of-additional-
income/article2021953.ece (accessed on 7 June, 2016).
Country Production (in MT)
China, mainland 7068102
Italy 792000
United States of America 406198
Netherlands 323000
Poland 220000
India 40000

142
There are two types of mushroom growers in India – seasonal and round-the-year growers.
Seasonal growers are confined to temperate areas such as Himachal Pradesh, Jammu and
Kashmir, the hilly regions of Uttar Pradesh, Tamil Nadu and the North Eastern states. There
are also growers in states with a warmer climate such as Uttar Pradesh, Haryana, and Rajasthan
(during winter months). Both types of growers cultivate white button mushroom for the
domestic market and export. There are a few big companies, but many small and marginal
farmers who grow seasonal mushrooms and adopt different technologies.
Table 11.1: All India Production of Mushroom
Year Production (in ’000 MT)
2004-05 40
2005-06 35
2006-07 37
2007-08 37
2008-09 37
2009-10 41
2010-11 41
2011-12 NA
2012-13 NA
2013-14 17
Source: Compiled from Indian Horticulture Database, 2014 accessible at http://nhb.gov.in/area-
pro/NHB_Database_2015.pdf (accessed on 17 November, 2016)
Note: NA stands for information not available
Mushrooms are treated before being consumed. This treatment involves drying, freezing and
pickling, among others. Fresh mushrooms have a limited shelf life and require canning and
other forms of processing to increase shelf life. Over 50 per cent of mushrooms produced in
India are sold in fresh form and the rest are processed.208
11.4 Export of Mushrooms from India
Until the early 1990s, the Indian contribution to world mushroom trade was minimal. It
gathered momentum as the industry became organised with the establishment of large-scale
export oriented units. Over the years, successful cultivation of the crop has slowly made it an
export-oriented business. India’s exports of mushrooms to the world amounted to around EUR
15.52 million (INR 1,121.24 million209) in the fiscal year 2015-16.210 The major export
destinations are the US, EU, Switzerland and China.
208 http://www.dcmsme.gov.in/publications/pmryprof/food/ch2.pdf (accessed on 3 June, 2016) 209 Conversion from EUR to INR done using the average exchange rate for the financial year 2015-2016 from
http://ec.europa.eu/eurostat/web/exchange-
rates/data/database?p_p_id=NavTreeportletprod_WAR_NavTreeportletprod_INSTANCE_yFWTDHW2Gf
Rx&p_p_lifecycle=0&p_p_state=normal&p_p_mode=view&p_p_col_id=column-2&p_p_col_count=1;
(accessed on 7 June, 2016) EUR 1 = INR 72.244725 210 DGFT Export-Import Databank, http://commerce.nic.in/eidb/default.asp (accessed on 21 November, 2016)

143
Mushrooms can be exported in fresh, dried and preserved form. India’s exports are mainly
undertaken in the form of preserved and dried mushrooms (HS 7123100 and HS 20031000).
Other forms do not have substantial shares in overall exports. Button mushrooms account for
most of the exports. Although the current share of India in world exports is less than one per
cent, India has great export potential.
The value chain for mushroom exports is given in Figure 11.1. There are two types of exporters
– those who own farms, process and export; and those who procure from farmers for processing
and exporting. Processing of the product is done as per importers’ requirements. Thereafter, it
is sent for fumigation/sterilisation using radiation and then it is packed and exported.
Figure 11.1: Export Value Chain for Mushrooms
Source: Based on inputs received during the survey
Processors pointed out that their mushroom production facilities are compliant with the ISO,
HAACP and other necessary standards. The exporters are registered with APEDA. All
exporters undertake strict quality control in terms of sorting and grading and MRLs related to
chemicals (in fertilisers and pesticides) for exporting to markets with standardised requirements
such as the EU. The EU importers/buyers provide information about phytosanitary regulations
to Indian exporters.
11.5 India’s Exports to the EU
Table 11.3 shows mushroom exports from India to the EU. For the period between 2010-11
and 2015-16, India mainly exported preserved and dried mushrooms (HS 7123100 and HS
20031000) to the region. The share of EU countries in India’s total export of mushrooms is
Sorting
Grading Farmer Processor
Processing
the product
as per
importer’s
requirement
Fumigation/
Sterilisation
by radiation
technology
Packaging
Indian
Port
EU Port
Buyer

144
significant for these two categories. The category-wise share of EU in India’s mushroom
exports is shown in Table 11.4 for the years 2014-15 and 2015-16. Within the EU, the major
importing countries for Indian mushrooms are France, Italy, Germany and Sweden.
Table 11.1: India's Exports of Mushrooms to EU Countries (Values in INR million)
HS Code Commodity 2010-
2011
2011-
2012
2012-
13
2013-
14
2014-
15
2015-
16
7095100 Mushrooms Fresh Or Chilled NA NA NA 0.001 NA 0.145
7115100 Mushrooms of Genus
Agaricus provisionally
preserved
1.165 9.792 3.233 0.007 1.908 NA
7123100 Mushrooms of genus agarigus,
dried, whole, cut, sliced,
broken
100.49 162.94 76.406 158.50 229.44 190.45
20031000 Mushrooms
prepared/preserved
0 6.047 37.762 94.8 428.05 392.96
20039000 Other mushrooms & truffles
prepared/preserved
NA 3.901 6.059 NA NA NA
Total 101.66 182.68 123.46 253.31 659.39 583.56
Source: DGFT Export-Import Databank, http://commerce.nic.in/eidb/default.asp (accessed 18 on
November, 2016)
Note: NA stands for information not available
Table 11.2: EU's Share in India’s Export of Mushrooms (in percentage)
HS Code Commodity 2014-2015 2015-2016
7095100 Mushrooms fresh or chilled 0.00 0.44
7115100 Mushrooms of genus agaricus provisionally preserved 0.04 0.00
7123100 Mushrooms of genus agarigus, dried, whole, cut, sliced,
broken
57.87 76.84
20031000 Mushrooms prepared/preserved 43.66 56.17
20039090 Other mushrooms & truffles prepared/preserved 0 0
Source: DGFT Export-Import Databank, http://commerce.nic.in/eidb/default.asp (accessed 18 on
November, 2016)
11.6 Issues and the Way Forward
In the past decade (since 2005), there have been no instances of any issues with Indian
mushrooms being exported to the EU. This is also confirmed by the fact that no notification
has been raised either on the RASFF portal or the EUROPHYT portal. Exporters and
processors confirmed that there have been no SPS issues with exports to the EU.
In spite of no issues related to exports, export volumes from India for mushrooms are low in
general and the full potential of mushroom cultivation is yet to be realised in the country.
Commercial cultivation of mushroom in India is in its initial stages and the supply chain can
be strengthened further.
145
Much of the barriers to high quality mushroom cultivation are related to the domestic market.
Domestic marketing channels lack adequate price support and processors face erratic demand
and supply. Lack of trained manpower is among the other hurdles in the growth of the industry
and it requires specialised skills and knowledge. Knowledge sharing with the EU under the
EU-India CITD programme in skill development will help Indian exporters and processors.
Further, India needs to not only adopt high yielding and better quality mushrooms but also
different varieties of mushrooms. In this regard, the EU has the knowledge that will benefit
Indian producers. The production of mushrooms has to be complemented with sound post-
harvest infrastructure. The EU can help India set up such infrastructure under collaborative
projects. There is need for co-ordination among Indian and European research organisations
and producers to enhance research on new varieties of produce suitable for the Indian climate,
and improve processing technology, to lower the use of pesticides and to encourage organic
farming. Farmers have to be trained to limit the use of chemical inputs and in new areas such
as organic farming of mushrooms. The EU-India CITD programme can help bridge such
knowledge gaps in India.
The demand for button mushrooms is fast increasing in international markets and a gap exists
between supply and demand. There is need to take advantage of this situation by further
encouraging production in India. Mushroom cultivation using good agricultural practices can
provide an effective way to harness agricultural waste and convert them into health food and
to provide income and employment. India also needs information and processing technology
to process mushrooms in brine and for processing mushrooms for export.
146
Chapter 12: Conclusion and the Way Forward
India is one of the largest producers of a number of agriculture commodities and the EU is one
of the largest export markets for India. In 2015-16, India’s export of agricultural commodities
to the EU was more than five times higher than the EU’s export to India. Despite this, existing
literature highlights that exports from developing countries such as India face SPS issues in
developed country markets including the EU market, which adversely affect exports. It is,
therefore, important to understand the SPS related barriers faced by India’s agricultural
exports to key markets, identify the reasons for such barriers and make recommendations
on addressing barriers through greater collaboration and knowledge sharing with the EU.
This report is based on case-studies of selected products and a research methodology based on
a survey complemented with literature.
The report shows that there are differences in the case studies with respect to the extent that
different products are affected by the EU’s SPS measures. There are products (such as
mangoes) in which Indian exporters have faced rejections or bans in the EU and other markets
(for example, the US and Japan) in the past, but such issues have now been resolved by
implementing measures (such as hot water treatment for the EU or gamma irradiation treatment
for the US) that are acceptable to the importing countries. For some products such as green
peas, green beans and mushrooms, there are hardly any alerts in the RASFF or EUROPHYT
portals, but export potential is low. For products like milk and milk-based products, it has been
difficult for Indian exporters to access the EU market due to SPS issues. These have been
discussed in detail in the respective chapters.
12.1 SPS Barriers in the EU: Where They Arise and Their Impact
The survey found that the EU has higher food safety standards than not only those set by
international organisations such as Codex Alimentarius Commission, but for some products
such as peanuts, the standards are higher than those set by other developed countries such as
the US. There are instances where the EU has frequently revised the MRL on chemical residue
levels for various products, which make the imports to the EU more prone to rejections.
Frequent changes to MRL lead to an uncertain business environment for exporters. In a number
of cases, such as the proposed reduction of MRL of ccc for grapes and MRL of tricyclazole for
Basmati rice, the issue has to be addressed at field level by reducing/limiting use of the
particular chemical. Specifically, in the case of the proposed reduction in the ccc limits in
grapes from 0.05mg/kg to 0.01mg/kg in the year 2016 by the EU, there were doubts about the
scientific justification of the revision of the MRL and this issue was raised in by India in the
WTO’s Committee on Sanitary and Phytosanitary Measures.211 The EU has now decided to
211 WTO Committee on Sanitary and Phytosanitary Measures Document G/SPS/GEN/204/Rev.17 Dated 7
March 2017. Available at
http://spsims.wto.org/en/OtherDocuments/Search?DoSearch=True&DocumentSymbol=G%2FSPS%2FGE
N%2F204%2FRev.17&DistributionDateFrom=07%2F03%2F2017&DistributionDateTo=07%2F03%2F201
7&SubmittingMembers=&SubmittingObservers=&SubmittingObserverOrganizations=&Secretariat=&Dev
elopmentStatus=&GeographicGroups=&Title=&Keywords=&DocumentTypes= (accessed on 12 April,
2017)
147
maintain the current MRL of 0.05mg/kg in grapes. Similar doubts about scientific justification
have also been raised in the case of aflatoxin tolerance limits for peanuts by the survey
participants. Thus, there are incidences where measures may have been implemented without
strong scientific justification.
The survey found that the product can get contaminated in the supply chain due to poor storage
conditions or incorrect processing technologies, among others. A number of studies point
towards the aflatoxin contamination in Basmati rice and peanuts in the supply chain as possible
reason for SPS barriers and product rejections. These issues are discussed in the respective case
studies.
There are concerns raised by the EU on official inspection, testing and residue monitoring
procedures. Recently, the EU decided to test up to 50 per cent of India’s shrimp consignments
for residues such as chloramphenicol and nitrofurans, which was earlier 10 per cent. The EC
document states that:
“Indian guarantees on the residues status of aquaculture products rely to a large extent on the
additional pre-harvest and pre-export testing programmes in place and these mitigate to a
certain extent the long- standing deficiencies in official controls on farms, and in particular,
very unsatisfactory official controls on the use of veterinary medicinal products. Nevertheless,
the relatively narrow range of substances tested for in those additional programmes weakens
the reliability of those guarantees. To date, the recommendations from the inspection report
concerning official monitoring of aquaculture farms have not been satisfactorily addressed.”
212
The case studies also highlight that the certain chemicals, pesticides, etc., used in farms can
result in SPS barriers and, therefore, they can only be controlled to some extent at the post-
harvest and pre-export stage. Further, between January 2011 and March 2017, there were 57
notifications for shrimp on the RASFF portal for the presence of prohibited substances such as
nitrofuran and furazolidone, and for the presence of chemicals such as oxytetracycline above
the MRL levels, and 33 of these were between January 2014 and March 2017.213 This is despite
the fact that strict export monitoring and control are followed in India for shrimp exports to the
EU. Survey participants have questioned that if a produce is going through export inspections
why is it rejected in the EU.
The case studies also discussed how these barriers have adversely affected the Indian exporters
and farmers, which have resulted in loss of revenue and reduction in shelf-life of products, and
in destroying the products/consignment at the EU port of entry. Since issues are product
specific, each case study discusses how the specific issues have adversely affected the different
stakeholders.
212 Extracted from http://eur-lex.europa.eu/legal-content/EN/TXT/PDF/?uri=CELEX:32016D1774&from=EN
(accessed on 10 April, 2017) 213 Source: https://webgate.ec.europa.eu/rasff-window/portal/?event=searchResultList&StartRow=101
(accessed on 12 April, 2017)

148
The case studies show that the EU standards apply equally to the EU FBOs as well as to all
exporters to the EU. In this context, it is important to note that public awareness and concerns
about food safety are rising across the world. There has been an increase in use of risk analysis
techniques and a number of developing countries are taking measures to implement more
stringent food safety standards. For example, Cambodia banned tricyclazole in March 2017,
following the EU’s new MRL on the same not only for exports but also for domestic
consumption.214 In some case studies, for example, peanuts and dairy, the survey found that
products are not only failing to comply with the EU standards, but the standards in the domestic
market are sometimes lower than the international standards such as Codex Alimentarius.
Adopting and implementing the international standards in a more stringent manner is likely to
reduce the difficulties to comply with EU standards as well.
One of the concerns of the Indian exporters is that they are losing their market share to exports
from countries such as Kenya, Uganda and Brazil and Chile, who are able to meet the EU
standards. Therefore, SPS issues have to be addressed in the context of a highly globalised and
competitive trade environment.
12.2 Addressing the SPS Barriers
The SPS barriers can be addressed in several ways such as by ensuring conformity to the
importing country standards, implementing certain processes to meet the importing country
requirements, undertaking corrective measures, implementing good agriculture practices,
raising the issue in the WTO and discussing the issue bilaterally with the importing country,
among others. The case studies show that a number of barriers faced by Indian exporters for
products such as mangoes, grapes and eggplant in the EU have been corrected through the
extensive efforts of the Indian Department of Commerce and agencies such as APEDA. These
are discussed in details below:
Implement Product Traceability: The survey found that the most successful way of
resolving the issues in the recent years has been establishment of product traceability. The
case studies of mangoes, fresh grapes, peanuts and eggplant reflect how product traceability
can help to overcome the SPS barriers. The EU is a crucial market for India and all
stakeholders (including exporters, farmers, processors, supply chain agents) in the survey
have accepted that they have to meet EU import requirements and they are willing to do so
by implementing product traceability as laid down by APEDA, at least in the case of certain
products such as table grapes and peanuts. A number of exporters and processors are also
keen to have a product traceability system for Basmati rice, which is presently not in place.
There are some issues in implementing product traceability, which may continue to exist.
India is a large country with multiple small and mid-sized farmers and, therefore, raw
materials are procured from multiple farms and agriculture mandis, which make it difficult
to ensure product traceability. Further, direct sourcing and contract farming are not allowed
in states such as West Bengal, which makes it difficult to have direct links between
214 Source: http://www.akp.gov.kh/?p=99323 (accessed on 12 April, 2017)
149
exporters, processors and farmers, and ensure product traceability. Even in states such as
Maharashtra, where direct sourcing is allowed, exporters prefer to go through middle men,
as individual small farmers are not able to ensure uniform quality of supply and handling
products of multiple farmers can be difficult.
Initiate Proactive Measures: The case studies show that proactive measures will enable
India to counter bans. For example, while mangoes from Pakistan faced significantly more
interceptions than Indian mangoes for fruit flies during the same time period, Indian
mangoes faced the ban and Pakistani mangoes were not banned. This is because when the
EC sent a warning letter to Pakistan, it immediately stopped exporting mangoes and made
hot water treatment mandatory. Similar action was taken by India for okra which helped
the country to counter a ban. The okra example needs to be repeated when frequent cases
of interceptions happen, and in this context APEDA needs to work closely with the state
governments for products under its purview.
Implement Good Agriculture Practices (GAP): Most developing countries address the
SPS issues faced in developed country markets by implementing GAP and reducing the use
of chemicals and pesticides. An analysis of the case studies reveals a persistent problem
originating at the farm level – the excessive use of pesticides by farmers. The amount of
pesticides sprayed on the crop is so significant that gradually pests become resistant to
them, causing farmers to spray even larger amounts of chemicals over time, leading to
deterioration in plant and soil health. This occurred despite the fact that all the farmers who
participated in the survey were aware of GAP. Many chemicals that are globally banned
are still available over the counter in India. Specifically, 67 pesticides that have been
banned in the US, the EU and other nations are still in use in India.215 Examples of such
pesticides are carbosulfan, chlorpyrifos, endosulfan, and quinalphos. If Indian farmers use
these pesticides, they will not be able to exports to countries such as the US, the EU and
Japan.
A number of state government officials pointed out that India should move to safe
agriculture and GAP. In some areas and for certain crops, these practices are already
followed; in India however, there is need for more hands-on guidance. Initiatives are
required at multiple levels. First, chemicals and fertilisers that are banned in other countries
should not be used in India. Second, the curriculum in agricultural universities should be
updated and students should be imparted with lessons on modern and good agriculture
practices that can be applied at the ground level. These have to percolate down to the farm
level. Agricultural universities can have farm-level programmes to enable the practical
application of knowledge. Third, in sectors such as dairy sector, proper hygiene conditions
should be maintained at the farm level to ensure that the milk that reaches co-operatives
and private processors is of good quality. Indian government has renewed its focus on
hygienic milk production and marketing and such efforts have to begin at the farm level.
Farmers who were surveyed, irrespective of their farm size, revealed that they would like
to move away from the use of chemicals and towards GAP and subsequently towards
215 Source: http://www.downtoearth.org.in/coverage/pesticide-trap-33914 (accessed on 23 August, 2016)
150
organic farming as there is greater demand for organic products in large markets such as
the EU.. They acknowledge that the export market provides higher price realisation as
compared to the domestic market and pest-free organic agriculture products get an even
better price. Therefore, they are willing to switch to the use of bio-fertilisers and green
inputs, but most of them do not have the knowledge and financial means to make the switch.
There is a significant push from the Indian central and state governments to promote
organic farming but there is a severe shortage of organic inputs, technology, knowledge
and most importantly, funding. Chemical fertilisers are highly subsidised and are available
in plenty; in contrast, the availability of bio-chemicals and green inputs is limited and the
organic inputs for exports have little (or no) subsidies. Therefore, it is important to have a
relook at the subsidy regime and subsidise the right type of inputs and farm practices. All
government departments may work together to design a comprehensive policy on safe
agriculture and organic farming.
Strengthen Testing Procedures and Follow Global Best Practices: In the case of sectors
such as milk products and milk-based products, efforts have been put in the right direction
to ensure that India has good inspection process for dairy exports. There is a need for
research in developing efficient testing procedures for milk products and milk-based
products. GPH based on the HACCP system for milk production and processing should be
followed throughout the milk supply chain.
Export Infrastructure: The survey found that India has been increasingly implementing
food safety assurance and management system such as HACCP and the FSSAI has
mandated its implementation for all FBOs. This will help exports. Industries are also
encouraged to do self-certification.
Some trading partners such as the EU are insisting on installation of specific infrastructure
requirements such as mechanised methods of milking for diary exports, which may be
possible for private dairies to abide by but may be difficult for the milk co-operatives to
implement, given the large number of small farms. In this context, it is important to identify
and prioritise companies which are ready to export and those which need further training
and capacity building prior to export. The survey recommended creation of model dairy
farms with common infrastructure such as mechanised milking facilities for enabling
training, health care for animals and breeding among other things. This will also enable
poor farmers to have access to infrastructure and better revenue.
Certain contaminations such as aflatoxin contamination can occur in the supply chain of
products such as Basmati rice and peanuts. Discussions at the WTO highlight that India is
of the view that aflatoxin contamination can happen in transit (for example, during storage
and transportation), while according to the EU it is possible, through appropriate packaging,
storage and shipping conditions, to reduce the environmental conditions conducive to
aflatoxin growth (Das, 2008).While the two economies may differ in their views, there is
no denial that it is important to strengthen the supply chain. The survey found that
infrastructure such as cold storages are not equally spread across all states and there are
151
severe shortages of pack houses, which can lead to product spoilage and fungus (also see
NCCD, 2015).
Need for Data Generation and Data Availability: To raise an SPS issue with any trading
partner, there is need for data and scientific justification. In India, there is no data of exports
from different states. This data has to be collected and analysed. APEDA, through the
TraceNet system, can create a database consisting of exports from the state, number of
farmers and acreage under export, etc., which can be made available on the public domain
through the APEDA website. Since agriculture is a state subject, information on how much
land is used for cultivation for export, export contribution of each state, export
infrastructure in each state, etc., will be particularly beneficial for both policymakers and
exporters. Further, in sectors such as dairy sector, India is not declared free from FMD by
the OIE. However, the government is continuously making efforts to reduce the incidence
of FMD outbreaks. There is a need for collection of data by the relevant authorities
capturing the information on FMD outbreaks in the country. This will also help to raise the
issue in the WTO and other forums, if it is backed by evidence.
Need for Scientific Research: A number of agriculture products that India exports to the
EU and other markets are specific to this country. For example, Basmati rice, Alphonso
mango and Darjeeling tea. These are premium products and if such products get rejected
or banned, the cost of such a ban is high. To prevent it, there is need for scientific research
in India to find out methods to address the issues faced by such products in key markets.
The research should focus on both short-term and long-term solutions. Such research
findings can be used in discussion with the importing countries and also for training and
knowledge sharing with the exporters and other stakeholders.
Request for Information and Scientific Justification: The case studies show that while
information on the SPS measures imposed by the EU is available in the public domain, in
some cases the scientific justification for imposing the measure is not clear. It will be
beneficial if the EC shares with India the procedures, inspection and testing for certain
products like milk products and peanuts, and this information is made available on the EIC
and APEDA websites.
Discuss the Issue in the WTO: The specific trade concern (STC) raised by India on October
2016, regarding the lowering of MRLs for ccc in table grapes from 0.05mg/kg to 0.01mg/kg
and the EU’s response to India’s concerns confirms that SPS issues can be raised in the
WTO. The STCs 216 raised by India (either individually or along with other trading partners)
against the EU between since 1995 till 2016 are listed in Table 12.1. Overall, 416 STCs
have been raised in the WTO by its member countries (as reported by the WTO’s SPS
216 Source: WTO Committee on Sanitary and Phytosanitary Measures Document G/SPS/GEN/204/Rev.17
Dated 7 March 2017. Available at
http://spsims.wto.org/en/OtherDocuments/Search?DoSearch=True&DocumentSymbol=G%2FSPS%2FGE
N%2F204%2FRev.17&DistributionDateFrom=07%2F03%2F2017&DistributionDateTo=07%2F03%2F201
7&SubmittingMembers=&SubmittingObservers=&SubmittingObserverOrganizations=&Secretariat=&Dev
elopmentStatus=&GeographicGroups=&Title=&Keywords=&DocumentTypes= (accessed on 12 April,
2017)

152
Committee on Sanitary and Phytosanitary Measures) and among them only 8 are raised by
India against the EU. Given that Indian exports face a number of SPS barriers in the EU,
India can raise more concerns in the WTO. Further, the status of 6 out of 8 concerns given
as “not reported” (NR), which implies that the current status of the concerns (whether it has
been addressed or not addressed) is not known. STC Number 374, which relates to the EU
ban on mangoes and certain vegetables from India, was raised by India first in July 2014
and was subsequently raised 6 times between October 2014 and June 2016 and the status
is still “not reported”.217 While this issue seems to have been resolved by implementing
certain measures and procedures, it has to be reported to the WTO’s SPS Committee.
Table 12.1: STCs Raised by India against the EU (either individually or with other WTO
members) between 1995 and 2016
Year STC
Number
Description of Measure Member
Maintaining
the Measure
Status* Whether
Discussed
Again in 2016
1998 39 Maximum levels for certain
contaminants (aflatoxins) in foodstuffs
EU R No
2001 96 Geographical BSE risk assessment EU R No
2010 300 Regulation (EC) No. 1099/2009218 EU NR No
2010 306 Maximum residue levels of pesticides EU NR No
2012 335 EU testing of pesticide residues EU NR No
2014 374 EU ban on mangoes and certain
vegetables from India
EU NR Yes
2014 378 EU withdrawal of equivalence for
processed organic products
EU NR Yes
2016 412 EU MRLs for bitertanol, tebufenpyrad
and chlormequat (G/SPS/N/EU/168)
EU NR No
Source: WTO Committee on Sanitary and Phytosanitary Measures Document G/SPS/GEN/204/Rev.17
Dated 7 March 2017. Available at http://spsims.wto.org/en/OtherDocuments/Search?DoSearch=
True&DocumentSymbol=G%2FSPS%2FGEN%2F204%2FRev.17&DistributionDateFrom=07%2F0
3%2F2017&DistributionDateTo=07%2F03%2F2017&SubmittingMembers=&SubmittingObservers
=&SubmittingObserverOrganizations=&Secretariat=&DevelopmentStatus=&GeographicGroups=&
Title=&Keywords=&DocumentTypes= (accessed on 12 April, 2017)
*NR = Not Reported, R = Resolved.
The survey found that some cases may be raised in the WTO - for example, the lowering
of MRL for ccc in grapes in 2016. However, for discussing the issue, India needs to collect
scientific data on the MRL level of other countries, what proportion of the exports are likely
to be impacted, the health-related repercussions of the chemicals, etc. Further, there is need
for R&D to show that certain measures may not be based on scientific evidence. In the
WTO, India may raise the issue with other exporting countries.
217 Source: http://spsims.wto.org/en/SpecificTradeConcerns/View/374 (accessed on 12 April, 2017) 218 Link to the regulation: http://eur-
lex.europa.eu/LexUriServ/LexUriServ.do?uri=OJ:L:2009:303:0001:0030:EN:PDF (accessed on 12 April,
2017)

153
Discuss the Issue Bilaterally by taking Buyers and their Association into Confidence:
The survey showed that SPS issues are mostly discussed bilaterally with the importing
country. Such discussions may be more beneficial if the EU buyers support it and if the
restrictions imposed by the EU adversely impact them. There are instances, as in the case
of tricyclazole for Basmati rice is a good example in this respect. In this case, certain
relaxation of the time period of implementation of the measure has been given to Basmati
rice growing countries (namely India and Pakistan) at the request of the European FBOs
and other stakeholders.219 Thus, working with EU buyers can help to reduce the SPS barrier.
Sign Equivalence Agreements/MoUs: A number of studies pointed out that lack of mutual
recognition of inspections and standards in cases of products such as peanuts and peanut
products are a key SPS barrier (Das, 2008). This issue has also been raised in the survey.
The WTO’s SPS Agreement encourage member countries to recognise each other’s
conformity assessment systems based on international standards so that products certified
in one country are accepted without the need for further inspection/testing by other
countries through equivalence or MRA. Codex Alimentarius Commission also encourages
such agreements with a view to avoid duplication of inspection and testing which can
increase the cost of exports, and to ensure the health and safety concerns. The EU does
enter into product specific MRA and such agreements are possible with countries that have
strong export control system. India may sign product specific equivalence agreement with
the EC.220 The content of the agreement may include, among others, provision for retesting
and appeal in case of product rejection.
In this context, it is also important to note that APEDA is trying to negotiate product
specific compliance with EU standards. Although it was successful in getting unilateral
equivalence for certain commodities like organic fresh and processed products, it has
recently lost the unilateral equivalence for export of processed organic products to the EU,
in spite of setting up the organic standards for exports implemented.221 This example also
shows that unless there is a trade agreement, there is a risk that equivalence agreements and
MoUs may be revoked by the trading partner. Thus, a trade agreement could provide more
certainty to Indian exporters and processors compared to equivalence agreements.
The case of withdrawal of equivalence for organic products has been raised by India in the
WTO since the year 2014. The EU continues to maintain that this concern of India is not
within the scope of the WTO’s SPS Agreement as organic is not a food safety issue and the
US supported this view. The WTO Secretariat noted that there was no WTO legal
interpretation addressing organic products. Analysing this case in the WTO, the WTO
experts and APEDA pointed out that as an emerging country it is extremely difficult for
India to get “unilateral equivalence” for exports of organic produce in the future.222 The
219 Source: https://ec.europa.eu/food/sites/food/files/plant/docs/sc_phyto_20161128_ppr_sum.pdf (accessed on
12 April, 2017) 220 Also see http://www.fao.org/docrep/meeting/008/y5871e/y5871e0m.htm (accessed on 10 April, 2017) 221 Source: http://spsims.wto.org/en/SpecificTradeConcerns/View/378 (accessed on 12 April, 2017) 222 Source: WTO Committee on Sanitary and Phytosanitary Measures Document G/SPS/GEN/204/Rev.17
Dated 7 March 2017. Available at
http://spsims.wto.org/en/OtherDocuments/Search?DoSearch=True&DocumentSymbol=G%2FSPS%2FGE

154
European companies want to export to and import from India, for which they will prefer
“mutual” recognition of each other’s conformity assessment systems or standards.
Need for a Strong Food Control and Certification Mechanism: An EIC report223 to the
FAO points out that there is need to have a strong food control and certification system for
both exports and imports. This is especially relevant in the context of the fact that India is
trying to develop as an agro-processing base and become a key player in global food
production network and value chain. The report highlights that there is need for
accreditation of certifying bodies as per the international standards, improving the testing
facilities in laboratories and identifying the areas that need to be addressed (for example,
veterinary drug residue) and where they can be addressed (the issue of veterinary drug
residues needs to be addressed at the farm level as it is difficult to control it in the processing
units). The EC audits discussed in different case studies and this chapter also highlight the
gaps in official inspection and testing procedures which need to be addressed.
A number of studies224 highlight that multiple regulations and regulating agencies not only
make the export process cumbersome, it leads to wastage of national resources, lack of
clarity in the procedures and lack of accountability. This issue needs to be examined. The
exporters also pointed out that the exact processes should be laid down on the websites of
the different agencies and a consolidated document should be created for key products that
are exported if multiple agencies are involved. In this context, India can have business
friendly export processes as is designed by countries like Australia for milk products
exports to the EU. Same is also applicable to products such as peanuts and peanut products,
where role of different agencies may be specified since it has changed recently. In this
context, India may also examine the EU system of a single comprehensive risk management
body and how it works to resolve issues such as aflatoxin contamination. India can also
look at the case of countries such as Argentina.
There is need for smooth flow of information between export regulating agencies and
customs in case of change of standard practices. The case studies show that customs
sometimes do not have updated information on different requirements for exports to
different markets. All specifications, inspection and testing methods may be documented
and made available on a common website.
Need for Active Participation in International Standards Setting Organisation: India has
been actively participating in the standard setting process of the international standards
setting bodies. However, due to the prevalence of dual standards - a higher standard for
exports to meet the importing country requirements and a lower standards for imports and
the domestic market to meet the domestic concerns of small farmers etc. - somewhat
N%2F204%2FRev.17&DistributionDateFrom=07%2F03%2F2017&DistributionDateTo=07%2F03%2F201
7&SubmittingMembers=&SubmittingObservers=&SubmittingObserverOrganizations=&Secretariat=&Dev
elopmentStatus=&GeographicGroups=&Title=&Keywords=&DocumentTypes= (accessed on 12 April,
2017) 223 http://www.fao.org/docrep/meeting/008/y5871e/y5871e0m.htm (accessed on 10 April, 2017) 224 See EIC report at FAO (http://www.fao.org/docrep/meeting/008/y5871e/y5871e0m.htm (accessed on 10
April, 2017) and Das, 2008.

155
weakens India’s position in such negotiations. The Codex Trust Fund was launched in 2003
to help developed countries such as India to transit into the standards laid down by Codex
Alimentarius. While India has aligned its own SPS standards to international standards such
as Codex Alimentarius, food safety standards in most developed countries and a number of
developing countries are far higher than the international standards. Further, India needs to
actively push for international standards for certain food products like ethnic sweets.
Knowledge Sharing and Collaboration with the EU: The case studies identified specific
areas where there is need for knowledge sharing and collaboration with the EU. The EU-
India CITD programme has helped to establish co-operation and to increase capacity of key
beneficiaries, but there is possibilities of further co-operation and capacity improvement.
For example, in spite of several years of knowledge sharing under the EU-India CITD
programme, it is a matter of concern that the EU has found the Indian official inspection
processes to be “unsatisfactory”. There is need for discussions to understand where there
are gaps in knowledge sharing.
To conclude, in spite of the issues that stakeholders may face, the report found that there is
strong willingness among Indian exporters, processors and farmers to meet EU standards.
The case studies of mangoes and fresh grapes reflect success stories; efforts were made by
the government agencies, farmers and exporters to adhere to the EU norms to be able to
export to them. The EU is a crucial market for India and all stakeholders (including
exporters, farmers, processors, supply chain agents) have accepted that they have to meet
EU export requirements and they are willing to do so, at least in the case of certain product
categories such as table grapes, Alphonso mangoes and Basmati rice.

156
References
Agricultural and Processed Food Products Export Development Authority (APEDA)
(2015), Procedure for Export of Vegetables. Available at http://apeda.gov.in/
apedawebsite/HACCP/procedure-for-ffv-exports-2015.pdf (accessed on 18 October,
2016)
AgriNet Solutions (2014), Basmati Acreage & Yield Estimation in Punjab, Haryana, Delhi,
Uttarakhand, Himachal Pradesh, Western Uttar Pradesh and Parts of Jammu &
Kashmir, Volume 6. Available at http://apeda.gov.in/apedawebsite/trade_promotion/
BSK-2014/Report-Volume-VI.pdf (accessed on 15 June, 2016)
Anwar, S.A. and McKenry, M.V. (2012), Incidence and population density of plant-parasitic
nematodes infecting vegetable crops and associated yield losses in Punjab, Pakistan.
Pakistan J. Zool, 44(2), pp.327-333.
Ashok, V., Agrawal, N., Durgbanshi, A., Esteve-Romero, J. and Bose, D. (2014),
Determination of Adulteration of Malachite Green in Green Pea and Some Prepared
Foodstuffs by Micellar Liquid Chromatography. Journal of AOAC International, 97(5),
pp.1387-1392.
Bashyal, B.M., Aggarwal, R., Sharma, S., Gupta, S., Rawat, K., Singh, D., Singh, A.K.
and Krishnan, S.G. (2016), Occurrence, identification and pathogenicity of Fusarium
species associated with bakanae disease of basmati rice in India. European Journal of
Plant Pathology, 144(2), pp.457-466.
CAC (2015a), ‘Proposed Draft maximum level for total aflatoxins in ready-to-eat peanuts and
associate sampling plan’, CX/CF 15/9/9. February. Available at
ftp://ftp.fao.org/codex/Meetings/cccf/cccf9/cf09_09e.pdf (accessed on 7 November,
2016)
CAC (2015b), ‘Proposed Draft maximum level for total aflatoxins in ready-to-eat peanuts and
associate sampling plan’, CX/CF 15/9/9-Add.1. March. Available at
ftp://ftp.fao.org/codex/meetings/cccf/cccf9/cf09_09_Add1e.pdf (accessed on 7
November, 2016)
Centre for the Promotion of Imports (CBI), Ministry of Foreign Affairs (2015), CBI Product
Factsheet: Fresh Mangoes in Europe. The Netherlands. Available at
https://www.cbi.eu/sites/default/files/market_information/researches/product-
factsheet-europe-fresh-mangoes-2015.pdf (accessed on 7 November, 2016)
Centre for the Promotion of Imports (CBI), Ministry of Foreign Affairs (2015), CBI Product
Factsheet: Mango puree in Europe. The Netherlands. Available at
https://www.cbi.eu/sites/default/files/market_information/researches/product-
factsheet-europe-mango-puree-2015.pdf (accessed on 7 November, 2016)
157
Centre for the Promotion of Imports (CBI), Ministry of Foreign Affairs (2015), CBI Product
Factsheet: Fresh Beans, Peas, and Other Leguminous Vegetables in Europe. The
Netherlands. Available at https://www.cbi.eu/sites/default/files/market_information
/researches/product-factsheet-europe-fresh-beans-peas-leguminous-vegtables-
2015.pdf (accessed on 10 November, 2016)
Chaturvedi, S. and Nagpal, G., (2003), “WTO and product-related environmental standards:
emerging issues and policy options”, Economic and Political Weekly, Volume 38, No.
1, (Jan 4-10, 2003) pp.66-74.
Crop in India’, IOSR Journal of Economics and Finance (IOSR-JEF) e-ISSN: 2321-5933.Vol.
1, Issue 3 (Sep-Oct 2013), pp. 01-07. Available at http://www.iosrjournals.org/iosr-
jef/papers/vol1-issue3/A0130107.pdf?id=6405 (accessed on 18 October, 2016)
Das, K. (2008). Addressing SPS challenges in India. Centre for WTO Studies. Available at
http://wtocentre.iift.ac.in/Papers/SPS_Paper_CWS_August%202009_Revised.pdf
(accessed on 12 April, 2017)
DG SANCO (2013), Final Report of an Audit Carried out in India From 17 To 26 April 2013
in Order to Evaluate the System of Official Controls for the Export Of Plants And Plant
Products To The European Union, DG(SANCO) 2013-6818 – MR FINAL. Available
at ec.europa.eu/food/fvo/act_getPDF.cfm?PDF_ID=10719 (accessed on 7 November,
2016)
DG Sanco, ‘Final Report of an Audit carried out in India from 21 October to 1 November,
2013 in order to assess the controls of aflatoxin contamination in peanuts intended for
export into the European Union and follow up mission’, DG(SANCO)/2009-8148.
ec.europa.eu/food/fvo/act_getPDF.cfm?PDF_ID=10969 (accessed on 28 October,
2016)
Drew, R.A.I. and Raghu, S. (2002), The Fruit Fly Fauna (Diptera: Tephritidae: Dacinae) of
the Rainforest Habitat of the Western Ghats, India. The Raffles Bulletin of Zoology,
200250(2), pp.327-352.
European Commission (2010), Report on the 'Plant Authentication Workshop’. Geel,
Belgium. Available at http://ec.europa.eu/agriculture/external-
studies/2010/basmati/fulltext_en.pdf (accessed on 14 September, 2016)
European Commission (2015), The EU Rice Regulatory Regime. Available at
http://ec.europa.eu/agriculture/cereals/factsheet-rice_en.pdf (accessed on 14
September, 2016)
European Fruit Juice Association (AIJN) (2014), 2014 European Fruit Juice Association
(AIJN) Market Report. Brussels. Available at http://aijn.org/files/default/aijn2014-
full.pdf (accessed on 3 November, 2016)
158
FAO (2004), Worldwide regulations for mycotoxins in food and feed in 2003. FAO food and
nutrition paper no. 81. Food and Agriculture Organisation of the United Nations, Rome,
Italy http://www.fao.org/docrep/007/y5499e/y5499e00.htm (accessed on 7 November,
2016)
Fridez, F. (2016), Basmati Rice Fraud under the Magnifying Glass of DNA Analysis. CHIMIA
International Journal for Chemistry, 70(5), pp.354-356.
Henson, S. and Rupert Loader (2000), “Barriers to Agricultural Exports from Developing
Countries: The Role of Sanitary and Phytosanitary Requirements”, World
Development, Volume 29, Number 1, pp. 85-102.
Henson, S., Loader, R.J., Swinbank, A., Bredahl, M., Lux, N., (2000), “Impact of Sanitary
and Phytosanitary Measures on Developing Countries”, Centre for Food Economics
Research, University of Reading, Reading; accessible at
http://www.reading.ac.uk/web/FILES/apd/AlanSwinbankSPSFINALREPORT.pdf
(accessed on 8 August, 2016)
Heydon K. and Woolcock S. (2009), ‘The Rise of Bilateralism: Comparing American,
European and Asian Approaches to Preferential Trade Agreements’, United Nations
University Press, 2009, p. 7
Hoda, A. and Gulati, A. (2013), ‘India’s Agricultural Trade Policy and Sustainable
Development’, Issue Paper No. 43, ICTSD Programme on Agricultural Trade and
Sustainable Development, September, Geneva, Switzerland.
Hoekman, Bernard (1998), “Beyond National Treatment: Integrating Domestic Policies”,
mimeo, The World Bank, Washington D.C.
Hooker, Neal H. (1999), “Food Safety Regulations and Trade in Food Products”, Food Policy,
Volume 24, pp. 653-668.
Horton, L.R. (1998), “Food from Developing Countries: Steps to Improve Compliance”, Food
and Drug Law Journal, Volume 53, Issue 1, pp. 139-171, February 1998.
IARI (2012) ‘Edible Oilseeds Supply and Demand Scenario in India: Implications for Policy’,
Authored by Girish Kumar Jha, Suresh Pal, V.C. Mathur, Geeta Bisaria, P. Anbukkani,
R.R. Burman and S.K. Dubey. Available at
http://www.iari.res.in/files/Edible_Oilseeds_
Supply_and_Demand_Scenario_in_India.pdf (accessed on 15 October, 2016)
Indian Council for Research on International Economic Relations (ICRIER) (2015),
Report on Evaluation of the Impact of the Scheme for Mega Food Park of the Ministry
of Food Processing Industries. Available at
http://www.mofpi.nic.in/sites/default/files/ICRIE
RreportonimpactofMFPS%28Final%29.pdf_0.pdf (accessed on 22 November, 2016)
159
Indian Council of Agricultural Research (ICAR) (2012), Manual for Mango Pest
Surveillance. Jointly published by National Centre for Integrated Pest Management,
New Delhi, ICAR Research Complex for Eastern Region, Research Centre, Ranchi,
Central Research Institute for Dryland Agriculture, Hyderabad, and Central Institute
for Subtropical Agriculture, Lucknow. Available at http://www.ncipm.org.in/nicra/
NICRAPDFs/Manuals/Manual%20for%20Mango%20Pres%20Surveillance.pdf
(accessed on 3 November, 2016)
International Food Policy Research Institute (IFPRI) (2016), “Formal versus Informal:
Efficiency, Inclusiveness, and Financing Dairy Value Chains in India”, IFPRI
Discussion Paper 01513, March 2016.
International Food Policy Research Institute (IFPRI) (2016), 2016 Global Food Policy
Report. Washington, D.C.: International Food Policy Research Institute (IFPRI).
Krishna, V.V. and Qaim, M. (2007), Estimating the adoption of Bt eggplant in India: who
benefits from public-private partnership?. Food Policy, 32(5), pp.523-543.
Kumar, Anjani, Parappurathua, Shinoj and Joshi, P.K. (2013), Structural Transformation
in Dairy Sector of India. Agricultural Economics Research Review. 26(2), July-
December 2013, pp. 209-19.
Lakshmi, V. (2012), Food adulteration. International Journal of Science Inventions Today,
1(2), pp. 106-113.
Madhusudhana, B. (2013), ‘A Survey on Area, Production and Productivity of Groundnut
Medakker, A. and Vijayaraghavan, V. (2007), Successful commercialization of insect-
resistant eggplant by a public-private partnership: reaching and benefiting resource-
poor farmers in Intellectual Property Management in Health and Agricultural
Innovation: A Handbook of Best Practices published by Centre for the Management
of Intellectual Property in Health Research, Public Intellectual Property Resource for
Agriculture, Oswaldo Cruz Foundation, and bio Developments-International Institute,
pp 1829-1832.
Mehta, R. (2005), “Non-Tariff Barriers Affecting India's Exports”, Research and Information
System for Non-aligned and Other Developing Countries, June.
Mehta, Z. and Hasnain, S. (2016), Transgenic basmati rice transformed with the Xa21 gene
shows resistance against bacterial leaf blight. Turkish Journal of Botany, p.40.
Ministry of Agriculture & Farmers Welfare (2015), ‘Agricultural Statistics at a Glance
2014’, Government of India, Ministry of Agriculture & Farmers Welfare, Department
of Agriculture & Co-operation, Directorate of Economics & Statistics. Published in
India by Oxford University Press. Available at
160
http://eands.dacnet.nic.in/PDF/Agricultural-Statistics-At-Glance2014.pdf (accessed
on 7 November, 2016)
Murphy, K. M. and Andrei Shleifer (1997), “Quality and Trade”, Journal of Development
Economics, Volume 53, pp. 1-15
National Centre for Cold-chain Development (NCCD) (2015). All India Cold-chain
Infrastructure Capacity: Assessment of Status & Gap. NCCD and NABCON. Available
at http:// www.nccd.gov.in/PDF/CCSG_Final%20Report_Web.pdf (accessed on 12
April, 2017)
Nielsen, Chantal and Kym Anderson (2001), “GMOs, Trade Policy and Welfare in Rice and
Poor Countries”, in Maskus, K. And J. Wilson edited, “Quantifying the Impact of
Technical Barriers to Trade: Can it be Done?”, University of Michigan Press, 2001.
NITI Aayog (2015), ‘Raising Agricultural Productivity and Making Farming Remunerative
for Farmers’, An Occasional Paper, NITI Aayog, Government of India, December,
2015.
Otsuki, T., Wilson, J.S., Sewadeh, M., (2001), “Saving Two in a Billion: Quantifying the
Trade Effect of European Food Safety Standards on African Exports”, Food Policy,
Volume 26, pp. 495-514.
Pandey, M.K., Rani, N.S., Sundaram, R.M., Laha, G.S., Madhav, M.S., Rao, K.S.,
Sudharshan, I., Hari, Y., Varaprasad, G.S., Rao, L.S. and Suneetha, K. (2013),
Improvement of two traditional Basmati rice varieties for bacterial blight resistance
and plant stature through morphological and marker-assisted selection. Molecular
breeding, 31(1), pp.239-246.
Rahman M.A., Rashid M.A., Salam M.A., Masud M.A.T., Masum A.S.M.H., Hossain
M.M. (2002), Performance of some grafted eggplant genotypes on wild Solanum root
stocks against root-knot nematode. OnLine J. Biol. Sci. 2(7): 446-448
Rangnekar, D. and Kumar, S. (2010), Another look at Basmati: genericity and the problems
of a trans-border geographical indication. The Journal of World Intellectual Property,
13(2), pp.202-230.
Singh, J. (2015), Sustaining rice crop through exploring potentialities of basmati with
reference to Indian Punjab. Indian Journal of Economics and Development, 11(1),
pp.15-19.
Srinivasan, R. (2009), Insect and mite pests on eggplant. AVRDC-World Vegetable Center,
9(729).
Trade Notice No: APEDA/PPP/Q/2015 Dated 12.03.2015. ‘Procedures for Export of Peanuts
and Peanut Products’. Available at

161
http://apeda.gov.in/apedawebsite/HACCP/Procedure-for-exports-of-peanuts-and-
peanut-products2015.pdf (accessed on 3 November, 2016)
USDA (2016), ‘Oilseeds and Products Annual’. GAIN Report Number. IN6047. April.
Available at
http://gain.fas.usda.gov/Recent%20GAIN%20Publications/Oilseeds%20and%20
Products%20Annual_New%20Delhi_India_4-1-2016.pdf
(accessed on 25 October, 2016)
USITC (2010), ‘Mushrooms: Industry and Trade Summary’. Office of Industries. Publication
ITS-07. June. Control No. 2010002
Venugopal, P. (2012), GM Crops Controversy: Stakeholder Analysis of the Case of Bt Brinjal
(Eggplant) in India. David Publishing, 2(8), pp. 852-863

162