sprott asset management lp - · pdf filemanagement is responsible for the preparation and fair...
TRANSCRIPT

Ninepoint Partners
LP Sprott Corporate Class Inc.
SPROTT RESOURCE CLASS
SPROTT DIVERSIFIED BOND CLASS
SPROTT SHORT-TERM BOND CLASS
SPROTT SILVER EQUITIES CLASS
SPROTT ENHANCED EQUITY CLASS
SPROTT ENHANCED BALANCED CLASS
SPROTT REAL ASSET CLASS
SPROTT ENHANCED U.S. EQUITY CLASS
SPROTT FOCUSED GLOBAL DIVIDEND CLASS
SPROTT FOCUSED U.S. DIVIDEND CLASS
Annual Financial Statements
December 31
2017

2
Contents
5 Sprott Resource Class
17 Sprott Diversified Bond Class
26 Sprott Short-Term Bond Class
33 Sprott Silver Equities Class
43 Sprott Enhanced Equity Class
55 Sprott Enhanced Balanced Class
65 Sprott Real Asset Class
74 Sprott Enhanced U.S. Equity Class
85 Sprott Focused Global Dividend Class
96 Sprott Focused U.S. Dividend Class
105 Notes to Financial Statements
KPMG LLP
Bay Adelaide Centre
333 Bay Street, Suite 4600
Toronto, ON M5H 2S5
Canada
Tel 416-777-8500
Fax 416-777-8818
KPMG LLP is a Canadian limited liability partnership and a member firm of the KPMG network of independent member firms affiliated with KPMG International Cooperative (“KPMG International”), a Swiss entity.
KPMG Canada provides services to KPMG LLP.
3
INDEPENDENT AUDITORS' REPORT
To the Shareholders of
Sprott Resource Class
Sprott Diversified Bond Class
Sprott Short-Term Bond Class
Sprott Silver Equities Class
Sprott Enhanced Equity Class
Sprott Enhanced Balanced Class
Sprott Real Asset Class
Sprott Enhanced U.S. Equity Class
Sprott Focused Global Dividend Class
Sprott Focused U.S. Dividend Class
(Collectively, the “Funds”)
We have audited the accompanying financial statements of the Funds which comprise the statements of financial
position as at December 31, 2017 and 2016, the statements of comprehensive income (loss), changes in net assets
attributable to holders of redeemable shares and cash flows for the years then ended, and notes, comprising a
summary of significant accounting policies and other explanatory information.
Management's Responsibility for the Financial Statements
Management is responsible for the preparation and fair presentation of these financial statements in accordance with
International Financial Reporting Standards, and for such internal control as management determines is necessary to
enable the preparation of financial statements that are free from material misstatement, whether due to fraud or error.
Auditors' Responsibility
Our responsibility is to express an opinion on these financial statements based on our audits. We conducted our
audits in accordance with Canadian generally accepted auditing standards. Those standards require that we comply
with ethical requirements and plan and perform the audit to obtain reasonable assurance about whether the financial
statements are free from material misstatement.
An audit involves performing procedures to obtain audit evidence about the amounts and disclosures in the financial
statements. The procedures selected depend on our judgment, including the assessment of the risks of material
misstatement of the financial statements, whether due to fraud or error. In making those risk assessments, we
consider internal control relevant to the entity's preparation and fair presentation of the financial statements in order
to design audit procedures that are appropriate in the circumstances, but not for the purpose of expressing an opinion
on the effectiveness of the entity's internal control. An audit also includes evaluating the appropriateness of
accounting policies used and the reasonableness of accounting estimates made by management, as well as evaluating
the overall presentation of the financial statements.

4
We believe that the audit evidence we have obtained in our audits is sufficient and appropriate to provide a basis for
our audit opinion.
Opinion
In our opinion, the financial statements present fairly, in all material respects, the financial positions of the Funds as
at December 31, 2017 and 2016, and their financial performance and cash flows for the years then ended in
accordance with International Financial Reporting Standards.
Chartered Professional Accountants, Licensed Public Accountants
March 16, 2018
Toronto, Canada

5
Sprott Resource Class
Statements of Financial Position
(in Canadian Dollars)
As at December 31 2017 2016
$ $
Assets
Current assets
Investments (excluding derivatives) (note 3, 5) 41,102,381 35,041,103
Cash 2,940,920 3,375,778
Subscriptions receivable 125,966 109,900
Dividends receivable 8,050 8,410
Total assets 44,177,317 38,535,191
Liabilities
Current liabilities
Due to broker 754,875 -
Redemptions payable 4,319 217,650
Accrued expenses 25,670 13,074
Incentive fees payable (note 12) 1,416,133 75,738
Total liabilities 2,200,997 306,462
Net Assets attributable to holders of redeemable shares 41,976,320 38,228,729
Net Assets attributable to holders of redeemable shares per series
Series A 36,138,189 27,528,426
Series F 5,838,131 10,700,303
Net Assets attributable to holders of redeemable shares per series per share (note 8)
Series A 10.67 8.61
Series F 11.16 9.07
See accompanying notes which are an integral part of these financial statements
On behalf of the Manager, Ninepoint Partners LP,
by the Board of Directors of Sprott Corporate Class Inc.
James Fox Stuart J. Freeman
DIRECTOR DIRECTOR

6
Sprott Resource Class
Statements of Comprehensive Income (Loss)
(in Canadian Dollars, except share amounts)
For the years ended December 31 2017 2016
$ $
Income
Net gain (loss) on investments and derivatives:(1)
Interest income for distribution purposes (note 3) 898 1,039
Dividends (note 3) 120,936 104,242
Net realized gains on sales of investments 5,539,553 6,959,368
Net realized gains on option contracts 2,846 -
Change in unrealized appreciation in the value of investments 4,641,757 5,057,765
Change in unrealized depreciation on option contracts (21,681) -
Net realized gains (losses) on foreign exchange 11,827 (9,718)
Other income 42 -
Total income 10,296,178 12,112,696
Expenses (note 12, 13)
Incentive fees (note 12) 1,416,133 75,738
Management fees 1,100,015 616,104
Transaction costs (note 3, 14) 683,573 721,975
Unitholder reporting costs 104,677 58,499
Administrative fees 29,897 23,059
Audit fees 21,274 13,797
Filing fees 11,070 22,602
Custodial fees 11,038 7,589
Directors' fees 6,790 4,324
Independent Review Committee fees (note 15) 5,087 4,690
Legal fees 5,083 9,998
Withholding taxes 1,324 1,776
Total expenses 3,395,961 1,560,151
Expenses waived/absorbed by the Manager (note 13) - (99,156)
Net expenses 3,395,961 1,460,995
Increase in Net Assets attributable to holders of redeemable shares from operations 6,900,217 10,651,701
Increase in Net Assets attributable to holders of redeemable shares from operation per series
Series A 6,532,008 10,242,209
Series F 368,209 409,492
Weighted average number of redeemable shares
Series A 4,031,007 2,848,062
Series F 820,914 308,995
Increase in Net Assets attributable to holders of redeemable shares from operations per series per share (note 3)
Series A 1.62 3.60
Series F 0.45 1.33
(1)Net gain (loss) on investments and derivatives comprised of:
Financial assets and liabilities designated at fair value through profit or loss ("FVTPL") 9,376,274 12,122,414
Financial assets and liabilities classified as held for trading ("HFT") 908,035 -
10,284,309 12,122,414
See accompanying notes which are an integral part of these financial statements

7
Sprott Resource Class
Statements of Changes in Net Assets Attributable to Holders of Redeemable Shares
(in Canadian Dollars, except share amounts)
For the years ended December 31 2017 2016
$ $
Net Assets attributable to holders of redeemable shares, beginning of year
Series A 27,528,426 9,209,689
Series F 10,700,303 220,684
38,228,729 9,430,373
Increase in Net Assets attributable to holders of redeemable shares from operations
Series A 6,532,008 10,242,209
Series F 368,209 409,492
6,900,217 10,651,701
Distributions to holders of redeemable shares
From net investment income
Series A (95,273) (80,511)
Series F (15,255) (31,345)
(110,528) (111,856)
Redeemable share transactions (note 8)
Proceeds from redeemable shares issued
Series A 40,126,743 30,535,216
Series F 8,030,663 11,014,391
Reinvestments of distributions to holders of redeemable shares
Series A 94,353 80,099
Series F 13,127 5,577
Redemption of redeemable shares
Series A (38,048,068) (22,458,276)
Series F (13,258,916) (918,496)
(3,042,098) 18,258,511
Net increase (decrease) in Net Assets attributable to holders of redeemable shares
Series A 8,609,763 18,318,737
Series F (4,862,172) 10,479,619
3,747,591 28,798,356
Net Assets attributable to holders of redeemable shares, end of year
Series A 36,138,189 27,528,426
Series F 5,838,131 10,700,303
41,976,320 38,228,729

8
Sprott Resource Class
Statements of Changes in Net Assets Attributable to Holders of Redeemable Shares continued
Changes in outstanding redeemable shares of the Fund for the years ended December 31, 2017 and 2016 were as follows:
2017 2016
Series A Series F Series A Series F
Shares, beginning of year 3,198,234 1,179,779 2,010,016 46,069
Subscriptions 4,428,601 861,109 4,147,090 1,241,352
Reinvested distributions 9,001 1,196 9,269 613
Redemptions (4,249,636) (1,519,133) (2,968,141) (108,255)
Shares, end of year 3,386,200 522,951 3,198,234 1,179,779
See accompanying notes which are an integral part of these financial statements

9
Sprott Resource Class
Statements of Cash Flows
(in Canadian Dollars)
For the years ended December 31 2017 2016
$ $
Cash flows from operating activities
Increase (decrease) in net assets attributable to holders of redeemable shares from operations 6,900,217 10,651,701
Adjustments for:
Foreign exchange (gains) on cash - (6)
Net realized (gains) on sales of investments (5,539,553) (6,959,368)
Net realized (gains) on options contracts (2,846) -
Change in unrealized (appreciation) in the value of investments (4,641,757) (5,057,765)
Change in unrealized depreciation on options contracts 21,681 -
Purchases of investments (68,609,234) (102,791,611)
Proceeds from sales of investments 111,378,920 117,083,896
Net increase (decrease) in other assets and liabilities 1,353,351 148,057
Net cash provided by operating activities 40,860,779 13,074,904
Cash flows from financing activities
Distributions paid to holders of redeemable shares, net of reinvested distributions (3,048) (26,180)
Proceeds from redeemable shares issued 8,232,242 13,185,993
Redemption of redeemable shares (49,524,831) (23,187,271)
Net cash used in financing activities (41,295,637) (10,027,458)
Foreign exchange gains on cash - 6
Net increase (decrease) in cash (434,858) 3,047,446
Cash at beginning of year 3,375,778 328,326
Cash at end of year 2,940,920 3,375,778
Supplemental Information
Interest received 898 1,039
Dividends received, net of withholding taxes 119,972 107,196
See accompanying notes which are an integral part of these financial statements
10
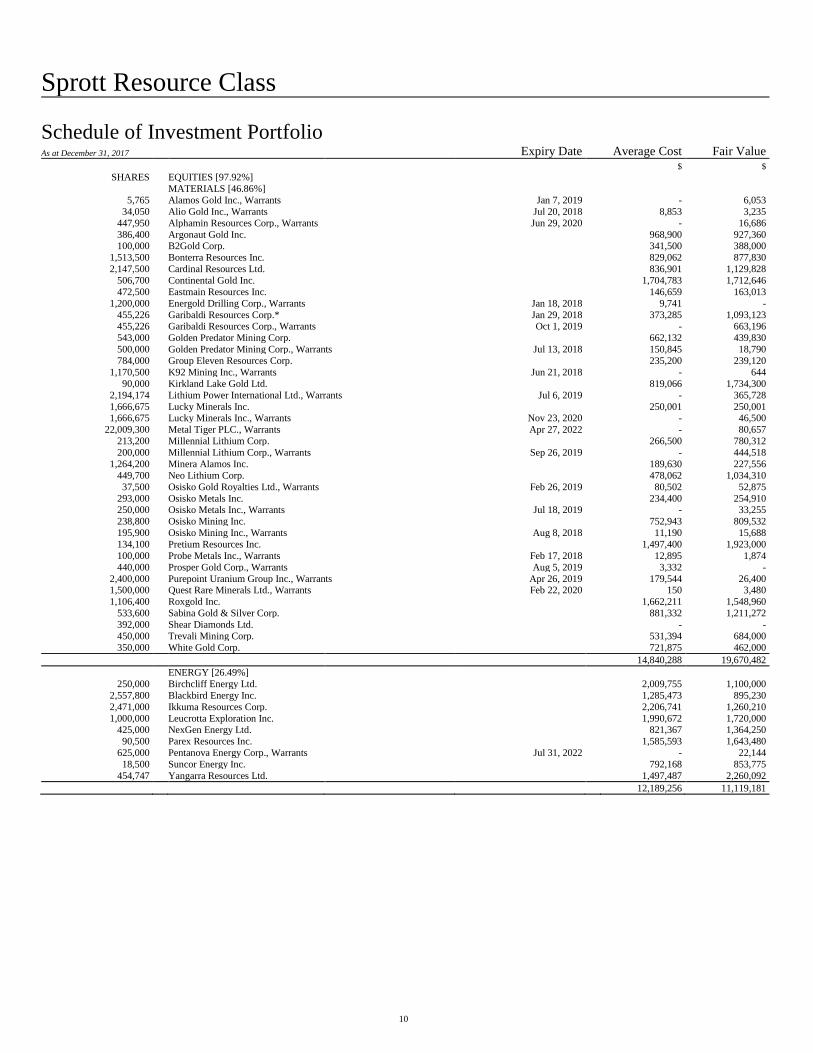
Sprott Resource Class
Schedule of Investment Portfolio As at December 31, 2017 Expiry Date Average Cost Fair Value
$ $
SHARES EQUITIES [97.92%]
MATERIALS [46.86%]
5,765 Alamos Gold Inc., Warrants Jan 7, 2019 - 6,053
34,050 Alio Gold Inc., Warrants Jul 20, 2018 8,853 3,235
447,950 Alphamin Resources Corp., Warrants Jun 29, 2020 - 16,686
386,400 Argonaut Gold Inc. 968,900 927,360 100,000 B2Gold Corp. 341,500 388,000
1,513,500 Bonterra Resources Inc. 829,062 877,830
2,147,500 Cardinal Resources Ltd. 836,901 1,129,828
506,700 Continental Gold Inc. 1,704,783 1,712,646
472,500 Eastmain Resources Inc. 146,659 163,013
1,200,000 Energold Drilling Corp., Warrants Jan 18, 2018 9,741 -
455,226 Garibaldi Resources Corp.* Jan 29, 2018 373,285 1,093,123 455,226 Garibaldi Resources Corp., Warrants Oct 1, 2019 - 663,196
543,000 Golden Predator Mining Corp. 662,132 439,830
500,000 Golden Predator Mining Corp., Warrants Jul 13, 2018 150,845 18,790
784,000 Group Eleven Resources Corp. 235,200 239,120
1,170,500 K92 Mining Inc., Warrants Jun 21, 2018 - 644
90,000 Kirkland Lake Gold Ltd. 819,066 1,734,300
2,194,174 Lithium Power International Ltd., Warrants Jul 6, 2019 - 365,728
1,666,675 Lucky Minerals Inc. 250,001 250,001 1,666,675 Lucky Minerals Inc., Warrants Nov 23, 2020 - 46,500
22,009,300 Metal Tiger PLC., Warrants Apr 27, 2022 - 80,657
213,200 Millennial Lithium Corp. 266,500 780,312
200,000 Millennial Lithium Corp., Warrants Sep 26, 2019 - 444,518
1,264,200 Minera Alamos Inc. 189,630 227,556
449,700 Neo Lithium Corp. 478,062 1,034,310
37,500 Osisko Gold Royalties Ltd., Warrants Feb 26, 2019 80,502 52,875
293,000 Osisko Metals Inc. 234,400 254,910 250,000 Osisko Metals Inc., Warrants Jul 18, 2019 - 33,255
238,800 Osisko Mining Inc. 752,943 809,532
195,900 Osisko Mining Inc., Warrants Aug 8, 2018 11,190 15,688
134,100 Pretium Resources Inc. 1,497,400 1,923,000
100,000 Probe Metals Inc., Warrants Feb 17, 2018 12,895 1,874
440,000 Prosper Gold Corp., Warrants Aug 5, 2019 3,332 -
2,400,000 Purepoint Uranium Group Inc., Warrants Apr 26, 2019 179,544 26,400 1,500,000 Quest Rare Minerals Ltd., Warrants Feb 22, 2020 150 3,480
1,106,400 Roxgold Inc. 1,662,211 1,548,960
533,600 Sabina Gold & Silver Corp. 881,332 1,211,272
392,000 Shear Diamonds Ltd. - -
450,000 Trevali Mining Corp. 531,394 684,000
350,000 White Gold Corp. 721,875 462,000
14,840,288 19,670,482
ENERGY [26.49%]
250,000 Birchcliff Energy Ltd. 2,009,755 1,100,000
2,557,800 Blackbird Energy Inc. 1,285,473 895,230
2,471,000 Ikkuma Resources Corp. 2,206,741 1,260,210
1,000,000 Leucrotta Exploration Inc. 1,990,672 1,720,000 425,000 NexGen Energy Ltd. 821,367 1,364,250
90,500 Parex Resources Inc. 1,585,593 1,643,480
625,000 Pentanova Energy Corp., Warrants Jul 31, 2022 - 22,144
18,500 Suncor Energy Inc. 792,168 853,775
454,747 Yangarra Resources Ltd. 1,497,487 2,260,092
12,189,256 11,119,181
11
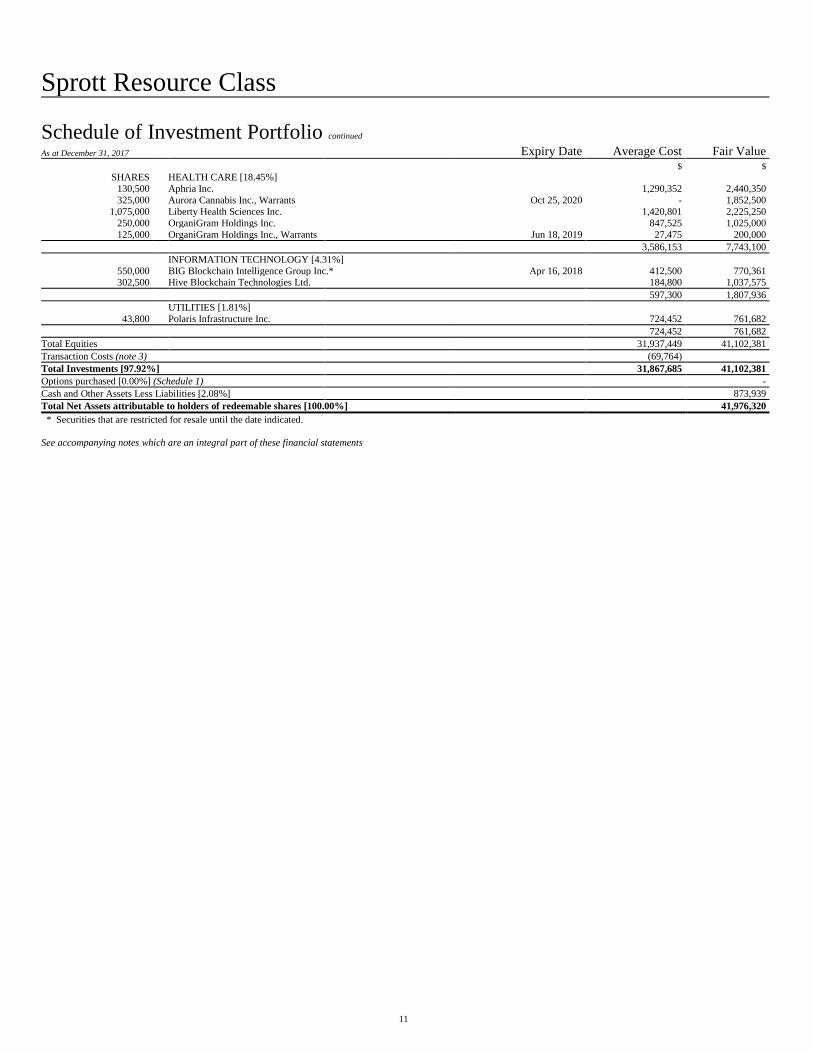
Sprott Resource Class
Schedule of Investment Portfolio continued As at December 31, 2017 Expiry Date Average Cost Fair Value
$ $
SHARES HEALTH CARE [18.45%]
130,500 Aphria Inc. 1,290,352 2,440,350
325,000 Aurora Cannabis Inc., Warrants Oct 25, 2020 - 1,852,500
1,075,000 Liberty Health Sciences Inc. 1,420,801 2,225,250
250,000 OrganiGram Holdings Inc. 847,525 1,025,000
125,000 OrganiGram Holdings Inc., Warrants Jun 18, 2019 27,475 200,000
3,586,153 7,743,100
INFORMATION TECHNOLOGY [4.31%]
550,000 BIG Blockchain Intelligence Group Inc.* Apr 16, 2018 412,500 770,361 302,500 Hive Blockchain Technologies Ltd. 184,800 1,037,575
597,300 1,807,936
UTILITIES [1.81%]
43,800 Polaris Infrastructure Inc. 724,452 761,682
724,452 761,682
Total Equities 31,937,449 41,102,381
Transaction Costs (note 3) (69,764)
Total Investments [97.92%] 31,867,685 41,102,381
Options purchased [0.00%] (Schedule 1) -
Cash and Other Assets Less Liabilities [2.08%] 873,939
Total Net Assets attributable to holders of redeemable shares [100.00%] 41,976,320
* Securities that are restricted for resale until the date indicated.
See accompanying notes which are an integral part of these financial statements

12
Sprott Resource Class
Option Contracts (Schedule 1)
As at December 31, 2017
Options Purchased
Premium Fair
Number of Expiration Strike Paid Value
Option Details Option Type Contracts Date Price ($) $(CAD) $(CAD)
New Gold Inc. Call 816 19-Jan-18 8.00 CAD 20,865 -
20,865 -
See accompanying notes which are an integral part of these financial statements

Sprott Resource Class
Notes to financial statements – Fund specific information December 31, 2017
13
Financial Risk Management (note 6)
Investment Objective The investment objective of the Fund is to seek to achieve long-term capital growth. The Fund invests primarily in equity and equity-related
securities of companies in Canada and around the world that are involved directly or indirectly in the natural resource sector.
The Schedule of Investment Portfolio represents the securities held by the Fund as at December 31, 2017. Significant risks that are relevant to
the Fund are discussed here. General information on risk management is described in Note 6.
Market Risk
a) Other Price Risk
As at December 31, 2017 and 2016, if the S&P/TSX Capped Materials Total Return Index and S&P/TSX Capped Energy Total Return Index
were to fluctuate by 10%, with all other variables held constant, Net Assets attributable to holders of redeemable shares would increase or
decrease by the amounts shown in the table below. This is a measure based on the historical relationship of the Fund’s performance against the
index noted above. The composition of this calculation contains several subjective components that, although reasonably estimated, could alter
the resulting calculation should these components be modified based on revised assumptions.
December 31, 2017 December 31, 2016
Impact
($’000)
As a % of Net Assets
attributable to holders
of redeemable shares
Impact
($’000)
As a % of Net Assets
attributable to holders
of redeemable shares
4,533 10.80% 4,167 10.90%
b) Currency Risk
The tables below summarize the Fund’s exposure to currency risk as at December 31, 2017 and 2016. The tables also illustrate the potential
impact to the Fund’s Net Assets attributable to holders of redeemable units as a result of 1% changes in these currencies relative to the
Canadian dollar, with all other variables held constant.
December 31, 2017
Currency Fair Value ($’000)
% of Net Assets
attributable to holders
of redeemable shares
Impact on Net Assets
attributable to holders
of redeemable shares
($’000)
Australian Dollar 1,115 2.66 11
Pound Sterling 81 0.19 1
1,196 2.85 12
December 31, 2016
Currency Fair Value ($’000)
% of Net Assets
attributable to holders
of redeemable shares
Impact on Net Assets
attributable to holders
of redeemable shares
($’000)
U.S. Dollar 2,513 6.57 25
c) Interest Rate Risk
As at December 31, 2017 and 2016, the Fund did not have a significant exposure to interest rate risk.

Sprott Resource Class
Notes to financial statements – Fund specific information December 31, 2017
14
Credit Risk As at December 31, 2017 and 2016, the Fund did not have a significant exposure to credit risk.
Concentration Risk The table below summarizes the Fund’s concentration risk as a percentage of Net Assets attributable to holders of redeemable shares as at
December 31, 2017 and 2016.
December 31, 2017 December 31, 2016
Equities – Long:
Materials 46.86% 28.15%
Energy 26.49% 57.92%
Health Care 18.45% 0.67%
Information Technology 4.31% –
Utilities 1.81% 3.48%
Other – 1.44%
Options purchased – –
Cash and Other Assets Less Liabilities 2.08% 8.34%
Total Net Assets attributable to holders of redeemable shares 100.00% 100.00%
Fair Value Measurements (note 5)
The Fund’s assets and liabilities measured at fair value have been categorized based upon the fair value hierarchy in the tables below as at
December 31, 2017 and 2016:
December 31, 2017
Level 1 Level 2 Level 3 Total $ $ $ $
Equities – Long 35,384,674 1,863,484 – 37,248,158
Warrants 2,480,391 1,373,832 – 3,854,223
37,865,065 3,237,316 – 41,102,381
December 31, 2016
Level 1 Level 2 Level 3 Total $ $ $ $
Equities – Long 33,200,466 1,572,478 – 34,772,944
Warrants 265,807 2,352 – 268,159
33,466,273 1,574,830 – 35,041,103
During the years ended December 31, 2017 and 2016, there were no significant transfers between levels other than the transfers indicated
below.

Sprott Resource Class
Notes to financial statements – Fund specific information December 31, 2017
15
The reconciliation of investments measured at fair value using unobservable inputs (Level 3) for the years ended December 31, 2017 and 2016,
is presented as follows:
December 31, 2017 December 31, 2016
Equities Equities
$ $
Balance at beginning of year – –
Purchases 2,329,900 113,645
Sales (1,423,675) –
Net transfers out (333,600) (526,014)
Realized losses (656,025)
Change in unrealized gains 83,400 412,369
Balance at end of year – –
Change in unrealized gains during the year for investments held at end of year – –
The Fund’s Level 3 securities consist of private equity positions. The Manager determines their fair value by utilizing a variety of valuation
techniques such as the use of comparable recent transactions, discounted cash flows and other techniques used by market participants. As at
December 31, 2017 and 2016, these positions were not significant to the Fund and any changes in reasonable possible assumptions used in their
valuation would not have a significant impact to the Net Assets attributable to holders of redeemable units of the Fund.
Related Party Holdings Ninepoint Financial Group, the parent company of the Fund manager, and Sprott Inc., the parent company of the previous Fund manager, and
their respective subsidiaries, held the following investments in the Fund as at December 31, 2017 and 2016, respectively:
December 31, 2017 December 31, 2016 Units held
Class A 122 –
Value of units held ($) 1,305 –
Management Fees (note 12)
This fee differs among the series of shares of the Fund as set out in the chart below:
Series A Series F Series I*
Up to 2.50% Up to 1.50% Negotiated by the
Shareholder
* The management fee for Series I shares of the Fund is negotiated by the investor and paid directly by the investor or by the Fund, and would not exceed the
management fee for Series A shares of the Fund.
Flow-Through LP Mergers During the years ended December 31, 2017 and 2016, the Fund acquired all the assets of the flow-through partnerships listed below, and in
exchange, the Fund issued shares to such partnerships. In turn, the shares were distributed to the limited partners of the partnerships. The
Manager was the investment advisor to the limited partnerships. The General Partners of the limited partnerships were under common control
of the Manager. Tax elections were made which allowed the transfer of assets to occur on a tax-deferred basis.
Merger Date Flow-Through Partnerships
Number of shares issued by
the Fund
Fair Value of Assets Acquired
by the Fund
February 24, 2016 Sprott 2014 Flow-Through LP 1,606,050 $8,469,826
September 30, 2016 Sprott 2014-II Flow-Through LP 2,243,744 $19,783,988
January 24, 2017 Sprott 2015 Flow-Through LP 2,231,223 $20,184,313
January 24, 2017 Sprott 2016 Short Duration Flow-Through LP 1,959,840 $17,729,301

Sprott Resource Class
Notes to financial statements – Fund specific information December 31, 2017
16
Sharing Arrangements (note 14) The Fund paid $5,888 out of the total transaction costs incurred to certain brokers for research expenses provided to the portfolio manager
during the year ended December 31, 2017 (2016 - $6,057).
See accompanying generic notes which are an integral part of these financial statements

17
Sprott Diversified Bond Class
Statements of Financial Position (in Canadian Dollars)
As at December 31 2017 2016
$ $
Assets
Current assets
Investments (note 3, 5) 87,952,284 62,856,184
Subscriptions receivable 14,978 1,321,572
Other assets 6,083 -
Total assets 87,973,345 64,177,756
Liabilities
Current liabilities
Bank indebtedness 268,681 103,088
Due to broker 45,154 1,231,205
Redemptions payable 24,402 26,312
Accrued expenses - 24,965
Total liabilities 338,237 1,385,570
Net Assets attributable to holders of redeemable shares 87,635,108 62,792,186
Net Assets attributable to holders of redeemable shares per series
Series A 16,158,334 13,572,523
Series F 42,321,787 32,229,738
Series FT 9,945,123 6,139,303
Series P 93,653 -
Series T 3,805,841 4,115,981
Series PF 15,301,149 6,734,641
Series PFT - -
Series QF 9,221 -
Net Assets attributable to holders of redeemable shares per series per share (note 8)
Series A 13.23 12.70
Series F 13.74 13.05
Series FT 9.53 9.62
Series P 10.10 -
Series T 9.02 9.18
Series PF 11.26 10.69
Series PFT - -
Series QF 10.38 -
See accompanying notes which are an integral part of these financial statements
On behalf of the Manager, Ninepoint Partners LP,
by the Board of Directors of Sprott Corporate Class Inc.
James Fox Stuart J. Freeman
DIRECTOR DIRECTOR

18
Sprott Diversified Bond Class
Statements of Comprehensive Income (Loss) (in Canadian Dollars, except share amounts)
For the years ended December 31 2017 2016 $ $
Income Net gain (loss) on investments:(1)
Distribution income (note 3) 3,616,369 2,035,990
Net realized gains on sales of investments 385,248 35,146
Change in unrealized appreciation in the value of investments 586,881 1,831,548
Other income 2,774 224
Total income 4,591,272 3,902,908
Expenses (note 12, 13)
Management fees 830,395 629,684
Unitholder reporting costs 89,925 64,040
Filing fees 53,347 37,055 Administrative fees 26,340 34,566
Legal fees 7,040 13,634
Directors' fees 6,125 4,324
Independent Review Committee fees (note 15) 4,895 4,690
Audit fees 4,582 4,177
Custodial fees 2,193 2,825
Total expenses 1,024,842 794,995
Expenses waived/absorbed by the Manager (note 13) (110,905) (114,576)
Net expenses 913,937 680,419
Increase in Net Assets attributable to holders of redeemable shares from operations 3,677,335 3,222,489
Increase in Net Assets attributable to holders of redeemable shares from operation per series Series A 597,791 642,434
Series F 1,821,676 1,695,763
Series FT 504,081 359,053
Series P 964 -
Series T 169,475 222,315
Series PF 374,961 302,924
Series PFT 27 - Series QF 208,360 -
Weighted average number of redeemable shares
Series A 1,169,162 1,049,148 Series F 2,738,298 2,195,519
Series FT 1,075,874 605,940
Series P 8,494 -
Series T 436,516 503,692
Series PF 828,165 444,614
Series PFT 5,879 -
Series QF 441,964 -
Increase in Net Assets attributable to holders of redeemable shares from operation per series per share (note 3)
Series A 0.51 0.61
Series F 0.67 0.77
Series FT 0.47 0.59 Series P 0.11 -
Series T 0.39 0.44
Series PF 0.45 0.68
Series PFT - -
Series QF 0.47 -
(1)Net gain (loss) on investments comprised of:
Financial assets and liabilities designated at FVTPL 4,588,498 3,902,684
Financial assets and liabilities classified as HFT - -
4,588,498 3,902,684
See accompanying notes which are an integral part of these financial statements

19
Sprott Diversified Bond Class
Statements of Changes in Net Assets Attributable to Holders of Redeemable Shares
(in Canadian Dollars, except share amounts)
For the years ended December 31 2017 2016
$ $
Net Assets attributable to holders of redeemable shares, beginning of year
Series A 13,572,523 12,399,277
Series F 32,229,738 20,901,807
Series FT 6,139,303 5,910,095
Series P - -
Series T 4,115,981 5,281,997
Series PF 6,734,641 -
Series PFT - -
Series QF - -
62,792,186 44,493,176
Increase in Net Assets attributable to holders of redeemable shares from operations
Series A 597,791 642,434
Series F 1,821,676 1,695,763
Series FT 504,081 359,053
Series P 964 -
Series T 169,475 222,315
Series PF 374,961 302,924
Series PFT 27 -
Series QF 208,360 -
3,677,335 3,222,489
Distributions to holders of redeemable shares
From return of capital
Series A - -
Series F - -
Series FT (630,124) (350,410)
Series P - -
Series T (240,570) (277,530)
Series PF - -
Series PFT - -
Series QF - -
(870,694) (627,940)

20
Sprott Diversified Bond Class
Statements of Changes in Net Assets Attributable to Holders of Redeemable Shares
continued
(in Canadian Dollars, except share amounts)
For the years ended December 31 2017 2016
$ $
Redeemable share transactions (note 8)
Proceeds from redeemable shares issued
Series A 7,687,367 4,692,886
Series F 23,882,336 16,904,674
Series FT 8,723,895 3,189,238
Series P 92,689 -
Series T 310,266 127,075
Series PF 13,090,977 6,652,199
Series PFT 58,787 -
Series QF 5,793,841 -
Reinvestments of distributions to holders of redeemable shares
Series A - -
Series F - 98
Series FT - -
Series P - -
Series T - 10
Series PF - -
Series PFT - -
Series QF - -
Redemption of redeemable shares
Series A (5,699,347) (4,162,074)
Series F (15,611,963) (7,272,604)
Series FT (4,792,032) (2,968,673)
Series P - -
Series T (549,311) (1,237,886)
Series PF (4,899,430) (220,482)
Series PFT (58,814) -
Series QF (5,992,980) -
22,036,281 15,704,461
Net increase (decrease) in Net Assets attributable to holders of redeemable shares
Series A 2,585,811 1,173,246
Series F 10,092,049 11,327,931
Series FT 3,805,820 229,208
Series P 93,653 -
Series T (310,140) (1,166,016)
Series PF 8,566,508 6,734,641
Series PFT - -
Series QF 9,221 -
24,842,922 18,299,010
Net Assets attributable to holders of redeemable shares, end of year
Series A 16,158,334 13,572,523
Series F 42,321,787 32,229,738
Series FT 9,945,123 6,139,303
Series P 93,653 -
Series T 3,805,841 4,115,981
Series PF 15,301,149 6,734,641
Series PFT - -
Series QF 9,221 -
87,635,108 62,792,186

21
Sprott Diversified Bond Class
Statements of Changes in Net Assets Attributable to Holders of Redeemable Shares continued
Changes in outstanding redeemable shares of the Fund for the years ended December 31, 2017 and 2016 were as follows:
2017 2016
Series A Series F Series FT Series P Series T Series PF Series PFT Series QF Series A Series F Series FT Series T Series PF
Shares, beginning of year 1,069,023 2,469,373 638,479 - 448,185 630,079 - - 1,026,131 1,699,009 613,988 568,651 -
Subscriptions 589,149 1,769,899 901,457 9,272 33,888 1,178,473 5,879 578,827 380,926 1,346,563 331,727 13,859 651,353
Reinvested distributions - - - - - - - - - - 10 1 -
Redemptions (436,987) (1,158,603) (496,672) - (60,009) (450,054) (5,879) (577,939) (338,034) (576,199) (307,246) (134,326) (21,274)
Shares, end of year 1,221,185 3,080,669 1,043,264 9,272 422,064 1,358,498 - 888 1,069,023 2,469,373 638,479 448,185 630,079
See accompanying notes which are an integral part of these financial statements

22
Sprott Diversified Bond Class
Statements of Cash Flows
(in Canadian Dollars)
For the years ended December 31 2017 2016
$ $
Cash flows from operating activities
Increase in Net Assets attributable to holders of redeemable shares from operations 3,677,335 3,222,489
Adjustments for:
Distribution income (3,616,369) (2,035,990)
Net realized (gains) on sales of investments (385,248) (35,146)
Change in unrealized (appreciation) in the value of investments (586,881) (1,831,548)
Purchases of investments (36,307,083) (20,588,302)
Proceeds from sales of investments 14,613,430 7,391,206
Net increase (decrease) in other assets and liabilities (31,048) 92,810
Net cash used in operating activities (22,635,864) (13,784,481)
Cash flows from financing activities
Distributions paid to holders of redeemable shares, net of reinvested distributions (870,694) (627,832)
Proceeds from redeemable shares issued 55,008,095 30,271,345
Redemption of redeemable shares (31,667,130) (15,854,889)
Net cash provided by financing activities 22,470,271 13,788,624
Net increase (decrease) in cash (165,593) 4,143
Bank indebtedness at beginning of year (103,088) (107,231)
Bank indebtedness at end of year (268,681) (103,088)
See accompanying notes which are an integral part of these financial statements

23
Sprott Diversified Bond Class
Schedule of Investment Portfolio As at December 31, 2017 Average Cost Fair Value
$ $
UNITS MUTUAL FUNDS [100.36%]
8,038,706 Sprott Diversified Bond Fund, Series I 86,277,946 87,952,284
Total Investments [100.36%] 86,277,946 87,952,284
Cash and Other Assets Less Liabilities [-0.36%] (317,176)
Total Net Assets attributable to holders of redeemable shares [100.00%] 87,635,108
See accompanying notes which are an integral part of these financial statements

Sprott Diversified Bond Class
Notes to financial statements – Fund specific information December 31, 2017
24
Financial Risk Management (note 6)
Investment Objective The Fund aims to provide income and maximize the total return of the Fund. It seeks a similar return to its underlying fund, Sprott Diversified
Bond Fund, by investing substantially all of its assets in securities of that fund. The underlying fund invests primarily in debt and debt-like
securities of corporate and government issuers from around the world.
The Schedule of Investment Portfolio represents the securities held by the Fund as at December 31, 2017. Significant risks that are relevant to
the Fund are discussed here. As the Fund invests in underlying funds, it may be indirectly exposed to other price risk, currency risk, interest rate
risk, credit risk and concentration risk from these holdings. As at December 31, 2017, 100.36% (2016 - 100.10%) of the Fund’s Net Assets
attributable to holders of redeemable shares were invested in mutual fund units. Only direct exposure to significant risks that are relevant to the
Fund are discussed here. For more information regarding the risks of the underlying funds, refer to each underlying fund’s financial statements.
General information on risk management is described in Note 6.
Concentration Risk The table below summarizes the Fund’s concentration risk as a percentage of Net Assets attributable to holders of redeemable shares as at
December 31, 2017 and 2016.
December 31, 2017 December 31, 2016
Mutual Funds 100.36% 100.10%
Cash and Other Assets Less Liabilities (0.36%) (0.10%)
Total Net Assets attributable to holders of redeemable shares 100.00% 100.00%
Fair Value Measurements (note 5)
The Fund’s assets and liabilities measured at fair value have been categorized based upon the fair value hierarchy in the tables below as at
December 31, 2017 and 2016:
December 31, 2017
Level 1 Level 2 Level 3 Total
$ $ $ $
Mutual Funds 87,952,284 – – 87,952,284
December 31, 2016
Level 1 Level 2 Level 3 Total $ $ $ $
Mutual Funds 62,856,184 – – 62,856,184
During the years ended December 31, 2017 and 2016, there were no significant transfers between levels.
Investments in Underlying Funds The Fund invests in redeemable units or shares of an investment fund managed by Ninepoint Partners LP (the “Underlying Fund”) to gain
exposure to the investment objective and strategies of the Underlying Fund.
The Underlying Fund invests in a portfolio of assets to generate returns in the form of investment income and capital appreciation for its
unitholders. The Underlying Fund finances its operations primarily through the issuance of redeemable units, which are puttable at the
unitholder’s option and entitle the unitholder to a proportionate share of the Underlying Fund’s net assets. The Fund’s interest in the Underlying
Fund, held in the form of redeemable units, is reported in its Schedule of Investment Portfolio at fair value, which represents the Fund’s
maximum exposure to this investment. Distributions earned from the Underlying Fund are included in “Distribution income” in the Statements
of Comprehensive Income. The total realized gains and change in unrealized gains arising from the Underlying Fund included in the Statements
of Comprehensive Income for the year ended December 31, 2017 are $385,248 and $586,881, respectively (2016 – realized gains of $35,146
and unrealized gains of $1,831,548). The Fund does not provide any additional significant financial or other support to the Underlying Fund.
The tables below set out the interest held by the Fund in the Underlying Fund:
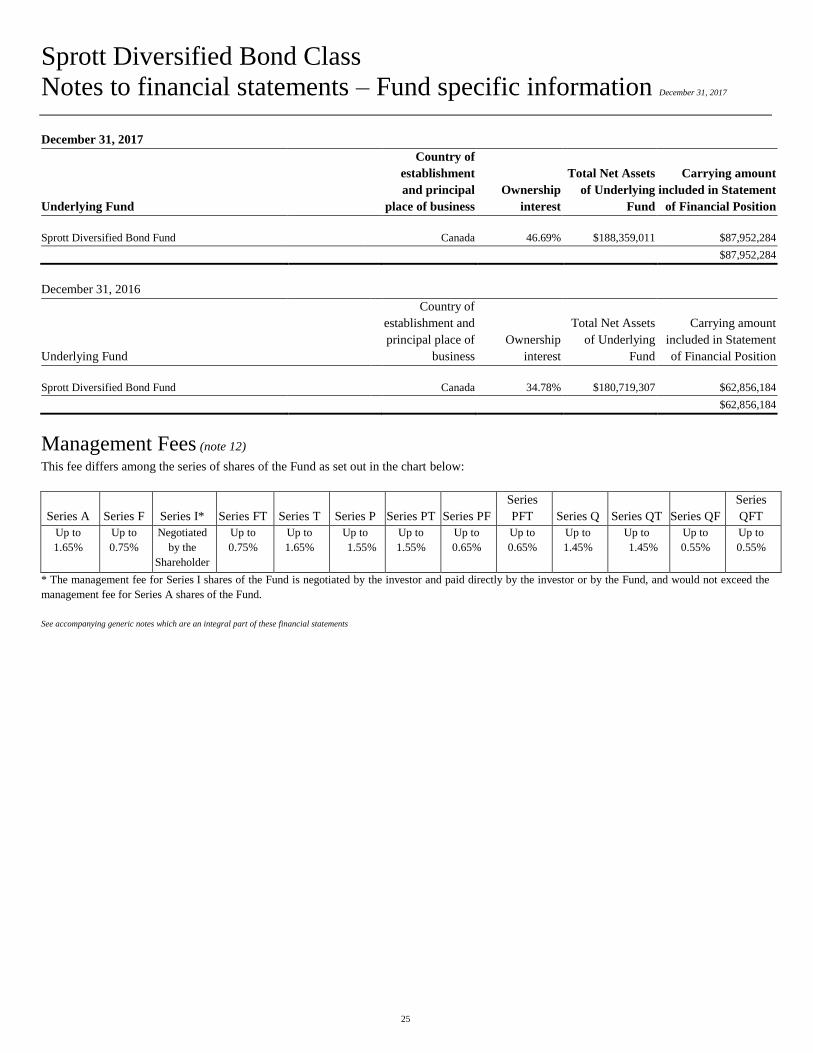
Sprott Diversified Bond Class
Notes to financial statements – Fund specific information December 31, 2017
25
December 31, 2017
Underlying Fund
Country of
establishment
and principal
place of business
Ownership
interest
Total Net Assets
of Underlying
Fund
Carrying amount
included in Statement
of Financial Position
Sprott Diversified Bond Fund Canada 46.69% $188,359,011 $87,952,284
$87,952,284
December 31, 2016
Underlying Fund
Country of
establishment and
principal place of
business
Ownership
interest
Total Net Assets
of Underlying
Fund
Carrying amount
included in Statement
of Financial Position
Sprott Diversified Bond Fund Canada 34.78% $180,719,307 $62,856,184
$62,856,184
Management Fees (note 12)
This fee differs among the series of shares of the Fund as set out in the chart below:
Series A Series F Series I* Series FT Series T Series P Series PT Series PF
Series
PFT Series Q Series QT Series QF
Series
QFT
Up to
1.65%
Up to
0.75%
Negotiated
by the
Shareholder
Up to
0.75%
Up to
1.65%
Up to
1.55%
Up to
1.55%
Up to
0.65%
Up to
0.65%
Up to
1.45%
Up to
1.45%
Up to
0.55%
Up to
0.55%
* The management fee for Series I shares of the Fund is negotiated by the investor and paid directly by the investor or by the Fund, and would not exceed the
management fee for Series A shares of the Fund.
See accompanying generic notes which are an integral part of these financial statements

26
Sprott Short-Term Bond Class
Statements of Financial Position
(in Canadian Dollars)
As at December 31 2017 2016
$ $
Assets
Current assets
Investments (note 3, 5) 6,340,760 9,800,441
Cash - 278,509
Receivable from Manager (note 13) - 23,673
Other assets 732 -
Total assets 6,341,492 10,102,623
Liabilities
Current liabilities
Bank indebtedness 3,245 -
Due to broker - 400,000
Redemptions payable 5,685 13,739
Accrued expenses - 13,903
Total liabilities 8,930 427,642
Net Assets attributable to holders of redeemable shares 6,332,562 9,674,981
Net Assets attributable to holders of redeemable shares per series
Series A 1,513,924 3,568,921
Series F 4,818,638 6,106,060
Net Assets attributable to holders of redeemable shares per series per share (note 8)
Series A 10.88 10.84
Series F 10.98 10.91
See accompanying notes which are an integral part of these financial statements
On behalf of the Manager, Ninepoint Partners LP,
by the Board of Directors of Sprott Corporate Class Inc.
James Fox Stuart J. Freeman
DIRECTOR DIRECTOR

27
Sprott Short-Term Bond Class
Statements of Comprehensive Income (Loss)
(in Canadian Dollars, except share amounts)
For the years ended December 31 2017 2016
$ $
Income
Net gain (loss) on investments:(1)
Distribution income (note 3) 165,257 130,999
Net realized gains (losses) on sales of investments (13,472) 9,533
Change in unrealized depreciation in the value of investments (26,730) (21,467)
Total income 125,055 119,065
Expenses (note 12, 13)
Management fees 50,165 45,034
Unitholder reporting costs 23,152 14,267
Administrative fees 17,433 22,474
Filing fees 8,724 22,602
Legal fees 7,039 13,647
Directors' fees 6,125 4,324
Independent Review Committee fees (note 15) 4,895 4,690
Audit fees 4,582 4,177
Custodial fees 1,407 1,136
Total expenses 123,522 132,351
Expenses waived/absorbed by the Manager (note 13) (73,100) (72,656)
Net expenses 50,422 59,695
Increase in Net Assets attributable to holders of redeemable shares from operations 74,633 59,370
Increase in Net Assets attributable to holders of redeemable shares from operations per series
Series A 16,963 21,639
Series F 57,670 37,731
Weighted average number of redeemable shares
Series A 206,680 262,929
Series F 511,301 348,980
Increase in Net Assets attributable to holders of redeemable shares from operations per series per share (note 3)
Series A 0.08 0.08
Series F 0.11 0.11
(1)Net gain (loss) on investments comprised of:
Financial assets and liabilities designated at FVTPL 125,055 119,065
Financial assets and liabilities classified as HFT - -
125,055 119,065
See accompanying notes which are an integral part of these financial statements

28
Sprott Short-Term Bond Class
Statements of Changes in Net Assets Attributable to Holders of Redeemable Shares
(in Canadian Dollars, except share amounts)
For the years ended December 31 2017 2016
$ $
Net Assets attributable to holders of redeemable shares, beginning of year
Series A 3,568,921 2,538,045
Series F 6,106,060 3,334,123
9,674,981 5,872,168
Increase in Net Assets attributable to holders of redeemable shares from operations
Series A 16,963 21,639
Series F 57,670 37,731
74,633 59,370
Redeemable share transactions (note 8)
Proceeds from redeemable shares issued
Series A 808,472 3,582,602
Series F 8,336,254 7,902,111
Redemption of redeemable shares
Series A (2,880,432) (2,573,365)
Series F (9,681,346) (5,167,905)
(3,417,052) 3,743,443
Net increase (decrease) in Net Assets attributable to holders of redeemable shares
Series A (2,054,997) 1,030,876
Series F (1,287,422) 2,771,937
(3,342,419) 3,802,813
Net Assets attributable to holders of redeemable shares, end of year
Series A 1,513,924 3,568,921
Series F 4,818,638 6,106,060
6,332,562 9,674,981
Changes in outstanding redeemable shares of the Fund for the years ended December 31, 2017 and 2016 were as follows:
2017 2016
Series A Series F Series A Series F
Shares, beginning of year 329,360 559,745 236,549 309,505
Subscriptions 74,210 760,886 330,765 724,152
Redemptions (264,360) (881,695) (237,954) (473,912)
Shares, end of year 139,210 438,936 329,360 559,745
See accompanying notes which are an integral part of these financial statements

29
Sprott Short-Term Bond Class
Statements of Cash Flows (in Canadian Dollars)
For the years ended December 31 2017 2016
$ $
Cash flows from operating activities
Increase in Net Assets attributable to holders of redeemable shares from operations 74,633 59,370
Adjustments for:
Distribution income (165,257) (130,999)
Net realized (gains) losses on sales of investments 13,472 (9,533)
Change in unrealized depreciation in the value of investments 26,730 21,467
Purchases of investments (7,454,360) (10,696,444)
Proceeds from sales of investments 10,639,096 6,219,343
Net increase (decrease) in other assets and liabilities 9,038 45,218
Net cash provided by (used in) operating activities 3,143,352 (4,491,578)
Cash flows from financing activities
Proceeds from redeemable shares issued 9,144,726 11,484,713
Redemption of redeemable shares (12,569,832) (7,727,531)
Net cash provided by (used in) financing activities (3,425,106) 3,757,182
Net decrease in cash (281,754) (734,396)
Cash at beginning of year 278,509 1,012,905
Cash (Bank indebtedness) at end of year (3,245) 278,509
See accompanying notes which are an integral part of these financial statements

30
Sprott Short-Term Bond Class
Schedule of Investment Portfolio As at December 31, 2017 Average Cost Fair Value
$ $
UNITS MUTUAL FUNDS [100.13%]
645,600 Sprott Short-Term Bond Fund, Series I 6,400,067 6,340,760
Total Investments [100.13%] 6,400,067 6,340,760
Cash and Other Assets Less Liabilities [-0.13%] (8,198)
Total Net Assets attributable to holders of redeemable shares [100.00%] 6,332,562
See accompanying notes which are an integral part of these financial statements

Sprott Short-Term Bond Class
Notes to financial statements – Fund specific information December 31, 2017
31
Financial Risk Management (note 6)
Investment Objective The Fund aims to preserve capital and maintain liquidity. It seeks a similar return to its underlying fund, Sprott Short-Term Bond Fund, by
investing substantially all of its assets in securities of that fund. The underlying fund invests primarily in short-term debt securities issued by
Canadian federal, provincial and municipal governments as well as corporate issuers.
The Schedule of Investment Portfolio represents the securities held by the Fund as at December 31, 2017. Significant risks that are relevant to
the Fund are discussed here. As the Fund invests in underlying funds, it may be indirectly exposed to other price risk, currency risk, interest rate
risk, credit risk and concentration risk from these holdings. As at December 31, 2017, 100.13% (2016 - 101.30%) of the Fund’s Net Assets
attributable to holders of redeemable shares were invested in mutual fund units. Only direct exposure to significant risks that are relevant to the
Fund are discussed here. For more information regarding the risks of the underlying funds, refer to each underlying fund’s financial statements.
General information on risk management is described in Note 6.
Concentration Risk The table below summarizes the Fund’s concentration risk as a percentage of Net Assets attributable to holders of redeemable shares as at
December 31, 2017 and 2016.
December 31, 2017 December 31, 2016
Mutual Funds 100.13% 101.30%
Cash and Other Assets Less Liabilities (0.13%) (1.30%)
Total Net Assets attributable to holders of redeemable shares 100.00% 100.00%
Fair Value Measurements (note 5)
The Fund’s assets and liabilities measured at fair value have been categorized based upon the fair value hierarchy in the tables below as at
December 31, 2017 and 2016:
December 31, 2017
Level 1 Level 2 Level 3 Total $ $ $ $
Mutual Funds 6,340,760 – – 6,340,760
December 31, 2016
Level 1 Level 2 Level 3 Total $ $ $ $
Mutual Funds 9,800,441 – – 9,800,441
Investments in Underlying Funds The Fund invests in redeemable units or shares of an investment fund managed by Ninepoint Partners LP (the “Underlying Fund”) to gain
exposure to the investment objective and strategies of the Underlying Fund.
The Underlying Fund invests in a portfolio of assets to generate returns in the form of investment income and capital appreciation for its
unitholders. The Underlying Fund finances its operations primarily through the issuance of redeemable units, which are puttable at the
unitholder’s option and entitle the unitholder to a proportionate share of the Underlying Fund’s net assets. The Fund’s interest in the Underlying
Fund, held in the form of redeemable units, is reported in its Schedule of Investment Portfolio at fair value, which represents the Fund’s
maximum exposure to this investment. Distributions earned from the Underlying Fund are included in “Distribution income” in the Statements
of Comprehensive Income. The total realized losses and change in unrealized losses arising from the Underlying Fund included in the
Statements of Comprehensive Income for the year ended December 31, 2017 are $13,472 and $26,730, respectively (2016 – realized gains of
$9,533 and unrealized losses of $21,467). The Fund does not provide any additional significant financial or other support to the Underlying
Fund. The tables below set out the interest held by the Fund in the Underlying Fund:

Sprott Short-Term Bond Class
Notes to financial statements – Fund specific information December 31, 2017
32
December 31, 2017
Underlying Fund
Country of
establishment
and principal
place of business
Ownership
interest
Total Net Assets
of Underlying
Fund
Carrying amount
included in Statement
of Financial Position
Sprott Short-Term Bond Fund Canada 45.52% $13,929,198 $6,340,760
$6,340,760
December 31, 2016
Underlying Fund
Country of
establishment and
principal place of
business
Ownership
interest
Total Net Assets
of Underlying
Fund
Carrying amount
included in Statement
of Financial Position
Sprott Short-Term Bond Fund Canada 47.98% $20,425,172 $9,800,441
$9,800,441
During the years ended December 31, 2017 and 2016, there were no significant transfers between levels.
Related Party Holdings Ninepoint Financial Group, the parent company of the Fund manager, and Sprott Inc., the parent company of the previous Fund manager, and
their respective subsidiaries, held the following investments in the Fund as at December 31, 2017 and 2016, respectively:
December 31, 2017 December 31, 2016 Units held
Class F 92 55,571
Value of units held ($) 1,007 606,201
Management Fees (note 12)
This fee differs among the series of shares of the Fund as set out in the chart below:
Series A Series F Series I*
Up to 0.75% Up to 0.50% Negotiated by the
Shareholder
* The management fee for Series I shares of the Fund is negotiated by the investor and paid directly by the investor or by the Fund, and would not exceed the
management fee for Series A shares of the Fund.
See accompanying generic notes which are an integral part of these financial statements

33
Sprott Silver Equities Class
Statements of Financial Position
(in Canadian Dollars)
As at December 31 2017 2016
$ $
Assets
Current assets
Investments (excluding derivatives) (note 3, 5) 112,105,798 124,668,570
Cash 902,296 3,884,729
Broker margin - 1,892,005
Subscriptions receivable 138,963 73,203
Total assets 113,147,057 130,518,507
Liabilities
Current liabilities
Options written (note 3, 5) - 285,301
Unrealized depreciation on forward currency contracts (note 3, 5) - 21,971
Due to broker - 1,560,327
Redemptions payable 202,673 74,964
Accrued expenses 32,141 12,658
Incentive fees payable (note 12) - 444,368
Total liabilities 234,814 2,399,589
Net Assets attributable to holders of redeemable shares 112,912,243 128,118,918
Net Assets attributable to holders of redeemable shares per series
Series A 60,276,028 59,976,848
Series F 52,636,215 68,142,070
Net Assets attributable to holders of redeemable shares per series per share (note 8)
Series A 5.61 6.41
Series F 5.94 6.71
See accompanying notes which are an integral part of these financial statements
On behalf of the Manager, Ninepoint Partners LP,
by the Board of Directors of Sprott Corporate Class Inc.
James Fox Stuart J. Freeman
DIRECTOR DIRECTOR

34
Sprott Silver Equities Class
Statements of Comprehensive Income (Loss)
(in Canadian Dollars, except share amounts)
For the years ended December 31 2017 2016
$ $
Income
Net gain (loss) on investments and derivatives:(1)
Dividends (note 3) 867,897 333,259
Net realized gains (losses) on sales of investments (15,645,345) 27,909,660
Net realized gains (losses) on option contracts 719,637 (2,503,434)
Net realized gains (losses) on forward currency contracts (57,042) 434,138
Change in unrealized appreciation (depreciation) in the value of investments 4,197,752 (1,493,876)
Change in unrealized appreciation (depreciation) on option contracts (113,543) 70,730
Change in unrealized appreciation (depreciation) on forward currency contracts 21,971 (21,971)
Net realized gains (losses) on foreign exchange (512,366) 758,539
Other income 1,002 293
Total income (loss) (10,520,037) 25,487,338
Expenses (note 12, 13)
Transaction costs (note 3, 14) 3,006,661 2,217,744
Management fees 2,858,970 1,679,739
Unitholder reporting costs 149,379 69,028
Administrative fees 80,507 32,958
Custodial fees 28,464 17,414
Audit fees 14,968 11,796
Filing fees 10,070 22,602
Legal fees 6,863 8,438
Directors' fees 6,747 4,324
Independent Review Committee fees (note 15) 5,055 4,690
Securities borrowing expense 4,364 -
Withholding taxes 3,525 2,327
Incentive fees (note 12) - 444,368
Total expenses 6,175,573 4,515,428
Increase (decrease) in Net Assets attributable to holders of redeemable shares from operations (16,695,610) 20,971,910
Increase (decrease) in Net Assets attributable to holders of redeemable shares from operations per series
Series A (8,157,404) 7,668,665
Series F (8,538,206) 13,303,245
Weighted average number of redeemable shares
Series A 10,006,033 5,811,723
Series F 10,656,463 5,206,271
Increase (decrease) in Net Assets attributable to holders of redeemable shares from operations per series
per share (note 3)
Series A (0.82) 1.32
Series F (0.80) 2.56
(1)Net gain (loss) on investments and derivatives comprised of:
Financial assets and liabilities designated at FVTPL (11,112,866) 26,845,616
Financial assets and liabilities classified as HFT 1,104,193 (2,117,110)
(10,008,673) 24,728,506
See accompanying notes which are an integral part of these financial statements

35
Sprott Silver Equities Class
Statements of Changes in Net Assets Attributable to Holders of Redeemable Shares
(in Canadian Dollars, except share amounts)
For the years ended December 31 2017 2016
$ $
Net Assets attributable to holders of redeemable shares, beginning of year
Series A 59,976,848 11,023,802
Series F 68,142,070 15,077,514
128,118,918 26,101,316
Increase (decrease) in Net Assets attributable to holders of redeemable shares from operations
Series A (8,157,404) 7,668,665
Series F (8,538,206) 13,303,245
(16,695,610) 20,971,910
Distributions to holders of redeemable shares
From net investment income
Series A (212,330) (92,860)
Series F (185,239) (105,517)
(397,569) (198,377)
Redeemable share transactions (note 8)
Proceeds from redeemable shares issued
Series A 17,514,583 48,903,420
Series F 9,014,812 45,049,635
Reinvestments of distributions to holders of redeemable shares
Series A 206,262 88,578
Series F 184,159 104,922
Redemption of redeemable shares
Series A (9,051,931) (7,614,757)
Series F (15,981,381) (5,287,729)
1,886,504 81,244,069
Net increase (decrease) in Net Assets attributable to holders of redeemable shares
Series A 299,180 48,953,046
Series F (15,505,855) 53,064,556
(15,206,675) 102,017,602
Net Assets attributable to holders of redeemable shares, end of year
Series A 60,276,028 59,976,848
Series F 52,636,215 68,142,070
112,912,243 128,118,918

36
Sprott Silver Equities Class
Statements of Changes in Net Assets Attributable to Holders of Redeemable Shares continued
Changes in outstanding redeemable shares of the Fund for years ended December 31, 2017 and 2016 were as follows:
2017 2016
Series A Series F Series A Series F
Shares, beginning of year 9,363,501 10,156,365 3,288,133 4,329,053
Subscriptions 2,843,372 1,329,218 7,223,767 6,525,916
Reinvested distributions 36,732 30,998 13,192 14,917
Redemptions (1,499,246) (2,650,336) (1,161,591) (713,521)
Shares, end of year 10,744,359 8,866,245 9,363,501 10,156,365
See accompanying notes which are an integral part of these financial statements

37
Sprott Silver Equities Class
Statements of Cash Flows (in Canadian Dollars)
For the years ended December 31 2017 2016
$ $
Cash flows from operating activities
Increase (decrease) in Net Assets attributable to holders of redeemable shares from operations (16,695,610) 20,971,910
Adjustments for:
Foreign exchange (gains) losses on cash 11,591 (42,837)
Net realized (gains) losses on sales of investments 15,645,345 (27,909,660)
Net realized (gains) losses on options contracts (719,637) 2,503,434
Change in unrealized (appreciation) depreciation in the value of investments (4,197,752) 1,493,876
Change in unrealized (appreciation) depreciation on option contracts 113,543 (70,730)
Change in unrealized (appreciation) depreciation on forward currency contracts (21,971) 21,971
Purchases of investments (396,751,296) (333,098,827)
Proceeds from sales of investments 396,626,941 260,168,562
Net increase (decrease) in other assets and liabilities 1,467,120 (1,480,146)
Net cash used in operating activities (4,521,726) (77,442,447)
Cash flows from financing activities
Distributions paid to holders of redeemable shares, net of reinvested distributions (7,148) (4,877)
Proceeds from redeemable shares issued 18,070,613 93,900,102
Redemption of redeemable shares (16,512,581) (12,827,522)
Net cash provided by financing activities 1,550,884 81,067,703
Foreign exchange gains (losses) on cash (11,591) 42,837
Net increase (decrease) in cash (2,970,842) 3,625,256
Cash at beginning of year 3,884,729 216,636
Cash at end of year 902,296 3,884,729
Supplemental Information
Dividends received, net of withholding taxes 864,372 330,932
See accompanying notes which are an integral part of these financial statements

38
Sprott Silver Equities Class
Schedule of Investment Portfolio As at December 31, 2017 Expiry Date Average Cost Fair Value
$ $
SHARES EQUITIES [99.29%]
SILVER [99.29%]
335,900 Alexco Resource Corp. 747,391 668,441
205,000 Alexco Resource Corp., Warrants May 17, 2018 - 68,230
215,000 Alio Gold Inc., Warrants Jul 20, 2018 55,900 20,425
1,402,100 Almaden Minerals Ltd. 2,453,675 1,794,688
850,000 Almaden Minerals Ltd., Warrants Jun 1, 2020 - 77,724
200,000 Americas Silver Corp. 975,080 916,000 128,458 Americas Silver Corp., Warrants Jun 14, 2021 - 179,050
1,391,900 Argonaut Gold Inc. 3,380,835 3,340,560
61,126 Avino Silver & Gold Mines Ltd. 136,565 102,935
115,661 Azure Minerals Ltd., Warrants Aug 17, 2019 - 222
1,000,000 Canasil Resources Inc., Warrants Jun 28, 2018 - -
1,500,000 China Silver Group Ltd. 631,326 576,652
193,495 Cia de Minas Buenaventura SAA 3,439,181 3,423,786 602,300 Coeur Mining Inc. 6,493,995 5,676,864
628,000 Dalradian Resources Inc. 838,551 832,100
2,000,000 Discovery Metals Corp. 1,000,000 980,000
2,000,000 Discovery Metals Corp., Warrants Dec 18, 2018 - 24,640
3,105,000 Dolly Varden Silver Corp. 2,000,450 2,204,550
1,000,000 Dolly Varden Silver Corp.* Jan 8, 2018 730,000 704,920
1,022,261 Endeavour Silver Corp. 3,236,806 3,080,567
2,198,966 Excellon Resources Inc. 3,746,253 4,046,097 434,783 Excellon Resources Inc., Warrants Jul 23, 2018 34,800 208,696
375,000 Excellon Resources Inc.,Warrants Dec 31, 2018 - 97,500
261,400 First Majestic Silver Corp. 2,450,920 2,216,672
481,900 Fortuna Silver Mines Inc. 3,096,367 3,161,264
338,798 Fresnillo PLC 8,392,110 8,214,017
1,000,000 Golden Arrow Resources Corp., Warrants Jan 28, 2018 - 14,030
786,200 Great Panther Silver Ltd. 1,529,413 1,274,550
625,000 Great Panther Silver Ltd., Warrants Jan 11, 2018 153,886 - 889,300 Hecla Mining Co. 5,262,352 4,436,833
1,286,847 Hochschild Mining PLC 5,461,613 5,763,859
302,676 Industrias Penoles SAB de CV 9,182,639 7,924,767
1,414,000 Kootenay Silver Inc. 565,600 289,870
1,250,000 Kootenay Silver Inc.* Apr 6, 2018 250,000 235,750
562,500 Kootenay Silver Inc., Warrants Apr 21, 2021 - 61,875
387,526 MAG Silver Corp. 6,031,077 6,014,404 399,460 Pan American Silver Corp. 8,460,337 7,821,427
197,300 Pretium Resources Inc. 2,823,513 2,829,282
900,905 Sabina Gold & Silver Corp. 2,070,419 2,045,054
495,000 Santacruz Silver Mining Ltd., Warrants Jan 11, 2019 - -
944,067 Silvercorp Metals Inc. 3,419,355 3,096,540
2,209,800 Silvercrest Metals Inc. 3,397,418 3,955,542
700,000 Silvercrest Metals Inc.* Apr 19, 2018 735,000 1,161,798
562,500 Silvercrest Metals Inc., Warrants Dec 6, 2018 157,410 123,750 350,000 Silvercrest Metals Inc., Warrants Dec 19, 2019 - 202,503
347,500 SSR Mining Inc. 4,092,995 3,846,825
563,700 Tahoe Resources Inc. 5,180,352 3,393,265
539,400 Wheaton Precious Metals Corp. 14,995,093 14,997,274
Total Equities 117,608,677 112,105,798
Transaction Costs (note 3) (406,652)
Total Investments [99.29%] 117,202,025 112,105,798
Options purchased [0.00%] (Schedule 1) -
Cash and Other Assets Less Liabilities [0.71%] 806,445
Total Net Assets attributable to holders of redeemable shares [100.00%] 112,912,243
* Securities that are restricted for resale until the date indicated.
See accompanying notes which are an integral part of these financial statements

39
Sprott Silver Equities Class
Option Contracts (Schedule 1)
As at December 31, 2017
Options Purchased
Premium Fair
Number of Expiration Strike Paid Value
Option Details Option Type Contracts Date Price ($) $(CAD) $(CAD)
New Gold Inc. Call 1,988 19-Jan-18 8.00 CAD 50,834 -
50,834 -
See accompanying notes which are an integral part of these financial statements

Sprott Silver Equities Class
Notes to financial statements – Fund specific information December 31, 2017
40
Financial Risk Management (note 6)
Investment Objective The investment objective of the Fund is to seek to achieve long-term capital growth by investing primarily in equity securities of companies
that are directly or indirectly involved in the exploration, mining, production or distribution of silver. The Fund can also invest in silver and
silver certificates.
The Schedule of Investment Portfolio represents the securities held by the Fund as at December 31, 2017. Significant risks that are relevant to
the Fund are discussed here. General information on risk management is described in Note 6.
Market Risk
a) Other Price Risk
As at December 31, 2017 and 2016, if the MSCI ACWI Select Silver Miners IMI Net Return Index were to fluctuate by 10%, with all other
variables held constant, Net Assets attributable to holders of redeemable shares would increase or decrease by the amounts shown in the table
below. This is a measure based on the historical relationship of the Fund’s performance against the index noted above. The composition of this
calculation contains several subjective components that, although reasonably estimated, could alter the resulting calculation should these
components be modified based on revised assumptions.
December 31, 2017 December 31, 2016
Impact
($’000)
As a % of Net Assets
attributable to holders
of redeemable shares
Impact
($’000)
As a % of Net Assets
attributable to holders
of redeemable shares
10,727 9.50% 12,171 9.50%
b) Currency Risk
The tables below summarize the Fund’s exposure to currency risk as at December 31, 2017 and 2016. The tables also illustrate the potential
impact to the Fund’s Net Assets attributable to holders of redeemable units as a result of 1% changes in these currencies relative to the
Canadian dollar, with all other variables held constant.
December 31, 2017
Currency
Fair Value
($’000)
Forward
Currency
Contracts
($’000)
Net Exposure
($’000)
% of Net Assets
attributable to holders
of redeemable shares
Impact on Net Assets
attributable to holders
of redeemable shares
($’000)
U.S. Dollar 30,320 – 30,320 26.85 303
Pound Sterling 13,985 – 13,985 12.39 140
Mexican Peso 7,925 – 7,925 7.02 79
Hong Kong Dollar 577 – 577 0.51 6
52,807 – 52,807 46.77 528
December 31, 2016
Currency
Fair Value
($’000)
Forward
Currency
Contracts
($’000)
Net Exposure
($’000)
% of Net Assets
attributable to holders
of redeemable shares
Impact on Net Assets
attributable to holders
of redeemable shares
($’000)
U.S. Dollar 80,727 – 80,727 63.01 807
Pound Sterling 18,487 (16,381) 2,106 1.64 21
Australian Dollar 2 – 2 – –
Mexican Peso 4,869 – 4,869 3.80 49
104,085 (16,381) 87,704 68.45 877

Sprott Silver Equities Class
Notes to financial statements – Fund specific information December 31, 2017
41
c) Interest Rate Risk
As at December 31, 2017 and 2016, the Fund did not have a significant exposure to interest rate risk.
Credit Risk As at December 31, 2017, the Fund did not have a significant exposure to credit risk. As at December 31, 2016, the Fund was exposed to credit
risk from over-the-counter derivative contracts with counterparties. The credit risk is considered minimal as these counterparties have a
minimum credit rating of AA- by S&P or equivalent.
Concentration Risk The table below summarizes the Fund’s concentration risk as a percentage of Net Assets attributable to holders of redeemable shares as at
December 31, 2017 and 2016.
December 31, 2017 December 31, 2016
Equities:
Silver and other metals 99.29% 97.31%
Unrealized depreciation on forward currency contracts – (0.02%)
Options written – (0.22%)
Cash and Other Assets Less Liabilities 0.71% 2.93%
Total Net Assets attributable to holders of redeemable shares 100.00% 100.00%
Fair Value Measurements (note 5)
The Fund’s assets and liabilities measured at fair value have been categorized based upon the fair value hierarchy in the tables below as at
December 31, 2017 and 2016:
December 31, 2017
Level 1 Level 2 Level 3 Total $ $ $ $
Equities – Long 108,924,685 2,102,468 – 111,027,153
Warrants 512,246 566,399 – 1,078,645
109,436,931 2,668,867 – 112,105,798
December 31, 2016
Level 1 Level 2 Level 3 Total $ $ $ $
Equities – Long 121,812,296 – – 121,812,296
Warrants 825,748 2,030,526 – 2,856,274
Forward Currency Contracts – (21,971) – (21,971)
Options written (285,301) – – (285,301)
122,352,743 2,008,555 – 124,361,298
During the years ended December 31, 2017 and 2016, there were no significant transfers between levels.
Restricted Cash and Investments (note 11)
As at December 31, 2017, restricted cash and investments held for the Fund totaled $nil (2016 - $1,892,005).

Sprott Silver Equities Class
Notes to financial statements – Fund specific information December 31, 2017
42
Management Fees (note 12)
This fee differs among the series of shares of the Fund as set out in the chart below:
Series A Series F Series I*
Up to 2.50% Up to 1.50% Negotiated by the
Shareholder
* The management fee for Series I shares of the Fund is negotiated by the investor and paid directly by the investor or by the Fund, and would not exceed the
management fee for Series A shares of the Fund.
Sharing Arrangements (note 14) The Fund paid $25,346 out of the total transaction costs incurred to certain brokers for research expenses provided to the portfolio manager
during the year ended December 31, 2017 (2016 - $1,390).
See accompanying generic notes which are an integral part of these financial statements

43
Sprott Enhanced Equity Class
Statements of Financial Position (in Canadian Dollars)
As at December 31 2017 2016
$ $
Assets
Current assets
Investments (excluding derivatives) (note 3, 5, 11) 460,237,353 545,682,720
Cash (note 11) 14,694,671 200,390,585
Options purchased (note 3, 5) 1,314,340 2,431,361
Broker margin (note 11) 13,251,918 8,734,141
Unrealized appreciation on forward currency contracts (note 3, 5) 4,043,573 -
Subscriptions receivable 113,431 235,748
Dividends receivable 898,463 934,828
Due from broker 1,025,532 -
Total assets 495,579,281 758,409,383
Liabilities
Current liabilities
Options written (note 3, 5) 324,651 1,964,663
Unrealized depreciation on forward currency contracts (note 3, 5) - 1,743,307
Redemptions payable 794,663 7,204,230
Accrued expenses 66,882 115,989
Total liabilities 1,186,196 11,028,189
Net Assets attributable to holders of redeemable shares 494,393,085 747,381,194
Net Assets attributable to holders of redeemable shares per series
Series A 266,530,870 387,058,931
Series A1 13,064,269 24,059,318
Series F 192,209,668 283,740,441
Series F1 4,680,202 13,881,567
Series I 13,084 12,036
Series T 6,435,663 12,789,338
Series FT 11,459,329 25,839,563
Net Assets attributable to holders of redeemable shares per series per share (note 8)
Series A 13.10 12.48
Series A1 13.18 12.55
Series F 14.00 13.19
Series F1 14.04 13.22
Series I 14.94 13.93
Series T 8.86 8.98
Series FT 9.29 9.31
Series A $US 10.42 9.30
Series F $US 11.14 9.83
Series I $US 11.88 10.37
Series T $US 7.05 6.69
Series FT $US 7.40 6.94
See accompanying notes which are an integral part of these financial statements
On behalf of the Manager, Ninepoint Partners LP,
by the Board of Directors of Sprott Corporate Class Inc.
James Fox Stuart J. Freeman
DIRECTOR DIRECTOR

44
Sprott Enhanced Equity Class
Statements of Comprehensive Income (Loss)
(in Canadian Dollars, except share amounts)
For the years ended December 31 2017 2016
$ $
Income
Net gain (loss) on investments and derivatives:(1)
Interest income for distribution purposes (note 3) 1,463,028 290,925
Dividends (note 3) 10,099,847 12,004,829
Net realized gains on sales of investments 16,400,701 37,182,009
Net realized gains (losses) on forward currency contracts 11,081,525 (791,975)
Net realized gains (losses) on option contracts 14,479,669 (21,510,890)
Change in unrealized depreciation in the value of investments (1,569,098) (24,109,099)
Change in unrealized appreciation (depreciation) on forward currency contracts 5,786,880 (3,362,584)
Change in unrealized appreciation (depreciation) on option contracts (2,382,775) 5,234,082
Securities lending income (note 3) 219,175 -
Net realized gains (losses) on foreign exchange (9,677,566) 549,866
Other income 9,237 18,187
Total income 45,910,623 5,505,350
Expenses (note 12, 13)
Management fees 10,209,623 15,051,699
Unitholder reporting costs 934,672 925,981
Withholding taxes 439,584 904,627
Administrative fees 339,724 423,036
Transaction costs (note 3, 14) 291,982 451,307
Custodial fees 42,198 63,751
Audit fees 31,964 45,860
Filing fees 26,495 40,539
Legal fees 6,904 45,171
Directors' fees 6,789 4,323
Independent Review Committee fees (note 15) 5,085 5,439
Total expenses 12,335,020 17,961,733
Increase (decrease) in Net Assets attributable to holders of redeemable shares from operations 33,575,603 (12,456,383)
Increase (decrease) in Net Assets attributable to holders of redeemable shares from operations per series
Series A 16,523,698 (8,172,384)
Series A1 813,557 (817,986)
Series F 14,513,590 (2,987,035)
Series F1 338,880 (370,036)
Series I 1,048 137
Series T 376,818 (296,548)
Series FT 1,008,012 187,469
Weighted average number of redeemable shares
Series A 24,729,552 36,649,810
Series A1 1,383,521 2,452,774
Series F 17,069,547 25,979,246
Series F1 495,968 1,493,746
Series I 864 861
Series T 1,105,595 1,632,031
Series FT 1,815,303 4,206,310

45
Sprott Enhanced Equity Class
Statements of Comprehensive Income (Loss) continued
(in Canadian Dollars, except share amounts)
For the years ended December 31 2017 2016
$ $
Increase (decrease) in Net Assets attributable to holders of redeemable shares from operations per series
per share (note 3)
Series A 0.67 (0.22)
Series A1 0.59 (0.33)
Series F 0.85 (0.11)
Series F1 0.68 (0.25)
Series I 1.21 0.16
Series T 0.34 (0.18)
Series FT 0.56 0.04
(1)Net gain (loss) on investments and derivatives comprised of:
Financial assets and liabilities designated at FVTPL 26,459,888 25,368,664
Financial assets and liabilities classified as HFT 28,899,889 (20,431,367)
55,359,777 4,937,297
See accompanying notes which are an integral part of these financial statements

46
Sprott Enhanced Equity Class
Statements of Changes in Net Assets Attributable to Holders of Redeemable Shares
(in Canadian Dollars, except share amounts)
For the years ended December 31 2017 2016
$ $
Net Assets attributable to holders of redeemable shares, beginning of year
Series A 387,058,931 495,616,205
Series A1 24,059,318 38,008,543
Series F 283,740,441 379,670,996
Series F1 13,881,567 25,337,305
Series I 12,036 11,899
Series T 12,789,338 16,701,138
Series FT 25,839,563 35,417,772
747,381,194 990,763,858
Increase (decrease) in Net Assets attributable to holders of redeemable shares from operations
Series A 16,523,698 (8,172,384)
Series A1 813,557 (817,986)
Series F 14,513,590 (2,987,035)
Series F1 338,880 (370,036)
Series I 1,048 137
Series T 376,818 (296,548)
Series FT 1,008,012 187,469
33,575,603 (12,456,383)
Distributions to holders of redeemable shares
From net investment income
Series A (3,516,558) (1,348,604)
Series A1 (172,234) (83,779)
Series F (2,544,338) (989,130)
Series F1 (61,672) (48,320)
Series I (172) (41)
Series T (86,110) (44,839)
Series FT (153,447) (90,732)
From return of capital
Series A (1,068) (4,390)
Series A1 - -
Series F (7,557) (12,512)
Series F1 (306) (834)
Series I - -
Series T (579,154) (943,183)
Series FT (963,129) (2,466,126)
(8,085,745) (6,032,490)

47
Sprott Enhanced Equity Class
Statements of Changes in Net Assets Attributable to Holders of Redeemable Shares
continued (in Canadian Dollars, except share amounts)
For the years ended December 31 2017 2016
$ $
Redeemable share transactions (note 8)
Proceeds from redeemable shares issued
Series A 12,378,255 54,377,813
Series A1 75,842 83,338
Series F 31,125,275 71,414,993
Series F1 78,417 379,089
Series I - -
Series T 167,801 1,614,546
Series FT 2,482,024 17,261,398
Reinvestments of distributions to holders of redeemable shares
Series A 3,364,250 1,289,557
Series A1 168,279 82,177
Series F 2,133,889 836,252
Series F1 61,172 47,992
Series I 172 41
Series T 136,573 187,712
Series FT 112,434 156,547
Redemption of redeemable shares
Series A (149,276,638) (154,699,266)
Series A1 (11,880,493) (13,212,975)
Series F (136,751,632) (164,193,123)
Series F1 (9,617,856) (11,463,629)
Series I - -
Series T (6,369,603) (4,429,488)
Series FT (16,866,128) (24,626,765)
(278,477,967) (224,893,791)
Net increase (decrease) in Net Assets attributable to holders of redeemable shares
Series A (120,528,061) (108,557,274)
Series A1 (10,995,049) (13,949,225)
Series F (91,530,773) (95,930,555)
Series F1 (9,201,365) (11,455,738)
Series I 1,048 137
Series T (6,353,675) (3,911,800)
Series FT (14,380,234) (9,578,209)
(252,988,109) (243,382,664)
Net Assets attributable to holders of redeemable shares, end of year
Series A 266,530,870 387,058,931
Series A1 13,064,269 24,059,318
Series F 192,209,668 283,740,441
Series F1 4,680,202 13,881,567
Series I 13,084 12,036
Series T 6,435,663 12,789,338
Series FT 11,459,329 25,839,563
494,393,085 747,381,194

48
Sprott Enhanced Equity Class
Statements of Changes in Net Assets Attributable to Holders of Redeemable Shares continued Changes in outstanding redeemable shares of the Fund for the years ended December 31, 2017 and 2016 were as follows:
2017 2016
Series A Series A1 Series F Series F1 Series I Series T Series FT Series A Series A1 Series F Series F1 Series I Series T Series FT
Shares, beginning
of year 31,003,809 1,917,440 21,503,638 1,050,179 864 1,423,697 2,774,573 39,146,093 2,989,250 28,691,255 1,912,759 861 1,718,830 3,555,282
Subscriptions 987,370 5,987 2,337,024 6,005 - 18,716 269,994 4,494,294 6,781 5,624,203 29,660 - 175,193 1,843,836
Reinvested
distributions 256,190 12,740 152,083 4,348 12 15,549 12,240 102,920 6,525 63,178 3,619 3 20,829 16,856
Redemptions (11,901,224) (944,692) (10,262,913) (727,082) - (731,839) (1,823,882) (12,739,498) (1,085,116) (12,874,998) (895,859) - (491,155) (2,641,401)
Shares, end of year 20,346,145 991,475 13,729,832 333,450 876 726,123 1,232,925 31,003,809 1,917,440 21,503,638 1,050,179 864 1,423,697 2,774,573
See accompanying notes which are an integral part of these financial statements

49
Sprott Enhanced Equity Class
Statements of Cash Flows
(in Canadian Dollars)
For the years ended December 31 2017 2016
$ $
Cash flows from operating activities
Increase (decrease) in net assets attributable to holders of redeemable shares from operations 33,575,603 (12,456,383)
Adjustments for:
Foreign exchange (gains) losses on cash 450,580 (608,150)
Net realized (gains) on sales of investments (16,400,701) (37,182,009)
Net realized (gains) losses on options contracts (14,479,669) 21,510,890
Change in unrealized depreciation in the value of investments 1,569,098 24,109,099
Change in unrealized (appreciation) depreciation on forward currency contracts (5,786,880) 3,362,584
Change in unrealized (appreciation) depreciation on option contracts 2,382,775 (5,234,082)
Purchases of investments (127,815,985) (452,870,724)
Proceeds from sales of investments 238,641,326 587,989,839
Net increase (decrease) in other assets and liabilities (4,530,519) 72,909,676
Net cash provided by operating activities 107,605,628 201,530,740
Cash flows from financing activities
Distributions paid to holders of redeemable shares, net of reinvested distributions (2,108,976) (3,432,212)
Proceeds from redeemable shares issued 26,806,346 149,406,483
Redemption of redeemable shares (317,548,332) (365,895,888)
Net cash used in financing activities (292,850,962) (219,921,617)
Foreign exchange gains (losses) on cash (450,580) 608,150
Net decrease in cash (185,245,334) (18,390,877)
Cash at beginning of year 200,390,585 218,173,312
Cash at end of year 14,694,671 200,390,585
Supplemental Information
Interest received 1,463,028 290,925
Dividends received, net of withholding taxes 9,712,362 10,495,652
See accompanying notes which are an integral part of these financial statements

50
Sprott Enhanced Equity Class
Schedule of Investment Portfolio As at December 31, 2017 Expiry Date Average Cost Fair Value
$ $ SHARES EQUITIES [93.09%]
FINANCIALS [24.09%]
499,200 Bank of America Corp. 15,888,543 18,519,327
190,500 Canadian Imperial Bank of Commerce 20,991,556 23,343,870
184,800 Citigroup Inc. 16,931,942 17,280,947
1,988,800 ECN Capital Corp. 5,751,692 7,815,984
1,647,700 Element Fleet Management Corp. 18,791,404 15,653,150 210,400 Intercontinental Exchange, Inc. 11,391,635 18,656,861
679,000 Manulife Financial Corp. 14,463,866 17,803,380
104,210,638 119,073,519
ENERGY [20.42%] 944,900 AltaGas Ltd. 29,291,899 26,806,813
371,000 Inter Pipeline Ltd. 9,667,481 9,657,130
623,700 Parex Resources Inc. 10,161,640 11,326,392
1,402,500 Precision Drilling Corp. 5,343,525 5,343,525
351,000 ShawCor Ltd. 11,573,640 9,624,420
542,658 Suncor Energy Inc. 18,571,841 25,043,667
214,372 TransCanada Corp. 9,751,218 13,115,279
94,361,244 100,917,226
INFORMATION TECHNOLOGY [13.07%]
442,100 CGI Group Inc. 15,732,741 30,195,429
177,500 Fiserv Inc. 24,485,240 29,250,593
509,308 Real Matters Inc. 6,621,004 5,133,825 86,000 Trilogy International Partners Inc., Warrants Feb 7, 2022 - 53,320
46,838,985 64,633,167
CONSUMER DISCRETIONARY [8.66%] 227,300 Comcast Corp. 9,307,424 11,440,269
904,800 Hudson's Bay Co. 17,768,125 10,206,144
738,000 Roots Corp. 8,856,000 8,317,260
54,000 The Home Depot Inc. 8,796,273 12,861,926
44,727,822 42,825,599
HEALTH CARE [6.61%]
41,500 Danaher Corp. 3,981,078 4,840,876
100,500 UnitedHealth Group Inc. 18,201,433 27,843,904
22,182,511 32,684,780
INDUSTRIALS [6.45%]
66,900 Northrop Grumman Corp. 14,173,710 25,803,073
36,200 Union Pacific Corp. 5,200,722 6,100,587
19,374,432 31,903,660
CONSUMER STAPLES [5.46%]
411,500 Alimentation Couche-Tard Inc., Class B 9,831,852 26,990,285
9,831,852 26,990,285
UTILITIES [4.47%]
392,400 Brookfield Infrastructure Partners LP 14,504,035 22,123,512
14,504,035 22,123,512
REAL ESTATE [3.86%]
685,300 Brookfield Property Partners LP 19,275,577 19,085,605
19,275,577 19,085,605
Total Equities 375,307,096 460,237,353
Transaction Costs (note 3) (276,840)
Total Investments [93.09%] 375,030,256 460,237,353
Total unrealized appreciation on forward currency contracts [0.82%] (Schedule 1) 4,043,573
Options purchased [0.27%] (Schedule 2) 1,314,340
Options written [-0.07%] (Schedule 2) (324,651)
Cash and Other Assets Less Liabilities [5.89%] 29,122,470
Total Net Assets attributable to holders of redeemable shares [100.00%] 494,393,085
See accompanying notes which are an integral part of these financial statements

51
Sprott Enhanced Equity Class
Forward Currency Contracts (Schedule 1)
As at December 31, 2017
Contract Cost Forward Value
Unrealized
Appreciation
Bought ($) Sold ($) Settlement Date $(CAD) $(CAD) $(CAD)
44,926,000 Canadian Dollar (35,000,000) U.S. Dollar 19-Jan-18 (44,926,000) (43,969,302) 956,698
44,889,680 Canadian Dollar (35,000,000) U.S. Dollar 19-Jan-18 (44,889,680) (43,969,269) 920,411
96,889,000 Canadian Dollar (75,400,000) U.S. Dollar 19-Jan-18 (96,889,000) (94,722,536) 2,166,464
Total 4,043,573
Option Contracts (Schedule 2)
As at December 31, 2017
Options Purchased
Premium Fair
Number of Expiration Strike Paid Value
Option Details Option Type Contracts Date Price ($) $(CAD) $(CAD)
Energy Select Sector SPDR Call 844 16-Mar-18 70.50 USD 125,157 342,061
iShares S&P TSX Capped Energy Fund Call 12,650 16-Feb-18 12.50 CAD 303,550 271,975
iShares S&P TSX Capped Energy Fund Call 3,280 16-Feb-18 12.00 CAD 55,760 159,080
iShares S&P TSX Capped Energy Fund Put 8,450 16-Feb-18 10.75 CAD 135,200 42,250
iShares S&P TSX Capped Energy Fund Put 4,200 16-Feb-18 11.00 CAD 75,600 29,400
SPDR Euro Stoxx 50 ETF Put 17,060 19-Jan-18 34.00 USD 1,607,947 7,107
SPDR S&P 500 ETF Trust Call 7,600 19-Jan-18 271.00 USD 716,319 305,629
Union Pacific Corp. Put 362 19-Jan-18 110.00 USD 131,929 4,778
WisdomTree Europe Hedged Equity Fund Call 12,100 16-Feb-18 67.00 USD 473,272 152,060
3,624,734 1,314,340
Options Written
Premium Fair
Number of Expiration Strike Received Value
Option Details Option Type Contracts Date Price ($) $(CAD) $(CAD)
iShares S&P TSX Capped Energy Fund Call 2,050 16-Feb-18 13.00 CAD (6,150) (15,375)
iShares S&P TSX Capped Energy Fund Put 4,200 16-Feb-18 11.75 CAD (153,300) (65,100)
iShares S&P TSX Capped Energy Fund Put 8,450 16-Feb-18 11.50 CAD (253,500) (92,950)
SPDR Euro Stoxx 50 ETF Put 17,060 19-Jan-18 37.00 USD (3,001,503) (39,497)
Union Pacific Corp. Put 362 19-Jan-18 100.00 USD (45,492) (1,592)
WisdomTree Europe Hedged Equity Fund Call 12,100 16-Feb-18 68.00 USD (168,398) (110,137)
(3,628,343) (324,651)
See accompanying notes which are an integral part of these financial statements

Sprott Enhanced Equity Class
Notes to financial statements – Fund specific information December 31, 2017
52
Financial Risk Management (note 6)
Investment Objective The Fund seeks to achieve long-term capital growth by investing primarily in Canadian and U.S. equity securities. The Fund provides downside
protection through the use of option strategies and tactical changes to the amount of its equity exposure, and is suitable for investors with a
long-term time horizon.
The Schedule of Investment Portfolio represents the securities held by the Fund as at December 31, 2017. Significant risks that are relevant to
the Fund are discussed here. General information on risk management is described in Note 6.
Market Risk
a) Other Price Risk
As at December 31, 2017 and 2016, if a blended index of the S&P/TSX Composite Total Return Index and S&P 500 Total Return Index in
Canadian dollar terms were to fluctuate by 10%, with all other variables held constant, Net Assets attributable to holders of redeemable shares
would increase or decrease by the amounts shown in the table below. This is a measure based on the historical relationship of the Fund’s
performance against the index noted above. The composition of this calculation contains several subjective components that, although
reasonably estimated, could alter the resulting calculation should these components be modified based on revised assumptions.
December 31, 2017 December 31, 2016
Impact
($’000)
As a % of Net Assets
attributable to holders
of redeemable shares
Impact
($’000)
As a % of Net Assets
attributable to holders
of redeemable shares
26,697 5.40% 41,106 5.50%
b) Currency Risk
The tables below summarize the Fund’s direct exposure to currency risk as at December 31, 2017 and 2016. The tables also illustrate the
potential impact to the Fund’s Net Assets attributable to holders of redeemable shares as a result of a 1% change in these currencies relative to
the Canadian dollar, with all other variables held constant.
December 31, 2017
Currency
Fair Value
($’000)
Forward
Currency
Contracts
($’000)
Net Exposure
($’000)
% of Net Assets
attributable to holders
of redeemable shares
Impact on Net Assets
attributable to holders
of redeemable shares
($’000)
U.S. Dollar 204,064 (182,724) 21,340 4.32 213
December 31, 2016
Currency
Fair Value
($’000)
Forward
Currency
Contracts
($’000)
Net Exposure
($’000)
% of Net Assets
attributable to holders
of redeemable shares
Impact on Net Assets
attributable to holders
of redeemable shares
($’000)
U.S. Dollar 475,218 (377,058) 98,160 13.13 982
Credit Risk As at December 31, 2017 and 2016, the Fund is exposed to credit risk from over-the-counter derivative contracts with counterparties. The credit
risk is considered minimal as these counterparties have a minimum credit rating of AA- by S&P or equivalent.

Sprott Enhanced Equity Class
Notes to financial statements – Fund specific information December 31, 2017
53
Concentration Risk The table below summarizes the Fund’s concentration risk as a percentage of Net Assets attributable to holders of redeemable shares as at
December 31, 2017 and 2016.
December 31, 2017 December 31, 2016
Equities:
Financials 24.09% 16.07%
Energy 20.42% 13.90%
Information Technology 13.07% 10.67%
Consumer Discretionary 8.66% 6.55%
Health Care 6.61% 5.76%
Industrials 6.45% 7.19%
Consumer Staples 5.46% 6.69%
Utilities 4.47% 3.48%
Real Estate 3.86% 2.69%
Unrealized appreciation on forward currency contracts 0.82% –
Unrealized depreciation on forward currency contracts – (0.23%)
Options purchased 0.27% 0.33%
Options written (0.07%) (0.26%)
Cash and Other Assets Less Liabilities 5.89% 27.16%
Total Net Assets attributable to holders of redeemable shares 100.00% 100.00%
Fair Value Measurements (note 5)
The Fund’s financial assets and liabilities measured at fair value have been categorized based upon the fair value hierarchy in the tables below
as at December 31, 2017 and 2016:
December 31, 2017
Level 1 Level 2 Level 3 Total $ $ $ $
Equities – Long 460,184,033 – – 460,184,033
Warrants 53,320 – – 53,320
Forward Currency Contracts – 4,043,573 – 4,043,573
Options purchased 1,314,340 – – 1,314,340
Options written (324,651) – – (324,651)
461,227,042 4,043,573 – 465,270,615
December 31, 2016
Level 1 Level 2 Level 3 Total $ $ $ $
Equities – Long 545,424,000 – – 545,424,000
Warrants 258,720 – – 258,720
Forward Currency Contracts – (1,743,307) – (1,743,307)
Options purchased 2,431,361 – – 2,431,361
Options written (1,964,663) – – (1,964,663)
546,149,418 (1,743,307) – 544,406,111
During the years ended December 31, 2017 and 2016, there were no significant transfers between levels.
Offsetting of Financial Instruments
In the normal course of business, the Fund enters into various master netting arrangements or other similar agreements that do not meet the
criteria for offsetting in the Statements of Financial Position but still allow for the related amounts to be set off in certain circumstances, such as
bankruptcy or termination of the contracts. The following table presents the over-the-counter derivatives that are offset, or subject to
enforceable master netting agreements or other similar agreements but that are not offset, as at December 31, 2017 and 2016. The “Net” column
shows what the impact on the Fund’s Statements of Financial Position would be if all set-off rights were exercised.

Sprott Enhanced Equity Class
Notes to financial statements – Fund specific information December 31, 2017
54
Financial assets and liabilities Amounts offset Amounts not offset Net
Gross
assets/liabilities
Gross
assets/liabilities
offset
Net
amounts
presented
Subject to
master
netting
arrangements
Cash
collateral
received $ $ $ $ $ $
December 31, 2017
Derivative assets 4,043,573 – 4,043,573 – – 4,043,573
Derivative liabilities – – – – – –
December 31, 2016
Derivative assets – – – – – –
Derivative liabilities 1,743,307 – 1,743,307 – – 1,743,307
Restricted Cash and Investments (note 11)
As at December 31, 2017, restricted cash and investments held for the Fund totaled $13,251,918 (2016 - $32,231,246).
Management Fees (note 12)
This fee differs among the series of shares of the Fund as set out in the chart below:
Series A Series A1 Series F Series F1 Series I* Series T Series FT
Up to 2.00% Up to 1.90% Up to 1.00% Up to 0.90% Negotiated by
the Shareholder
Up to 2.00% Up to 1.00%
* The management fee for Series I shares of the Fund is negotiated by the investor and paid directly by the investor or by the Fund, and would not exceed the
management fee for Series A shares of the Fund.
Sharing Arrangements (note 14) The Fund paid $11,377 out of the total transaction costs incurred to certain brokers for research expenses provided to the portfolio manager
during the year ended December 31, 2017 (2016 - $38,278).
Securities Lending (note 3)
As at December 31, 2017 and 2016 the market values of securities loaned and related collateral amounts were as follows:
December 31, 2017 December 31, 2016
$ $
Securities loaned – –
Collateral amounts – –
Collateral as a percentage of securities loaned – –
For the years ended December 31, 2017 and 2016, securities lending income was as follows:
December 31, 2017 December 31, 2016
$ $
Gross securities lending income 292,233 –
Securities lending charges (73,058) –
Net securities lending income 219,175 –
Withholding taxes on securities lending income (15,734) –
Net securities lending income received by the Fund 203,441 –
For the year ended December 31, 2017 securities lending charges represent 25% (2016 – nil%) of the gross securities lending income.
See accompanying generic notes which are an integral part of these financial statements

55
Sprott Enhanced Balanced Class
Statements of Financial Position (in Canadian Dollars)
As at December 31 2017 2016
$ $
Assets
Current assets
Investments (excluding derivatives) (note 3, 5, 11) 16,522,019 20,798,389
Cash (note 11) 1,359,017 3,723,252
Subscriptions receivable 16,100 100
Unrealized appreciation on forward currency contracts (note 3, 5) 88,210 -
Options purchased (note 3, 5) 28,904 50,986
Broker margin (note 11) 173,336 128,947
Dividends receivable 16,947 17,631
Due from broker 315,665 -
Total assets 18,520,198 24,719,305
Liabilities
Current liabilities
Due to broker 689,065 -
Options written (note 3, 5) 6,744 41,305
Redemptions payable 2,900 25,252
Unrealized depreciation on forward currency contracts (note 3, 5) - 37,064
Accrued expenses 20,431 11,141
Total liabilities 719,140 114,762
Net Assets attributable to holders of redeemable shares 17,801,058 24,604,543
Net Assets attributable to holders of redeemable shares per series
Series A 5,362,087 9,321,335
Series F 10,515,785 12,758,511
Series FT 667,024 658,837
Series T 1,256,162 1,865,860
Net Assets attributable to holders of redeemable shares per series per share (note 8)
Series A 11.15 10.71
Series F 11.72 11.13
Series FT 9.08 9.16
Series T 8.61 8.80
See accompanying notes which are an integral part of these financial statements
On behalf of the Manager, Ninepoint Partners LP,
by the Board of Directors of Sprott Corporate Class Inc.
James Fox Stuart J. Freeman
DIRECTOR DIRECTOR

56
Sprott Enhanced Balanced Class
Statements of Comprehensive Income (Loss)
(in Canadian Dollars, except share amounts)
For the years ended December 31 2017 2016
$ $
Income
Net gain (loss) on investments and derivatives:(1)
Interest income for distribution purposes (note 3) 29,656 5,913
Dividends (note 3) 201,696 234,677
Distribution income (note 3) 381,337 364,630
Net realized gains on sales of investments 416,206 192,102
Net realized gains (losses) on option contracts 294,654 (458,807)
Net realized gains (losses) on forward currency contracts 231,324 (29,768)
Change in unrealized appreciation in the value of investments 72,734 484,400
Change in unrealized appreciation (depreciation) on option contracts (55,537) 105,361
Change in unrealized appreciation (depreciation) on forward currency contracts 125,274 (70,478)
Net realized gains (losses) on foreign exchange (207,950) 24,525
Other income 1,749 1,664
Total income 1,491,143 854,219
Expenses (note 12, 13)
Management fees 294,436 409,005
Unitholder reporting costs 31,742 32,384
Administrative fees 21,245 40,158
Filing fees 17,495 29,357
Audit fees 14,769 13,796
Withholding taxes 11,112 18,020
Transaction costs (note 3, 14) 7,375 10,818
Legal fees 6,772 30,471
Directors' fees 6,658 4,323
Independent Review Committee fees (note 15) 4,988 4,690
Custodial fees 2,847 6,696
Net expenses 419,439 599,718
Increase in Net Assets attributable to holders of redeemable shares from operations 1,071,704 254,501
Increase in Net Assets attributable to holders of redeemable shares from operations per series
Series A 298,993 26,027
Series F 672,528 206,570
Series FT 33,973 13,365
Series T 66,210 8,539
Weighted average number of redeemable shares
Series A 619,787 1,045,882
Series F 1,058,246 1,254,751
Series FT 57,565 74,058
Series T 163,153 223,910
Increase in Net Assets attributable to holders of redeemable shares from operations per series per share (note 3)
Series A 0.48 0.02
Series F 0.64 0.16
Series FT 0.59 0.18
Series T 0.41 0.04
(1)Net gain (loss) on investments and derivatives comprised of:
Financial assets and liabilities designated at FVTPL 1,120,134 1,281,722
Financial assets and liabilities classified as HFT 577,210 (453,692)
1,697,344 828,030
See accompanying notes which are an integral part of these financial statements

57
Sprott Enhanced Balanced Class
Statements of Changes in Net Assets Attributable to Holders of Redeemable Shares (in Canadian Dollars, except share amounts)
For the years ended December 31 2017 2016 $ $
Net Assets attributable to holders of redeemable shares, beginning of year Series A 9,321,335 11,733,434
Series F 12,758,511 14,421,755
Series FT 658,837 688,398
Series T 1,865,860 2,083,552
24,604,543 28,927,139
Increase in Net Assets attributable to holders of redeemable shares from operations
Series A 298,993 26,027
Series F 672,528 206,570
Series FT 33,973 13,365
Series T 66,210 8,539
1,071,704 254,501
Distributions to holders of redeemable shares
From net investment income Series A (38,653) (18,575)
Series F (75,734) (25,435)
Series FT (4,863) (1,321)
Series T (9,147) (3,743)
From return of capital
Series A - -
Series F (1,745) (1,664)
Series FT (32,371) (42,301) Series T (83,647) (124,921)
(246,160) (217,960)
Redeemable share transactions (note 8) Proceeds from redeemable shares issued
Series A 409,602 1,720,927
Series F 2,227,631 2,043,733
Series FT 253,167 285,138
Series T 241,478 310,499
Reinvestments of distributions to holders of redeemable shares
Series A 38,493 18,629 Series F 71,661 25,727
Series FT 2,733 5,089
Series T 9,147 5,620
Redemption of redeemable shares
Series A (4,667,683) (4,159,107)
Series F (5,137,067) (3,912,175)
Series FT (244,452) (289,531)
Series T (833,739) (413,686)
(7,629,029) (4,359,137)
Net increase (decrease) in Net Assets attributable to holders of redeemable shares
Series A (3,959,248) (2,412,099) Series F (2,242,726) (1,663,244)
Series FT 8,187 (29,561)
Series T (609,698) (217,692)
(6,803,485) (4,322,596)
Net Assets attributable to holders of redeemable shares, end of year
Series A 5,362,087 9,321,335
Series F 10,515,785 12,758,511
Series FT 667,024 658,837
Series T 1,256,162 1,865,860
17,801,058 24,604,543

58
Sprott Enhanced Balanced Class
Statements of Changes in Net Assets Attributable to Holders of Redeemable Shares continued
Changes in outstanding redeemable shares of the Fund for the years ended December 31, 2017 and 2016 were as follows:
2017 2016
Series A Series F Series FT Series T Series A Series F Series FT Series T
Shares, beginning of year 870,506 1,146,179 71,906 212,132 1,100,590 1,316,165 71,660 223,104
Subscriptions 37,696 194,920 27,908 28,093 165,173 190,934 31,312 35,190
Reinvested from distributions 3,447 6,108 302 1,064 1,735 2,311 553 632
Redemptions (430,573) (449,885) (26,649) (95,330) (396,992) (363,231) (31,619) (46,794)
Shares, end of year 481,076 897,322 73,467 145,959 870,506 1,146,179 71,906 212,132
See accompanying notes which are an integral part of these financial statements

59
Sprott Enhanced Balanced Class
Statements of Cash Flows (in Canadian Dollars)
For the years ended December 31 2017 2016
$ $
Cash flows from operating activities
Increase in Net Assets attributable to holders of redeemable shares from operations 1,071,704 254,501
Adjustments for:
Foreign exchange (gains) on cash (19,395) (14,079)
Distribution income (381,337) (364,630)
Net realized (gains) on sales of investments (416,206) (192,102)
Net realized (gains) losses on options contracts (294,654) 458,807
Change in unrealized (appreciation) in the value of investments (72,734) (484,400)
Change in unrealized (appreciation) depreciation on forward currency contracts (125,274) 70,478
Change in unrealized (appreciation) depreciation on options contracts 55,537 (105,361)
Purchases of investments (4,668,240) (10,651,635)
Proceeds from sales of investments 10,414,925 13,782,354
Net increase (decrease) in other assets and liabilities (34,415) 2,181,316
Net cash provided by operating activities 5,529,911 4,935,249
Cash flows from financing activities
Distributions paid to holders of redeemable shares, net of reinvested distributions (124,126) (162,895)
Proceeds from redeemable shares issued 2,268,655 4,370,197
Redemption of redeemable shares (10,058,070) (8,788,211)
Net cash used in financing activities (7,913,541) (4,580,909)
Foreign exchange gains on cash 19,395 14,079
Net increase (decrease) in cash (2,383,630) 354,340
Cash at beginning of year 3,723,252 3,354,833
Cash at end of year 1,359,017 3,723,252
Supplemental Information
Interest received 29,656 5,913
Dividends received, net of withholding taxes 191,268 205,349
See accompanying notes which are an integral part of these financial statements

60
Sprott Enhanced Balanced Class
Schedule of Investment Portfolio As at December 31, 2017 Expiry Date Average Cost Fair Value
$ $ SHARES EQUITIES [56.60%]
FINANCIALS [15.41%]
11,500 Bank of America Corp. 366,022 426,627
4,400 Canadian Imperial Bank of Commerce 484,846 539,176
4,300 Citigroup Inc. 393,979 402,100
45,820 ECN Capital Corp. 150,762 180,073
38,020 Element Fleet Management Corp. 471,316 361,190 4,800 Intercontinental Exchange, Inc. 304,745 425,632
15,600 Manulife Financial Corp. 339,252 409,032
2,510,922 2,743,830
ENERGY [12.20%] 18,300 AltaGas Ltd. 566,970 519,171
8,600 Inter Pipeline Ltd. 224,098 223,858
14,400 Parex Resources Inc. 235,581 261,504
32,300 Precision Drilling Corp. 123,063 123,063
7,700 ShawCor Ltd. 250,173 211,134
11,530 Suncor Energy Inc. 404,314 532,110
4,920 TransCanada Corp. 227,576 301,006
2,031,775 2,171,846
INFORMATION TECHNOLOGY [8.01%]
9,250 CGI Group Inc. 427,858 631,774
4,100 Fiserv Inc. 568,856 675,647
11,700 Real Matters Inc. 147,102 117,936 1,750 Trilogy International Partners Inc., Warrants Feb 7, 2022 - 1,085
1,143,816 1,426,442
HEALTH CARE [4.23%] 1,000 Danaher Corp. 101,107 116,648
2,300 UnitedHealth Group Inc. 454,394 637,224
555,501 753,872
CONSUMER DISCRETIONARY [4.15%] 5,200 Comcast Corp. 222,983 261,722
17,000 Roots Corp. 204,000 191,590
1,200 The Home Depot Inc. 210,710 285,821
637,693 739,133
INDUSTRIALS [4.03%]
1,510 Northrop Grumman Corp. 365,355 582,400
800 Union Pacific Corp. 114,933 134,820
480,288 717,220
CONSUMER STAPLES [3.24%]
8,780 Alimentation Couche-Tard Inc., Class B 350,684 575,879
350,684 575,879
UTILITIES [2.86%] 9,030 Brookfield Infrastructure Partners LP 345,212 509,111
345,212 509,111
REAL ESTATE [2.47%] 15,790 Brookfield Property Partners LP 456,780 439,752
456,780 439,752
Total Equities 8,512,671 10,077,085
UNITS MUTUAL FUNDS [36.21%]
589,057 Sprott Diversified Bond Fund, Series I 6,344,401 6,444,934
Total Mutual Funds 6,344,401 6,444,934
Transaction Costs (note 3) (5,796)
Total Investments [92.81%] 14,851,276 16,522,019
Total unrealized appreciation on forward currency contracts [0.50%] (Schedule 1) 88,210
Options purchased [0.16%] (Schedule 2) 28,904
Options written [-0.04%] (Schedule 2) (6,744)
Cash and Other Assets Less Liabilities [6.57%] 1,168,669
Total Net Assets attributable to holders of redeemable shares [100.00%] 17,801,058
See accompanying notes which are an integral part of these financial statements

61
Sprott Enhanced Balanced Class
Forward Currency Contracts (Schedule 1)
As at December 31, 2017
Contract Cost Forward Value
Unrealized
Appreciation
Bought ($) Sold ($) Settlement Date $(CAD) $(CAD) $(CAD)
3,944,950 Canadian Dollar (3,070,000) U.S. Dollar 19-Jan-18 (3,944,950) (3,856,740) 88,210
Total 88,210
Option Contracts (Schedule 2)
As at December 31, 2017
Options Purchased
Premium Fair
Number of Expiration Strike Paid Value
Option Details Option Type Contracts Date Price ($) $(CAD) $(CAD)
Energy Select Sector SPDR Call 20 16-Mar-18 70.50 USD 2,966 8,106
iShares S&P TSX Capped Energy Fund Call 300 16-Feb-18 12.50 CAD 7,200 6,450
iShares S&P TSX Capped Energy Fund Call 80 16-Feb-18 12.00 CAD 1,360 3,860
iShares S&P TSX Capped Energy Fund Put 200 16-Feb-18 10.75 CAD 3,200 1,000
iShares S&P TSX Capped Energy Fund Put 100 16-Feb-18 11.00 CAD 1,800 700
SPDR Euro Stoxx 50 ETF Put 330 19-Jan-18 34.00 USD 31,103 137
SPDR S&P 500 ETF Trust Call 150 19-Jan-18 271.00 USD 14,138 6,032
Union Pacific Corp. Put 8 19-Jan-18 110.00 USD 2,916 106
WisdomTree Europe Hedged Equity Fund Call 200 16-Feb-18 67.00 USD 7,792 2,513
72,475 28,904
Options Written
Premium Fair
Number of Expiration Strike Received Value
Option Details Option Type Contracts Date Price ($) $(CAD) $(CAD)
iShares S&P TSX Capped Energy Fund Call 50 16-Feb-18 13.00 CAD (150) (375)
iShares S&P TSX Capped Energy Fund Put 100 16-Feb-18 11.75 CAD (3,650) (1,550)
iShares S&P TSX Capped Energy Fund Put 200 16-Feb-18 11.50 CAD (6,000) (2,200)
SPDR Euro Stoxx 50 ETF Put 330 19-Jan-18 37.00 USD (58,060) (764)
Union Pacific Corp. Put 8 19-Jan-18 100.00 USD (1,005) (35)
WisdomTree Europe Hedged Equity Fund Call 200 16-Feb-18 68.00 USD (2,764) (1,820)
(71,629) (6,744)
See accompanying notes which are an integral part of these financial statements

Sprott Enhanced Balanced Class
Notes to financial statements – Fund specific information December 31, 2017
62
Financial Risk Management (note 6)
Investment Objective The Fund seeks to achieve long-term capital growth and income. The Fund invests primarily in equities and fixed-income securities of
Canadian issuers, and may invest a portion of its assets in foreign equities and fixed-income securities. The Fund will seek to enhance income
generation by employing investment strategies such as short selling and options trading.
The Schedule of Investment Portfolio represents the securities held by the Fund as at December 31, 2017. Significant risks that are relevant to
the Fund are discussed here. As the Fund invests in underlying funds, it may be indirectly exposed to other price risk, currency risk, interest rate
risk, credit risk and concentration risk from these holdings. As at December 31, 2017, 36.21% (2016 - 40.85%) of the Fund’s Net Assets
attributable to holders of redeemable shares were invested in mutual fund units. Only direct exposure to significant risks that are relevant to the
Fund are discussed here. For more information regarding the risks of the underlying funds, refer to each underlying fund’s financial statements.
General information on risk management is described in Note 6.
Market Risk
a) Other Price Risk
As at December 31, 2017 and 2016, if a blended index of the S&P/TSX Composite Total Return Index, S&P 500 Total Return Index and FTSE
TMX Canada Universe Bond Index Return were to fluctuate by 10%, with all other variables held constant, Net Assets attributable to holders
of redeemable shares would increase or decrease by the amounts shown in the table below. This is a measure based on the historical
relationship of the Fund’s performance against the index noted above. The composition of this calculation contains several subjective
components that, although reasonably estimated, could alter the resulting calculation should these components be modified based on revised
assumptions. As at December 31, 2017, approximately 56.60% (2016 – 43.68%) of the Fund’s Net Assets attributable to holders of redeemable
shares were invested in equities that were exposed to market price fluctuations.
December 31, 2017 December 31, 2016
Impact ($’000)
As a % of Net Assets
attributable to holders
of redeemable shares Impact ($’000)
As a % of Net Assets
attributable to holders
of redeemable shares
961 5.40% 1,427 5.80%
b) Currency Risk
The tables below summarize the Fund’s direct exposure to currency risk as at December 31, 2017 and 2016. The tables also illustrate the
potential impact to the Fund’s Net Assets attributable to holders of redeemable shares as a result of a 1% change in these currencies relative to
the Canadian dollar, with all other variables held constant.
December 31, 2017
Currency
Fair Value
($’000)
Forward
Currency
Contracts
($’000)
Net Exposure
($’000)
% of Net Assets
attributable to holders
of redeemable shares
Impact on Net Assets
attributable to holders
of redeemable shares
($’000)
U.S. Dollar 5,155 (3,858) 1,297 7.28 13
December 31, 2016
Currency
Fair Value
($’000)
Forward
Currency
Contracts
($’000)
Net Exposure
($’000)
% of Net Assets
attributable to holders
of redeemable shares
Impact on Net Assets
attributable to holders
of redeemable shares
($’000)
U.S. Dollar 9,354 (8,017) 1,337 5.44 13

Sprott Enhanced Balanced Class
Notes to financial statements – Fund specific information December 31, 2017
63
Credit Risk As at December 31, 2017 and 2016, the Fund is exposed to credit risk from over-the-counter derivative contracts with counterparties. The credit
risk is considered minimal as these counterparties have a minimum credit rating of AA- by S&P or equivalent.
Concentration Risk The table below summarizes the Fund’s concentration risk as a percentage of Net Assets attributable to holders of redeemable shares as at
December 31, 2017 and 2016.
December 31, 2017 December 31, 2016
Equities:
Financials 15.41% 10.03%
Energy 12.20% 8.96%
Information Technology 8.01% 6.03%
Health Care 4.23% 3.97%
Consumer Discretionary 4.15% 2.05%
Industrials 4.03% 4.50%
Consumer Staples 3.24% 4.21%
Utilities 2.86% 2.56%
Real Estate 2.47% 1.37%
Mutual Funds 36.21% 40.85%
Unrealized appreciation on forward currency contracts 0.50% –
Unrealized depreciation on forward currency contracts – (0.15%)
Options purchased 0.16% 0.21%
Options written (0.04%) (0.17%)
Cash and Other Assets Less Liabilities 6.57% 15.58%
Total Net Assets attributable to holders of redeemable shares 100.00% 100.00%
Fair Value Measurements (note 5)
The Fund’s financial assets and liabilities measured at fair value have been categorized based upon the fair value hierarchy in the tables below
as at December 31, 2017 and 2016:
December 31, 2017
Level 1 Level 2 Level 3 Total
$ $ $ $
Equities – Long 10,076,000 – – 10,076,000
Mutual Funds 6,444,934 – – 6,444,934
Warrants 1,085 – – 1,085
Forward Currency Contracts – 88,210 – 88,210
Options purchased 28,904 – – 28,904
Options written (6,744) – – (6,744)
16,544,179 88,210 – 16,632,389
December 31, 2016
Level 1 Level 2 Level 3 Total
$ $ $ $
Equities – Long 10,742,005 – – 10,742,005
Mutual Funds 10,051,174 – – 10,051,174
Warrants 5,210 – – 5,210
Forward Currency Contracts – (37,064) – (37,064)
Options purchased 50,986 – – 50,986
Options written (41,305) – – (41,305)
20,808,070 (37,064) – 20,771,006
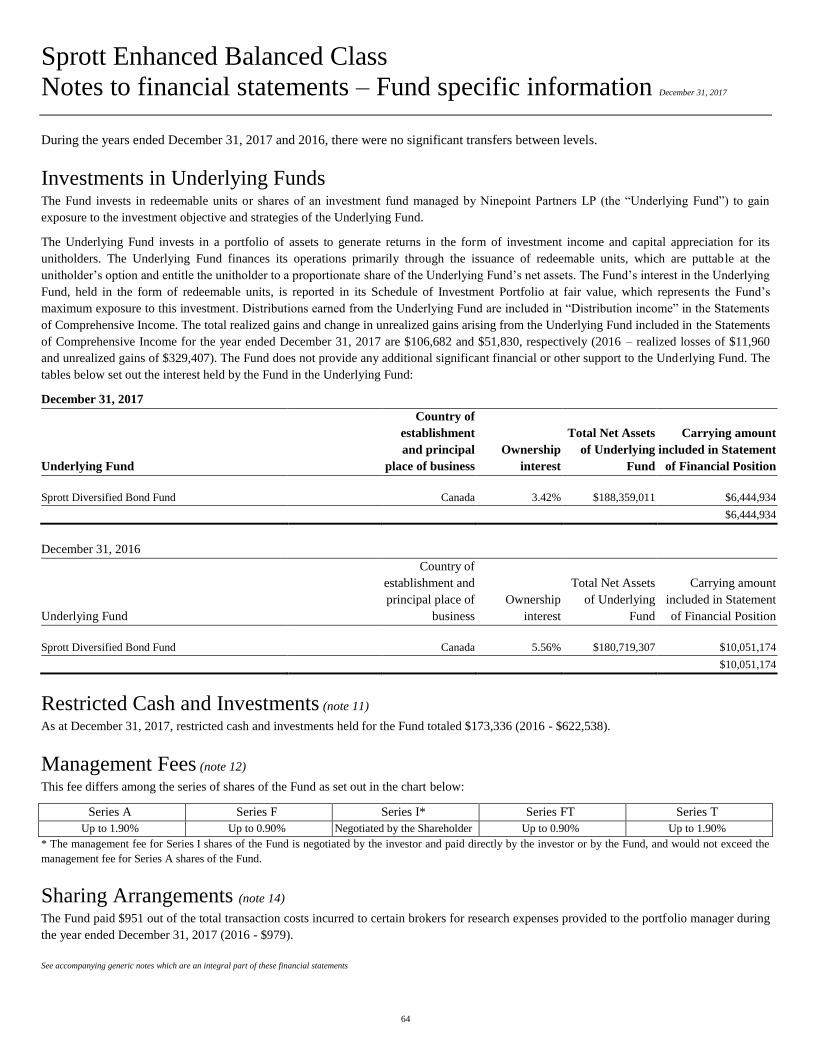
Sprott Enhanced Balanced Class
Notes to financial statements – Fund specific information December 31, 2017
64
During the years ended December 31, 2017 and 2016, there were no significant transfers between levels.
Investments in Underlying Funds The Fund invests in redeemable units or shares of an investment fund managed by Ninepoint Partners LP (the “Underlying Fund”) to gain
exposure to the investment objective and strategies of the Underlying Fund.
The Underlying Fund invests in a portfolio of assets to generate returns in the form of investment income and capital appreciation for its
unitholders. The Underlying Fund finances its operations primarily through the issuance of redeemable units, which are puttable at the
unitholder’s option and entitle the unitholder to a proportionate share of the Underlying Fund’s net assets. The Fund’s interest in the Underlying
Fund, held in the form of redeemable units, is reported in its Schedule of Investment Portfolio at fair value, which represents the Fund’s
maximum exposure to this investment. Distributions earned from the Underlying Fund are included in “Distribution income” in the Statements
of Comprehensive Income. The total realized gains and change in unrealized gains arising from the Underlying Fund included in the Statements
of Comprehensive Income for the year ended December 31, 2017 are $106,682 and $51,830, respectively (2016 – realized losses of $11,960
and unrealized gains of $329,407). The Fund does not provide any additional significant financial or other support to the Underlying Fund. The
tables below set out the interest held by the Fund in the Underlying Fund:
December 31, 2017
Underlying Fund
Country of
establishment
and principal
place of business
Ownership
interest
Total Net Assets
of Underlying
Fund
Carrying amount
included in Statement
of Financial Position
Sprott Diversified Bond Fund Canada 3.42% $188,359,011 $6,444,934
$6,444,934
December 31, 2016
Underlying Fund
Country of
establishment and
principal place of
business
Ownership
interest
Total Net Assets
of Underlying
Fund
Carrying amount
included in Statement
of Financial Position
Sprott Diversified Bond Fund Canada 5.56% $180,719,307 $10,051,174
$10,051,174
Restricted Cash and Investments (note 11)
As at December 31, 2017, restricted cash and investments held for the Fund totaled $173,336 (2016 - $622,538).
Management Fees (note 12)
This fee differs among the series of shares of the Fund as set out in the chart below:
Series A Series F Series I* Series FT Series T
Up to 1.90% Up to 0.90% Negotiated by the Shareholder Up to 0.90% Up to 1.90%
* The management fee for Series I shares of the Fund is negotiated by the investor and paid directly by the investor or by the Fund, and would not exceed the
management fee for Series A shares of the Fund.
Sharing Arrangements (note 14) The Fund paid $951 out of the total transaction costs incurred to certain brokers for research expenses provided to the portfolio manager during
the year ended December 31, 2017 (2016 - $979).
See accompanying generic notes which are an integral part of these financial statements

65
Sprott Real Asset Class
Statements of Financial Position (in Canadian Dollars)
As at December 31 2017 2016
$ $
Assets
Current assets
Investments (note 3, 5) 10,039,583 12,852,296
Cash 161,200 7,547,566
Subscriptions receivable - 75,289
Dividends receivable 1,821 1,949
Total assets 10,202,604 20,477,100
Liabilities
Current liabilities
Redemptions payable 5,663 13,833
Accrued expenses 15,971 7,533
Total liabilities 21,634 21,366
Net Assets attributable to holders of redeemable shares 10,180,970 20,455,734
Net Assets attributable to holders of redeemable shares per series
Series A 8,975,887 16,257,725
Series F 1,205,083 4,198,009
Net Assets attributable to holders of redeemable shares per series per share (note 8)
Series A 9.32 10.15
Series F 9.69 10.42
See accompanying notes which are an integral part of these financial statements
On behalf of the Manager, Ninepoint Partners LP,
by the Board of Directors of Sprott Corporate Class Inc.
James Fox Stuart J. Freeman
DIRECTOR DIRECTOR

66
Sprott Real Asset Class
Statements of Comprehensive Income (Loss)
(in Canadian Dollars, except share amounts)
For the years ended December 31 2017 2016
$ $
Income
Net gain (loss) on investments:(1)
Interest income for distribution purposes (note 3) 626 -
Dividends (note 3) 9,179 32,627
Distribution income (note 3) 316,686 2,694,583
Net realized losses on sales of investments (2,263,159) (633,333)
Change in unrealized appreciation (depreciation) in the value of investments 1,250,982 (874,617)
Net realized gains (losses) on foreign exchange (74,679) 112
Other income 46 68
Total income (loss) (760,319) 1,219,440
Expenses (note 12, 13)
Management fees 352,034 338,274
Unitholder reporting costs 46,237 42,075
Administrative fees 13,101 16,072
Audit fees 9,883 9,115
Filing fees 8,570 19,855
Legal fees 6,880 45,327
Directors' fees 6,765 4,324
Independent Review Committee fees (note 15) 5,068 4,690
Custodial fees 2,069 1,547
Withholding taxes - 4,942
Transaction costs (note 3, 14) - 314
Total expenses 450,607 486,535
Increase (decrease) in Net Assets attributable to holders of redeemable shares from operations (1,210,926) 732,905
Increase (decrease) in Net Assets attributable to holders of redeemable shares from operations per series
Series A (990,109) 482,501
Series F (220,817) 250,404
Weighted average number of redeemable shares
Series A 1,335,146 1,059,299
Series F 248,742 614,712
Increase (decrease) in Net Assets attributable to holders of redeemable shares from operations per series
per share (note 3)
Series A (0.74) 0.46
Series F (0.89) 0.41
(1)Net gain (loss) on investments comprised of:
Financial assets and liabilities designated at FVTPL (685,686) 1,219,260
Financial assets and liabilities classified as HFT - -
(685,686) 1,219,260
See accompanying notes which are an integral part of these financial statements

67
Sprott Real Asset Class
Statements of Changes in Net Assets Attributable to Holders of Redeemable Shares (in Canadian Dollars, except share amounts)
For the years ended December 31 2017 2016
$ $
Net Assets attributable to holders of redeemable shares, beginning of year
Series A 16,257,725 12,072,353
Series F 4,198,009 8,420,724
20,455,734 20,493,077
Increase (decrease) in Net Assets attributable to holders of redeemable shares from operations
Series A (990,109) 482,501
Series F (220,817) 250,404
(1,210,926) 732,905
Distributions to holders of redeemable shares
From return of capital
Series A (433,636) (334,959)
Series F (80,485) (192,084)
(514,121) (527,043)
Redeemable share transactions (note 8)
Proceeds from redeemable shares issued
Series A 1,348,580 8,380,052
Series F 1,171,770 1,379,445
Reinvestments of distributions to holders of redeemable shares
Series A 406,093 315,959
Series F 70,649 149,542
Redemption of redeemable shares
Series A (7,612,766) (4,658,181)
Series F (3,934,043) (5,810,022)
(8,549,717) (243,205)
Net increase (decrease) in Net Assets attributable to holders of redeemable shares
Series A (7,281,838) 4,185,372
Series F (2,992,926) (4,222,715)
(10,274,764) (37,343)
Net Assets attributable to holders of redeemable shares, end of year
Series A 8,975,887 16,257,725
Series F 1,205,083 4,198,009
10,180,970 20,455,734
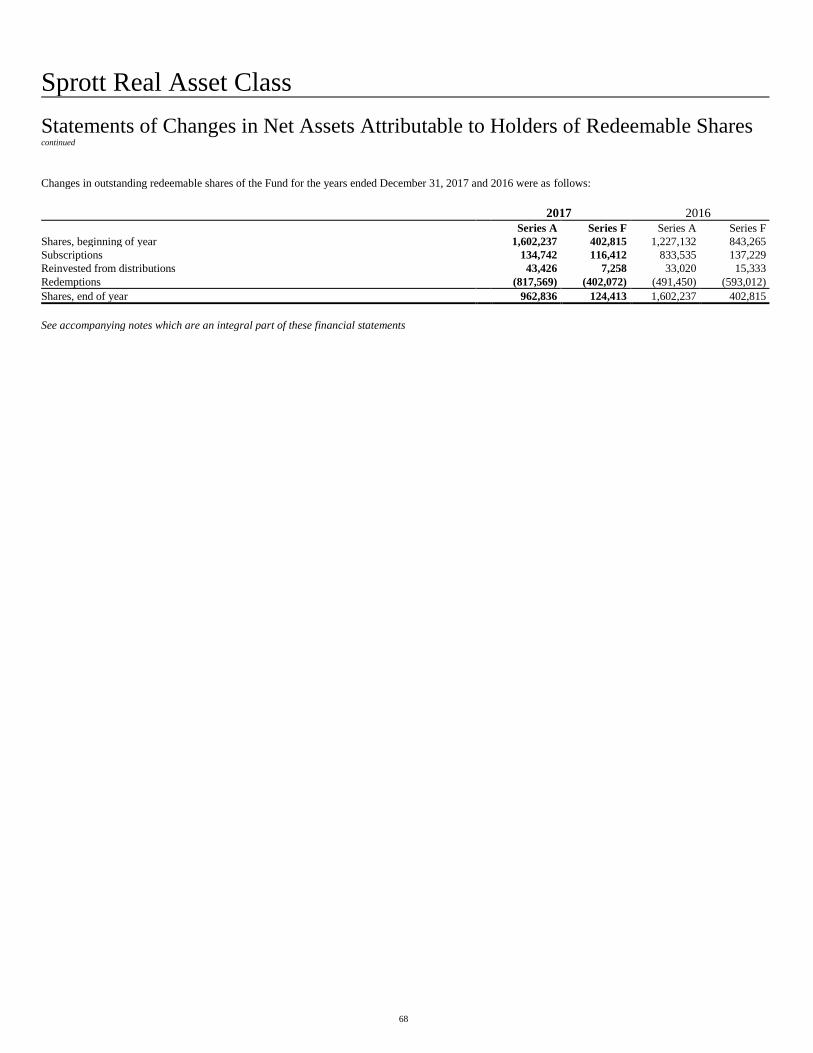
68
Sprott Real Asset Class
Statements of Changes in Net Assets Attributable to Holders of Redeemable Shares continued
Changes in outstanding redeemable shares of the Fund for the years ended December 31, 2017 and 2016 were as follows:
2017 2016
Series A Series F Series A Series F
Shares, beginning of year 1,602,237 402,815 1,227,132 843,265
Subscriptions 134,742 116,412 833,535 137,229
Reinvested from distributions 43,426 7,258 33,020 15,333
Redemptions (817,569) (402,072) (491,450) (593,012)
Shares, end of year 962,836 124,413 1,602,237 402,815
See accompanying notes which are an integral part of these financial statements

69
Sprott Real Asset Class
Statements of Cash Flows (in Canadian Dollars)
For the years ended December 31 2017 2016
$ $
Cash flows from operating activities
Increase (decrease) in Net Assets attributable to holders of redeemable shares from operations (1,210,926) 732,905
Adjustments for:
Foreign exchange losses on cash 11 -
Distribution income (316,686) (2,694,583)
Net realized losses on sales of investments 2,263,159 633,333
Change in unrealized (appreciation) depreciation in the value of investments (1,250,982) 874,617
Purchases of investments (20,688,927) (4,063,625)
Proceeds from sales of investments 22,806,149 13,578,223
Net increase (decrease) in other assets and liabilities 8,566 7,157
Net cash provided by operating activities 1,610,364 9,068,027
Cash flows from financing activities
Distributions paid to holders of redeemable shares, net of reinvested distributions (37,379) (61,542)
Proceeds from redeemable shares issued 2,387,294 9,769,808
Redemption of redeemable shares (11,346,634) (10,983,193)
Net cash used in financing activities (8,996,719) (1,274,927)
Foreign exchange (losses) on cash (11) -
Net increase (decrease) in cash (7,386,355) 7,793,100
Cash (Bank indebtedness) at beginning of year 7,547,566 (245,534)
Cash at end of year 161,200 7,547,566
Supplemental Information
Interest received 626 -
Dividends received, net of withholding taxes 9,307 34,310
See accompanying notes which are an integral part of these financial statements

70
Sprott Real Asset Class
Schedule of Investment Portfolio As at December 31, 2017 Maturity Date Average Cost Fair Value
$ $
PAR VALUE BONDS AND CONVERTIBLE DEBENTURES [0.06%]
31,300 Estrella International Energy Services Ltd.**, 4.00% Dec 31, 2018 18,780 6,260
Total Bonds and Convertible Debentures 18,780 6,260
UNITS MUTUAL FUNDS [98.55%]
412,902 Sprott Energy Fund, Series I 3,590,527 2,735,927
253,465 Sprott Global Infrastructure Fund, Series I 2,404,374 2,421,604
208,557 Sprott Global Real Estate Fund, Series I 2,220,588 2,491,475
396,329 Sprott Gold and Precious Minerals Fund, Series I 2,394,579 2,384,317
Total Mutual Funds 10,610,068 10,033,323
Total Investments [98.61%] 10,628,848 10,039,583
Cash and Other Assets Less Liabilities [1.39%] 141,387
Total Net Assets attributable to holders of redeemable shares [100.00%] 10,180,970
** Private Company.
See accompanying notes which are an integral part of these financial statements

Sprott Real Asset Class
Notes to financial statements – Fund specific information December 31, 2017
71
Financial Risk Management (note 6)
Investment Objective The investment objective of the Fund is to seek to provide total return over the long term by investing in a portfolio of mutual funds that are
managed by the Manager, its associates or its affiliates in various real asset sectors of the global economy. The Fund may also invest directly in
equity securities and/or exchange-traded funds operating in, or providing exposure to, the real asset sector.
The Schedule of Investment Portfolio represents the securities held by the Fund as at December 31, 2017. Significant risks that are relevant to
the Fund are discussed here. As the Fund invests in underlying funds, it may be indirectly exposed to other price risk, currency risk, interest rate
risk, credit risk and concentration risk from these holdings. As at December 31, 2017, 98.55% (2016 - 62.83%) of the Fund’s Net Assets
attributable to holders of redeemable shares were invested in mutual fund units. Only direct exposure to significant risks that are relevant to the
Fund are discussed here. For more information regarding the risks of the underlying funds, refer to each underlying fund’s financial statements.
General information on risk management is described in Note 6.
Market Risk
a) Other Price Risk
As at December 31, 2017 and 2016, the Fund did not have a significant exposure to other price risk.
b) Currency Risk
As at December 31, 2017 and 2016, the Fund did not have a significant exposure to currency risk.
c) Interest Rate Risk
As at December 31, 2017 and 2016, the Fund did not have a significant exposure to interest rate risk.
Concentration Risk The table below summarizes the Fund’s concentration risk as a percentage of Net Assets attributable to holders of redeemable shares as at
December 31, 2017 and 2016.
December 31, 2017 December 31, 2016
Bonds and Convertible Debentures 0.06% –
Mutual Funds 98.55% 62.83%
Cash and Other Assets Less Liabilities 1.39% 37.17%
Total Net Assets attributable to holders of redeemable shares 100.00% 100.00%
Fair Value Measurements (note 5)
The Fund’s assets and liabilities measured at fair value have been categorized based upon the fair value hierarchy in the tables below as at
December 31, 2017 and 2016:
December 31, 2017
Level 1 Level 2 Level 3 Total $ $ $ $
Bonds and Convertible Debentures – – 6,260 6,260
Mutual Funds 10,033,323 – – 10,033,323
10,033,323 – 6,260 10,039,583
December 31, 2016
Level 1 Level 2 Level 3 Total $ $ $ $
Mutual Funds 12,852,296 – – 12,852,296

Sprott Real Asset Class
Notes to financial statements – Fund specific information December 31, 2017
72
During the years ended December 31, 2017 and 2016, there were no significant transfers between levels other than the transfers indicated
below.
The reconciliation of investments measured at fair value using unobservable inputs (Level 3) for the year ended December 31, 2017 is
presented as follows:
December 31, 2017
Bonds and Convertible
Debentures
$
Balance at beginning of year –
Purchases 18,780
Change in unrealized losses (12,520)
Balance at end of year 6,260
Change in unrealized losses during the year for investments held at end of year (12,520)
The Fund’s Level 3 securities consist of private equity positions. The Manager determines their fair value by utilizing a variety of valuation
techniques such as the use of comparable recent transactions, discounted cash flows and other techniques used by market participants. As at
December 31, 2017, these positions were not significant to the Fund and any changes in reasonable possible assumptions used in their valuation
would not have a significant impact to the Net Assets attributable to holders of redeemable units of the Fund. As at December 31, 2016, the
Fund did not hold any Level 3 securities.
Investments in Underlying Funds The Fund invests in redeemable units or shares of other investment funds managed by Ninepoint Partners LP (the “Underlying Funds”) to gain
exposure to the investment objective and strategies of the Underlying Funds.
Each Underlying Fund invests in a portfolio of assets to generate returns in the form of investment income and capital appreciation for its
unitholders. Each Underlying Fund finances its operations primarily through the issuance of redeemable units, which are puttable at the
unitholder’s option and entitle the unitholder to a proportionate share of the Underlying Fund’s net assets. The Fund’s interests in Underlying
Funds, held in the form of redeemable units, are reported in its Schedule of Investment Portfolio at fair value, which represent the Fund’s
maximum exposure to these investments. Distributions earned from Underlying Funds are included in “Distribution income” in the Statements
of Comprehensive Income. The total realized losses and change in unrealized gains arising from Underlying Funds included in the Statement of
Comprehensive Income for the year ended December 31, 2017 are $1,187,720 and $1,263,502, respectively (2016 – realized losses of $790,394
and unrealized losses of $663,545). The Fund does not provide any additional significant financial or other support to any Underlying Funds.
The tables below set out the interest held by the Fund in Underlying Funds:
December 31, 2017
Underlying Fund
Country of
establishment
and principal
place of business
Ownership
interest
Total Net Assets
of Underlying
Fund
Carrying amount
included in
Statement of
Financial Position
Sprott Energy Fund Canada 1.72% $158,702,682 $2,735,927
Sprott Global Infrastructure Fund Canada 18.07% $13,400,793 $2,421,604
Sprott Global Real Estate Fund Canada 16.81% $14,825,169 $2,491,475
Sprott Gold and Precious Minerals Fund Canada 1.44% $165,423,202 $2,384,317
$10,033,323

Sprott Real Asset Class
Notes to financial statements – Fund specific information December 31, 2017
73
December 31, 2016
Underlying Fund
Country of
establishment and
principal place of
business
Ownership
interest
Total Net Assets
of Underlying
Fund
Carrying amount
included in Statement
of Financial Position
Sprott Global Infrastructure Fund Canada 25.23% $12,979,876 $3,275,228
Sprott Global Real Estate Fund Canada 54.23% $17,659,488 $9,577,068
$12,852,296
Management Fees (note 12)
This fee differs among the series of shares of the Fund as set out in the chart below:
Series A Series F Series I*
Up to 2.25% Up to 1.25% Negotiated by the
Shareholder
* The management fee for Series I shares of the Fund is negotiated by the investor and paid directly by the investor or by the Fund, and would not exceed the
management fee for Series A shares of the Fund.
Related Party Holdings Ninepoint Financial Group, the parent company of the Fund manager, and Sprott Inc., the parent company of the previous Fund manager, and
their respective subsidiaries, held the following investments in the Fund as at December 31, 2017 and 2016, respectively:
December 31, 2017 December 31, 2016 Shares held
Series A 112 16,981
Value of shares held ($) 1,040 172,306
Fund Mergers During the year ended December 31, 2016, the Fund acquired all the assets of the funds listed below (the “Acquired Funds”), and in exchange,
the Fund issued shares to such funds. In turn, those shares were distributed to the unitholders of those Acquired Funds. The Manager was the
investment advisor to the Acquired Funds. Tax elections were made which allowed the transfer of assets to occur on a tax-deferred basis.
Transfer Date Acquired Funds
Fair Value of Assets Acquired by
the Fund
Number of shares issued by the
Fund to the Acquired Fund
December 30, 2016 Sprott Tactical Balanced Fund $5,382,249 529,509
December 30, 2016 Sprott Tactical Balanced Class $2,134,207 209,965
See accompanying generic notes which are an integral part of these financial statements

74
Sprott Enhanced U.S. Equity Class
Statements of Financial Position (in U.S. Dollars)
As at December 31 2017 2016
$ $
Assets
Current assets
Investments (excluding derivatives) (note 3, 5, 11) 10,706,252 11,692,311
Cash (note 11) 6,134,048 8,036,352
Unrealized appreciation on forward currency contracts (note 3, 5) 169,695 17,266
Options purchased (note 3, 5) 47,953 28,350
Broker margin (note 11) 332,823 1,008,383
Subscriptions receivable 7,291 -
Dividends receivable 15,660 18,233
Total assets 17,413,722 20,800,895
Liabilities
Current liabilities
Options written (note 3, 5) 11,856 24,750
Redemptions payable - 34,351
Accrued expenses 26,711 16,963
Total liabilities 38,567 76,064
Net Assets attributable to holders of redeemable shares 17,375,155 20,724,831
Net Assets attributable to holders of redeemable shares per series
Series A 3,614,520 5,972,609
Series AH 5,344,964 2,005,714
Series F 5,406,604 8,313,522
Series FH 2,570,049 2,954,274
Series FT 286,384 1,248,906
Series T 152,634 229,806
Net Assets attributable to holders of redeemable shares per series per share (note 8)
Series A 10.29 9.43
Series AH 10.83 9.34
Series F 10.59 9.59
Series FH 11.24 9.60
Series FT 9.20 8.85
Series T 8.90 8.64
Series AH $CAD 13.60 12.54
Series FH $CAD 14.13 12.90
See accompanying notes which are an integral part of these financial statements
On behalf of the Manager, Ninepoint Partners LP,
by the Board of Directors of Sprott Corporate Class Inc.
James Fox Stuart J. Freeman
DIRECTOR DIRECTOR

75
Sprott Enhanced U.S. Equity Class
Statements of Comprehensive Income (Loss) (in U.S. Dollars, except share amounts)
For the years ended December 31 2017 2016 $ $
Income Net gain (loss) on investments and derivatives:(1)
Interest income for distribution purposes (note 3) 81,747 56
Dividends (note 3) 166,870 440,248
Net realized gains (losses) on sales of investments 133,934 (1,305,595)
Net realized gains (losses) on option contracts 535,909 (941,192)
Net realized gains on forward currency contracts 244,666 107,250
Change in unrealized appreciation in the value of investments 1,373,865 1,085,549
Change in unrealized appreciation (depreciation) on option contracts (55,691) 162,843 Change in unrealized appreciation on forward currency contracts 152,429 13,661
Securities lending income (note 3) - 30,156
Net realized gains (losses) on foreign exchange (21,244) 223,851
Other income 12 353
Total income (loss) 2,612,497 (182,820)
Expenses (note 12, 13)
Management fees 302,185 421,132
Unitholder reporting costs 57,868 55,173
Administrative fees 22,377 49,975
Filing fees 19,767 24,616 Withholding taxes 16,877 38,381
Audit fees 6,419 7,980
Directors' fees 5,181 4,324
Transaction costs (note 3, 14) 5,006 12,347
Legal fees 4,910 48,414
Custodial fees 3,899 4,581
Independent Review Committee fees (note 15) 3,864 4,376
Total expenses 448,353 671,299
Expenses waived/absorbed by the Manager (note 13) - (32,325)
Net expenses 448,353 638,974
Increase (decrease) in Net Assets attributable to holders of redeemable shares from operations 2,164,144 (821,794)
Increase (decrease) in Net Assets attributable to holders of redeemable shares from operations per series
Series A 419,924 (229,857)
Series AH 638,187 28,524
Series F 640,238 (583,001)
Series FH 397,173 104,194
Series FT 52,297 (119,545)
Series T 16,325 (22,109)
Weighted average number of redeemable shares
Series A 504,124 739,488
Series AH 382,152 175,953 Series F 654,207 1,565,779
Series FH 240,894 382,703
Series FT 62,657 185,261
Series T 20,762 47,737
Increase (decrease) in Net Assets attributable to holders of redeemable shares from operations per series per share (note 3)
Series A 0.83 (0.31)
Series AH 1.67 0.16
Series F 0.98 (0.37)
Series FH 1.65 0.27
Series FT 0.83 (0.65) Series T 0.79 (0.46)
(1)Net gain (loss) on investments and derivatives comprised of:
Financial assets and liabilities designated at FVTPL 1,756,416 220,258 Financial assets and liabilities classified as HFT 877,313 (657,438)
2,633,729 (437,180)
See accompanying notes which are an integral part of these financial statements

76
Sprott Enhanced U.S. Equity Class
Statements of Changes in Net Assets Attributable to Holders of Redeemable Shares (in U.S. Dollars, except share amounts)
For the years ended December 31 2017 2016
$ $
Net Assets attributable to holders of redeemable shares, beginning of year
Series A 5,972,609 7,547,049
Series AH 2,005,714 1,080,349
Series F 8,313,522 19,957,162
Series FH 2,954,274 1,375,020
Series FT 1,248,906 3,820,526
Series T 229,806 544,076
20,724,831 34,324,182
Increase (decrease) in Net Assets attributable to holders of redeemable shares from operations
Series A 419,924 (229,857)
Series AH 638,187 28,524
Series F 640,238 (583,001)
Series FH 397,173 104,194
Series FT 52,297 (119,545)
Series T 16,325 (22,109)
2,164,144 (821,794)
Distributions to holders of redeemable shares
From net investment income
Series A (16,377) -
Series AH (24,020) -
Series F (24,578) -
Series FH (11,513) -
Series FT (1,304) -
Series T (699) -
From return of capital
Series A - -
Series AH - -
Series F - -
Series FH - -
Series FT (29,727) (101,052)
Series T (10,582) (26,330)
(118,800) (127,382)

77
Sprott Enhanced U.S. Equity Class
Statements of Changes in Net Assets Attributable to Holders of Redeemable Shares
continued (in U.S. Dollars, except share amounts)
For the years ended December 31 2017 2016
$ $
Redeemable share transactions (note 8)
Proceeds from redeemable shares issued
Series A 665,534 2,840,887
Series AH 3,355,504 1,753,795
Series F 1,084,472 3,831,760
Series FH 438,060 3,917,725
Series FT 12,203 763,902
Series T - 276,593
Reinvestments of distributions to holders of redeemable shares
Series A 16,165 -
Series AH 24,000 -
Series F 22,020 -
Series FH 11,513 -
Series FT 12,737 62,568
Series T 1,323 10,261
Redemption of redeemable shares
Series A (3,443,335) (4,185,470)
Series AH (654,421) (856,954)
Series F (4,629,070) (14,892,399)
Series FH (1,219,458) (2,442,665)
Series FT (1,008,728) (3,177,493)
Series T (83,539) (552,685)
(5,395,020) (12,650,175)
Net increase (decrease) in Net Assets attributable to holders of redeemable shares
Series A (2,358,089) (1,574,440)
Series AH 3,339,250 925,365
Series F (2,906,918) (11,643,640)
Series FH (384,225) 1,579,254
Series FT (962,522) (2,571,620)
Series T (77,172) (314,270)
(3,349,676) (13,599,351)
Net Assets attributable to holders of redeemable shares, end of year
Series A 3,614,520 5,972,609
Series AH 5,344,964 2,005,714
Series F 5,406,604 8,313,522
Series FH 2,570,049 2,954,274
Series FT 286,384 1,248,906
Series T 152,634 229,806
17,375,155 20,724,831

78
Sprott Enhanced U.S. Equity Class
Statements of Changes in Net Assets Attributable to Holders of Redeemable Shares continued Changes in outstanding redeemable shares of the Fund for the years ended December 31, 2017 and 2016 were as follows:
2017 2016
Series A Series AH Series F Series FH Series FT Series T Series A Series AH Series F Series FH Series FT Series T
Shares, beginning of year 633,663 214,818 867,120 307,613 141,146 26,584 777,979 114,462 2,045,906 143,090 398,975 57,191
Subscriptions 70,004 343,703 110,689 42,478 1,370 - 304,070 191,486 407,750 419,908 83,671 30,275
Reinvested distributions 1,569 2,204 2,077 1,023 1,420 152 - - - - 6,974 1,152
Redemptions (354,128) (66,984) (469,244) (122,546) (112,823) (9,577) (448,386) (91,130) (1,586,536) (255,385) (348,474) (62,034)
Shares, end of year 351,108 493,741 510,642 228,568 31,113 17,159 633,663 214,818 867,120 307,613 141,146 26,584
See accompanying notes which are an integral part of these financial statements

79
Sprott Enhanced U.S. Equity Class
Statements of Cash Flows (in U.S. Dollars)
For the years ended December 31 2017 2016
$ $
Cash flows from operating activities
Increase (decrease) in Net Assets attributable to holders of redeemable shares from operations 2,164,144 (821,794)
Adjustments for:
Foreign exchange (gains) losses on cash 66 (1,531)
Net realized (gains) losses on sales of investments (133,934) 1,305,595
Net realized (gains) losses on options contracts (535,909) 941,192
Change in unrealized (appreciation) in the value of investments (1,373,865) (1,085,549)
Change in unrealized (appreciation) on forward currency contracts (152,429) (13,661)
Change in unrealized (appreciation) depreciation on options contracts 55,691 (162,843)
Purchases of investments (2,964,850) (12,317,065)
Proceeds from sales of investments 5,906,429 19,226,863
Net increase (decrease) in other assets and liabilities 687,881 951,913
Net cash provided by operating activities 3,653,224 8,023,120
Cash flows from financing activities
Distributions paid to holders of redeemable shares, net of reinvested distributions (31,042) (54,553)
Proceeds from redeemable shares issued 5,422,770 14,162,511
Redemption of redeemable shares (10,947,190) (26,180,853)
Net cash used in financing activities (5,555,462) (12,072,895)
Foreign exchange gains (losses) on cash (66) 1,531
Net decrease in cash (1,902,238) (4,049,775)
Cash at beginning of year 8,036,352 12,084,596
Cash at end of year 6,134,048 8,036,352
Supplemental Information
Interest received 81,747 56
Dividends received, net of withholding taxes 152,566 394,353
See accompanying notes which are an integral part of these financial statements

80
Sprott Enhanced U.S. Equity Class
Schedule of Investment Portfolio (in U.S. Dollars) As at December 31, 2017 Average Cost Fair Value
$ $
SHARES EQUITIES [61.61%]
FINANCIALS [14.42%]
21,600 Bank of America Corp. 552,537 637,632 7,600 Citigroup Inc. 559,618 565,516
14,900 Intercontinental Exchange, Inc. 744,350 1,051,344
12,000 Manulife Financial Corp. 205,349 250,320
2,061,854 2,504,812
ENERGY [9.52%]
34,800 AltaGas Ltd. 821,937 785,604
15,100 Canadian Natural Resources Ltd. 435,333 539,372
15,900 Inter Pipeline Ltd. 332,371 329,334
20 Suncor Energy Inc. 552 734
1,590,193 1,655,044
UTILITIES [8.87%]
34,425 Brookfield Infrastructure Partners LP 905,885 1,542,584
905,885 1,542,584
INDUSTRIALS [6.87%]
3,190 Northrop Grumman Corp. 578,862 979,043
1,600 Union Pacific Corp. 185,856 214,560
764,718 1,193,603
REAL ESTATE [6.38%]
50,020 Brookfield Property Partners LP 1,122,404 1,108,443
1,122,404 1,108,443
HEALTH CARE [5.67%]
1,800 Danaher Corp. 135,562 167,076
3,710 UnitedHealth Group Inc. 515,068 817,907
650,630 984,983
INFORMATION TECHNOLOGY [5.51%]
7,300 Fiserv Inc. 770,132 957,248
770,132 957,248
CONSUMER DISCRETIONARY [4.37%]
9,500 Comcast Corp. 303,993 380,475
2,000 The Home Depot Inc. 252,440 379,060
556,433 759,535
Total Equities 8,422,249 10,706,252
Transaction Costs (note 3) (5,004)
Total Investments [61.61%] 8,417,245 10,706,252
Total unrealized appreciation on forward currency contracts [0.98%] (Schedule 1) 169,695
Options purchased [0.28%] (Schedule 2) 47,953
Options written [-0.07%] (Schedule 2) (11,856)
Cash and Other Assets Less Liabilities [37.20%] 6,463,111
Total Net Assets attributable to holders of redeemable shares [100.00%] 17,375,155
See accompanying notes which are an integral part of these financial statements

81
Sprott Enhanced U.S. Equity Class
Forward Currency Contracts (Schedule 1)
(in U.S. Dollars)
As at December 31, 2017
Contract Cost Forward Value
Unrealized
Appreciation
Bought ($) Sold ($) Settlement Date $(USD) $(USD) $(USD)
6,586,010 Canadian Dollar (5,129,479) U.S. Dollar 31-Jan-18 5,129,479 5,243,412 113,933
142,376 Canadian Dollar (113,136) U.S. Dollar 31-Jan-18 113,136 113,357 221
3,210,659 Canadian Dollar (2,500,605) U.S. Dollar 31-Jan-18 2,500,605 2,556,146 55,541
Total 169,695
Option Contracts (Schedule 2)
(in U.S. Dollars)
As at December 31, 2017
Options Purchased
Premium Fair
Number of Expiration Strike Paid Value
Option Details Option Type Contracts Date Price ($) $(USD) $(USD)
Energy Select Sector SPDR Call 38 16-Mar-18 70.50 USD 4,484 12,255
iShares S&P TSX Capped Energy Fund Call 160 16-Feb-18 12.00 CAD 2,164 6,175
iShares S&P TSX Capped Energy Fund Call 550 16-Feb-18 12.50 CAD 10,544 9,409
iShares S&P TSX Capped Energy Fund Put 350 16-Feb-18 10.75 CAD 4,457 1,393
iShares S&P TSX Capped Energy Fund Put 200 16-Feb-18 11.00 CAD 2,865 1,114
SPDR Euro Stoxx 50 ETF Put 720 19-Jan-18 34.00 USD 54,000 239
SPDR S&P 500 ETF Trust Call 350 19-Jan-18 271.00 USD 26,250 11,200
Union Pacific Corp. Put 16 19-Jan-18 110.00 USD 4,640 168
WisdomTree Europe Hedged Equity Fund Call 600 16-Feb-18 67.00 USD 18,600 6,000
128,004 47,953
Options Written
Premium Fair
Number of Expiration Strike Received Value
Option Details Option Type Contracts Date Price ($) $(USD) $(USD)
iShares S&P TSX Capped Energy Fund Call 100 16-Feb-18 13.00 CAD (239) (597)
iShares S&P TSX Capped Energy Fund Put 200 16-Feb-18 11.75 CAD (5,809) (2,467)
iShares S&P TSX Capped Energy Fund Put 350 16-Feb-18 11.50 CAD (8,356) (3,064)
SPDR Euro Stoxx 50 ETF Put 720 19-Jan-18 37.00 USD (100,800) (1,326)
Union Pacific Corp. Put 16 19-Jan-18 100.00 USD (1,600) (56)
WisdomTree Europe Hedged Equity Fund Call 600 16-Feb-18 68.00 USD (6,600) (4,346)
(123,404) (11,856)
See accompanying notes which are an integral part of these financial statements

Sprott Enhanced U.S. Equity Class
Notes to financial statements – Fund specific information December 31, 2017
(in U.S. Dollars)
82
Financial Risk Management (note 6)
Investment Objective The Fund seeks to achieve long-term capital growth by investing primarily in U.S. equity securities. The Fund provides downside protection
through the use of option strategies and tactical changes to the amount of its equity exposure, and is suitable for investors with a long-term
horizon.
The Schedule of Investment Portfolio represents the securities held by the Fund as at December 31, 2017. Significant risks that are relevant to
the Fund are discussed here. General information on risk management is described in Note 6.
Market Risk
a) Other Price Risk
As at December 31, 2017 and 2016, if the S&P 500 Total Return Index were to fluctuate by 10%, with all other variables held constant, Net
Assets attributable to holders of redeemable units would increase or decrease by the amounts shown in the table below. This is a measure based
on the historical relationship of the Fund’s performance against the index noted above. The composition of this calculation contains several
subjective components that, although reasonably estimated, could alter the resulting estimate should these components be modified based on
revised assumptions.
December 31, 2017 December 31, 2016
Impact
($’000)
As a % of Net Assets
attributable to holders
of redeemable units
Impact
($’000)
As a % of Net Assets
attributable to holders
of redeemable units
747 4.30% 870 4.20%
b) Currency Risk
The tables below summarize the Fund’s exposure to currency risk as at December 31, 2017 and 2016. The tables also illustrate the potential
impact to the Fund’s Net Assets attributable to holders of redeemable units as a result of 1% changes in these currencies relative to the U.S.
dollar, with all other variables held constant.
December 31, 2017
Currency
Fair Value
($’000)
Forward Currency
Contracts
($’000)
Net Exposure
($’000)
% of Net Assets
attributable to holders
of redeemable units
Impact on Net Assets
attributable to holders
of redeemable units
($’000)
Canadian Dollar 1,108 7,909 9,017 51.90% 90
December 31, 2016
Currency
Fair Value
($’000)
Forward Currency
Contracts
($’000)
Net Exposure
($’000)
% of Net Assets
attributable to holders
of redeemable units
Impact on Net Assets
attributable to holders
of redeemable units
($’000)
Canadian Dollar 87 5,055 5,142 24.81% 51
c) Interest Rate Risk
As at December 31, 2017 and 2016, the Fund did not have a significant exposure to interest rate risk.

Sprott Enhanced U.S. Equity Class
Notes to financial statements – Fund specific information December 31, 2017
(in U.S. Dollars)
83
Credit Risk As at December 31, 2017 and 2016, the Fund is exposed to credit risk from over-the-counter derivative contracts with counterparties. The credit
risk is considered minimal as these counterparties have a minimum credit rating of AA- by S&P or equivalent.
Concentration Risk The table below summarizes the Fund’s concentration risk as a percentage of Net Assets attributable to holders of redeemable shares as at
December 31, 2017 and 2016.
December 31, 2017 December 31, 2016
Equities - Long:
Financials 14.42% 12.10%
Energy 9.52% 3.50%
Utilities 8.87% 5.56%
Industrials 6.87% 8.01%
Real Estate 6.38% 5.31%
Health Care 5.67% 6.55%
Information Technology 5.51% 7.64%
Consumer Discretionary 4.37% 4.13%
Consumer Staples – 3.62%
Unrealized appreciation on forward currency contracts 0.98% 0.08%
Options purchased 0.28% 0.14%
Options written (0.07%) (0.12%)
Cash and Other Assets Less Liabilities 37.20% 43.48%
Total Net Assets attributable to holders of redeemable shares 100.00% 100.00%
Fair Value Measurements (note 5)
The Fund’s assets and liabilities measured at fair value have been categorized based upon the fair value hierarchy in the tables below as at
December 31, 2017 and 2016:
December 31, 2017
Level 1 Level 2 Level 3 Total
$ $ $ $
Equities – Long 10,706,252 – – 10,706,252
Forward Currency Contracts – 169,695 – 169,695
Options purchased 47,953 – – 47,953
Options written (11,856) – – (11,856)
10,742,349 169,695 – 10,912,044
December 31, 2016
Level 1 Level 2 Level 3 Total
$ $ $ $
Equities – Long 11,692,311 – – 11,692,311
Forward Currency Contracts – 17,266 – 17,266
Options purchased 28,350 – – 28,350
Options written (24,750) – – (24,750)
11,695,911 17,266 – 11,713,177
During the years ended December 31, 2017 and 2016, there were no significant transfers between levels.
Restricted Cash and Investments (note 11)
As at December 31, 2017, restricted cash and investments held for the Fund totaled $332,823 (2016 - $1,657,193).

Sprott Enhanced U.S. Equity Class
Notes to financial statements – Fund specific information December 31, 2017
(in U.S. Dollars)
84
Management Fees (note 12)
This fee differs among the series of shares of the Fund as set out in the chart below:
Series A Series AH Series F Series FH Series FT Series I* Series T
Up to 2.00% Up to 2.00% Up to 1.00% Up to 1.00% Up to 1.00% Negotiated by the
Shareholder
Up to 2.00%
* The management fee for Series I shares of the Fund is negotiated by the investor and paid directly by the investor or by the Fund, and would not exceed the
management fee for Series A shares of the Fund.
Related Party Holdings Ninepoint Financial Group, the parent company of the Fund manager, and Sprott Inc., the parent company of the previous Fund manager, and
their respective subsidiaries, held the following investments in the Fund as at December 31, 2017 and 2016, respectively:
December 31, 2017 December 31, 2016 Shares held
Series A 101 15,000
Value of shares held ($USD) 1,038 141,373
Sharing Arrangements (note 14) The Fund paid $449 out of the total transaction costs incurred to certain brokers for research expenses provided to the portfolio manager during
the year ended December 31, 2017 (2016 – $2,040).
Securities Lending (note 3)
As at December 31, 2017 and 2016 the market values of securities loaned and related collateral amounts were as follows:
December 31, 2017 December 31, 2016
$ $
Securities loaned – –
Collateral amounts – –
Collateral as a percentage of securities loaned – –
For the years ended December 31, 2017 and 2016, securities lending income was as follows:
December 31, 2017 December 31, 2016
$ $
Gross securities lending income – 36,224
Securities lending charges – (6,068)
Net securities lending income – 30,156
Withholding taxes on securities lending income – (1,401)
Net securities lending income received by the Fund – 28,755
For the year ended December 31, 2017 securities lending charges represent nil% (2016 – 17%) of the gross securities lending income.
See accompanying generic notes which are an integral part of these financial statements

85
Sprott Focused Global Dividend Class
Statements of Financial Position
(in Canadian Dollars)
As at December 31 2017 2016
$ $
Assets
Current assets
Investments (excluding derivatives) (note 3, 5, 11) 29,796,867 29,776,652
Cash (note 11) - 2,807,385
Unrealized appreciation on forward currency contracts (note 3, 5) 14,302 21,205
Subscriptions receivable 50 260,601
Dividends receivable 87,263 57,717
Other assets 917 -
Total assets 29,899,399 32,923,560
Liabilities
Current liabilities
Bank indebtedness 151,490 -
Unrealized depreciation on forward currency contracts (note 3, 5) - 14,107
Redemptions payable 56,105 304,666
Accrued expenses - 7,885
Total liabilities 207,595 326,658
Net Assets attributable to holders of redeemable shares 29,691,804 32,596,902
Net Assets attributable to holders of redeemable shares per series
Series A 9,467,015 5,919,454
Series A1 9,428,881 13,577,790
Series F 5,998,148 7,978,648
Series F1 3,068,433 3,330,661
Series PF 1,729,327 1,790,349
Net Assets attributable to holders of redeemable shares per series per share (note 8)
Series A 10.55 9.58
Series A1 10.56 9.59
Series F 10.80 9.70
Series F1 11.51 10.34
Series PF 11.08 9.94
See accompanying notes which are an integral part of these financial statements
On behalf of the Manager, Ninepoint Partners LP,
by the Board of Directors of Sprott Corporate Class Inc.
James Fox Stuart J. Freeman
DIRECTOR DIRECTOR

86
Sprott Focused Global Dividend Class
Statements of Comprehensive Income (Loss) (in Canadian Dollars, except share amounts)
For the years ended December 31 2017 2016 $ $
Income Net gain (loss) on investments and derivatives:(1)
Interest income for distribution purposes (note 3) 4,366 521
Dividends (note 3) 589,233 570,372
Net realized gains (losses) on sales of investments 2,207,236 (1,427,491)
Net realized gains on forward currency contracts 66,301 867,072
Net realized gains (losses) on option contracts 13,437 (110,296)
Change in unrealized appreciation in the value of investments 1,845,201 2,096,424
Change in unrealized appreciation on forward currency contracts 7,205 7,098 Net realized losses on foreign exchange (144,631) (39,429)
Other income 91 -
Total income 4,588,439 1,964,271
Expenses (note 12, 13)
Management fees 525,511 487,057
Transaction costs (note 3, 14) 90,898 153,029
Unitholder reporting costs 59,795 45,253
Withholding taxes 58,504 46,515
Filing fees 26,573 26,380
Administrative fees 23,434 37,233 Custodial fees 9,954 18,271
Audit fees 8,617 12,231
Legal fees 7,040 22,483
Directors' fees 6,125 4,324
Independent Review Committee fees (note 15) 4,895 5,439
Total expenses 821,346 858,215
Expenses waived/absorbed by the Manager (note 13) (99,641) (6,554)
Net expenses 721,705 851,661
Increase (decrease) in Net Assets attributable to holders of redeemable shares from operations 3,866,734 1,112,610
Increase in Net Assets attributable to holders of redeemable shares from operation per series Series A 919,516 251,858
Series A1 1,359,882 577,113
Series F 908,352 67,440
Series F1 415,669 192,229
Series PF 263,315 23,970
Weighted average number of redeemable shares
Series A 762,637 402,055
Series A1 1,030,665 1,374,806
Series F 697,133 772,088
Series F1 273,777 287,475
Series PF 177,992 170,973
Increase in Net Assets attributable to holders of redeemable shares from operations per series per share (note 3)
Series A 1.21 0.63
Series A1 1.32 0.42 Series F 1.30 0.09
Series F1 1.52 0.67
Series PF 1.48 0.14
(1)Net gain (loss) on investments and derivatives comprised of:
Financial assets and liabilities designated at FVTPL 4,683,005 1,239,826
Financial assets and liabilities classified as HFT 49,974 763,874
4,732,979 2,003,700
See accompanying notes which are an integral part of these financial statements

87
Sprott Focused Global Dividend Class
Statements of Changes in Net Assets Attributable to Holders of Redeemable Shares
(in Canadian Dollars, except share amounts)
For the years ended December 31 2017 2016
$ $
Net Assets attributable to holders of redeemable shares, beginning of year
Series A 5,919,454 600,221
Series A1 13,577,790 4,293,548
Series F 7,978,648 6,936,879
Series F1 3,330,661 -
Series PF 1,790,349 1,508,846
32,596,902 13,339,494
Increase in Net Assets attributable to holders of redeemable shares from operations
Series A 919,516 251,858
Series A1 1,359,882 577,113
Series F 908,352 67,440
Series F1 415,669 192,229
Series PF 263,315 23,970
3,866,734 1,112,610
Distributions to holders of redeemable shares
From return of capital
Series A (257,602) (149,173)
Series A1 (337,698) (493,661)
Series F (230,400) (268,757)
Series F1 (97,500) (82,787)
Series PF (61,272) (60,217)
(984,472) (1,054,595)
Redeemable share transactions (note 8)
Proceeds from redeemable shares issued
Series A 6,353,773 5,920,922
Series A1 2,136,545 13,141,490
Series F 4,312,084 8,050,732
Series F1 580,424 3,928,730
Series PF 72,727 311,054
Reinvestments of distributions to holders of redeemable shares
Series A 230,304 134,965
Series A1 299,684 460,275
Series F 189,929 231,536
Series F1 84,307 74,949
Series PF 56,053 58,000
Redemption of redeemable shares
Series A (3,698,430) (839,339)
Series A1 (7,607,322) (4,400,975)
Series F (7,160,465) (7,039,182)
Series F1 (1,245,128) (782,460)
Series PF (391,845) (51,304)
(5,787,360) 19,199,393

88
Sprott Focused Global Dividend Class
Statements of Changes in Net Assets Attributable to Holders of Redeemable Shares
continued (in Canadian Dollars, except share amounts)
For the years ended December 31 2017 2016
$ $
Net increase (decrease) in Net Assets attributable to holders of redeemable shares
Series A 3,547,561 5,319,233
Series A1 (4,148,909) 9,284,242
Series F (1,980,500) 1,041,769
Series F1 (262,228) 3,330,661
Series PF (61,022) 281,503
(2,905,098) 19,257,408
Net Assets attributable to holders of redeemable shares, end of year
Series A 9,467,015 5,919,454
Series A1 9,428,881 13,577,790
Series F 5,998,148 7,978,648
Series F1 3,068,433 3,330,661
Series PF 1,729,327 1,790,349
29,691,804 32,596,902
Changes in outstanding redeemable shares of the Fund for the years ended December 31, 2017 and 2016 were as follows:
2017 2016
Series A Series A1 Series F Series F1 Series PF Series A Series A1 Series F Series F1 Series PF
Shares, beginning of year 617,723 1,415,865 822,353 322,175 180,179 59,700 427,025 689,314 - 146,842
Subscriptions 623,076 205,165 421,347 51,311 6,956 633,467 1,404,870 852,304 391,526 32,588
Reinvested distributions 22,712 29,681 18,494 7,684 5,302 14,349 49,026 24,513 7,429 6,002
Redemptions (365,783) (757,895) (706,824) (114,694) (36,410) (89,793) (465,056) (743,778) (76,780) (5,253)
Shares, end of year 897,728 892,816 555,370 266,476 156,027 617,723 1,415,865 822,353 322,175 180,179
See accompanying notes which are an integral part of these financial statements

89
Sprott Focused Global Dividend Class
Statements of Cash Flows
(in Canadian Dollars)
For the years ended December 31 2017 2016
$ $
Cash flows from operating activities
Increase (decrease) in net assets attributable to holders of redeemable shares from operations 3,866,734 1,112,610
Adjustments for:
Foreign exchange losses on cash 11,980 56
Net realized (gains) losses on sales of investments (2,207,236) 1,427,491
Net realized (gains) losses on options contracts (13,437) 110,296
Change in unrealized (appreciation) in the value of investments (1,845,201) (2,096,424)
Change in unrealized (appreciation) on forward currency contracts (7,205) (7,098)
Purchases of investments (25,736,406) (55,832,745)
Proceeds from sales of investments 36,047,176 38,467,364
Net increase (decrease) in other assets and liabilities (38,348) (42,414)
Net cash provided by (used in) operating activities 10,078,057 (16,860,864)
Cash flows from financing activities
Distributions paid to holders of redeemable shares, net of reinvested distributions (124,195) (94,870)
Proceeds from redeemable shares issued 7,024,610 31,383,056
Redemption of redeemable shares (19,925,367) (12,808,594)
Net cash provided by (used in) financing activities (13,024,952) 18,479,592
Foreign exchange (losses) on cash (11,980) (56)
Net increase (decrease) in cash (2,946,895) 1,618,728
Cash at beginning of year 2,807,385 1,188,713
Cash (Bank indebtedness) at end of year (151,490) 2,807,385
Supplemental Information
Interest received 4,366 521
Dividends received, net of withholding taxes 501,183 473,558
See accompanying notes which are an integral part of these financial statements

90
Sprott Focused Global Dividend Class
Schedule of Investment Portfolio As at December 31, 2017 Average Cost Fair Value
$ $
SHARES EQUITIES [100.35%]
FINANCIALS [27.21%]
3,268 Affiliated Managers Group Inc. 724,281 842,945
4,322 Berkshire Hathaway Inc. 829,940 1,076,630
22,353 Brookfield Asset Management Inc. 1,045,829 1,223,156
48,612 Credit Agricole SA 1,001,203 1,011,498 40,900 Credit Suisse Group AG 879,498 917,892
8,917 Intercontinental Exchange Inc. 685,991 790,700
9,535 JPMorgan Chase and Co. 972,938 1,281,431
40,400 UBS Group AG 904,230 934,809
7,043,910 8,079,061
INDUSTRIALS [25.93%]
34,018 Ashtead Group PLC 786,185 1,149,690
8,543 East Japan Railway Co. 1,048,438 1,047,548
4,730 WABCO Holdings Inc. 874,405 852,997
2,359 FedEx Corp. 509,180 739,780
28,016 Ferrovial SA 770,260 799,437 4,147 Raytheon Co. 838,745 978,993
6,250 Siemens AG 1,051,009 1,094,565
11,621 Waste Connections Inc. 862,392 1,036,022
6,740,614 7,699,032
INFORMATION TECHNOLOGY [19.44%]
858 Alphabet Inc. 950,837 1,128,286
15,919 InterXion Holding NV 989,128 1,178,926
5,954 Mastercard Inc. 800,383 1,132,542
11,040 Microsoft Corp. 1,050,973 1,186,786
8,002 Visa Inc. 887,519 1,146,605
4,678,840 5,773,145
ENERGY [7.47%]
14,400 Royal Dutch Shell PLC 608,251 612,857
22,000 Suncor Energy Inc. 935,763 1,015,300
8,500 Total SA 598,407 590,125
2,142,421 2,218,282
CONSUMER DISCRETIONARY [5.67%]
4,288 The Home Depot Inc. 795,933 1,021,332
7,060 Valeo SA 535,926 662,866
1,331,859 1,684,198
HEALTH CARE [4.27%]
4,577 UnitedHealth Group Inc. 834,360 1,268,074
834,360 1,268,074
TELECOMMUNICATION SERVICES [4.24%]
39,133 Cellnex Telecom, S.A. 1,132,826 1,259,747
1,132,826 1,259,747
CONSUMER STAPLES [3.43%]
6,750 Henkel AG & Co. KGaA 1,036,635 1,017,762
1,036,635 1,017,762
UTILITIES [2.69%]
36,900 Engie SA 774,553 797,566
774,553 797,566
Total Equities 25,716,018 29,796,867
Transaction Costs (note 3) (39,546)
Total Investments [100.35%] 25,676,472 29,796,867
Total unrealized appreciation on forward currency contracts [0.05%] (Schedule 1) 14,302
Cash and Other Assets Less Liabilities [-0.40%] (119,365)
Total Net Assets attributable to holders of redeemable shares [100.00%] 29,691,804
See accompanying notes which are an integral part of these financial statements

91
Sprott Focused Global Dividend Class
Forward Currency Contracts (Schedule 1)
As at December 31, 2017
Contract
Cost
Forward
Value
Unrealized
Appreciation
Bought ($) Sold ($) Settlement Date $(CAD) $(CAD) $(CAD)
879,893 Canadian Dollar (510,000) Pound Sterling 19-Jan-18 (879,892) (865,590) 14,302
Total 14,302
See accompanying notes which are an integral part of these financial statements

Sprott Focused Global Dividend Class
Notes to financial statements – Fund specific information December 31, 2017
92
Financial Risk Management (note 6)
Investment Objective The Fund seeks to provide consistent income and capital appreciation by investing primarily in a diversified portfolio of dividend yielding
global equities.
The Schedule of Investment Portfolio represents the securities held by the Fund as at December 31, 2017. Significant risks that are relevant to
the Fund are discussed here. General information on risk management is described in Note 6.
Market Risk
a) Other Price Risk
As at December 31, 2017 and 2016, if the MSCI World Index were to fluctuate by 10%, with all other variables held constant, Net Assets
attributable to holders of redeemable units would increase or decrease by the amounts shown in the table below. This is a measure based on the
historical relationship of the Fund’s performance against the index noted above. The composition of this calculation contains several subjective
components that, although reasonably estimated, could alter the resulting estimate should these components be modified based on revised
assumptions.
December 31, 2017 December 31, 2016
Impact
($’000)
As a % of Net Assets
attributable to holders
of redeemable units
Impact
($’000)
As a % of Net Assets
attributable to holders
of redeemable units
2,553 8.60% 2,672 8.20%
b) Currency Risk
The tables below summarize the Fund’s exposure to currency risk as at December 31, 2017 and 2016. The tables also illustrate the potential
impact to the Fund’s Net Assets attributable to holders of redeemable units as a result of 1% changes in these currencies relative to the
Canadian dollar, with all other variables held constant.
December 31, 2017
Currency
Fair Value
($’000)
Forward
Currency
Contracts
($’000)
Net Exposure
($’000)
% of Net Assets
attributable to holders
of redeemable shares
Impact on Net Assets
attributable to holders
of redeemable shares
($’000)
U.S. Dollar 16,292 – 16,292 54.87 163
Euro 7,274 – 7,274 24.50 73
Swiss Franc 1,881 – 1,881 6.34 19
Japanese Yen 1,048 – 1,048 3.53 10
Pound Sterling 1,762 (865) 897 3.02 9
28,257 (865) 27,392 92.26 274
December 31, 2016
Currency
Fair Value
($’000)
Forward
Currency
Contracts
($’000)
Net Exposure
($’000)
% of Net Assets
attributable to holders
of redeemable shares
Impact on Net Assets
attributable to holders
of redeemable shares
($’000)
U.S. Dollar 19,644 – 19,644 60.26 196
Swiss Franc 2,195 – 2,195 6.73 22
Euro 2,079 (1,025) 1,054 3.24 11
Pound Sterling 2,963 (2,896) 67 0.21 1
26,881 (3,921) 22,960 70.44 230

Sprott Focused Global Dividend Class
Notes to financial statements – Fund specific information December 31, 2017
93
c) Interest Rate Risk
As at December 31, 2017 and 2016, the Fund did not have a significant exposure to interest rate risk.
Credit Risk As at December 31, 2017 and 2016, the Fund is exposed to credit risk from over-the-counter derivative contracts with counterparties. The credit
risk is considered minimal as these counterparties have a minimum credit rating of AA- by S&P or equivalent.
Concentration Risk The table below summarizes the Fund’s concentration risk as a percentage of Net Assets attributable to holders of redeemable shares as at
December 31, 2017 and 2016.
December 31, 2017 December 31, 2016
Equities - Long:
Financials 27.21% 20.01%
Industrials 25.93% 21.40%
Information Technology 19.44% 13.64%
Energy 7.47% 5.20%
Consumer Discretionary 5.67% 16.22%
Health Care 4.27% 10.94%
Telecommunication Services 4.24% 3.93%
Consumer Staples 3.43% –
Utilities 2.69% –
Unrealized appreciation on forward currency contracts 0.05% 0.07%
Unrealized depreciation on forward currency contracts – (0.04%)
Cash and Other Assets Less Liabilities (0.40%) 8.63%
Total Net Assets attributable to holders of redeemable shares 100.00% 100.00%
The Fund’s investment portfolio is concentrated in the following geographic segments as at December 31, 2017 and 2016.
December 31, 2017 December 31, 2016
United States 45.29% 53.72%
Canada 11.03% 11.20%
France 10.31% 4.50%
Germany 7.11% 1.84%
Spain 6.94% –
Switzerland 6.24% 6.68%
United Kingdom 5.94% 9.09%
Netherlands 3.97% –
Japan 3.52% –
Ireland – 4.31%
Unrealized appreciation on forward currency contracts 0.05% 0.07%
Unrealized depreciation on forward currency contracts – (0.04%)
Cash and Other Assets Less Liabilities (0.40%) 8.63%
Total Net Assets attributable to holders of redeemable shares 100.00% 100.00%
Fair Value Measurements (note 5)
The Fund’s assets and liabilities measured at fair value have been categorized based upon the fair value hierarchy in the tables below as at
December 31, 2017 and 2016:
December 31, 2017
Level 1 Level 2 Level 3 Total
$ $ $ $
Equities – Long 29,796,867 – – 29,796,867
Forward Currency Contracts – 14,302 – 14,302
29,796,867 14,302 – 29,811,169

Sprott Focused Global Dividend Class
Notes to financial statements – Fund specific information December 31, 2017
94
December 31, 2016
Level 1 Level 2 Level 3 Total
$ $ $ $
Equities – Long 29,776,652 – – 29,776,652
Forward Currency Contracts – 7,098 – 7,098
29,776,652 7,098 – 29,783,750
During the years ended December 31, 2017 and 2016, there were no significant transfers between levels.
Offsetting of Financial Instruments
In the normal course of business, the Fund enters into various master netting arrangements or other similar agreements that do not meet the
criteria for offsetting in the Statements of Financial Position but still allow for the related amounts to be set off in certain circumstances, such as
bankruptcy or termination of the contracts. The following table presents the over-the-counter derivatives that are offset, or subject to
enforceable master netting agreements or other similar agreements but that are not offset, as at December 31, 2017 and 2016. The “Net” column
shows what the impact on the Fund’s Statements of Financial Position would be if all set-off rights were exercised.
Financial assets and liabilities Amounts offset Amounts not offset Net
Gross
assets/liabilities
Gross
assets/liabilities
offset
Net
amounts
presented
Subject to
master
netting
arrangements
Cash
collateral
received $ $ $ $ $ $
December 31, 2017
Derivative assets 14,302 – 14,302 – – 14,302
Derivative liabilities – – – – – –
December 31, 2016
Derivative assets 21,205 – 21,205 – – 21,205
Derivative liabilities 14,107 – 14,107 – – 14,107
Management Fees (note 12)
This fee differs among the series of shares of the Fund as set out in the chart below:
Series A Series A1 Series F Series F1 Series P Series PF Series Q Series QF Series I*
Up to 2.00% Up to 1.95% Up to 1.00% Up to 0.95% Up to 1.80% Up to 0.80% Up to 1.70% Up to 0.70% Negotiated by
the Shareholder
* The management fee for Series I shares of the Fund is negotiated by the investor and paid directly by the investor or by the Fund, and would not exceed the
management fee for Series A shares of the Fund.
Related Party Holdings Ninepoint Financial Group, the parent company of the Fund manager, and Sprott Inc., the parent company of the previous Fund manager, and
their respective subsidiaries, held the following investments in the Fund as at December 31, 2017 and 2016, respectively:
December 31, 2017 December 31, 2016 Shares held
Series A 99 15,620
Series F 96 123,701
Value of shares held ($) 2,081 1,349,860

Sprott Focused Global Dividend Class
Notes to financial statements – Fund specific information December 31, 2017
95
Fund Merger During the year ended December 31, 2017, the Fund acquired all the assets of the below fund (the “Acquired Fund”), and in exchange, the
Fund issued shares to this fund. In turn, those shares were distributed to the shareholders of the Acquired Fund. The Manager was the
investment advisor to the Acquired Fund.
Transfer Date Acquired Fund
Fair Value of Assets
Acquired by the Fund
Number of shares issued by the
Fund to the Acquired Fund
December 4, 2017 Sprott Focused Global Balanced Class $6,265,110 593,395
Sharing Arrangements (note 14) The Fund paid $8,470 out of the total transaction costs incurred to certain brokers for research expenses provided to the portfolio manager
during the year ended December 31, 2017 (2016 - $1,684).
See accompanying generic notes which are an integral part of these financial statements

96
Sprott Focused U.S. Dividend Class
Statements of Financial Position
(in Canadian Dollars)
As at December 31 2017 2016
$ $
Assets
Current assets
Investments (note 3, 5) 10,783,582 11,754,672
Cash 786,667 1,432,542
Receivable from Manager (note 13) - 22,065
Subscriptions receivable 55 -
Dividends receivable 1,824 16,302
Total assets 11,572,128 13,225,581
Liabilities
Current liabilities
Redemptions payable 70,880 -
Accrued expenses 381 13,091
Total liabilities 71,261 13,091
Net Assets attributable to holders of redeemable shares 11,500,867 13,212,490
Net Assets attributable to holders of redeemable shares per series
Series A 2,808,816 1,138,278
Series A1 3,779,558 5,489,328
Series F 3,079,969 3,986,413
Series F1 1,832,524 2,598,471
Net Assets attributable to holders of redeemable shares per series per share (note 8)
Series A 10.71 10.00
Series A1 10.72 10.00
Series F 10.96 10.12
Series F1 11.22 10.35
See accompanying notes which are an integral part of these financial statements
On behalf of the Manager, Ninepoint Partners LP,
by the Board of Directors of Sprott Corporate Class Inc.
James Fox Stuart J. Freeman
DIRECTOR DIRECTOR

97
Sprott Focused U.S. Dividend Class
Statements of Comprehensive Income (Loss)
(in Canadian Dollars, except share amounts)
For the years ended December 31 2017 2016
$ $
Income
Net gain (loss) on investments and derivatives:(1)
Interest income for distribution purposes (note 3) 1,978 268
Dividends (note 3) 159,739 191,237
Net realized gains (losses) on sales of investments 608,018 (95,421)
Net realized gains on forward currency contracts 78,833 150,833
Net realized gains on option contracts - 1,424
Change in unrealized appreciation in the value of investments 603,671 707,762
Net realized losses on foreign exchange (44,721) (10,875)
Other income 2 158
Total income 1,407,520 945,386
Expenses (note 12, 13)
Management fees 197,731 174,791
Unitholder reporting costs 28,542 24,923
Filing fees 26,573 25,380
Transaction costs (note 3, 14) 20,620 35,284
Withholding taxes 18,009 19,903
Administrative fees 12,197 21,644
Audit fees 8,616 11,231
Legal fees 7,039 17,505
Directors' fees 6,125 4,324
Custodial fees 4,905 6,074
Independent Review Committee fees (note 15) 4,895 4,690
Total expenses 335,252 345,749
Expenses waived/absorbed by the Manager (note 13) (98,843) (105,690)
Net expenses 236,409 240,059
Increase in Net Assets attributable to holders of redeemable shares from operations 1,171,111 705,327
Increase in Net Assets attributable to holders of redeemable shares from operation per series
Series A 156,614 60,657
Series A1 434,550 330,934
Series F 364,558 181,067
Series F1 215,389 132,669
Weighted average number of redeemable shares
Series A 163,495 82,814
Series A1 445,403 445,241
Series F 316,916 434,180
Series F1 188,507 168,691
Increase in Net Assets attributable to holders of redeemable shares from operations per series per share (note 3)
Series A 0.96 0.73
Series A1 0.98 0.74
Series F 1.15 0.42
Series F1 1.14 0.79
(1)Net gain (loss) on investments and derivatives comprised of:
Financial assets and liabilities designated at FVTPL 1,373,406 803,846
Financial assets and liabilities classified as HFT 78,833 152,257
1,452,239 956,103
See accompanying notes which are an integral part of these financial statements

98
Sprott Focused U.S. Dividend Class
Statements of Changes in Net Assets Attributable to Holders of Redeemable Shares (in Canadian Dollars, except share amounts)
For the years ended December 31 2017 2016 $ $
Net Assets attributable to holders of redeemable shares, beginning of year Series A 1,138,278 359,565
Series A1 5,489,328 1,144,389
Series F 3,986,413 5,645,105
Series F1 2,598,471 -
13,212,490 7,149,059
Increase in Net Assets attributable to holders of redeemable shares from operations
Series A 156,614 60,657
Series A1 434,550 330,934
Series F 364,558 181,067
Series F1 215,389 132,669
1,171,111 705,327
Distributions to holders of redeemable shares
From return of capital Series A (58,011) (29,986)
Series A1 (151,796) (162,140)
Series F (109,433) (147,962)
Series F1 (66,544) (49,685)
(385,784) (389,773)
Redeemable share transactions (note 8)
Proceeds from redeemable shares issued
Series A 2,445,686 1,286,602
Series A1 538,228 5,061,582
Series F 2,968,984 1,250,006
Series F1 442,292 2,630,725 Reinvestments of distributions to holders of redeemable shares
Series A 50,978 21,909
Series A1 126,879 127,563
Series F 84,782 98,315
Series F1 61,014 45,469
Redemption of redeemable shares
Series A (924,729) (560,469) Series A1 (2,657,631) (1,013,000)
Series F (4,215,335) (3,040,118)
Series F1 (1,418,098) (160,707)
(2,496,950) 5,747,877
Net increase (decrease) in Net Assets attributable to holders of redeemable shares
Series A 1,670,538 778,713
Series A1 (1,709,770) 4,344,939
Series F (906,444) (1,658,692)
Series F1 (765,947) 2,598,471
(1,711,623) 6,063,431
Net Assets attributable to holders of redeemable shares, end of year
Series A 2,808,816 1,138,278
Series A1 3,779,558 5,489,328 Series F 3,079,969 3,986,413
Series F1 1,832,524 2,598,471
11,500,867 13,212,490

99
Sprott Focused U.S. Dividend Class
Statements of Changes in Net Assets Attributable to Holders of Redeemable Shares continued
Changes in outstanding redeemable shares of the Fund for the years ended December 31, 2017 and 2016 were as follows:
2017 2016
Series A Series A1 Series F Series F1 Series A Series A1 Series F Series F1
Shares, beginning of year 113,837 548,679 393,829 250,944 36,088 114,846 566,008 -
Subscriptions 233,386 50,566 280,349 39,725 133,882 524,407 128,495 262,135
Reinvested distributions 4,895 12,234 8,025 5,654 2,241 13,086 9,984 4,506
Redemptions (89,844) (258,860) (401,287) (133,038) (58,374) (103,660) (310,658) (15,697)
Shares, end of year 262,274 352,619 280,916 163,285 113,837 548,679 393,829 250,944
See accompanying notes which are an integral part of these financial statements

100
Sprott Focused U.S. Dividend Class
Statements of Cash Flows
(in Canadian Dollars)
For the years ended December 31 2017 2016
$ $
Cash flows from operating activities
Increase in net assets attributable to holders of redeemable shares from operations 1,171,111 705,327
Adjustments for:
Foreign exchange losses on cash 10,790 24
Net realized (gains) losses on sales of investments (608,018) 95,421
Net realized (gains) on options contracts - (1,424)
Change in unrealized (appreciation) in the value of investments (603,671) (707,762)
Purchases of investments (10,064,979) (18,760,444)
Proceeds from sales of investments 15,627,059 14,119,585
Net increase (decrease) in other assets and liabilities 23,833 (19,956)
Net cash provided by (used in) operating activities 5,556,125 (4,569,229)
Cash flows from financing activities
Distributions paid to holders of redeemable shares, net of reinvested distributions (62,131) (96,517)
Proceeds from redeemable shares issued 2,852,024 10,252,644
Redemption of redeemable shares (8,981,103) (4,774,294)
Net cash provided by (used in) financing activities (6,191,210) 5,381,833
Foreign exchange (losses) on cash (10,790) (24)
Net increase (decrease) in cash (635,085) 812,604
Cash at beginning of year 1,432,542 619,962
Cash at end of year 786,667 1,432,542
Supplemental Information
Interest received 1,978 268
Dividends received, net of withholding taxes 156,208 160,352
See accompanying notes which are an integral part of these financial statements

101
Sprott Focused U.S. Dividend Class
Schedule of Investment Portfolio As at December 31, 2017 Average Cost Fair Value
$ $
SHARES EQUITIES [93.76%]
INDUSTRIALS [24.71%]
4,800 CSX Corp. 354,982 331,831
1,420 FedEx Corp. 340,100 445,310
1,750 Honeywell International Inc. 334,810 337,275
7,800 Quanta Services Inc. 364,945 383,369 1,982 Raytheon Co. 410,593 467,895
5,481 Waste Connections Inc. 423,999 488,636
4,516 Xylem Inc. 306,744 387,055
2,536,173 2,841,371
FINANCIALS [24.12%]
1,437 Affiliated Managers Group Inc. 323,139 370,659
11,050 Bank of America Corp. 363,480 409,933
1,615 Berkshire Hathaway Inc. 321,577 402,304
7,062 Brookfield Asset Management Inc. 333,825 386,433
4,443 Intercontinental Exchange Inc. 356,434 393,975
2,970 JPMorgan Chase and Co. 311,095 399,145 1,940 S&P Global Inc. 370,255 412,999
2,379,805 2,775,448
INFORMATION TECHNOLOGY [21.11%]
316 Alphabet Inc. 353,400 415,546 1,760 Apple Inc. 353,212 374,304
1,180 Broadcom Ltd. 363,895 380,961
2,182 Mastercard Inc. 300,409 415,050
3,875 Microsoft Corp. 371,197 416,558
2,965 Visa Inc. 335,718 424,854
2,077,831 2,427,273
CONSUMER DISCRETIONARY [7.47%]
3,210 Aptiv PLC 348,289 342,207
1,799 Delphi Technologies PLC 117,010 118,625
1,671 The Home Depot Inc. 316,993 398,005
782,292 858,837
HEALTH CARE [7.39%]
1,500 Thermo Fisher Scientific Inc. 359,109 357,935
1,775 UnitedHealth Group Inc. 325,124 491,770
684,233 849,705
ENERGY [6.08%]
2,040 Diamondback Energy Inc. 280,078 323,665
8,150 Suncor Energy Inc. 347,450 376,123
627,528 699,788
MATERIALS [2.88%]
3,700 DowDuPont Inc. 335,804 331,160
335,804 331,160
Total Equities 9,423,666 10,783,582
Transaction Costs (note 3) (4,137)
Total Investments [93.76%] 9,419,529 10,783,582
Cash and Other Assets Less Liabilities [6.24%] 717,285
Total Net Assets attributable to holders of redeemable shares [100.00%] 11,500,867
See accompanying notes which are an integral part of these financial statements

Sprott Focused U.S. Dividend Class
Notes to financial statements – Fund specific information December 31, 2017
102
Financial Risk Management (note 6)
Investment Objective The Fund seeks to provide consistent income and capital appreciation by investing primarily in a diversified portfolio of dividend yielding U.S.
equities.
The Schedule of Investment Portfolio represents the securities held by the Fund as at December 31, 2017. Significant risks that are relevant to
the Fund are discussed here. General information on risk management is described in Note 6.
Market Risk
a) Other Price Risk
As at December 31, 2017 and 2016, if the S&P 500 Total Return Index were to fluctuate by 10%, with all other variables held constant, Net
Assets attributable to holders of redeemable units would increase or decrease by the amounts shown in the table below. This is a measure based
on the historical relationship of the Fund’s performance against the index noted above. The composition of this calculation contains several
subjective components that, although reasonably estimated, could alter the resulting estimate should these components be modified based on
revised assumptions.
December 31, 2017 December 31, 2016
Impact
($’000)
As a % of Net Assets
attributable to holders
of redeemable units
Impact
($’000)
As a % of Net Assets
attributable to holders
of redeemable units
794 6.90% 740 5.60%
b) Currency Risk
The tables below summarize the Fund’s exposure to currency risk as at December 31, 2017 and 2016. The tables also illustrate the potential
impact to the Fund’s Net Assets attributable to holders of redeemable units as a result of 1% changes in these currencies relative to the
Canadian dollar, with all other variables held constant.
December 31, 2017
Currency
Fair Value
($’000)
% of Net Assets
attributable to holders
of redeemable shares
Impact on Net Assets
attributable to holders
of redeemable shares
($’000)
U.S. Dollar 10,518 91.45 105
December 31, 2016
Currency
Fair Value
($’000)
% of Net Assets
attributable to holders
of redeemable shares
Impact on Net Assets
attributable to holders
of redeemable shares
($’000)
U.S. Dollar 10,187 77.10 102
Pound Sterling 304 2.30 3
10,491 79.40 105
c) Interest Rate Risk
As at December 31, 2017 and 2016, the Fund did not have a significant exposure to interest rate risk.
Credit Risk As at December 31, 2017 and 2016, the Fund did not have a significant exposure to credit risk.

Sprott Focused U.S. Dividend Class
Notes to financial statements – Fund specific information December 31, 2017
103
Concentration Risk The table below summarizes the Fund’s concentration risk as a percentage of Net Assets attributable to holders of redeemable shares as at
December 31, 2017 and 2016.
December 31, 2017 December 31, 2016
Equities - Long:
Industrials 24.71% 18.22%
Financials 24.12% 22.60%
Information Technology 21.11% 14.14%
Consumer Discretionary 7.47% 12.90%
Health Care 7.39% 11.11%
Energy 6.08% 4.94%
Materials 2.88% –
Real Estate – 5.06%
Cash and Other Assets Less Liabilities 6.24% 11.03%
Total Net Assets attributable to holders of redeemable shares 100.00% 100.00%
Fair Value Measurements (note 5)
The Fund’s assets and liabilities measured at fair value have been categorized based upon the fair value hierarchy in the tables below as at
December 31, 2017 and 2016:
December 31, 2017
Level 1 Level 2 Level 3 Total
$ $ $ $
Equities – Long 10,783,582 – – 10,783,582
December 31, 2016
Level 1 Level 2 Level 3 Total
$ $ $ $
Equities – Long 11,754,672 – – 11,754,672
During the years ended December 31, 2017 and 2016, there were no significant transfers between levels.
Management Fees (note 12)
This fee differs among the series of shares of the Fund as set out in the chart below:
Series A Series A1 Series F Series F1 Series P Series PF Series Q Series QF Series I*
Up to 2.00% Up to 1.95% Up to 1.00% Up to 0.95% Up to 1.80% Up to 0.80% Up to 1.70% Up to 0.70% Negotiated by
the Shareholder
* The management fee for Series I shares of the Fund is negotiated by the investor and paid directly by the investor or by the Fund, and would not exceed the
management fee for Series A shares of the Fund.
Related Party Holdings Ninepoint Financial Group, the parent company of the Fund manager, and Sprott Inc., the parent company of the previous Fund manager, and
their respective subsidiaries, held the following investments in the Fund as at December 31, 2017 and 2016, respectively:
December 31, 2017 December 31, 2016 Shares held
Series A 97 15,460
Series F 190 279,155
Value of shares held ($) 3,117 2,980,248

Sprott Focused U.S. Dividend Class
Notes to financial statements – Fund specific information December 31, 2017
104
Fund Merger During the year ended December 31, 2017, the Fund acquired all the assets of the below fund (the “Acquired Fund”), and in exchange, the
Fund issued shares to this fund. In turn, those shares were distributed to the shareholders of the Acquired Fund. The Manager was the
investment advisor to the Acquired Fund.
Transfer Date Acquired Fund
Fair Value of Assets
Acquired by the Fund
Number of shares issued by the
Fund to the Acquired Fund
December 4, 2017 Sprott Focused U.S. Balanced Class $3,379,301 313,195
Sharing Arrangements (note 14) The Fund paid $4,750 out of the total transaction costs incurred to certain brokers for research expenses provided to the portfolio manager
during the year ended December 31, 2017 (2016 - $nil).
See accompanying generic notes which are an integral part of these financial statements

Generic Notes to Financial Statements December 31, 2017
105
1. Establishment of the Funds Sprott Resource Class, Sprott Diversified Bond Class, Sprott Short-Term Bond Class, Sprott Silver Equities Class, Sprott Enhanced Equity
Class, Sprott Enhanced Balanced Class, Sprott Real Asset Class, Sprott Enhanced U.S. Equity Class, Sprott Focused Global Dividend Class
and Sprott Focused U.S. Dividend Class (collectively, the “Funds” and each, a “Fund”) are separate classes of shares of Sprott Corporate
Class Inc. (the “Corporation”), a corporation incorporated by articles of incorporation under the laws of Ontario on July 28, 2011, as amended
by articles of amendment under the laws of Ontario on September 22, 2011 and as further amended on January 31, 2012, March 27, 2012,
September 10, 2013, June 30, 2014, May 29, 2015 and October 8, 2015. Ninepoint Partners LP (the "Manager") is the manager and portfolio
advisor of the Funds. Prior to August 1, 2017, Sprott Asset Management LP was the manager and portfolio advisor of the Funds. The Manager
assumed the portfolio management of the Canadian diversified asset business of Sprott Asset Management LP on August 1, 2017. As of August
1, 2017, the Manager has retained Sprott Asset Management LP as the sub-advisor of Sprott Resource Class and Sprott Silver Equities Class.
RBC Investor Services Trust is the custodian of the Funds. The address of the Funds’ registered office is 200 Bay Street, Toronto, Ontario.
The date of inception and series structure of each of the Funds are as follows:
Name of the Fund Date of Inception Series Information
Sprott Resource Class September 23, 2011
(publicly launched on October 17, 2011)
A multi-series fund since inception, having three
series, Series A, F and I.
Sprott Diversified Bond Class September 23, 2011
(publicly launched on October 17, 2011)
A multi-series fund since inception, having five series,
Series A, F, FT, T and I. On May 28, 2015 new series
P, PT, PF, PFT, Q, QT, QF and QFT were introduced.
Sprott Short-Term Bond Class September 23, 2011
(publicly launched on October 17, 2011)
A multi-series fund since inception, having three
series, Series A, F and I.
Sprott Silver Equities Class January 31, 2012
(publicly launched on February 28, 2012)
A multi-series fund since inception, having three
series, Series A, F and I.
Sprott Enhanced Equity Class March 27, 2012
(publicly launched on April 16, 2012)
A multi-series fund since inception, having five series,
Series A, A1, F, F1 and I. On September 30, 2013,
new Series FT and T were introduced.
Sprott Enhanced Balanced Class September 10, 2013
(publicly launched on September 30, 2013)
A multi-series fund since inception, having five series,
Series A, F, FT, T and I.
Sprott Real Asset Class June 30, 2014
(publicly launched on July 17, 2014)
A multi-series fund since inception, having three
series, Series A, F and I.
Sprott Enhanced U.S. Equity Class June 29, 2015
(publicly launched on July 23, 2015)
A multi-series fund since inception, having five series,
Series A, F, FT, T and I. On September 4, 2015 new
series AH and FH were introduced.
Sprott Focused Global Dividend Class October 8, 2015
(publicly launched on November 26, 2015)
A multi-series fund since inception, having eight
series, Series A, A1, F, P, PF, Q, QF and I. On March
1, 2016, new Series F1 was introduced.
Sprott Focused U.S. Dividend Class October 8, 2015
(publicly launched on November 26, 2015)
A multi-series fund since inception, having eight
series, Series A, A1, F, P, PF, Q, QF and I. On March
1, 2016, new Series F1 was introduced.
The differences among the series of shares are the different eligibility criteria, fee structures and administrative expenses associated with
each series.
The Statements of Financial Position of each of the Funds are as at December 31, 2017 and 2016. The Statements of Comprehensive Income
(Loss), Statements of Changes in Net Assets Attributable to Holders of Redeemable Shares and Statements of Cash Flows for each Fund are for
the years ended December 31, 2017 and 2016, except for Funds or series of a Fund established during either period, in which case the
information for that Fund or applicable series is provided for the period from the inception of the Fund or start date of the series of the Fund to
December 31 of the applicable year. The Schedule of Investment Portfolio for each Fund is as at December 31, 2017.
These financial statements were approved for issuance by the Manager on March 16, 2018.

Generic Notes to Financial Statements December 31, 2017
106
2. Basis of Presentation These financial statements have been prepared in compliance with International Financial Reporting Standards (“IFRS”) as published by the
International Accounting Standards Board (“IASB”) and include estimates and assumptions made by the Manager that may affect the reported
amounts of assets, liabilities, income, expenses and the reported amounts of changes in Net Assets during the reporting period. Actual results
could differ from those estimates.
The financial statements have been prepared on a going concern basis using the historical cost convention. However, each Fund is an
investment entity and primarily all financial assets and financial liabilities are measured at fair value in accordance with IFRS. Accordingly, the
Funds’ accounting policies for measuring the fair value of investments and derivatives are consistent with those used in measuring the Net
Asset Value for transactions with shareholders.
The financial statements of each Fund are presented in Canadian dollars, which is each Fund’s functional currency, except for the financial
statements of Sprott Enhanced U.S. Equity Class, which are presented in U.S. dollars, which is that Fund’s functional currency.
3. Summary of Significant Accounting Policies The following is a summary of significant accounting policies followed by the Funds:
CLASSIFICATION AND VALUATION OF INVESTMENTS
The Funds’ investments and derivative assets and liabilities are measured at fair value through profit or loss (“FVTPL”). The category of
financial assets and liabilities at FVTPL is sub-divided into:
Financial assets and liabilities held for trading: Financial assets and liabilities are classified as held for trading if they are acquired for the
purpose of selling and/or repurchasing in the near term. These investments are used principally for the purpose of generating a profit from
short-term fluctuations in prices. Derivatives held by the Funds are classified as held for trading, and they do not meet the definition of effective
hedging instruments as defined by IAS 39, Financial Instruments – Recognition and Measurement (“IAS 39”). Investments sold short are also
classified as held for trading.
Financial instruments designated as fair value through profit or loss upon initial recognition: All investments owned (excluding derivatives)
are designated as FVTPL upon initial recognition. The Funds have included equities, bonds, and other interest-bearing investments in this
category. These financial assets are designated upon initial recognition on the basis that they are part of a group of financial assets that are
managed and have their performance evaluated on a fair value basis, in accordance with risk management and investment strategies of the
Funds, as set out in each Fund’s prospectus.
The Funds’ accounting policies for measuring the fair value of its investments and derivatives are identical to those used in measuring its Net
Asset Value for transactions with shareholders. Fair value is the price that would be received to sell an asset or paid to transfer a liability in an
orderly transaction between market participants at the measurement date.
Financial assets and liabilities at FVTPL are recorded in the Statements of Financial Position at fair value upon initial recognition. All
transaction costs such as brokerage commissions incurred in the purchase and sale of such securities are recognized directly in the Statements
of Comprehensive Income. Subsequent to initial measurement, these investments are recorded at fair value which, as at the financial reporting
period end is determined as follows:
1. Securities listed upon a recognized public stock exchange are valued at the closing price recorded by the exchange on which the security is
principally traded, where the last traded price falls within that day’s bid-ask spread. In circumstances where the closing price is not within
the bid-ask spread, the Manager determines the point within the bid-ask spread that is most representative of fair value based on the
specific facts and circumstances.
2. Common shares of unlisted companies and warrants that are not traded on an exchange are valued using valuation techniques established
by the Manager. Restricted securities are valued in a manner that the Manager determines represents fair value.
3. Bonds, debentures and other debt obligations are valued at the mean of bid/ask prices provided by recognized investment dealers. Unlisted
bonds are valued using valuation techniques established by the Manager.

Generic Notes to Financial Statements December 31, 2017
107
4. Mutual fund units held as investments are fair valued using their respective Net Asset Value per share on the relevant valuation dates, as
these values are most readily and regularly available.
The difference between the fair value of investments and the cost of investments represents the unrealized appreciation or depreciation in the
value of investments. The cost of investments for each security is determined on an average cost basis.
Other assets and liabilities are recognized at fair value upon initial recognition. Other assets such as subscriptions receivable, due to broker,
and income receivables are classified as loans and receivables and measured at amortized cost. Other financial liabilities (including all
financial liabilities other than those measured at FVTPL), are measured at amortized cost. The Funds’ obligation for Net Assets attributable to
holders of redeemable shares is presented at the redemption amount.
TRANSACTION COSTS
Transaction costs are expensed and are included in “Transaction costs” in the Statements of Comprehensive Income. Transaction costs are
incremental costs that are directly attributable to the acquisition, issue or disposal of an investment, which include fees and commissions paid to
agents, advisors, brokers and dealers, levies by regulatory agencies and securities exchanges, and transfer taxes and duties.
INVESTMENT TRANSACTIONS AND INCOME RECOGNITION
Investment transactions are accounted for on the business day following the date the order to buy or sell is executed, with the exception of
short-term investments, which are accounted for on the date the order to buy or sell is executed. Realized gains and losses arising from the sale
of investments and unrealized appreciation and depreciation on investments are calculated with reference to the average cost of the related
investments.
Interest income for distribution purposes represents the coupon interest recognized on an accrual basis. Dividend income is recognized on the
ex-dividend date, presented gross of any non-recoverable withholding taxes, which are disclosed separately in the Statements of
Comprehensive Income. Distributions from underlying funds are recognized on the distribution date.
FOREIGN CURRENCY TRANSLATION
The fair values of foreign-currency-denominated investments are translated into Canadian dollars (or U.S. dollars for Sprott Enhanced U.S.
Equity Class) using the prevailing rate of exchange on each valuation date. Income, expenses and investment transactions in foreign currencies
are translated into Canadian dollars (or U.S. dollars for Sprott Enhanced U.S. Equity Class) at the rate of exchange prevailing on the respective
dates of such transactions.
The Funds do not separately report the effect of changes in foreign exchange rates from changes in market prices on securities held. Such
changes are included in “Change in unrealized appreciation (depreciation) in the value of investments” in the Statements of Comprehensive
Income. Realized foreign exchange gains or losses from sales of investments and cash in foreign currencies are included in “Net realized gains
(losses) on foreign exchange” in the Statements of Comprehensive Income. Any difference between the recorded amounts of dividends,
interest and foreign withholding taxes and the Canadian dollar (or U.S. dollar for Sprott Enhanced U.S. Equity Class) equivalent of the amounts
actually received is reported as part of the investment income in the Statements of Comprehensive Income.
CASH
Cash is comprised of cash on deposit with financial institutions.
CALCULATION OF NET ASSETS ATTRIBUTABLE TO HOLDERS OF REDEEMABLE UNITS PER SERIES PER SHARE
The Net Assets attributable to holders of redeemable units per share of a series is based on the fair value of the series’ proportionate share of the
assets and liabilities of the Fund common to all series, less any liabilities of the Fund attributable only to that series, divided by the total
outstanding shares of that series. Income, non-series-specific expenses, realized and unrealized gains (losses) on investments and transaction
costs are allocated to each series of a Fund based on the series’ pro-rata share of Net Assets attributable to holders of redeemable shares of that
Fund. Expenses directly attributable to a series are charged directly to that series.

Generic Notes to Financial Statements December 31, 2017
108
INCOME TAXES
The Funds are established as classes of shares of the Corporation. The Corporation will pay sufficient capital gains dividends and ordinary
dividends so that, generally, the tax paid by the Corporation with respect to realized capital gains and dividends from taxable Canadian
corporations will be refunded to the Corporation. The Corporation will be liable to pay tax at corporate rates applicable to mutual fund
corporations on income from other sources such as interest, derivative income and foreign source income. The Corporation will try to eliminate
this tax liability by using deductible expenses and tax credits. If the Corporation is not successful in eliminating its tax liability, the Corporation
will be subject to tax.
The Funds incur withholding taxes imposed by certain countries on investment income and capital gains. Such income and gains are recorded
on a gross basis and the related withholding taxes are shown separately in the Statements of Comprehensive Income.
INCREASE (DECREASE) IN NET ASSETS ATTRIBUTABLE TO HOLDERS OF REDEEMABLE SHARES FROM OPERATIONS PER SHARE
“Increase (decrease) in Net Assets attributable to holders of redeemable shares from operations per share” in the Statements of Comprehensive
Income represents the increase (decrease) in Net Assets attributable to holders of redeemable shares per series, divided by the weighted average
number of shares of the series outstanding during the period, which is presented in the Statement of Comprehensive Income.
FORWARD CURRENCY CONTRACTS
The value of a forward currency contract is the gain or loss that would be realized if, on the date that valuation is made, the positions were
closed out. It is reflected in the Statements of Financial Position as part of “Unrealized appreciation (depreciation) on forward currency
contracts” and the change in value over the period is reflected in the Statements of Comprehensive Income as part of “Change in unrealized
appreciation (depreciation) on forward currency contracts”. When the forward currency contracts are closed out, gains and losses are realized
and are included in “Net realized gains (losses) on forward currency contracts” in the Statements of Comprehensive Income.
OPTION CONTRACTS
When the Funds purchase options, the premiums paid for purchasing options are included as an asset and are subsequently adjusted each
valuation day to the fair value of the option contract. Premiums received from writing options are included as a liability and are subsequently
adjusted each valuation day to the fair value of the option contract. These amounts are reflected in the Statements of Financial Position as part
of “Options purchased” or “Options written”. Option contracts are valued each valuation day according to the gain or loss that would be
realized if the contracts were closed out on that day. All unrealized gains (losses) arising from option contracts are recorded as “Change in
unrealized appreciation (depreciation) on option contracts” in the Statements of Comprehensive Income, until the contracts are closed out or
expire, at which time the gains (losses) are realized and reflected in the Statements of Comprehensive Income as “Net realized gains (losses) on
option contracts”.
OFFSETTING OF FINANCIAL INSTRUMENTS
Financial assets and liabilities are disclosed net if there is a legally enforceable right to offset the recognized amounts and there is an intention
to settle on a net basis, or to realize the asset and liability simultaneously. Where applicable, additional information is disclosed in the
Offsetting of Financial Instruments section of the Notes to financial statements – Fund specific information.
SECURITIES LENDING
The Funds may enter into securities lending transactions. These transactions involve the temporary exchange of securities as collateral with a
commitment to deliver the same securities on a future date. Income is earned from these transactions in the form of fees paid by the
counterparty and, in certain circumstances, interest paid on securities held as collateral. Income earned from these transactions is recognized on
an accrual basis and included in the Statements of Comprehensive Income.
Certain Funds have entered into a securities lending program with their custodian, RBC Investor Services Trust. The aggregate market value of
all securities loaned by a Fund cannot exceed 50% of the assets of the Fund. The Fund will receive collateral of at least 102% of the value of
the securities on loan. Collateral will generally be comprised of cash and obligations of, or guaranteed by, the Government of Canada or a
province thereof, or the United States Government or its agencies, or a permitted supranational agency as defined in National Instrument 81-
102. Securities lending income reported in the Statements of Comprehensive Income is net of a securities lending charge which the Fund’s
custodian, RBC Investor Services Trust, is entitled to receive
STANDARDS ISSUED BUT NOT YET EFFECTIVE
Standards issued but not yet effective up to the date of issuance of the Funds’ financial statements are listed below. The Funds intend to adopt
applicable standards when they become effective.

Generic Notes to Financial Statements December 31, 2017
109
IFRS 9, Financial Instruments - Classification and Measurement (“IFRS 9”): In July 2014, the IASB issued the final version of IFRS 9,
bringing together the classification and measurement, impairment and hedge accounting phases of the IASB’s project to replace IAS 39 and all
previous versions of IFRS 9. IFRS 9 introduces a logical, single classification and measurement approach for financial assets that reflects the
business model in which they are managed and their cash flow characteristics. Built upon this is a forward-looking expected credit loss model
that will result in more timely recognition of loan losses and is a single model that is applicable to all financial instruments subject to
impairment accounting. In addition, IFRS 9 also removes the volatility in profit or loss that was caused by changes in the credit risk of
liabilities elected to be measured at fair value, such that gains caused by the deterioration of an entity’s own credit risk on such liabilities are no
longer recognized in profit or loss. IFRS 9 also includes an improved hedge accounting model to better link the economics of risk management
with its accounting treatment. IFRS 9 is effective for annual periods beginning on or after January 1, 2018, with early adoption permitted. In
addition, the own credit changes can be early applied in isolation without otherwise changing the accounting for financial instruments. The
new standard is not expected to have a significant impact on the Funds.
4. Critical Accounting Estimates and Judgments The preparation of financial statements requires management to use judgment in applying its accounting policies and to make estimates and
assumptions about the future. The following discusses the most significant accounting judgments and estimates that the Funds have made in
preparing the financial statements:
FAIR VALUE MEASUREMENT OF DERIVATIVES AND SECURITIES NOT QUOTED IN AN ACTIVE MARKET
The Funds hold financial instruments that are not quoted in active markets, including derivatives. Fair values of such instruments are
determined using valuation techniques and may be determined using reputable pricing sources (such as pricing agencies) or indicative prices
from market makers. Where no market data is available, the Funds may value investments using valuation models, which are usually based on
methods and techniques generally recognized as standard within the industry. The models used to determine fair values are validated and
periodically reviewed by experienced personnel of the Manager, independent of the party that created them. Models use observable data, to the
extent practicable. However, areas such as credit risk (both own and counterparty), volatilities and correlations require the Manager to make
estimates. Changes in assumptions about these factors could affect the reported fair values of financial instruments. The Funds consider
observable data to be market data that is readily available, regularly distributed and updated, reliable and verifiable, not proprietary, and
provided by independent sources that are actively involved in the relevant market. Common shares of unlisted companies may be valued at cost
and adjusted based on the last known transaction. Refer to Note 5 for further information about the fair value measurement of the Funds’
financial instruments.
CLASSIFICATION AND MEASUREMENT OF INVESTMENTS AND APPLICATION OF THE FAIR VALUE OPTION
In classifying and measuring financial instruments held by the Funds, the Manager is required to make judgments about whether or not the
business of the Funds is to invest on a total return basis for the purpose of applying the fair value option for the financial assets under IAS 39.
ASSESSMENT AS AN INVESTMENT ENTITY
Entities that meet the definition of an investment entity within IFRS 10, Consolidated Financial Statements are required to measure their
subsidiaries at FVTPL rather than consolidate them. The criteria which define an investment entity are as follows:
• an entity that obtains funds from one or more investors for the purpose of providing those investors with investment services;
• an entity that commits to its investors that its business purpose is to invest funds solely for returns from capital appreciation,
investment income or both; and
• an entity that measures and evaluates the performance of substantially all of its investments on a fair value basis.
The Manager has assessed the characteristics of an investment entity as they apply to the Funds, and such assessment requires significant
judgments. Based on the assessment, the Manager concluded that each Fund meets the definition of an investment entity.
5. Fair Value Measurements The Funds use a three-tier hierarchy as a framework for disclosing fair value based on inputs used to value the Funds’ investments. The fair
value hierarchy has the following levels:

Generic Notes to Financial Statements December 31, 2017
110
Level 1 Unadjusted quoted prices in active markets for identical, unrestricted assets or liabilities that the Funds have the ability to access
at the measurement date;
Level 2 Quoted prices which are not active, or inputs that are observable (either directly or indirectly) for substantially the full term of
the asset or liability; and
Level 3 Prices, inputs or complex modeling techniques that are both significant to the fair value measurement and unobservable
(supported by little or no market activity).
The hierarchy of investments and derivatives for each Fund is included in the Notes to Financial Statements – Fund Specific Information of
each Fund.
All fair value measurements above are recurring. The carrying values of cash, subscriptions receivable, interest receivable, payable for
investments purchased, redemptions payable, distributions payable, accrued expenses and each Fund’s obligations for Net Assets attributable to
holders of redeemable shares approximate their fair values due to their short-term nature. Fair values are classified as Level 1 when the related
security or derivative is actively traded and a quoted price is available. If an instrument classified as Level 1 subsequently ceases to be actively
traded, it is transferred out of Level 1. In such cases, instruments are reclassified into Level 2, unless the measurement of its fair value requires
the use of significant unobservable inputs, in which case it is classified as Level 3.
The following provides details of the categorization in the fair value hierarchy by asset classes:
Level 1 securities include:
• Equity securities and options using quoted market prices (unadjusted).
• Investments in other mutual funds valued at their respective Net Asset Value per share on relevant valuation dates.
Level 2 securities include:
• Equity securities that are not frequently traded in active markets. In such cases, fair value is determined based on observable market
data (e.g., transactions for similar securities of the same issuer).
• Fixed-income securities valued at evaluated bid prices provided by recognized investment dealers (i.e. third-party pricing vendor
based on a variety of factors including broker input, financial information on the issuer and other observable market inputs).
• Derivative assets and liabilities such as forward currency contracts and swaps, which are valued based on observable inputs such as
the notional amount, forward market rate, contract rates, interest and credit spreads. To the extent that the inputs used are observable
and reliable, these derivatives are included in Level 2.
Level 3 securities include:
• Investments valued using valuation techniques that are based on unobservable market data. These techniques are determined pursuant
to procedures established by the Manager. Quantitative information about unobservable inputs and related sensitivity of the fair value
measurement are disclosed in the Notes to financial statements – Fund specific information.
Additional disclosures relating to transfers between levels and a reconciliation of the beginning and ending balances in Level 3 are also
disclosed in the Notes to financial statements – Fund specific information. There were no material transfers between Level 1, Level 2 and
Level 3 during the period.
6. Financial Risk Management Each Fund is exposed to risks that are associated with its investment strategies, financial instruments and markets in which it invests. The
extent of risk within a Fund is largely contingent upon the Fund’s investment policy and guidelines as stated in its prospectus, and the
management of such risks is contingent upon the qualification and diligence of the portfolio manager designated to manage the Fund. The
Schedule of Investment Portfolio groups securities by asset type, sector or geographic region. Significant risks that are relevant to the Funds are
discussed below. Refer to the Notes to Financial Statements – Fund Specific Information of each Fund for specific risk disclosures.
MARKET RISK
The Funds’ investments are subject to market risk, which is the risk that the fair value of future cash flows of a financial instrument will
fluctuate because of changes in market variables such as equity prices, currency rates and interest rates.

Generic Notes to Financial Statements December 31, 2017
111
a) Other Price Risk
Other price risk is the risk that the fair value of a financial instrument will fluctuate due to a change in market price (other than those arising
from interest rate risk or currency risk). The sensitivity analysis disclosed is estimated based on the historical correlation between the return of a
Fund as compared to the return of a Fund’s benchmark. The analysis assumes that all other variables remain unchanged. The historical
correlation may not be representative of future correlation and, accordingly the impact on net assets could be materially different. The
investments of a Fund are subject to normal market fluctuations and the risks inherent in the financial markets. The maximum risk resulting
from purchased securities held by the Funds is limited to the fair value of these investments. The Manager moderates this risk through a careful
selection of securities within specified limits, as well as through the diversification of the investment portfolio.
b) Currency Risk
Currency risk is the risk that arises from the change in price of one currency against another. Where a Fund holds securities that are
denominated in currencies other than the Canadian dollar (or U.S. dollar for Sprott Enhanced U.S. Equity Class), these securities are converted
to the Fund’s functional currency (Canadian or U.S. dollar) in determining fair value, and fair values are subject to fluctuations relative to the
strengthening or weakening of the functional currency.
c) Interest Rate Risk
Interest rate risk is the risk borne by an interest-bearing financial instrument that is attributed to interest rate fluctuations. Cash does not expose
the Funds to significant amounts of interest rate risk.
CREDIT RISK
Credit risk is the risk of loss due to the failure of a counterparty to satisfy its obligations. All transactions executed by a Fund in listed securities
are settled upon delivery using approved brokers. The risk of default is considered minimal, as the delivery of those securities sold is made only
when the broker has received payment. Payment is made on purchases only when the security is received by the broker. The trade will fail to
consummate if either party fails to meet its obligations.
The Funds may be exposed to credit risk from the counterparties to the derivative instruments they use. Credit risk associated with these
transactions is considered minimal as all counterparties have an approved credit rating equivalent to a Standard & Poor’s credit rating of AA –
on their long-term debt.
LIQUIDITY RISK
Liquidity risk is the risk that a Fund will not be able to generate sufficient cash resources as to fulfill its payment obligations. The Funds
predominantly invest in liquid securities that are readily tradable in an active market. Consequently, the Funds are able to readily dispose of
securities if necessary to fund redemptions in the course of operations. Funds traditionally maintain a cash reserve in anticipation of normal
redemption activity. Although each Fund may, from time to time, invest in illiquid or restricted securities such as private placements, private
companies and warrants which are identified in the applicable Fund’s Schedule of Investment Portfolio, such investments do not comprise a
significant portion of a Fund’s investment portfolio. As a result, the risk is not material.
With the exception of derivative contracts and investments sold short, where applicable, all of the Funds’ financial liabilities are short-term
liabilities maturing within 90 days after the period end. For Funds that hold investments sold short, these investments have no specific maturity
date. For Funds that hold derivative contracts with a term to maturity that exceeds 90 days from the period end, further information related to
those contracts can be found in the derivatives schedules included in the Schedule of Investment Portfolio of those Funds.
CONCENTRATION RISK
Concentration risk arises as a result of the concentration of financial instrument exposures within the same category, whether it is geographic
region, asset type or industry sector.
7. Capital Management The capital of a Fund is represented by the issued and outstanding shares and the Net Asset Value attributable to participating shareholders. The
Manager utilizes the capital of the Funds in accordance with each Fund’s investment objectives, strategies and restrictions, as outlined in the
Funds’ prospectus, while maintaining sufficient liquidity to meet normal redemptions. The Funds do not have any externally imposed capital
requirements.

Generic Notes to Financial Statements December 31, 2017
112
8. Redeemable Shares of the Funds Each of the Funds offers three series of redeemable shares: Series A, Series F and Series I, unless otherwise indicated. Series A shares are
available to all investors. Series F shares are designed for investors who participate in fee-based programs. Series I shares are special purpose
shares generally available only to institutional investors or as determined by the Manager on a case-by-case basis. Generally, an investor in
Series I shares negotiates a separate fee that will be paid directly to the Manager by the investor or by the Fund.
Each of Sprott Diversified Bond Class, Sprott Enhanced Equity Class, Sprott Enhanced Balanced Class and Sprott Enhanced U.S. Equity Class
also offer Series T shares and Series FT shares. Series T shares are intended for investors who seek monthly distributions at a target annual
distribution rate. Series FT shares are designed for investors who participate in fee-based programs and who seek monthly distributions at a
target annual distribution rate.
For Sprott Diversified Bond Class, Sprott Focused Global Dividend Class and Sprott Focused U.S. Dividend Class, Series P and Series PF
shares are available to an investor, discretionary accounts of an advisor or a “household group”, holding in aggregate at least a $1 million
investment in the Fund and Series Q and Series QF shares are available to an investor, discretionary accounts of an advisor or a “household
group”, holding in aggregate at least a $5 million investment in the Fund. A “household group” consists of members of the same family
residing at the same residence plus corporate, partnership or trust entities over which those family members have voting control (over 50%).
For Sprott Diversified Bond Class, Series PT and Series PFT shares are available to an investor, discretionary accounts of an advisor or a
“household group”, holding in aggregate at least a $1 million investment in the Fund and Series QT and Series QFT shares are available to an
investor, discretionary accounts of an advisor or a “household group”, holding in aggregate at least a $5 million investment in the Fund. A
“household group” consists of members of the same family residing at the same residence plus corporate, partnership or trust entities over
which those family members have voting control (over 50%).
Sprott Enhanced Equity Class, Sprott Focused Global Dividend Class and Sprott Focused U.S. Dividend Class also offer Series A1 and
F1 shares. Series A1 shares are available to all investors who purchased this series on or before a date the Manager determined. Series
F1 shares are designed for investors who participated in fee-based programs on or before a date the Manager determined.
Sprott Enhanced U.S. Equity Class also offers Series AH and FH shares. Series AH shares are available to all investors and are intended for
investors who seek to minimize the currency risk associated with their investments. Series FH shares are designed for investors who participate
in fee-based programs and who seek to minimize the currency risk associated with their investments.
The Funds’ redeemable shares are classified as financial liabilities on the Statements of Financial Position, since the Funds’ shares do not meet
the criteria in IAS 32, Financial Instruments: Presentation (“IAS 32”) for classification as equity.
9. Taxation of the Corporation The Corporation is a “mutual fund corporation” as defined in the Income Tax Act. The Corporation is a single legal entity for tax purposes and
is not taxed on a fund-by-fund basis. As a mutual fund corporation, taxable dividends received from taxable Canadian corporations are subject
to a tax rate of 38.33%. Such taxes are fully refundable upon payment of ordinary taxable dividends to its shareholders. Any such tax paid is
reported as an amount receivable until recovered through the payment to shareholders of dividends out of net investment income. All tax on net
taxable realized capital gains is refundable when the gains are distributed to shareholders as capital gains dividends or through redemptions of
shares at the request of shareholders, while the Corporation qualifies as a mutual fund corporation. Income and capital taxes (if any) are
allocated to the series on a reasonable basis and the amount charged to a series is reflected in the Statements of Comprehensive Income of the
series. Interest income and foreign dividends, net of applicable expenses, are taxed at full rates applicable to mutual fund corporations with
credits, subject to certain limitations, for foreign taxes paid.
Temporary differences between the carrying value of assets and liabilities for accounting and income tax purposes give rise to deferred income
tax assets and liabilities. When the market value of a Fund’s portfolio exceeds its cost, a deferred tax liability arises. As capital gains taxes
payable by the Funds are refundable under the provisions of the Income Tax Act, the deferred tax liability is offset by these future refundable
taxes. Conversely, when the cost exceeds the market value of the portfolio, a deferred tax asset is generated. In such cases, a deferred tax asset
is not recognized given the uncertainty that such deferred tax assets will ultimately be realized. Unused capital and non-capital losses (if any)
represent deferred tax assets to the Funds. The Corporation has not recognized a deferred tax asset for these losses as the probability of future
income being generated to utilize these losses is uncertain. The capital losses can be carried forward indefinitely and non-capital losses will
expire in 20 years. As of the tax year ended December 31, 2017, the Corporation had capital and non-capital losses available for tax purposes
as follows:

Generic Notes to Financial Statements December 31, 2017
113
Capital losses Non-capital losses
Non-capital losses
year of expiry
$ $
26,531,216 26,319 2031
- 251,452 2032
- 3,208,416 2033
- 8,082,587 2034
- 10,969,495 2035
10. Distributions The Corporation intends to pay ordinary dividends in December and capital gains dividends in February of each year to the extent necessary to
ensure it will not have any net liability for tax under Part IV of the Income Tax Act (Canada) on taxable dividends from taxable Canadian
corporations or for tax under Part I of the Income Tax Act on net realized capital gains. All dividends will be reinvested in additional shares of
the same series of the Fund unless shareholders request for the distributions to be paid in cash. Certain Funds distribute periodically, and such
monthly distributions to shareholders will be a return of capital.
11. Restricted Cash and Investments Cash, investments and broker margin include balances with prime brokers held as collateral for securities sold short and other derivatives. This
collateral is not available for general use by the Funds. The value of any restricted cash and investments held for each of the Funds is disclosed
in the Notes to Financial Statements – Fund Specific Information, if applicable.
12. Related-Party Transactions MANAGEMENT FEES
Each Fund pays the Manager an annual management fee to cover management expenses. Management fees are unique to each Fund and are
subject to applicable taxes. The management fee is calculated and accrued daily and is paid on the last business day of each month based on the
daily Net Asset Value of each Fund.
INCENTIVE FEES
Sprott Resource Class, Sprott Silver Equities Class, Sprott Enhanced Equity Class, Sprott Enhanced Balanced Class and Sprott Enhanced U.S.
Equity Class pay the Manager an incentive fee annually, subject to applicable taxes, equal to a percentage of the daily Net Asset Value of the
applicable series of the respective Funds. Such percentage will be equal to 10% of the difference by which the return in the Net Asset Value per
share of the applicable series of the respective Funds from January 1 (or inception) to December 31 exceeds the percentage return of the
benchmark index. The benchmark indices are as follows:
Name of the Fund Benchmark
Sprott Resource Class Blended index comprised of 50% of the daily return of the S&P/TSX Capped Materials Total Return Index and
50% of the daily return of the S&P/TSX Capped Energy Total Return Index.
Sprott Silver Equities Class MSCI ACWI Select Silver Miners IMI Net Return Index.
Sprott Enhanced Equity Class Blended index comprised of 50% of the S&P/TSX Composite Total Return Index and 50% of the S&P 500
Total Return Index in Canadian dollar terms.
Sprott Enhanced Balanced Class Blended index comprised of the S&P/TSX Composite Total Return Index, S&P 500 Total Return Index and
FTSE TMX Canada Universe Bond Index return, weighted 40%, 30% and 30%, respectively.
Sprott Enhanced U.S. Equity Class S&P 500 Index in U.S. dollar terms.

Generic Notes to Financial Statements December 31, 2017
114
If the performance of a series of Sprott Resource Class, Sprott Silver Equities Class, Sprott Enhanced Equity Class, Sprott Enhanced Balanced
Class or Sprott Enhanced U.S. Equity Class in any year is less than the performance of their blended benchmark index described above
(the “Deficiency”), then no incentive fee will be payable in any subsequent year until the performance of the applicable series of the respective
Funds, on a cumulative basis calculated from the first of such subsequent years, has exceeded the amount of the Deficiency. The Manager may
reduce the incentive fee payable by the Fund with respect to a particular investor by rebating a portion of the incentive fee. Additionally,
investors in Series I shares may negotiate a different incentive fee than the one described above or no incentive fee at all.
The Funds other than those noted above do not pay an incentive fee directly, although certain of the underlying funds in which they invest may
pay annually an incentive fee, subject to applicable taxes as disclosed in the simplified prospectus of such underlying funds.
13. Operating Expenses and Sales Charges Each Fund pays its own operating expenses, other than marketing costs and costs of dealer compensation programs, which are paid by the
Manager. Operating expenses include, but are not limited to, audit, legal, safekeeping, custodial, fund administration expenses, preparation
costs of financial statements and other reports to investors and Independent Review Committee (“IRC”) member fees and expenses. Operating
expenses and other costs of a Fund are subject to applicable taxes. Each series of the Fund is responsible for its proportionate share of operating
expenses of the Corporation in addition to the expenses that the Fund alone incurs.
At its sole discretion, the Manager may waive or absorb a portion of the operating expenses of certain Funds. Amounts waived or absorbed by
the Manager are reported in the Statements of Comprehensive Income. Waivers or absorptions can be terminated at any time without notice.
14. Sharing Arrangements In addition to paying for the cost of brokerage services in respect of securities transactions, commissions paid to certain brokers may also cover
research services provided to the portfolio manager. Sharing arrangements for each Fund are disclosed in the Notes to Financial Statements –
Fund Specific Information, if applicable.
15. Independent Review Committee In accordance with National Instrument 81-107, Independent Review Committee for Investment Funds, the Manager has established an IRC for
all of the Funds. The mandate of the IRC is to consider and provide recommendations to the Manager on conflicts of interest to which the
Manager is subject when managing the Funds. The IRC reports annually to shareholders of the Funds on its activities, and the annual report is
available on and after March 31 in each year. The Manager charges compensation paid to the IRC members and the costs of the ongoing
administration of the IRC to the Funds. These amounts are shown in the Statements of Comprehensive Income.
16. Subsequent Events Effective March 12, 2018, the names of the Funds have changed to the below.
Current Fund Name Future Fund Name
Sprott Resource Class Ninepoint Resource Class
Sprott Diversified Bond Class Ninepoint Diversified Bond Class
Sprott Short-Term Bond Class Ninepoint Short-Term Bond Class
Sprott Silver Equities Class Ninepoint Silver Equities Class
Sprott Enhanced Equity Class Ninepoint Enhanced Equity Class
Sprott Enhanced Balanced Class Ninepoint Enhanced Balanced Class
Sprott Real Asset Class Ninepoint Real Asset Class
Sprott Enhanced U.S. Equity Class Ninepoint Enhanced U.S. Equity Class
Sprott Focused Global Dividend Class Ninepoint Focused Global Dividend Class
Sprott Focused U.S. Dividend Class Ninepoint Focused U.S. Dividend Class


Corporate Information
Corporate Address
Ninepoint Partners LP
Royal Bank Plaza, South Tower
200 Bay Street, Suite 2700, P.O. Box 27
Toronto, Ontario M5J 2J1
T 416.943.6707
TOLL-FREE 866.299.9906
F 416.943.6497
For additional information visit our website:
www.ninepoint.com
Call our mutual fund information line for daily closing prices:
416.943.6707 or 866.299.9906
Auditors
KPMG LLP
Bay Adelaide Centre
333 Bay Street
Suite 4600
Toronto, Ontario M5H 2S5
Legal Counsel
Borden Ladner Gervais LLP
Scotia Plaza
40 King Street West
Toronto, Ontario M5H 3Y4
The opinions, estimates and projections (‘‘information’’) contained within this report are solely those of Ninepoint Partners LP and are subject
to change without notice. Ninepoint Partners LP makes every effort to ensure that the information has been derived from sources believed to be
reliable and accurate. However, Ninepoint Partners LP assumes no responsibility for any losses or damages, whether direct or indirect, that
arise out of the use of this information. Ninepoint Partners LP is not under any obligation to update or keep current the information contained
herein. The information should not be regarded by recipients as a substitute for the exercise of their own judgment. Ninepoint Partners LP is
the investment manager of the Sprott Resource Class, Sprott Diversified Bond Class, Sprott Short-Term Bond Class, Sprott Silver Equities
Class, Sprott Enhanced Equity Class, Sprott Enhanced Balanced Class, Sprott Real Asset Class, Sprott Enhanced U.S. Equity Class, Sprott
Focused Global Dividend Class and Sprott Focused U.S. Dividend Class (the ‘‘Funds’’). Commissions, trailing commissions, management
fees and other expenses may be associated with these Funds. Please read the simplified prospectus carefully before investing. The indicated
rates of return are based on the historical annual compounded total returns, including changes in share value and reinvestment of all
distributions, and do not take into account sales, redemption, distribution or optional charges or income taxes payable by any shareholder that
would have reduced returns. Mutual funds are not guaranteed; their share values and investment returns will fluctuate, and past performance is
not indicative of future performance