sprinkler deposition modelling alcoa wagerup unit 3 · sprinkler deposition modelling alcoa wagerup...
TRANSCRIPT

SPRINKLER DEPOSITION MODELLING
Alcoa Wagerup Unit 3 for
Alcoa World Alumina Australia ENVIRON Australia Pty Ltd Suite 3, Level 2, 200 Adelaide Terrace East Perth WA 6006 Australia Telephone: +618 9225 5199 Ref: sprinkler report_NS Facsimile: +618 9225 5155 12 April 2005

Sprinkler Deposition Modeling Report 12 April 2005 For Alcoa World Alumina Page i
Ref: Sprinkler Report Ver 3 ENVIRON
TABLE OF CONTENTS
Page No.
1. INTRODUCTION.................................................................................................................... 1 1.1 BACKGROUND ......................................................................................................... 1 1.2 RDA’S .......................................................................................................................... 1 1.3 RDA DUST MANAGEMENT STRATEGIES......................................................... 2 1.4 THIS STUDY .............................................................................................................. 4
2. SUMMARY OF PREVIOUS INVESTIGATIONS .............................................................. 5 2.1 BACKGROUND ......................................................................................................... 5 2.2 1994 HGM STUDY..................................................................................................... 5 2.3 ALCOA SPRINKLER MODEL................................................................................ 6
2.3.1 Model Assumptions & Implications ............................................................. 7 2.3.2 Standard Operating Procedures - Summary............................................... 8
3. CURRENT SPRINKLER MONITORING PROGRAM ..................................................... 9
4. MODEL SET-UP AND PARAMETERISATION .............................................................. 10 4.1 MODEL PARAMETERIZATION.......................................................................... 11
4.1.1 Evaporation .................................................................................................. 11 4.1.2 Wind Speed and Deposition Data............................................................... 13 4.1.3 Seepage Losses.............................................................................................. 14
4.2 MODEL LIMITATIONS AND ASSUMPTIONS.................................................. 14
5. MODEL RESULTS ............................................................................................................... 16 5.1 BACKGROUND ....................................................................................................... 16 5.2 MODEL PARAMETER SUMMARY .................................................................... 16 5.3 MODEL RESULTS – CURRENT AND PROPOSED SPRINKLER PATTERN16 5.4 RESULTS SUMMARY............................................................................................ 19
6. CONCLUSIONS AND RECOMMENDATIONS............................................................... 20 6.1 RECOMMENDATIONS.......................................................................................... 21
7. REFERENCES....................................................................................................................... 22

Sprinkler Deposition Modeling Report 12 April 2005 For Alcoa World Alumina Australia Page 1
Ref: Sprinkler Report Ver 3 ENVIRON
SPRINKLER DEPOSITION MODELLING – Residue Drying Areas Alcoa Wagerup Unit 3
for Alcoa World Alumina Australia
1. INTRODUCTION
1.1 BACKGROUND Bauxite residue consists of caustic-insoluble components (i.e. haematite, quartz and titanite) which have passed through the Bayer process unaltered, precipitated silica and iron compounds, and residual quantities of caustic soda not recovered in the residue washing stage. This residue is washed and separated into fine and coarse fractions and pumped into the residue drying areas (RDA) where the residue is thickened before being deposited onto drying bays. At the Wagerup refinery residue is produced at a rate of approximately two dry tonnes per tonne of alumina produced. Prior to 1991 residue was stored within ‘wet lakes’, large lined impoundments where the wet residue dried out in the sun and consolidated under its own weight. In 1991, the Wagerup refinery adopted an alternative disposal technology termed 'dry stacking'. The residue is pre-thickened then deposited in thin layers which are left to dry in the sun. The solar drying of the residue produces a high density, stable stack of residue, allowing a form of upstream embankment construction to be employed. Dry residue stacking is now the preferred method of storage and planning of future facilities is based on an extrapolation of Alcoa's current understanding of these management practices. 1.2 RDA’S The existing RDA covers approximately 546 hectares (ha) (to the outer drain) of which 167 ha are used for active drying areas (RDA1-6), 12 ha for the thickener bypass, 69 ha for alkaline water storage and 32 ha for fresh water storage. The Wagerup Unit 3 expansion will result in an increase in the quantity of residue generated, which will require the Residue Planning Liaison Group (RPLG) to revise its Long Term Residue Management Strategy for Wagerup’s bauxite residue areas. A summary of the changes to the RDAs during the expansion include.
1. An increase the Bauxite Residue Drying rate; 2. An expansion of the existing drying area by 80 to 100 Ha; and 3. The initial residue expansion required for Unit 3 will remain within the mid term 30 year
footprint noted in the 2001 Long Term Residue Management Strategy. (At Unit 3 production rates a major expansion outside this footprint is likely to become necessary by 2030).

Sprinkler Deposition Modeling Report 12 April 2005 For Alcoa World Alumina Australia Page 2
Ref: Sprinkler Report Ver 3 ENVIRON
A summary of the changes are presented in Figure 1.
Figure 1: RDA storage Areas
1.3 RDA DUST MANAGEMENT STRATEGIES
Fugitive dust emission from the RDA’s has been recognized as a potentially significant issue and is managed by wetting the surface of the RDA’s using sprinklers. A network of sprinklers has been installed across the drying beds and is used to dampen dry surfaces prior to and during windy periods. Other areas within the residue operations have more permanent dust suppressants applied to them, including revegetation of embankments, bitumen spray, rock aggregate spread as a mulch, waste oil used as a binder on internally draining limestone roads, and grasses grown on residue sand areas which are not going to be disturbed for several years. The Wagerup sprinkler system was initially upgraded in 1999. An additional pumping station was installed for increased capacity. This doubled the number of bays, which could be watered at any given time, allowing a halving of the sprinkler cycle time to one hour based on a five minute watering per bay. In addition a more reliable sprinkler control system was also installed as a part of the upgrade. This system included automation linked to wind speed and direction and pressure switches on each sprinkler lateral with feedback and alarm to the control room to indicate any sprinkler laterals, which are under performing. The level of operator coverage of the residue operations has also been improved. Prior to September 1999, the residue areas were the responsibility of one of the operating centers within the refinery, with
Sprinkler Deposition Modeling Report 12 April 2005 For Alcoa World Alumina Australia Page 3
Ref: Sprinkler Report Ver 3 ENVIRON
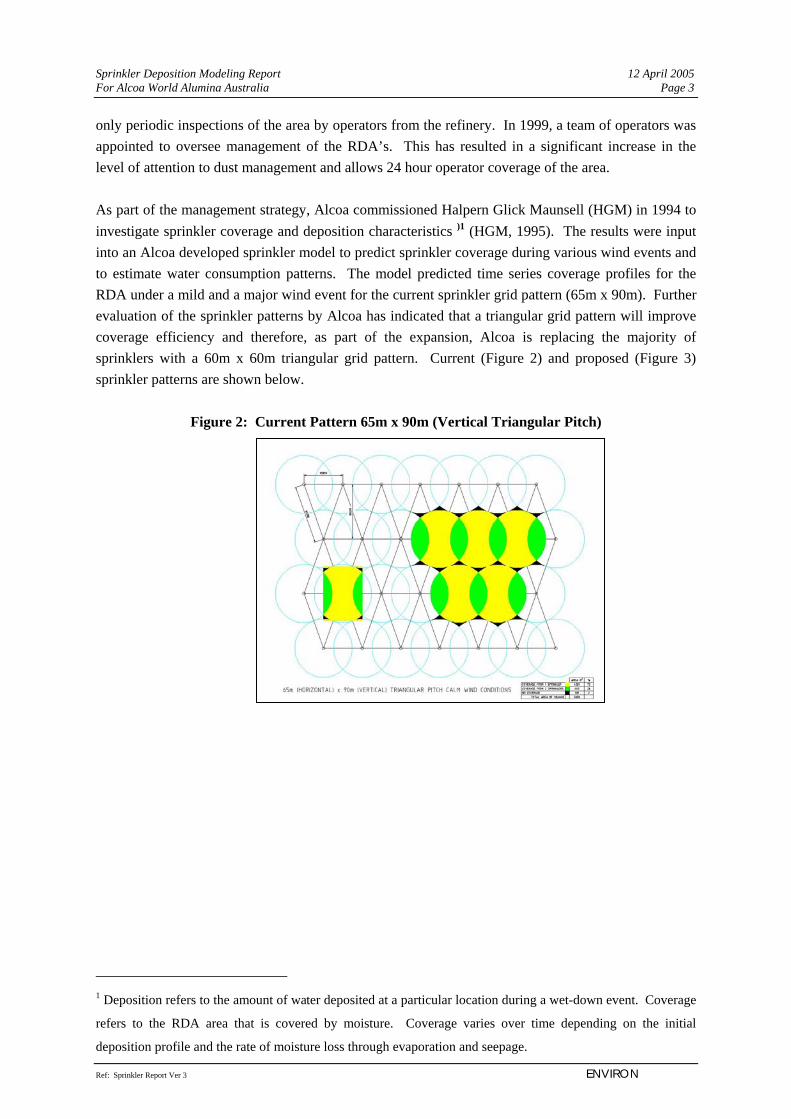
only periodic inspections of the area by operators from the refinery. In 1999, a team of operators was appointed to oversee management of the RDA’s. This has resulted in a significant increase in the level of attention to dust management and allows 24 hour operator coverage of the area. As part of the management strategy, Alcoa commissioned Halpern Glick Maunsell (HGM) in 1994 to investigate sprinkler coverage and deposition characteristics )1 (HGM, 1995). The results were input into an Alcoa developed sprinkler model to predict sprinkler coverage during various wind events and to estimate water consumption patterns. The model predicted time series coverage profiles for the RDA under a mild and a major wind event for the current sprinkler grid pattern (65m x 90m). Further evaluation of the sprinkler patterns by Alcoa has indicated that a triangular grid pattern will improve coverage efficiency and therefore, as part of the expansion, Alcoa is replacing the majority of sprinklers with a 60m x 60m triangular grid pattern. Current (Figure 2) and proposed (Figure 3) sprinkler patterns are shown below.
Figure 2: Current Pattern 65m x 90m (Vertical Triangular Pitch)
1 Deposition refers to the amount of water deposited at a particular location during a wet-down event. Coverage
refers to the RDA area that is covered by moisture. Coverage varies over time depending on the initial
deposition profile and the rate of moisture loss through evaporation and seepage.
Sprinkler Deposition Modeling Report 12 April 2005 For Alcoa World Alumina Australia Page 4
Ref: Sprinkler Report Ver 3 ENVIRON
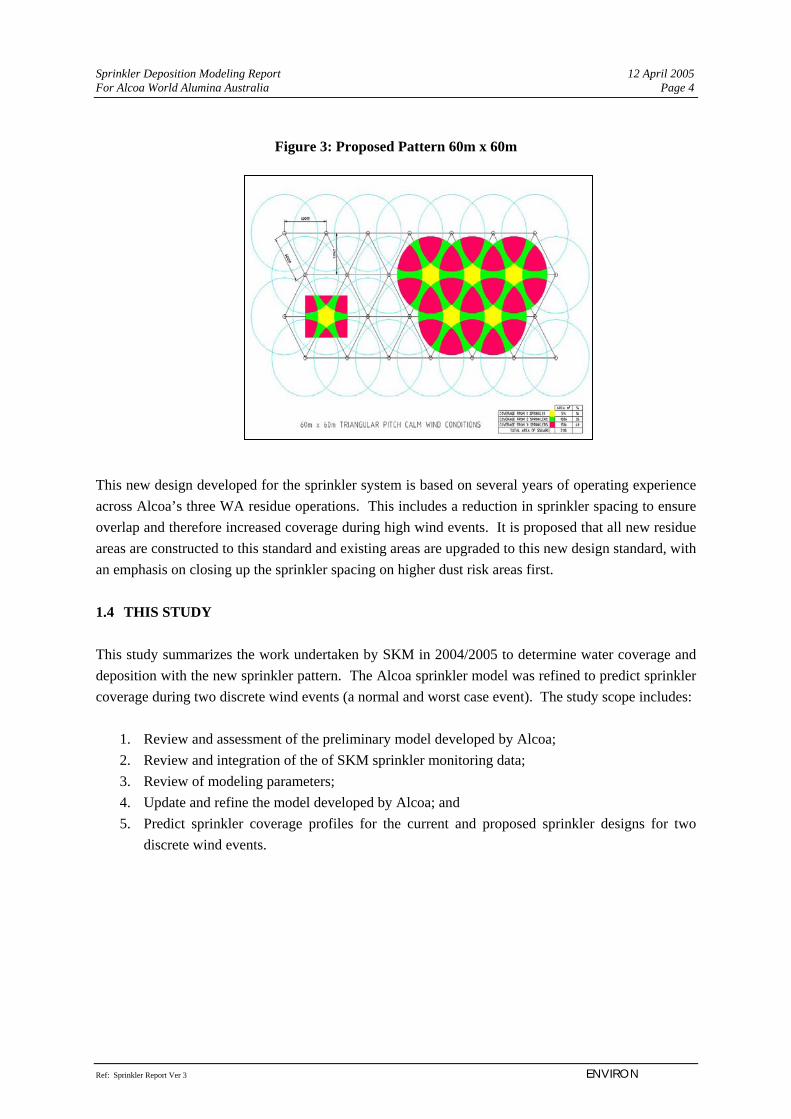
Figure 3: Proposed Pattern 60m x 60m
This new design developed for the sprinkler system is based on several years of operating experience across Alcoa’s three WA residue operations. This includes a reduction in sprinkler spacing to ensure overlap and therefore increased coverage during high wind events. It is proposed that all new residue areas are constructed to this standard and existing areas are upgraded to this new design standard, with an emphasis on closing up the sprinkler spacing on higher dust risk areas first. 1.4 THIS STUDY This study summarizes the work undertaken by SKM in 2004/2005 to determine water coverage and deposition with the new sprinkler pattern. The Alcoa sprinkler model was refined to predict sprinkler coverage during two discrete wind events (a normal and worst case event). The study scope includes:
1. Review and assessment of the preliminary model developed by Alcoa; 2. Review and integration of the of SKM sprinkler monitoring data; 3. Review of modeling parameters; 4. Update and refine the model developed by Alcoa; and 5. Predict sprinkler coverage profiles for the current and proposed sprinkler designs for two
discrete wind events.

Sprinkler Deposition Modeling Report 12 April 2005 For Alcoa World Alumina Australia Page 5
Ref: Sprinkler Report Ver 3 ENVIRON
2. SUMMARY OF PREVIOUS INVESTIGATIONS
2.1 BACKGROUND
This section summarizes the previous work undertaken by Alcoa to improve the efficiency and coverage of the sprinklers and the model developed to estimate coverage at discrete wind events. The sprinkler efficiency work was undertaken by HGM in 1994 and determined the amount of water deposited and the coverage profile of sprinklers under varying wind conditions. The water deposition and coverage profiles were improved by varying water pressure and cannon nozzle types. A summary of the work is detailed in section 2.2. The HGM data was subsequently used to develop a simple Excel model to predict sprinkler coverage for a bank of sprinklers over a defined grid size. The model also allowed time series sprinkler coverage profiles under a mild and major event to be determined. A number of assumptions were made in the Alcoa model that are detailed in subsequent sections. Model predictions were for the existing sprinkler grid pattern (sprinklers are spaced in a 65 m x 90 m rectangular pattern). 2.2 1994 HGM STUDY In 1994, Halpern Glick Maunsell (HGM) undertook a monitoring program to investigate sprinkler coverage, deposition characteristics, and the effects of varying sprinkler nozzle size and pressures on sprinkler efficiency (HGM, 1995). A summary of the test program, objectives and cannon performance work includes:
1. Quantifying cannon coverage areas; 2. Quantifying deposition rates and profiles; 3. Determination of uniformity of deposition and coverage profiles along the radius of the
wetted area; 4. Preparation of plots of deposition and coverage profiles; 5. Testing of various cannon nozzle/height combinations; 6. Assessing the effects of operating pressures and droplet sizes on coverage profiles and
deposition rates; and 7. Interpretation of results to identify the best parameters for cannon setup.
The HGM study was performed by placing sample cups in a radial pattern underneath a single sprinkler set up at the Kwinana refinery RDA. The tests were carried out at varying wind speeds with three different nozzle sizes at varying pressures. During each test the cannon was operated for 20 to 30 minutes and the number of rotations, wind speed and wind direction recorded. The results of the study indicted that:
1. In general at low wind speeds, operating pressures between 700 and 1000 kPa gave the best coverage with reasonable uniformity of deposition with the ring nozzle;

Sprinkler Deposition Modeling Report 12 April 2005 For Alcoa World Alumina Australia Page 6
Ref: Sprinkler Report Ver 3 ENVIRON
2. At high wind speeds the tapered bore cannon operating at 850 kPa provided the best coverage with good uniformity of deposition;
3. A sprinkler operation time of 20-25 minutes would be required to achieve adequate watering along the radius of the throw in all wind speeds; and
4. Watering should be undertaken prior to the advent of wind speeds greater than 7.3 m/s as significant distortion of the deposition profiles and narrowing of the coverage profiles occurs at higher wind speeds.
These results were subsequently used to develop coverage and deposition plots for each set of conditions studied and recommendations were made regarding sprinkler management.
2.3 ALCOA SPRINKLER MODEL The HGM results were used to develop an Excel model to predict sprinkler coverage for the existing sprinkler pattern at various wind speeds. The model was set-up with a 10 x 10 grid pattern, with each grid square representing a 10 m x 10 m area. Based upon the coverage plots determined by HGM, Alcoa estimated a deposition rate for each grid square at various wind speeds. This was undertaken by determining the average deposition over the entire grid and multiplying this by the number of sprinklers whose coverage profiles contributed to deposition at each grid square. The model assumed a 5 minute watering period at the commencement of every hour. Based on the assumed wind speed for the first hour, deposition grids were installed representing the amount of water deposited in that area during the watering period. A value of 0.3 (representing a constant evaporation rate) was then subtracted from each grid square to represent the amount of evaporation occurring during the following hour. A second 5 minute watering period was assumed to commence in the second hour, and values in the respective deposition grid were added to those from the previous hour. This process was repeated a number of times to predict coverage over an extended period. The model was based on a number of assumptions, including:
1. Sprinkler coverage profiles were obtained from experimental data contained in the 1994/1995 HGM Dust Generation and Suppression Report and used in the model instead of monitored deposition data;
2. Coverage was assumed to occur where the ground was wetted to a depth of at least 0.3mm, as defined in the HGM report;
3. Over spray from neighborhood sprinklers were not considered; 4. Run-off effects from flooded areas were not considered; 5. Sprinkler heads were assumed to operate for five minutes at the commencement of every
hour; 6. Sprinklers were assumed to be in a 65 m x 90 m rectangular pattern, and coverage profiles for
individual sprinklers were superimposed to generate a composite profile; 7. Average deposition data were used to derive deposition grids from the composite coverage
profiles;

Sprinkler Deposition Modeling Report 12 April 2005 For Alcoa World Alumina Australia Page 7
Ref: Sprinkler Report Ver 3 ENVIRON
8. Wind direction was assumed to be constant, with profiles created on the assumption that wind is blowing in an easterly direction;
9. Sprinklers were set at a height of 1.8 m, with a pressure of 700 kPa; 10. A constant evaporation rate of 7 mm/day was used based on an average pan evaporation rate
recorded by HGM. This evaporation rate does not alter with wind speed or vary with mud condition;
11. Evaporation was not accounted for during operation of sprinklers; and 12. Seepage rates were not considered.
2.3.1 Model Assumptions & Implications The assumptions made in the model affect the accuracy of the derived sprinkler deposition grids, predictions of sprinkler coverage over time, and dust emission estimates. In refining the model, ENVIRON has aimed to address the assumptions that have the greatest potential for errors. A summary of the key assumptions made in the Alcoa model and its potential implications are detailed below. 2.3.1.1 Deposition The model assumes even deposition across each sprinkler profile as composite coverage profiles were developed to derive deposition grids. Analysis of measured deposition data during the HGM monitoring program indicates significant differences in deposition across the grid with peak deposition rates generally occurring towards the middle of the throw and lower deposition rates at the edges of the throw. This study has therefore used measured deposition rates to derive composite deposition grids. 2.3.1.2 Sprinkler Cycling Times The model assumed that the sprinklers are operated at the commencement of every hour. However the frequency of sprinkler wet-downs are determined by plant operators based upon the previous day’s predictions of weather conditions. Standard operating procedures allow for wet-downs to occur as infrequently as 4 hourly during the most severe weather conditions, and an assumption of hourly watering may therefore provide an over-prediction of coverage over time. This study has therefore considered a number of operational frequencies to assess coverage over time. 2.3.1.3 Evaporation Rates The Alcoa model assumed a constant evaporation rate of 0.3 mm/hr. The average summer pan evaporation rate is 0.3 mm/hr, however this can range up to 1.2 mm per hour of sunshine (based upon measurements taken by the Bureau of Meteorology at Perth Airport during January 2005). This may cause water coverage over time to be significantly underestimated. This study has therefore used variable evaporation rates based on measured pan evaporation rates to assess moisture loss off the RDA’s.

Sprinkler Deposition Modeling Report 12 April 2005 For Alcoa World Alumina Australia Page 8
Ref: Sprinkler Report Ver 3 ENVIRON
2.3.1.4 Wind Direction Since the HGM monitoring programs were undertaken using a single sprinkler surrounded by a radial grid, wind direction did not influence overall coverage. Sprinkler coverage and deposition profiles were consistent regardless of wind direction. However, assuming a constant wind direction over time may cause coverage over some sections of the model grid to be overestimated (because they are assumed to always receiving a portion of the throw) and some sections to be underestimated (because they are assumed to never receive a portion of the throw. In addition, the model cannot handle assessment of multiple sprinklers, as wind direction will play a role in determining the degree of overlap between adjacent sprinkler profiles and may influence modeling results. 2.3.2 Standard Operating Procedures - Summary Alcoa has developed a number of standard operating procedures for its sprinkler systems. A summary of the key aspects of the operating procedures are presented below:
1) 20.3 mm taper bore nozzles are used for sprinklers; 2) Sprinklers are set to operate at a minimum sprinkler head pressure of 700 kPa; 3) Sprinkler heights start at 3 m from the residue surface, but the height is progressively reduced
as the RDA fills with residue. When the height is reduced to 1.6 m, sprinklers are raised back up to 3 m as soon as they are accessible. Sprinkler heights therefore vary between 1.6 m and 3 m;
4) Sprinklers are set to automatically operate for a period of 5 minutes; 5) Procedures do not specify the frequency at which wet-downs are to occur, and this is left to
operators to determine based upon meteorological predictions for the day in question; 6) During extreme dust risk conditions (forecast winds greater than 50 kph with gusts), operating
frequency may vary between 1 - 4 hourly; 7) During high risk conditions (30 – 50 kph winds with no significant rainfall forecast),
operating frequency may vary between 1 – 6 hourly; 8) During moderate risk conditions (20 – 30 kph winds and no significant rainfall forecast),
operating frequency may vary between 1 – 8 hourly; and 9) Continuous dust monitors are set around the perimeter of the RDA, and wet-downs occur if
dust readings exceed 400 µg/m3.

Sprinkler Deposition Modeling Report 12 April 2005 For Alcoa World Alumina Australia Page 9
Ref: Sprinkler Report Ver 3 ENVIRON
3. CURRENT SPRINKLER MONITORING PROGRAM
In 2004, a sampling program based on the HGM testing, was designed and conducted by SKM to determine coverage and deposition of both the existing and new sprinkler arrangements. Although the monitoring was similar to the HGM program, the sample cups were positioned under banks of sprinklers rather than under a single sprinkler. The intent of this was to directly measure the influence of adjoining sprinklers on deposition. The field assessment of the sprinkler coverage trial was conducted between the 16th November 2004 and 1st December 2004. The monitoring program consisted of installing water collection cups every 3 m to a distance of 60 m radiating out every 45o from a central sprinkler. The cups used were 225 ml plastic cups with a cross sectional area of 0.00363m2 which were placed into a 401 ml jars buried in the RDA surface. The sprinklers were turned on using the automated sprinkler control system for the normal operating time of five minutes with the trial conducted for a range of wind speeds (measured using a TSI Model 8330 air velocity meter). Details of the methodology can be found in SKM 2004, RSA Dust Suppression Assessment-Phase 1. The testing program revealed that the sprinklers were not performing up to their design capabilities (SKM 2005) and it may due to variability in pressure head of the water supplied to the sprinklers. This could not be verified as the testing program did not record water pressures at the sprinkler heads. In addition there were a number of other factors that resulted in the data not being suitable for use in the refined model, including:
1. Variations in the sampling methodology resulted in problems exporting the data into the model grids. The SKM sampling program was developed by arranging the sampling cups in a radial pattern, as per the HGM tests. This arrangement was suitable for the HGM test because a single sprinkler was being tested – the results of HGM tests could be superimposed to create composite profiles over a larger area. However, the introduction of additional sprinklers for the SKM trials invalidated this approach, and estimates of coverage over a larger area could only be done by transposing the radial grid onto a Cartesian grid which resulted in a number of grid squares receiving insufficient data;
2. Sampling was conducting only during relatively low wind speed conditions – sampling was not conducted for winds speeds greater than 10 m/s, which is when there is greatest potential for dust lift-off;
3. Sprinkler heights were set at 3 m, which is their maximum height. Alcoa procedures allow for sprinkler heights ranging from 1.6 m to 3 m, and the lower heights would have provided a more conservative estimate of deposition and coverage;
4. The figures and data presented in the SKM report were of coverage not deposition. It is understood that coverage was estimated based on the profile of a sprinkler (indicative). This did not correlate with measured deposition data as the deposition data was highly variable; and
5. The correlation of wind speed with coverage was highly variable.

Sprinkler Deposition Modeling Report 12 April 2005 For Alcoa World Alumina Australia Page 10
Ref: Sprinkler Report Ver 3 ENVIRON
A subsequent re-trial in 2005 was undertaken using a slightly different sampling grid with the cups placed every 5 m to a distance of 60m, radiating towards each adjacent sprinkler, 30o from the North-South line rather than 45o. The test also incorporated a series of cups arranged in a square around the central sprinkler to assist in post-processing. This trial measured wind speed and direction and water pressure at the sprinkler head during the sampling program, but no high wind events were captured. Therefore a more comprehensive monitoring program is still required to obtain a representative data set of water deposition rates vs wind speed. Therefore for this study, ENVIRON only utilized HGM deposition data to estimate overall sprinkler coverage at various wind speeds. Given that there was no deposition data at wind speeds greater than 10 m/s, the existing available data was extrapolated to provide an indication of sprinkler deposition at the higher wind speeds. The subsequent sections details the model set-up, assumptions and limitation of the model given the lack of high wind data, and recommendations for further monitoring to validate this model.
4. MODEL SET-UP AND PARAMETERISATION This section details the model set-up and parameterization of variables required to predict sprinkler coverage over specified grid dimensions. The model set-up was based on the preliminary Alcoa model and utilized deposition data from HGM rather than the recent SKM studies due to reasons iterated previously. The HGM results were used to develop an Excel model to predict sprinkler coverage for the existing and proposed sprinkler pattern at various wind speeds. The model was set-up with two grid patterns representing the current and proposed sprinkler program, a 65m x 90m grid and a 60 m x 60 m grid respectively with the HGM deposition data superimposed onto the sprinklers. The model assumes a 5 minute watering period at the commencement of the wetting cycle. Based on the assumed wind speed for the first hour, the respective deposition grid was determined, representing the amount of water deposited in that area during the watering period. The proposed 60 m x 60 m triangular sprinkler pattern will result in 17 sprinklers, including the central sprinkler, to potentially contribute to deposition within the Cartesian grid. The deposition observed in all sampling cups contained within each Cartesian grid square was averaged to give a deposition result for that grid. Where there were no sampling cups within a particular grid square, deposition results in neighboring grid squares were averaged to derive a deposition result for the blank square. The deposition grids for each of these sprinklers were then superimposed to form a composite deposition grid for each of the wind speeds monitored by HGM (1.6, 2.6, 5.6 and 8.8 m/s). Wind direction was assumed to be constant for the purposes of the model and each of the four composite deposition grids were developed based upon an easterly wind direction. The ENVIRON model was run for two separate event scenarios, these being ‘worst case’ and ‘typical’. The worst case scenario represents wind speeds observed at the Wagerup RDA site over a 24 hour period from midnight to 11pm 29 March 2003. This was statistically the windiest day of that year, with both the highest peak and average wind speeds observed. The typical scenario represents wind speeds during a

Sprinkler Deposition Modeling Report 12 April 2005 For Alcoa World Alumina Australia Page 11
Ref: Sprinkler Report Ver 3 ENVIRON
hypothetical 12 hr period, with wind speeds ranging from 1 m/s to 6 m/s. This covered the usual range of wind speeds observed in the study area.
4.1 MODEL PARAMETERIZATION
4.1.1 Evaporation There are a number of factors affecting evaporation such as temperature, humidity, vapor pressure, radiation and wind speed. Evaporation is a function of the energy state of the system and therefore generally a surface energy balance method first proposed by Bowen (1926) can be used to calculate evaporation of the RDA surface. This method is not common as the energy components required for the equation are not readily available.
(Rt+Ea) – (Ee+Hh+Rr+R1) = Es Equation (1) Where, Rt – Net solar energy Ea – net energy advected into the surface Ee – Energy used for evaporation Hh – sensible heat lost to the atmosphere Rr – reflected solar energy R1 -Longwave radiation exchange between the atmosphere and water body. Es – rate of net energy stored in the body This approach can be further simplified to estimate evaporation rate of the RDA’s
Er = 1/(Lvρw) (Rn-Hs-G) Equation (2) Where, Er – evaporation rate from the open RDA surface Lv- latent heat of vaporization Rn - net radiation energy Hs – Sensible heat of air G – Heat loss However when heat energy is not limiting, the rate of evaporation is controlled by the rate of vapor transport from the evaporating surface and the ability of water vapour to be transported away from the evaporating surface is essentially controlled by wind speed and gradient of humidity. This can be estimated by the aerodynamic method and is given by the Thornthwaite-Holsman equation. However both the aerodynamic method and the heat energy methods are applicable when only one process is dominant and other processes are not limiting. For example, the heat energy balance method is applicable when heat energy is the limiting process and the aerodynamics are not limiting. However

Sprinkler Deposition Modeling Report 12 April 2005 For Alcoa World Alumina Australia Page 12
Ref: Sprinkler Report Ver 3 ENVIRON
as both these processes are competing within the RDAs and limiting, a method incorporating both these methods needs to be used. A weighted approach is used and the corresponding evaporation E is given by the Priestley-Taylor evaporation equation which is a modification of the Penman equation. However as none of the variables required for the calculations were measured during the SKM monitoring program, a simplified approach using the pan evaporation rates was used. As pan evaporation rates were not measured on site, ENVIRON examined meteorological data collected by the Bureau of Meteorology at Perth Airport and by the Department of Agriculture at its Vasse monitoring station to obtain evaporation rates as a function of wind speed. A composite data set was obtained with the upper bounds nudged to reflect the maximum daily evaporation rate observed at the Perth Airport to ensure a degree of conservatism. Although there was reasonable correlation of evaporation with wind speed, higher average wind speeds were not recorded at either of the stations. In extracting the data, periods of rainfall were extracted from the dataset to again provide a degree of conservatism in the evaporation rates. A summary of the correlation is presented in the Figure below. Figure 4: Monthly Average Wind Speeds vs Evaporation Rate (Vasse Station, 1990 – 2004)
00.050.1
0.150.2
0.250.3
0.350.4
0.450.5
1 1.5 2 2.5 3 3.5 4
Wind Speed (m/s)
Evap
orat
ion
(mm
/hr)
This data set was used in the model to account for evaporation losses off the RDA surface. The above data were used to derive an equation to extrapolate evaporation rates at high wind speeds.
ER = (0.0659 x WS) + 0.0778 Equation (3) Where: ER = Evaporation Rate in mm/hr WS = Wind Speed in m/s The resultant extrapolated dataset is presented in the Figure below.

Sprinkler Deposition Modeling Report 12 April 2005 For Alcoa World Alumina Australia Page 13
Ref: Sprinkler Report Ver 3 ENVIRON
Figure 5: Summary of Evaporation Rates as a function of Wind Speed – Extrapolated Data
0
0.2
0.4
0.6
0.8
1
1.2
1.4
1.6
2.4 3
4.6
5.8
10.2
13.5
14.1
14.5
15.1
16.3
17.6
18.6
Wind Speed (m/s)
Eva
pora
tion
(mm
/hr)
In accounting for evaporation losses, spray evaporation losses, which is the portion of water that is lost by evaporation during the time it travels through the air and before it reaches the RDA surface, was not accounted for in the model. Any losses of the droplets occurring as a result of wind drift is not included in this assessment as spray is assumed to fall within the boundaries of the sprinkler throw, the only effect would be on the uniformity of the water application. Spray evaporation and drift losses can be calculated based on the amount of water discharged by sprinklers and the amount of water collected in the catch cans. This measurement was not undertaken by SKM but can be easily undertaken in subsequent measurements. However as actual deposition data were used in this study to estimate coverage efficiency, this is considered to have minimal affect on the model outcomes. However, the above losses may have a bigger impact on water consumption patterns. 4.1.2 Wind Speed and Deposition Data ENVIRON has assumed that coverage and deposition patterns are equivalent to those determined by HGM in 1994. HGM obtained deposition data for a sprinkler set at 1.8 m height, 700 kPa pressure and with a 20.3 mm taper bore nozzle, which closely resembles current conditions. In all, 15 tests were conducted at various wind speeds, however these have been averaged in groups of 5, providing 3 sets of composite results at average wind speeds of 1.6 m/s, 2.6 m/s and 8.8 m/s. In addition, 6 tests were undertaken at 750 kPa - these were averaged to provide a composite result for an average wind speed of 5.6 m/s. The HGM raw deposition data were presented in terms of deposition observed in cups set up in a radial pattern extending 60 m in 8 directions from the centre. ENVIRON plotted these sample points for the current sprinkler pattern (65 m x 90 m) and the proposed sprinkler pattern (60 m x 60 m). In both instances, the data set was transposed onto a 10 x 10 Cartesian grid with each grid square representing a 6m x 6 m area. As there are currently no reliable deposition data above wind speeds of 8.8 m/s, ENVIRON has assumed that sprinkler deposition rates at higher wind speeds were equivalent to those at the highest measured wind speed of 8.8 m/s. This is an underestimation of the deposition profiles at wind speeds

Sprinkler Deposition Modeling Report 12 April 2005 For Alcoa World Alumina Australia Page 14
Ref: Sprinkler Report Ver 3 ENVIRON
higher than 10 m/s, however given those winds greater than 10 m/s occur only for 2 percent of the time, this approach was considered acceptable to provide an indication of sprinkler coverage at the high winds. This was undertaken with the view to validate and verify this and other model assumptions by conducting a more robust sprinkler monitoring program. A summary of the frequency of winds in the study area is presented in Figure 6.
Figure 6: Frequency of Winds – Alcoa Wagerup
2
4.1.3 Seepage Losses In the absence of data to the contrary, ENVIRON has assumed that water seeps through residue at a rate of 10-8 m/s (or 0.036 mm/hr) This is based on the premise that seepage through residue will be similar to that of un-compacted clay.
4.2 MODEL LIMITATIONS AND ASSUMPTIONS ENVIRON has used an Excel spreadsheet model set-up similar to the Alcoa model described in Section 2.2 to predict coverage over time. The ENVIRON model makes the following assumptions, some of which differ significantly to those used in the Alcoa model:
1) Deposition within each grid square has been derived from HGM raw deposition data rather than from coverage patterns;
2) ENVIRON has assumed that there is no overspray, and no lateral water movement due to flooding;
3) Deposition grid patterns have been assumed to be a function of wind speed;
2 Wind frequency data provide by Air Assessments (Owen Pitts)
0
2
4
6
8
10
12
14
16
18
20
0 2 4 6 8 10 12 14 16
Wind Speed (m/s)
Perc
ent F
requ
ency
(%)
Apr97-Mar98
Apr98-Mar99
Apr99-Mar00
Apr00-Mar01
Apr01-Mar02
Apr02-Mar03
Apr03-Mar04

Sprinkler Deposition Modeling Report 12 April 2005 For Alcoa World Alumina Australia Page 15
Ref: Sprinkler Report Ver 3 ENVIRON
4) The composite deposition grid derived from HGM data collected at an average wind speed of 1.6 m/s has been assumed to be appropriate for all wind speeds less than 2 m/s;
5) The composite deposition grid derived from HGM data collected at an average wind speed of 2.6 m/s has been assumed to be appropriate for all wind speeds between 2 m/s and 3.9 m/s;
6) The composite deposition grid derived from HGM data collected at an average wind speed of 5.6 m/s has been assumed to be appropriate for all wind speeds between 4 m/s and 6.9 m/s;
7) The composite deposition grid derived from HGM data collected at an average wind speed of 8.8 m/s has been assumed to be appropriate for all wind speeds of 7 m/s or greater;
8) Wind direction has assumed to be constant, with composite grids being developed based on winds being easterly;
9) Sprinklers have been assumed to be fitted with 20.3 mm taper bore nozzles and to be operated at 700 kPa pressure at a height of 1.8 m above the residue, as per the conditions present during the HGM study;
10) The evaporation rate has been assumed to be a function of wind speed, as defined in Equation 3;
11) Seepage has been assumed to be a constant 10-8 m/s (0.036 mm/hr); 12) Total water loss per hour has been assumed to be equal to the evaporate rate plus the seepage
loss; 13) Wet-downs have been assumed to occur for a 5 minute period at the commencement of an
hour, with the frequency of wet-downs variable, based upon the range allowed by Alcoa standard procedures; and
14) The rate of deposition over each grid square has been assumed to be uniform and constant for the duration of watering.
Sprinkler Deposition Modeling Report 12 April 2005 For Alcoa World Alumina Australia Page 16
Ref: Sprinkler Report Ver 3 ENVIRON
5. MODEL RESULTS
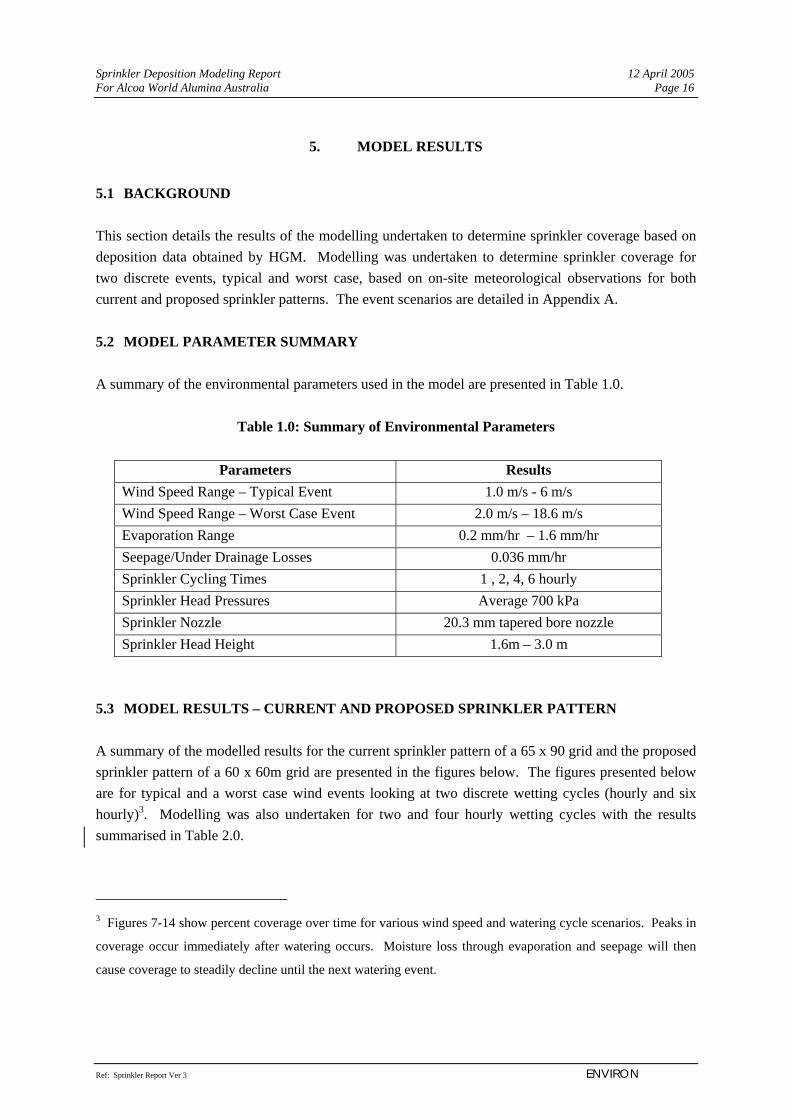
5.1 BACKGROUND This section details the results of the modelling undertaken to determine sprinkler coverage based on deposition data obtained by HGM. Modelling was undertaken to determine sprinkler coverage for two discrete events, typical and worst case, based on on-site meteorological observations for both current and proposed sprinkler patterns. The event scenarios are detailed in Appendix A. 5.2 MODEL PARAMETER SUMMARY A summary of the environmental parameters used in the model are presented in Table 1.0.
Table 1.0: Summary of Environmental Parameters
Parameters Results Wind Speed Range – Typical Event 1.0 m/s - 6 m/s Wind Speed Range – Worst Case Event 2.0 m/s – 18.6 m/s Evaporation Range 0.2 mm/hr – 1.6 mm/hr Seepage/Under Drainage Losses 0.036 mm/hr Sprinkler Cycling Times 1 , 2, 4, 6 hourly Sprinkler Head Pressures Average 700 kPa Sprinkler Nozzle 20.3 mm tapered bore nozzle Sprinkler Head Height 1.6m – 3.0 m
5.3 MODEL RESULTS – CURRENT AND PROPOSED SPRINKLER PATTERN A summary of the modelled results for the current sprinkler pattern of a 65 x 90 grid and the proposed sprinkler pattern of a 60 x 60m grid are presented in the figures below. The figures presented below are for typical and a worst case wind events looking at two discrete wetting cycles (hourly and six hourly)3. Modelling was also undertaken for two and four hourly wetting cycles with the results summarised in Table 2.0.
3 Figures 7-14 show percent coverage over time for various wind speed and watering cycle scenarios. Peaks in
coverage occur immediately after watering occurs. Moisture loss through evaporation and seepage will then
cause coverage to steadily decline until the next watering event.

Sprinkler Deposition Modeling Report 12 April 2005 For Alcoa World Alumina Australia Page 17
Ref: Sprinkler Report Ver 3 ENVIRON
Figure 7: Hourly Watering –Typical Event (Current ) Figure 8: Six Hourly Watering - Typical Event (Current) Figure 9: Hourly Watering – Worst Case Event (Current) Figure 10: Six Hourly Watering – Worst Case Event (Current)
0
20
40
60
80
100
120
0 2 4 6 8 10 12
Time (hours)
% C
over
age
0
1
2
3
4
5
6
7
Win
d S
peed
(m/s
)
coverageWind Speed
0
20
40
60
80
100
120
0 2 4 6 8 10 12
Time (hours)
% C
over
age
0
1
2
3
4
5
6
7
Win
d S
peed
(m/s
)
coverage
Wind Speed
0
10
20
30
40
50
60
70
80
90
100
0 4 8 12 16 20 24
Time (hours)
% C
over
age
0
2
4
6
8
10
12
14
16
18
20
Win
d Sp
eed
(m/s
)
coverage
Wind Speed
0
20
40
60
80
100
120
0 4 8 12 16 20 24
Time (hours)
% C
over
age
02468101214161820
Win
d Sp
eed
(m/s
)
coverage
Wind Speed

Sprinkler Deposition Modeling Report 12 April 2005 For Alcoa World Alumina Australia Page 18
Ref: Sprinkler Report Ver 3 ENVIRON
Figure 11: Hourly Watering –Typical Event (Proposed) Figure 12: Six Hourly Watering - Typical Event (Proposed) Figure 13: Hourly Watering – Worst Case Event (Proposed) Figure 14: Six Hourly Watering – Worst Case Event (Proposed)
0
20
40
60
80
100
120
0 2 4 6 8 10 12
Time (hours)
% C
over
age
0
1
2
3
4
5
6
7
Win
d Sp
eed
(m/s
)
coverageWind Speed
0
20
40
60
80
100
120
0 2 4 6 8 10 12Time (hours)
% C
over
age
0
1
2
3
4
5
6
7
Win
d Sp
eed
(m/s
)
coverageWind Speed
0
20
40
60
80
100
120
0 4 8 12 16 20 24
Time (hours)
% C
over
age
02468101214161820
Win
d Sp
eed
(m/s
)
coverageWind Speed
0
20
40
60
80
100
120
0 4 8 12 16 20 24
Time (hours)
% C
over
age
0
2
4
6
8
10
12
14
16
18
20
Win
d Sp
eed
(m/s
)
coverageWind Speed

Sprinkler Deposition Modeling Report 12 April 2005 For Alcoa World Alumina Australia Page 19
Ref: Sprinkler Report Ver 3 ENVIRON
5.4 RESULTS SUMMARY
A summary of the two modelling events, typical and worst-case during discrete sprinkler cycling times are presented with the corresponding sprinkler cover ages for both the current and proposed sprinkler designs.
Table 2.0: Summary for Coverage results for existing and proposed sprinkler designs.
Current Sprinkler Design Proposed Sprinkler Design
Typical Worst Case Typical Worst Case Sprinkler
Cycle Average WS
(m/s) Average
Coverage (%) Average WS (m/s)
Average Coverage (%)
Average WS (m/s)
Average Coverage (%)
Average WS (m/s)
Average Coverage (%)
1 hourly 3.3 81.00% 11.2 61.00% 3.3 91.00% 11.2 77.00% 2 hourly 3.3 54.00% 11.2 NT 3.3 73.00% 11.2 NT 4 hourly 3.3 38.00% 11.2 NT 3.3 56.00% 11.2 NT 6 hourly 3.3 27.00% 11.2 23.00% 3.3 40.00% 11.2 32.00%
Notes
1. Hourly wind speed data obtained from on-site observations 2. The sprinkler cycles were obtained from Alcoa’s Standard Operating Conditions 3. Total Sprinkler coverage included total moisture loss due to evaporation and seepage/under drainage losses 4. Wind speed was averaged for the duration of the event scenario 5. Coverage was averaged for the duration of the event scenario 6. The data used in the model
‘
The average coverage for the duration of each scenario has been determined by averaging the coverage at the start of each hour (or if watering occurred during that hour, the coverage immediately after watering) and at the end of hour, and then averaging these results.

Sprinkler Deposition Modeling Report 12 April 2005 For Alcoa World Alumina Australia Page 20
Ref: Sprinkler Report Ver 3 ENVIRON
6. CONCLUSIONS AND RECOMMENDATIONS
The model predicts better coverage for the proposed sprinkler system for all watering events under both typical and worst case conditions. The proposed sprinkler pattern improves overall coverage by 16% during a major event with only a 9% improvement during lower wind speeds for an hourly sprinkler cycle. This difference is marginal for larger wetting cycles due to a large influence on external factors. However, the area currently not covered by the existing sprinklers is predicted to be reduced by 41% with the installation of the new sprinkler pattern. At this stage it is unclear if this would translate to a 41% reduction in dust emissions as further monitoring is required to correlate deposition data with fugitive dust emissions. The results of the sprinkler modeling indicate that pre-wetting and hourly watering is required to achieve good coverage during higher wind events due to the influences of external factors such as evaporation and seepage. Preliminary work undertaken by Alcoa (Residue Carbonation Review) indicates that seepage/under drainage is a significant contributor to RDA drying times, more so than evaporation losses. This will therefore influence the coverage efficiencies and subsequently dust emissions. It must be noted that these results are conservative and do not account for temporal or diurnal variations, overcast cloudy days where solar radiation and surface heat fluxes are minimal, variability of RDA compaction and seepage loss, variability of material age and therefore drying times. Alternatively, the data does not account for failure of laterals, sub-optimal sprinkler heights and sprinkler head pressures, thereby producing lower coverage. The hourly watering (sixty minute cycle times) ensures that approximately 80% of the RDAs are wetted within 60 minutes. A 60 minute cycle time is required, due to the water flow required to supply enough laterals, the system pumping requirements and size of the supply header. In conclusion, the model provides an indication of the efficiency of the current and proposed sprinklers system to wet the RDA surface thereby controlling dust emissions. As iterated earlier this model needs to be validated and verified against site observations and measurements (sprinkler coverage over a predetermined area) to provide a degree of confidence in the modeling. In addition, field measurements during high wind events are required to estimate sprinkler performance. This being the case, the modeling results should be one of the tools used to predict sprinkler coverage not the only tool. The model will need to be validated and verified by undertaking:
1) Further sprinkler deposition monitoring over the range of wind events; 2) Estimating sprinkler coverage using tools such as satellite imagery and or aerial photography
for comparison against model predictions; and 3) Validation of dust emissions calculated from the sprinkler coverage data against boundary
monitors and ambient dust measurements for the existing and proposed sprinkler systems. A comprehensive list of recommendations are provide in section 6.1

Sprinkler Deposition Modeling Report 12 April 2005 For Alcoa World Alumina Australia Page 21
Ref: Sprinkler Report Ver 3 ENVIRON
6.1 RECOMMENDATIONS Based on the monitoring data and the modeling the following recommendations are made:
1) Deposition Monitoring: Deposition monitoring on a single sprinkler similar to that undertaken by HGM should be undertaken. The monitoring program needs to be undertaken to capture both the low and high wind events. Also the monitoring program should include varying sprinkler heights and pressures that are likely to be expected during operation of the new sprinkler pattern. The critical component in the monitoring is the collection of reliable deposition data with correlating wind events for use in the model. Therefore the size of the grid and grid spacing need to be so that the entire sprinkler throw is captured. It would be prudent to capture deposition over a large time period 10 or 20 minutes to obtain accurate collection data for the outer-grids, which can be subsequently modified for a five minute watering interval. During the monitoring program additional environmental parameters are required to be measured for use in the model. This includes pan evaporation rates (hourly), ambient temperatures, wind speed and wind direction, radiation data if recorded and moisture loss form the RDA surface.
2) RDA Drying Times and Total Moisture Loss: Total moisture loss from the RDA and
therefore the subsequent drying times need to be measured and evaluated for temporal and diurnal variations to account for external influences. This will need to be undertaken to capture day and night time as well as summer and winter. This data will therefore ensure that the model more closely predicts sprinkler coverage.
3) Verification of Sprinkler Cycle times and watering durations: The model predicts that
hourly sprinkler cycle times will provide the best coverage during all wind events. However this raises a water consumption issue and therefore requires further scrutiny. Manual observations, aerial photography and or satellite imagery during the various watering events will provide a good indication of the effectiveness of the various watering cycles. It is recommended that this is undertaken under a “worst case” scenario. Although coverage at the time of watering appears reasonable, the model predicts that coverage reduces rapidly, and that an hourly watering frequency may not be sufficient. This is also highlighted in the SKM report with the HGM report specifying watering durations of 20 minutes with recommendations based on field observations indicate that a higher watering durations are required. Whilst the veracity of some assumptions used in the ENVIRON requires field verification , and the predicted water losses may be high as a result, consideration should be given to watering on a more regular, or possibly continuous basis during high wind-speed events to ensure dust minimization. It is recommended that trials at three different watering durations 5 min, 7 min and 10 mins are undertaken to ascertain the variations in coverage and the respective water consumption rates prior to increasing the duration of the wetting period.
4) Model Update: Further model development would be valuable to account for the above
variables in the sprinkler coverage patterns. This model should also be able to predict coverage for various wind events incorporating the influence of sprinkler heights, pressures,

Sprinkler Deposition Modeling Report 12 April 2005 For Alcoa World Alumina Australia Page 22
Ref: Sprinkler Report Ver 3 ENVIRON
meteorological conditions (including wind direction), sprinkler cycle times and RDA drying rates. The model will then need to be subsequently redone to incorporate the proposed deposition monitoring results.
5) Model Validation & Verification: The modeling predictions should be validated against
field measurements, dust monitoring results, field observations regarding coverage profiles and composite deposition data.
A comprehensive monitoring program needs to be developed with most of the parameters discussed is this report to ensure that the coverage profiles of the proposed sprinkler pattern are representative.
7. REFERENCES
1. Alcoa (2003), Perform Response to Daily Risk Rating, Alcoa World Alumina WA Operations AOA Document No. 56932, March 2003
2. HGM (2004), Residue Area Dust Suppression Cannon Testing, Halpern Glick Maunsell, May 1995.
3. SKM (2004), RSA Dust Suppression Assessment, Sinclair Knight Merz, December 2004 (draft document).
4. Alcoa WA Engineering Operations, Residue Carbonation Review 2000, February 05. 5. Halpern Flick Maunsell, Alcoa of Australia, Residue Area Dust Suppression Cannon Testing,
May 1995 6. WA Engineering, Review of the Dust Suppression Systems & Management at the Residue
Drying Areas in WA Alumina Refineries. 7. GE Blight, Measuring evaporation from soil surfaces for environmental and geotechnical
purposes 8. SKM , Alcoa Sprinkler Assessment, Wagerup, Draft, 9th February 2005. 9. SKM, RSA Dust Suppression Assessment, Phase 1.

APPENDIX A Sprinkler Deposition Modeling Report 12 April 2005 For Alcoa World Alumina Australia Page 1
Ref: Sprinkler Report Ver 3 ENVIRON
APPENDIX A Event Scenarios

APPENDIX A Sprinkler Deposition Modeling Report 12 April 2005 For Alcoa World Alumina Australia Page 2
Ref: Sprinkler Report Ver 3 ENVIRON
Event Scenarios
Hour Wind Speed (m/s)
Total water loss (mm/hr)
1 5.2 0.46 2 4.6 0.42 3 4 0.38 4 3 0.31 5 2.4 0.27 6 2.7 0.29 7 5.8 0.50 8 10.2 0.79 9 11 0.84
10 13.5 1.00 11 14.6 1.08 12 14.5 1.07 13 15.1 1.11 14 14.3 1.06 15 14 1.04 16 14.1 1.04 17 15.6 1.14 18 16.3 1.19 19 17.3 1.25 20 17.6 1.27 21 18.6 1.34 22 18.6 1.34 23 7.8 0.63
‘Worst Case’ Event
24 7.8 0.63
1 2 0.25 2 3 0.31 3 4 0.38 4 5 0.44 5 6 0.51 6 5 0.44 7 4 0.38 8 3 0.31 9 2 0.25
10 1 0.18 11 2 0.25
‘Typical’ Event
12 3 0.31
APPENDIX A Sprinkler Deposition Modeling Report 12 April 2005 For Alcoa World Alumina Australia Page 3
Ref: Sprinkler Report Ver 3 ENVIRON
The model was run for the worst case event with two wet-down frequency scenarios:
• Wet-downs at the commencement of hours 1, 7, 11, 15, 19 and 23 (representing the most
infrequent wet-down frequency allowed by Alcoa’s standard procedures); and
• Wet-downs at the commencement of every hour.
The model was run for the typical event with four wet-down frequency scenarios:
• Wet-downs at the commencement of hours 1 and 7 (6-hourly watering cycle);
• Wet-downs at the commencement of hours 1, 5 and 9 (4-hourly watering cycle);
• Wet-downs at the commencement of every odd hour (2-hourly watering cycle); and
• Wet-downs at the commencement of every hour.