springvale water treatment project
TRANSCRIPT

sZdv
Springvale Water Treatment Project
State Significant Development 7592 Environmental Impact Statement
September 2016
Volume 2 - Appendix B3

GHD | Report for Springvale Coal/EnergyAustralia - Springvale Water Treatment Project, 21/25109 | 77
5. Existing conditions5.1 Existing water management
5.1.1 Mount Piper Power Station
Operational area
Water management at the main operational area of MPPS includes stormwater, processwastewater and sewage management systems. The existing water management features atMPPS are shown in Figure 5-1.
Stormwater is defined as clean runoff from catchments typically associated with grassed,hardstand and car parking areas that do not involve coal handling. This water is captured withina pit and pipe network, directed to trunk open channels and captured in the Final Holding Pondat the north of the site. The Final Holding Pond has two options for management of capturedwater: pump out with water reused as make-up water for the cooling water system or dischargevia LDP1 to Wangcol Creek. Discharges via LDP1 occur infrequently and typically only as aresult of rainfall events and when the Final Holding Pond capacity is exceeded.
Process wastewater is defined as blowdown water from the cooling water system andstormwater from areas that are likely to generate oil contamination or contaminated with ash orchemicals. Process wastewater is treated prior to reuse as make-up water. The treatmentprocess is dependent on the source of potential contamination and include settlement, oil/waterseparation, chemical dosing, brine concentration and reverse osmosis (RO).
Sewage from plant amenities is treated on site and reused as make-up water for the coolingwater system. Sludge settling is done on site and settlement ponds are designed for the life ofthe station.
The existing water management infrastructure present at MPPS includes:
Contaminated water pond with a capacity of 8 ML.
Three 8 ML settling ponds for ash and chemical waste.
Two cooling water blowdown ponds. Pond A has a capacity of 77 ML and Pond B has acapacity of 103 ML.
Two 20 ML brine waste ponds managing outputs from the existing brine concentrators.
Clean water pond with a capacity of 30 ML.
Each of these storages is lined with rubber to prevent groundwater interactions, with the brinewaste ponds double lined. The existing MPPS groundwater monitoring network acts as aleakage detection system for these lined storages.
Brine management
As water is evaporated from the cooling water system, the concentration of salts contained inthe circulating water increases, which may cause scaling on equipment surfaces and impactupon the operation of the system. Blowdown water is regularly removed from the system andreplaced with fresh make-up water to prevent scaling.
Blowdown water is treated in two brine concentrators to reduce the EC of the water. An ROsystem has also been installed to treat blowdown water and is used when additional treatmentcapacity is required. Distillate from the treatment processes is reused within the cooling watersystem, with the brine by-product stored within the two brine waste ponds prior to co-disposalwith ash.

!<
!.
!.
!.
Blowdownpond B
Blowdownpond A
Finalholdingpond
Settling pondsand contaminated
water pond
Detentiondam
Brinewastepond Brine
wastepondClean
waterpond
WANGCOL CREEK
CASTLEREAGH HIGHWAY
Current AshEmplacement
LDP1
Pine DaleCoal Mine
SpringvaleCoal Services
Mount PiperPowerStation
© Land and Property Information 2015
Figure 5-1
Job NumberRevision 0
21-25109
G:\22\0105001\GIS\Maps\Deliverables\Western\Springvale\2125109\WRIA\10_3\2125109_WRIA030_MPPS_Projectwatermanagement_0.mxd
Map Projection: Transverse MercatorHorizontal Datum: GDA 1994Grid: GDA 1994 MGA Zone 56
0 0.15 0.3 0.45 0.60.075
Kilometers
LEGEND
o© 2016. Whilst every care has been taken to prepare this map, GHD, Centennial Coal and LPI make no representations or warranties about its accuracy, reliability, completeness or suitability for any particular purpose and cannot accept liability and responsibility of any kind (whether in contract, tort or otherwise) for any expenses, losses, damages and/or costs (including indirect or consequential damage) which are or may be incurred by any party as a result of the map being inaccurate, incomplete or unsuitable in any way and for any reason.
Date 10 Aug 2016
Springvale CoalSpringvale Water Treatment ProjectWater Resources Impact Assessment
Mount Piper Power StationExisting water management features
Data source: LPI: DTDB/Imagery, 2012, 2015. Centennial: Imagery, 2016. Created by: tmorton
Level 3, GHD Tower, 24 Honeysuckle Drive, Newcastle NSW 2300 T 61 2 4979 9999 F 61 2 4979 9988 E [email protected] W www.ghd.com.au
Paper Size A4
Project application areaProposed water treatmentsiteSpringvale Coal ServicesDevelopment Consent
Mount Piper PowerStationPrincipal RoadMinor RoadMPPS Water Storages
Ash emplacement area
!<Mt Piper Power StationLDPWatercourse - NonPerennialWatercourse - Perennial
PROPOSED PIPELINEBrine transfer pipelineCrystallised salt transferpipelinesProposed raw watertransfer pipelineResiduals transfer pipelineTreated water pipelineTreated water pipeline tocooling tower forebayExisting CEY Conveyor

GHD | Report for Springvale Coal/EnergyAustralia - Springvale Water Treatment Project, 21/25109 | 79
Ash emplacement
Ash generated as a by-product of power generation at MPPS is deposited within the ashemplacement area, which is located within the mine void of the former Western Main open cut.Ash is conditioned with water or brine to increase the moisture content to improve handling,compaction and dust suppression. The ash emplacement area is approximately 43 ha in sizeand at completion will extend up to 980 m AHD, as shown in Figure 5-2.
After each ash emplacement lift, the material is compacted to between 98% to 99 % from itsplaced density. Compaction is undertaken using equipment on-site. The compaction of ashminimises infiltration into the ash emplacement from rainfall. The generation of runoff is directedto a detention pond of approximately 300 ML and has a capacity to capture a 5 year to 10 yearARI event.
The placement of brine conditioned ash occurs above 946 m AHD above the base layer of minespoil and a layer of water conditioned ash. As brine conditioned ash placement reaches itsmaximum height, it is covered with a minimum of 1 m of water conditioned ash and thencovered with a minimum of 200 mm of compacted soil. Diversion drains exist to collect anddirect any surface runoff to the detention pond, which is then reused for dust suppression.
The development of the Lamberts North ash emplacement expansion is currently underway.Currently ash emplacement has occurred up to a level of 928 m AHD within this area, consistingof water conditioned ash only. Brine conditioned ash will occur in the future above the level of946 m AHD.
Water supply
Make-up water for the cooling water system at MPPS is supplied from the following sources:
Treated process wastewater stored on site.
Coxs River via Lake Lyell and Thompsons Creek Reservoir.
Fish River water supply scheme.
As discussed, process wastewater includes blowdown water from the cooling water system andpotentially contaminated stormwater. Process wastewater is treated prior to reuse as make-upwater.
The majority of the make-up water used at MPPS has historically been sourced from the CoxsRiver. A system of storage dams, interconnecting pipelines and pumping stations exist to supplywater to MPPS. Make-up water is pumped from Lake Lyell directly to the cooling water systemor to Thompsons Creek Reservoir for storage. EnergyAustralia is currently licensed to extract upto 23,000 ML/year from the Coxs River under WAL 27428 (refer Section 2.1.4).
Make-up water is supplemented by the Fish River water supply scheme, which is sourced fromthe Duckmaloi Weir and Oberon Dam. EnergyAustralia has an annual allocation of8,184 ML/year from the Fish River water supply scheme, which is managed by WaterNSW(refer Section 2.1.4).
Figure 5-3 presents the historical make-up water demand for MPPS and Figure 5-4 provides therelationship between power generation and water demand. Historical make-up water demandhas varied between 10 ML/day and 62 ML/day since 2010, corresponding to power generationbetween 20% and 100% of the maximum power generation capacity at MPPS. As shown inFigure 5-3, prior to 2014 demand generally exceeded 30 ML/day, however, demand hasreduced in recent years.

© 2013. Whilst every care has been takento prepare this figure, GHD make no
representations or warranties about itsaccuracy, reliability, completeness or
suitability for any particular purpose andcannot accept liability and responsibility of
any kind (whether in contract, tort orotherwise) for any expenses, losses,
damages and/or costs (including indirect orconsequential damage) which are or may be
incurred by any party as a result of thefigure being inaccurate, incomplete or
unsuitable in any way and for any reason.
LHLHSGNTS
Centennial CoalEA/CEY Water Treatment Project
Water Resources Impact Assessment
Ash Emplacement Details June 2016 Figure 5-2
SCSNA
\\ghdnet\ghd\AU\Newcastle\Projects\21\25109\Visio\2125109_AshEmplacementTypicalDetails.vsdx
Emplacement strategy and capping detail for Ash
Typical drainage layer for ash emplacement base for Lamberts NorthEmplacement
946 mAHD
Water conditioned ash
Brine conditioned ash
956 mAHD966 mAHD
Maximum height980 mAHD
Final form of ash emplacement
Source: Connell Wagner (2007)
General Notes
Ash emplacement developed at 10 m lifts 10 m wide berm between lifts graded inwards to capture runoff Access roads graded inwards to divert runoff towards detention
pond Nominal slope of batters at 1V in 4H
Brine co-placement arrangements include: Dust and drainage controls Dedicated placement cells Sprays to prevent dust generation. Mobile watering plant to control
dust beyond the area of the sprays.
A drainage system to capture collected runoff to the co-placement areaA lined detention pond of 300 ML allows for capture of runoff up to a 10year ARI event.
Base of Ash Emplacement above Lithgow Seam at 907-908 mAHD

GHD | Report for Springvale Coal/EnergyAustralia - Springvale Water Treatment Project, 21/25109 | 81
Figure 5-3 Average daily make-up water demand at MPPS
Figure 5-4 Power generation at MPPS and make-up water demand
5.1.2 Angus Place Colliery and Springvale Mine
Groundwater inflows into the underground workings at Angus Place Colliery and SpringvaleMine are managed by transfer to the SDWTS. The SDWTS is a pipeline network that wasestablished to transfer water from dewatering facilities at both mines on the Newnes Plateau toWallerawang Power Station. The decommissioning of Wallerawang Power Station commencedin May 2014. Since this time mine water transferred to the SDWTS has been discharged viaLDP009 to Sawyers Swamp Creek.

82 | GHD | Report for Springvale Coal/EnergyAustralia - Springvale Water Treatment Project, 21/25109
Currently, the SDWTS receives mine water from Bore 6, Bore 8 and the Ventilation Shaft No. 3borehole at Springvale Mine and from Bore 940 at Angus Place Colliery at a rate of up to30 ML/day. Transfers from Springvale Mine take priority, with the remaining capacity of theSDWTS supplied by transfers from Angus Place Colliery. Dewatering of the undergroundworkings at Angus Place Colliery is currently ongoing while the mine is under care andmaintenance.
Raw mine water from Angus Place Colliery and Springvale Mine is combined in a single pipelinethat finishes at the LDP009 sedimentation ponds. Approximately 100 m before the end of thepipeline, a polymer injection system delivers a chemical into the pipeline. The polymer isdesigned to attract any suspended solids in the water, forming strings which become heavy andsettle in the sedimentation ponds. Water continues to flow through the ponds, removingsuspended solids and is discharged via a concrete spillway. LDP009 is located at the bottom ofthe discharge spillway. The sedimentation ponds are dredged twice annually, with materialplaced into the REA at the SCSS.
Springvale Mine is licensed under EPL 3607 to discharge up to 30 ML/day through LDP009.Monitored daily discharges through LDP009 from December 2013 to January 2016 arepresented in Figure 5-5. Typically, discharges have been between 20 ML/day to 25 ML/day.Over the monitored period approximately seven events occurred where discharge volumesreduced to a low level. These events have been associated with maintenance activities orchanges within the underground mine environment.
The water quality of LDP009 discharges is discussed in Section 5.6.1.
Figure 5-5 Monitored daily LDP009 discharges
5.1.3 Springvale Coal Services
Water management at SCSS is associated with the storage, handling and processing of coalfrom Springvale Mine. No active mining occurs at the site. The existing water managementfeatures of the SCSS are shown in Figure 5-6.

!.
!.
!.
!<
A PitREA
REAMain
SedimentPond
H PitWest
H PitEast Council
Pit
DML Dam
CooksDam
RetentionPond
Co-DisposalREA
WANGCOL CREEK
CASTLEREAGH HIGHWAY
LDP006
Pine DaleCoal Mine
SpringvaleCoal Services
Mount PiperPowerStation
© Land and Property Information 2015
Figure 5-6
Job NumberRevision 0
21-25109
G:\22\0105001\GIS\Maps\Deliverables\Western\Springvale\2125109\WRIA\10_3\2125109_WRIA033_SCSS_Projectwatermanagement_0.mxd
Map Projection: Transverse MercatorHorizontal Datum: GDA 1994Grid: GDA 1994 MGA Zone 56
0 0.15 0.3 0.45 0.60.075
Kilometers
LEGEND
o© 2016. Whilst every care has been taken to prepare this map, GHD, Centennial Coal and LPI make no representations or warranties about its accuracy, reliability, completeness or suitability for any particular purpose and cannot accept liability and responsibility of any kind (whether in contract, tort or otherwise) for any expenses, losses, damages and/or costs (including indirect or consequential damage) which are or may be incurred by any party as a result of the map being inaccurate, incomplete or unsuitable in any way and for any reason.
Date 10 Aug 2016
Springvale CoalSpringvale Water Treatment ProjectWater Resources Impact Assessment
Springvale Coal Services SiteExisting water management features
Data source: LPI: DTDB/Imagery, 2012, 2015. Centennial: Imagery, 2016. Created by: tmorton
Level 3, GHD Tower, 24 Honeysuckle Drive, Newcastle NSW 2300 T 61 2 4979 9999 F 61 2 4979 9988 E [email protected] W www.ghd.com.au
Paper Size A4
Project application areaProposed water treatmentsiteSpringvale Coal ServicesDevelopment Consent
Mount Piper PowerStationPrincipal RoadMinor RoadSCS Water Storages
!<Springvale Coal ServicesLDPWatercourse - NonPerennialWatercourse - Perennial
PROPOSED PIPELINEBrine transfer pipelineCrystallised salt transferpipelinesProposed raw watertransfer pipelineResiduals transfer pipelineTreated water pipelineTreated water pipeline tocooling tower forebayExisting and approvedSDWTSExisting CEY conveyor

84 | GHD | Report for Springvale Coal/EnergyAustralia - Springvale Water Treatment Project, 21/25109
The water management system at the SCSS includes the collection of catchment runoff andseepage from historical mine workings in a series of surface water storages. This water istreated (if required) and reused on site within the washery and for dust suppression.
The processing of ROM coal in the washery produces both fine and coarse reject material,which is deposited in the REA. Coarse reject is used to construct cells within the REA, with finereject stored within these cells. The co-disposal storage facility has historically been used totemporarily store reject material for a drying period prior to being blended with coal product.However, this facility is rarely used with the reject material sent directly from the washery to theREA. Recently the co-disposal storage facility was used temporarily in the interim between theclosing of the A Pit REA and the opening of the new REA.
The site has a long history of mining using both underground and open cut methods. There area number of historical open cut voids in the western part of the SCSS, including the H Pit West,H Pit East and Council Pit. Water stored in these voids is likely to be connected to the historicalunderground mine workings which contribute down gradient to Cooks Dam. The A Pit is also ahistorical open cut void that was used as an REA for fine reject material until late 2015. Thisstorage currently forms part of the Lamberts Gully REA system, acting as a sediment pond thatreceives water decanted from the REA.
Inflows to Cooks Dam have been observed to occur from various locations along the westernedge of the dam, originating from historical underground workings. The storage was historicallyconstructed using a small (less than 3 m in height) homogeneous earth fill (overburden) bund,around the crest of an existing open cut pit and is not lined. Cooks Dam is located at the lowestpoint within the Lithgow Seam and forms a sink for much of the local groundwater environment.
Sub-surface inflows also possibly enter the DML Dam, similar to the relationship observed atCooks Dam, with groundwater contribution from the Lithgow Seam. The water level in the damreportedly remains relatively constant, except following significant rainfall events, which causesthe water level to rise temporarily. The DML Dam is an unlined storage and it is likely that waterfrom the storage infiltrates into the historical underground mine workings
Discharges from Cooks Dam and the Retention Pond at SCSS occur to Wangcol Creek viaLDP006, which is licensed under EPL 3607 held by Springvale Mine. Monitored dailydischarges through LDP006 from March 2012 to March 2016 are presented in Figure 5-7. Thefigure indicates a historical range of discharge volumes between 0 ML/day and 14 ML/day.LDP006 monitors discharges from the SCSS as well as the contribution of catchment runoff toLamberts Gully and hence discharge volumes become elevated following rainfall events.Typically, discharge volumes from the SCSS are on average 1.29 ML/day which ispredominately contribution of groundwater to Cooks Dam.

GHD | Report for Springvale Coal/EnergyAustralia - Springvale Water Treatment Project, 21/25109 | 85
Figure 5-7 Monitored daily LDP006 discharges
5.2 Water and salt balance assessment
5.2.1 Model validation
Outputs of the water and salt balance model were compared to available stream flow and ECdata to provide an indication of the validity of the representation of existing conditions in themodel. Data from two monitoring locations on the Coxs River over a period of ten years wasused to verify the modelling outputs. The results of the model validation are provided inAppendix B.
5.2.2 Water balance results
The water cycle for the Coxs River catchment was modelled based on the current conditions in2016, using a historical time series of daily rainfall data extending over 127 years. A total of 127simulations were applied with each simulation modelling a different rainfall pattern (referSection 4.2.2). As a result, 127 annual totals were available for each element within the waterbalance model, thereby representing a wide range of possible rainfall conditions.
Water balance modelling estimated the annual volumetric transfers between the water cyclecomponents under existing conditions, as shown in Figure 5-8. These results are based on a50% power generation requirement at MPPS. The results present the average annual transfersbetween water management elements as well as the 10th percentile and 90th percentile values.The purpose of displaying the three results for each water transfer is to show the averagetransfer volume and an indication of the range of values expected due to possible variation inrainfall.
The 10th percentile represents the value at which 10% of the modelled outputs were less thanthis value. Similarly, the 90th percentile represents the value at which 90% of the modelledoutputs were less than this value. The 10th and 90th percentile values have been used (ratherthan minimum and maximum values) to remove the impact of skewing by infrequent to extremewet and dry conditions.
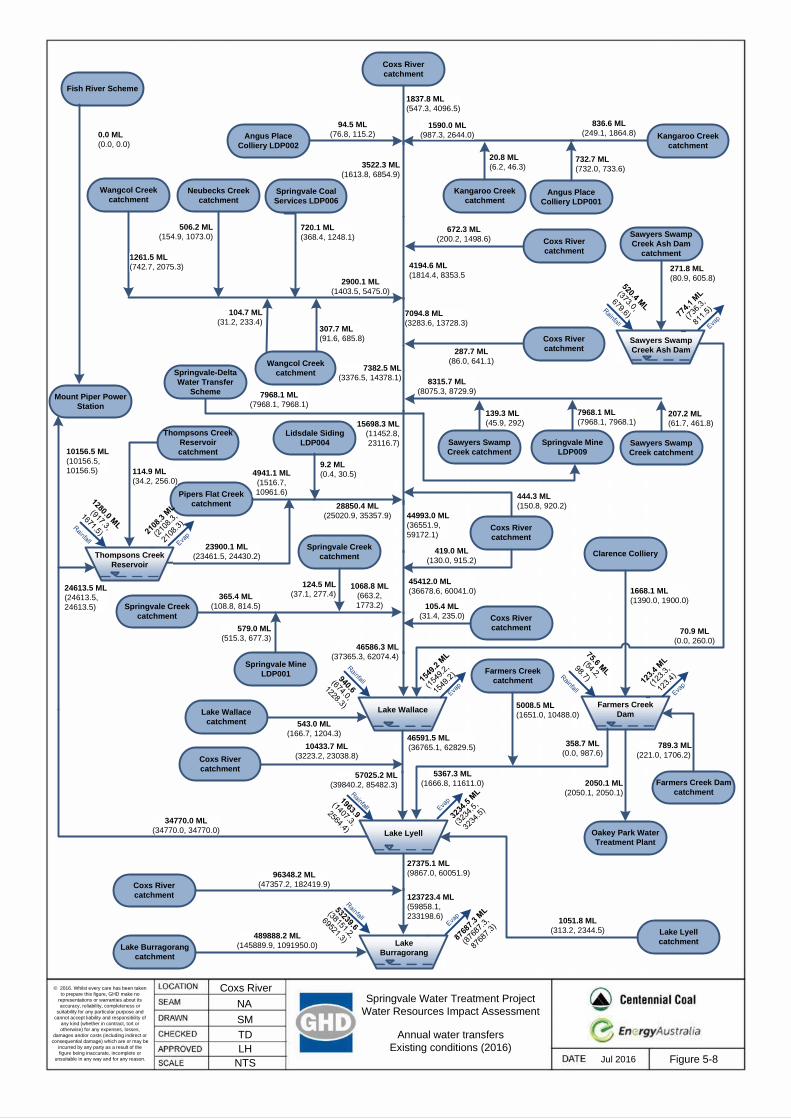
Figure 5-8Jul 2016
SM
© 2016. Whilst every care has been takento prepare this figure, GHD make no
representations or warranties about itsaccuracy, reliability, completeness or
suitability for any particular purpose andcannot accept liability and responsibility of
any kind (whether in contract, tort orotherwise) for any expenses, losses,
damages and/or costs (including indirect orconsequential damage) which are or may be
incurred by any party as a result of thefigure being inaccurate, incomplete or
unsuitable in any way and for any reason.
Annual water transfersExisting conditions (2016)
NTS
TDLH
Coxs RiverNA Springvale Water Treatment Project
Water Resources Impact Assessment
Coxs Rivercatchment
Coxs Rivercatchment
Angus PlaceColliery LDP002
Kangaroo Creekcatchment
Angus PlaceColliery LDP001
Kangaroo Creekcatchment
Coxs Rivercatchment
Springvale CoalServices LDP006
Wangcol Creekcatchment
Mount Piper PowerStation
Lidsdale SidingLDP004
Pipers Flat Creekcatchment
Thompsons CreekReservoircatchment
Springvale Creekcatchment
Springvale Creekcatchment
Springvale MineLDP001
Sawyers SwampCreek catchment
Springvale MineLDP009
Sawyers SwampCreek Ash Dam
catchment
Coxs Rivercatchment
Coxs Rivercatchment
Lake Lyellcatchment
Coxs Rivercatchment
Coxs Rivercatchment
Lake Burragorangcatchment
Neubecks Creekcatchment
Lake Wallace
Lake Lyell
LakeBurragorang
Sawyers SwampCreek Ash Dam
Sawyers SwampCreek catchment
Wangcol Creekcatchment
Farmers CreekDam
Farmers Creek Damcatchment
Clarence Colliery
Oakey Park WaterTreatment Plant
Farmers Creekcatchment
1051.8 ML(313.2, 2344.5)
1668.1 ML(1390.0, 1900.0)
789.3 ML(221.0, 1706.2)
94.5 ML(76.8, 115.2)
836.6 ML(249.1, 1864.8)
20.8 ML(6.2, 46.3)
732.7 ML(732.0, 733.6)
672.3 ML(200.2, 1498.6)
271.8 ML(80.9, 605.8)
287.7 ML(86.0, 641.1)
2900.1 ML(1403.5, 5475.0)
1261.5 ML(742.7, 2075.3)
506.2 ML(154.9, 1073.0)
720.1 ML(368.4, 1248.1)
104.7 ML(31.2, 233.4)
307.7 ML(91.6, 685.8)
114.9 ML(34.2, 256.0)
9.2 ML(0.4, 30.5)4941.1 ML
(1516.7,10961.6)
28850.4 ML(25020.9, 35357.9)
23900.1 ML(23461.5, 24430.2)
8315.7 ML(8075.3, 8729.9)
207.2 ML(61.7, 461.8)
7968.1 ML(7968.1, 7968.1)
139.3 ML(45.9, 292)
365.4 ML(108.8, 814.5)
1068.8 ML(663.2,1773.2)
579.0 ML(515.3, 677.3)
124.5 ML(37.1, 277.4)
444.3 ML(150.8, 920.2)
419.0 ML(130.0, 915.2)
105.4 ML(31.4, 235.0)
10433.7 ML(3223.2, 23038.8)
358.7 ML(0.0, 987.6)
5008.5 ML(1651.0, 10488.0)
489888.2 ML(145889.9, 1091950.0)
96348.2 ML(47357.2, 182419.9)
2050.1 ML(2050.1, 2050.1)
27375.1 ML(9867.0, 60051.9)
123723.4 ML(59858.1,233198.6)
46591.5 ML(36765.1, 62829.5)
57025.2 ML(39840.2, 85482.3)
46586.3 ML(37365.3, 62074.4)
45412.0 ML(36678.6, 60041.0)
44993.0 ML(36551.9,59172.1)
15698.3 ML(11452.8,23116.7)
7094.8 ML(3283.6, 13728.3)
7382.5 ML(3376.5, 14378.1)
4194.6 ML(1814.4, 8353.5
3522.3 ML(1613.8, 6854.9)
1837.8 ML(547.3, 4096.5)
1590.0 ML(987.3, 2644.0)
34770.0 ML(34770.0, 34770.0)
70.9 ML(0.0, 260.0)
Fish River Scheme
0.0 ML(0.0, 0.0)
Lake Wallacecatchment 543.0 ML
(166.7, 1204.3)
5367.3 ML(1666.8, 11611.0)
7968.1 ML(7968.1, 7968.1)
Springvale-DeltaWater Transfer
Scheme
Thompsons CreekReservoir
24613.5 ML(24613.5,24613.5)
10156.5 ML(10156.5,10156.5)

GHD | Report for Springvale Coal/EnergyAustralia - Springvale Water Treatment Project, 21/25109 | 87
From the results provided in Figure 5-8, average inputs and outputs were assessed for WangcolCreek at the confluence with the Coxs River and for the Coxs River upstream of LakeBurragorang.
Wangcol Creek catchment
A summary of the average annual inputs and outputs for the water balance for the WangcolCreek catchment under existing conditions in 2016 is presented in Table 5-1.
As seen in Table 5-1, the discharge from Wangcol Creek into the Coxs River was modelled tobe approximately 2,900 ML/year on average. Catchment runoff into Wangcol Creek wasestimated to be approximately 2,180 ML/year on average, which equates to 75% of the totalflow to the confluence with the Coxs River. Discharges from the SCSS was estimated tocontribute approximately 720 ML/year on average to the creek, equating to 25% of the total flowmodelled.
Table 5-1 Summary of average annual water inputs and outputs forWangcol Creek catchment under existing conditions in 2016
Existing conditions (ML/year)
50% power generation
INPUTS
Catchment runoff 2,180.0
LDP discharge from SCSS (LDP006) 720.1
TOTAL INPUTS (rounded) 2,900
OUTPUTS
Contribution to Coxs River 2,900.1
TOTAL OUTPUTS (rounded) 2,900
BALANCE
Inputs – outputs 0
Coxs River catchment
A summary of the average annual inputs and outputs for the water balance for the Coxs Rivercatchment under existing conditions in 2016 is presented in Table 5-2.
As seen in Table 5-2, the largest source of water into the Coxs River catchment was rainfallonto surface water storages and catchment runoff, which accounted for approximately131,923 ML/year on average, equating to 92% of the total inflows to the system. The secondlargest input under existing conditions was modelled to be associated with the mine water fromAngus Place Colliery and Springvale Mine dewatered to the SDWTS. The inflow from theSDWTS of 7,968 ML/year, which was modelled to be discharged to Sawyers Swamp Creek viaSpringvale Mine’s LDP009 under existing conditions, contributed approximately 6% of the totalinflows to the system.

88 | GHD | Report for Springvale Coal/EnergyAustralia - Springvale Water Treatment Project, 21/25109
Table 5-2 Summary of average annual water inputs and outputs for CoxsRiver catchment under existing conditions in 2016
Existing conditions (ML/year)
50% power generation
INPUTS
Direct rainfall onto storages and catchment runoff 131,923.2
Supply from Fish River water supply scheme to MPPS 0.0
Transfer from Clarence Colliery to Farmers Creek Dam 1,668.1
LDP discharge from Angus Place Colliery (LDP001) 732.7
LDP discharge from Angus Place Colliery (LDP002) 94.5
LDP discharge from Lidsdale Siding (LDP004) 9.2
LDP discharge from SCSS (LDP006) 720.1
LDP discharge from Springvale Mine (LDP001) 579.0
LDP discharge from Springvale Mine (LDP009) 7,968.1
TOTAL INPUTS (rounded) 143,695
OUTPUTS
Evaporation 7,789.5
Additional make-up water used at MPPS* 10,156.5
Oakey Park WTP use 2,050.1
Contribution to Lake Burragorang 123,723.4
TOTAL OUTPUTS (rounded) 143,720
CHANGE IN STORAGE
Farmers Creek Dam 0.8
Lake Lyell 28.6
Lake Wallace 0.1
Thompsons Creek Reservoir 0.0
Sawyers Swamp Creek Ash Dam -53.8
TOTAL CHANGE IN STORAGE (rounded) -24
BALANCE
Inputs –outputs – change in storage 0
* Additional make-up water sourced from Coxs River via Lake Lyell and Thompsons Creek Reservoir.

GHD | Report for Springvale Coal/EnergyAustralia - Springvale Water Treatment Project, 21/25109 | 89
The volume of make-up water used by MPPS in the cooling water system was modelled underexisting conditions to be 10,157 ML/year with a 50% power generation requirement. This waterwas modelled to be supplied by the Coxs River via Lake Lyell and Thompsons Creek Reservoirand equates to 7% of the total inflows into the Coxs River catchment.
Under the existing conditions modelled, the total annual flow within the Coxs River upstream ofLake Burragorang was estimated to be approximately 123,723 ML/year on average. Of this, 8%on average was contributed by site-based discharges from Angus Place Colliery, LidsdaleSiding, the SCSS and Springvale Mine.
5.2.3 Salt balance results
As discussed in Section 4.2.6, the salt balance model was developed as an extension of thewater balance model with expected concentrations of salt applied to water inflows into thesystem. Similar to the water balance, salt balance modelling provided 127 possible annual totalsof salt transfers between the water cycle components of the Coxs River catchment underexisting conditions, as shown in Figure 5-9. As with the water balance results, the salt balanceresults are based on a 50% power generation requirement at MPPS. The results present theaverage annual salt transfers as well as the 10th percentile and 90th percentile values toprovide an indication of the range of values expected due to possible variation in rainfall. Inaddition to the salt transfer quantities, the average salinity of each transfer is also displayed onthe figure.
Wangcol Creek catchment
A summary of the average annual inputs and outputs for the salt balance for the Wangcol Creekcatchment under existing conditions in 2016 is presented in Table 5-3.
Table 5-3 Summary of average annual salt inputs and outputs forWangcol Creek catchment under existing conditions in 2016
Existing conditions (t/year)
50% power generation
INPUTS
Catchment runoff 317.1
LDP discharge from SCSS (LDP006) 1,465.2
TOTAL INPUTS (rounded) 1,782
OUTPUTS
Contribution to Coxs River 1,782.3
TOTAL OUTPUTS (rounded) 1,782
BALANCE
Inputs – outputs 0
As shown in Table 5-3, the discharge from Wangcol Creek into the Coxs River was modelled tocontribute approximately 1,782 t/year of salt on average. Although catchment runoff was thelargest source of water into Wangcol Creek, it did not contribute a significant salt load. Saltassociated with catchment runoff was estimated to be approximately 317 t/year on average,which equates to 18% of the total salt load of Wangcol Creek.

Figure 5-9Jul 2016
SM
© 2016. Whilst every care has been takento prepare this figure, GHD make no
representations or warranties about itsaccuracy, reliability, completeness or
suitability for any particular purpose andcannot accept liability and responsibility of
any kind (whether in contract, tort orotherwise) for any expenses, losses,
damages and/or costs (including indirect orconsequential damage) which are or may be
incurred by any party as a result of thefigure being inaccurate, incomplete or
unsuitable in any way and for any reason.
Annual salt transfersExisting conditions (2016)
NTS
TDLH
Coxs RiverNA Springvale Water Treatment Project
Water Resources Impact Assessment
Coxs Rivercatchment
Coxs Rivercatchment
Angus PlaceColliery LDP002
Kangaroo Creekcatchment
Angus PlaceColliery LDP001
Kangaroo Creekcatchment
Coxs Rivercatchment
Springvale CoalServices LDP006
Wangcol Creekcatchment
Mount Piper PowerStation
Lidsdale SidingLDP004
Pipers Flat Creekcatchment
Thompsons CreekReservoircatchment
Springvale Creekcatchment
Springvale MineLDP001
Sawyers SwampCreek catchment
Springvale MineLDP009
Sawyers SwampCreek Ash Dam
catchment
Coxs Rivercatchment
Coxs Rivercatchment
Lake Lyellcatchment
Coxs Rivercatchment
Coxs Rivercatchment
Lake Burragorangcatchment
Neubecks Creekcatchment
Lake Wallace
Lake Lyell
LakeBurragorang
Thompsons CreekReservoir
Sawyers SwampCreek catchment
Wangcol Creekcatchment
Farmers CreekDam
Farmers Creek Damcatchment
Clarence Colliery
Oakey Park WaterTreatment Plant
Farmers Creekcatchment
105.2 t(31.3, 234.5)150 µS/cm
290.6 t(242.1, 331.0)260 µS/cm
25.3 t(7.1, 54.6)50 µS/cm
51.1 t(44.3, 59.5)810 µS/cm
42.8 t(12.7, 95.3)80 µS/cm
1.8 t(0.5, 4.1)130 µS/cm
387.6 t(382.5, 390.9)790 µS/cm
48.4 t(14.4, 107.9)110 µS/cm
13.6 t(4.0, 30.3)70 µS/cm
25.2 t(7.6, 56.1)130 µS/cm
1782.3 t(1401.7, 2186.9)
920 µS/cm
241.8 t(229.2, 263.7)290 µS/cm
42.9 t(21.2, 78.1)130 µS/cm 1465.2 t
(1130.8, 1802.2)3040 µS/cm
9.7 t(2.9, 21.5)
140 µS/cm22.7 t(6.8, 50.6)110 µS/cm
11.3 t(3.4, 25.1)150 µS/cm
4.8 t(0.2, 15.7)790 µS/cm
514.9 t(159.8,1124.0)
160 µS/cm
8986.5 t(6873.5, 10775.6)
460 µS/cm8466.8 t
(6511.4, 10319.6)530 µS/cm
6278.3 t(6256.6, 6310.6)
1130 µS/cm
10.4 t(3.1, 23.1)70 µS/cm
6246.2 t(6246.2, 6246.2)1170 µS/cm
20.6 t(7.3, 42.1)220 µS/cm
36.1 t(10.7, 80.4)150 µS/cm
632.9 t(580.8, 717.7)
880 µS/cm
584.3 t(566.0, 607.9)
1510 µS/cm
12.4 t(3.7, 27.7)
150 µS/cm
70.7 t(25.8, 142.8)240 µS/cm
51.3 t(16.8, 107.7)180 µS/cm
10.5 t(3.1, 23.5)150 µS/cm
1018.3 t(332.1, 2140.7)
150 µS/cm
25.1 t(0.0, 70.4)100 µS/cm
695.6 t(249.9, 1419.4)210 µS/cm
38266.0 t(11395.7, 85294.0)
120 µS/cm
6230.7 t(1955.8, 13503.6)
100 µS/cm
291.7 t(239.0, 334.0)
210 µS/cm
7941.1 t(3992.9, 15179.4)
430 µS/cm
14171.8 ML(5951.1,27896.6)170 µS/cm
18590.9 t(15963.6, 21232.8)600 µS/cm
19609.2 t(16382.8,23039.3)
510 µS/cm
18476.6 t(16098.1, 20607.0)
590 µS/cm
17833.2 t(15515.6, 19945.5)590 µS/cm
17781.9 t(15496.8,19894.6)590 µS/cm
8724.6 t(8163.5,9453.0)
830 µS/cm
2421.1 t(1898.5, 3077.5)510 µS/cm
2446.3 t(1906.1, 3139.3)
490 µS/cm
638.9 t(494.6, 887.8230 µS/cm
590.5 t(479.9, 779.9)
250 µS/cm
107.2 t(31.9, 238.8)90 µS/cm
432.2 t(403.8, 481.9)
410 µS/cm
12352.2 t(8720.0, 15594.8)
530 µS/cm
Fish River Scheme
0.0 t(0.0, 0.0)
Lake Wallacecatchment 56.9 t
(17.7, 123.9)160 µS/cm
Sawyers SwampCreek Ash Dam
69.1 t(0.0, 253.5)1460 µS/cm
720.6 t(251.9, 1440.0)200 µS/cm
Springvale-DeltaWater Transfer
Scheme
6246.2 t(6246.2, 6246.2)1170 µS/cm
8744.1 t(6172.8,11039.5)530 µS/cm
3608.2 t(2547.1, 4555.3)530 µS/cm
Springvale Creekcatchment

GHD | Report for Springvale Coal/EnergyAustralia - Springvale Water Treatment Project, 21/25109 | 91
The major source of salt into Wangcol Creek was associated with the discharge from the SCSSvia LDP006, which was predicted to contribute approximately 1,465 t/year on average, equatingto 82% of the total salt load.
Coxs River catchment
A summary of the average annual inputs and outputs for the salt balance for the Coxs Rivercatchment under existing conditions in 2016 is presented in Table 5-4.
Table 5-4 Summary of average annual salt inputs and outputs for CoxsRiver catchment under existing conditions in 2016
Existing conditions (t/year)
50% power generation
INPUTS
Direct rainfall onto storages and catchment runoff 9,521.3
Supply from Fish River water supply scheme to MPPS 0.0
Transfer from Clarence Colliery to Farmers Creek Dam 290.6
LDP discharge from Angus Place Colliery (LDP001) 387.6
LDP discharge from Angus Place Colliery (LDP002) 51.1
LDP discharge from Lidsdale Siding (LDP004) 4.8
LDP discharge from SCSS (LDP006) 1,465.2
LDP discharge from Springvale Mine (LDP001) 584.3
SDWTS (discharged via Springvale Mine LDP009) 6,246.2
TOTAL INPUTS (rounded) 18,551
OUTPUTS
Additional make-up water used at MPPS* 3,608.2
Oakey Park WTP use 291.7
Contribution to Lake Burragorang 14,171.8
TOTAL OUTPUTS (rounded) 18,072
CHANGE IN STORAGE
Farmers Creek Dam 0.1
Lake Lyell 181.0
Lake Wallace 30.5
Thompsons Creek Reservoir 314.2

92 | GHD | Report for Springvale Coal/EnergyAustralia - Springvale Water Treatment Project, 21/25109
Existing conditions (t/year)
50% power generation
Sawyers Swamp Creek Ash Dam -46.0
TOTAL CHANGE IN STORAGE (rounded) 480
BALANCE
Inputs – Outputs – Change in storage 0
* Additional make-up water sourced from Coxs River via Lake Lyell and Thompsons Creek Reservoir.
As shown in Table 5-4, the sources and sinks for the salt balance were broadly similar to thewater balance. The largest source of salt into the Coxs River catchment was rainfall ontosurface water storages and catchment runoff, which accounted for approximately 9,521 t/yearon average. This equates to 51% of the total salt load within the system. The average salinity ofthe total contribution of rainfall and runoff to the catchment was estimated to be approximately108 µS/cm.
The second largest annual salt input under existing conditions was modelled to be associatedwith the mine water dewatered to the SDWTS that is currently discharged to Sawyers SwampCreek via LDP009. This transfer was estimated to input 6,246 t/year of salt on average to theCoxs River catchment, which equates to 34% of the total salt inflows to the system. Theaverage salinity of the discharge was estimated to be 1,170 µS/cm.
The salt load associated with make-up water used by MPPS with a 50% power generationrequirement was predicted by the model to be approximately 3,608 t/year on average. Thisequates to 19% of the total salt inflows into the Coxs River catchment, which is essentiallyremoved from the catchment. The average salinity of extractions from Lake Lyell to supplyMPPS were modelled to be 530 µS/cm.
Salt associated with the total annual flow within the Coxs River upstream of Lake Burragorangwas estimated to be approximately 14,172 t/year on average under existing conditions. Site-based discharges from Angus Place Colliery, Lidsdale Siding, the SCSS and Springvale Minewere modelled to contribute 62% of this total salt load on average.
5.3 Catchment hydrology and hydraulics
5.3.1 Hydrology
Wangcol Creek gauge
The Wangcol Creek gauge (Station 212055) is managed by DPI-Water and monitors the streamlevel and discharge. The gauge is located approximately 0.6 km upstream of the SCSS, asshown in Figure 4-5. The gauge has been in operation since 1991 and is referred to as‘Neubecks Ck U/S Wall’.
Figure 5-10 and Figure 5-11 present the average daily discharge recorded at the WangcolCreek gauge between December 1991 and December 2015. It should be noted that the gaugeremains un-calibrated and the recorded data varies significantly over time.

GHD | Report for Springvale Coal/EnergyAustralia - Springvale Water Treatment Project, 21/25109 | 93
The maximum level recorded by the Wangcol Creek gauge is 0.886 m (DPI-Water, 2016c),which corresponds to a flow rate of approximately 340 ML/day. Flows over this rate areextrapolated using a level versus discharge rating table, which is currently under revision and isunconfirmed. This therefore limits the usefulness of the gauged data for assessing events largerthan approximately the 100 year ARI event.
Figure 5-10 Average daily discharge recorded at Wangcol Creek gauge
Figure 5-11 Average daily discharge recorded at Wangcol Creek gauge(between 0 ML/day and 300 ML/day)
The full dataset from the Wangcol Creek gauge for flow volume was extracted from 1991 to2015 and assessed using River Analysis Package by ewater toolkit (Version 3.0.7). Table 5-5presents the results, which indicate that on the average, flow within Wangcol Creek is variablewith steeper rises than falls in water levels predominantly as a result of rainfall events.

94 | GHD | Report for Springvale Coal/EnergyAustralia - Springvale Water Treatment Project, 21/25109
Table 5-5 Wangcol Creek gauge flow statistics
Statistic Result
Greatest rate of rise 2,563.5 ML
Mean rate of rise 19.4 ML/day
Mean duration of rise 2.4 days
Greatest rate of fall 1,137.8 ML
Mean rate of fall 7.6 ML/day
Mean duration of fall 6.6 days
With respect to determining the potential baseflow conditions for Wangcol Creek, a low flowanalysis has been undertaken by DPI-Water (2016c) with the result provided in Figure 5-12. It isclear that baseflow within Wangcol Creek is a dominant feature, with a 10% probability ofaverage flow volume over a 90-day period being less than 0.001 ML/day. From Figure 5-12 thelow flow assessment considered the most likely average daily baseflow volume was1.22 ML/day (that is, 110 ML over 90 days).
Figure 5-12 Low flow frequency analysis for Wangcol Creek gauge (DPI-Water, 2016c)
Figure 5-13 presents the level data at the Wangcol Creek gauge between 1991 and 2015. Asindicated in Figure 5-13, the creek has from time to time dried prior to 2010. However, since2010, the level within the creek has been maintained at approximately 0.4 m to 0.5 m above thegauge datum (unknown height relative to AHD).

GHD | Report for Springvale Coal/EnergyAustralia - Springvale Water Treatment Project, 21/25109 | 95
Figure 5-13 Flow level recorded at Wangcol Creek gauge
Model calibration
One previous flood study has been undertaken for Wangcol Creek, prepared by WRM (2005)for Pine Dale Coal Mine. This study considered two specific events for calibration, one inOctober 1999 (68 mm over 28 hours) and the other in November 2004 (79.5 mm over ninehours). As there have been some catchment modifications since these events, the review ofpotential storm events was considered after 2004.
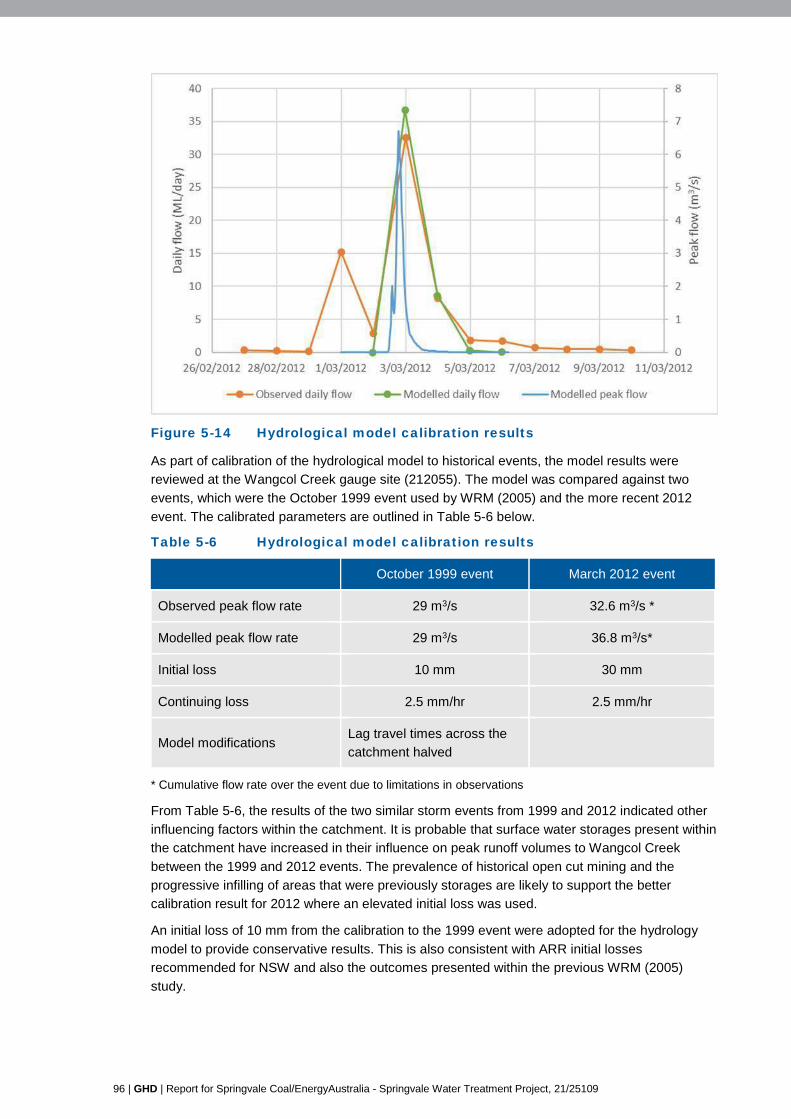
There was only one event from the available Wangcol Creek gauge data that was comparableto that of the previously assessed calibration events, which was observed in March 2012. Thisevent recorded approximately 69 mm of rainfall over one day with an additional 62 mm ofrainfall over the following two days. The observed and modelled daily flow and modelled peakflow is presented in Figure 5-14 for the March 2012 event.
96 | GHD | Report for Springvale Coal/EnergyAustralia - Springvale Water Treatment Project, 21/25109
Figure 5-14 Hydrological model calibration results
As part of calibration of the hydrological model to historical events, the model results werereviewed at the Wangcol Creek gauge site (212055). The model was compared against twoevents, which were the October 1999 event used by WRM (2005) and the more recent 2012event. The calibrated parameters are outlined in Table 5-6 below.
Table 5-6 Hydrological model calibration results
October 1999 event March 2012 event
Observed peak flow rate 29 m3/s 32.6 m3/s *
Modelled peak flow rate 29 m3/s 36.8 m3/s*
Initial loss 10 mm 30 mm
Continuing loss 2.5 mm/hr 2.5 mm/hr
Model modificationsLag travel times across thecatchment halved
* Cumulative flow rate over the event due to limitations in observations
From Table 5-6, the results of the two similar storm events from 1999 and 2012 indicated otherinfluencing factors within the catchment. It is probable that surface water storages present withinthe catchment have increased in their influence on peak runoff volumes to Wangcol Creekbetween the 1999 and 2012 events. The prevalence of historical open cut mining and theprogressive infilling of areas that were previously storages are likely to support the bettercalibration result for 2012 where an elevated initial loss was used.
An initial loss of 10 mm from the calibration to the 1999 event were adopted for the hydrologymodel to provide conservative results. This is also consistent with ARR initial lossesrecommended for NSW and also the outcomes presented within the previous WRM (2005)study.
GHD | Report for Springvale Coal/EnergyAustralia - Springvale Water Treatment Project, 21/25109 | 97
Results
XPRAFTS modelling
The hydrological model results for Wangcol Creek under existing conditions have been providedin Table 5-7 for the following locations:
Wangcol Creek gauge.
Confluence with Lamberts Gully.
Outlet of Wangcol Creek.
Results are presented in Table 5-7 for the 1 year, 10 year and 100 year ARI events, as well asthe 200 year and 500 year ARI events, to consider the influence of climate change on thehydrology of Wangcol Creek, and an extreme event of three times the 100 year ARI event.
Table 5-7 Results of hydrological model for existing conditions
Event
Wangcol Creek gaugeConfluence withLamberts Gully
Outlet of WangcolCreek
Flow rate(m3/s)
Stormduration(hours)
Flow rate(m3/s)
Stormduration(hours)
Flow rate(m3/s)
Stormduration(hours)
1 year ARI 25.0 12 33.2 24 38.2 48
10 year ARI 66.4 2 82.7 6 93.4 6
100 year ARI 119.2 2 143.6 2 155.1 2
200 year ARI 137.0 2 166.2 2 179.0 2
500 year ARI 161.5 2 198.0 2 212.7 2
Extreme event(3 x 100 yearARI)
438.5 2 539.5 2 570.6 2
The results from the 200 year and 500 year ARI events indicate that the peak flow rates are inthe order of 15% to 37% above the predicted flow rate for the 100 year ARI event at the outlet ofWangcol Creek. For the extreme event modelled, the results indicate that the peak flow rate isin the order of 267% greater than the 100 year ARI event.
Figure 5-15 below provides a comparison between the modelled peak flow rates for the 1 and100 year ARI events in the form of predicted hydrographs at the outlet of the Wangcol Creekcatchment.

98 | GHD | Report for Springvale Coal/EnergyAustralia - Springvale Water Treatment Project, 21/25109
Figure 5-15 Hydrographs for peak 1 year and 100 year ARI events forWangcol Creek under existing conditions
Comparative design flow rates
To provide a comparison to allow for checking of the modelled flow rates, a newly developedmethod established by the draft ARR (Institute of Engineers Australia, 2012) was used to predictflow rates for the Wangcol Creek catchment contributing to the Coxs River. The predictiveequation is in the following form:log (Q ) = −1.30 + 0.94 log (A) + 1.48 log (I 100)where Q100 (m3/s) is the flow rate for the 100 year ARI event, A (km2) is the catchment area andItc (mm/hr) is the rainfall intensity of the 100 year ARI event at the catchment’s time ofconcentration. The predictive equation does not allow for the consideration ofimpervioµS/pervious area composition of the catchment, however as the majority of thecatchment is pervious, the typical approach from ARR (institute of Engineers Australia, 2012) isapplicable.
The results from using the equation for the 100 year ARI event indicated a calculated peak flowrate of 133.4 m3/s. When comparing this result to those predicted from the XPRAFTS modelling(155.1 m3/s), a percentage difference of 14% is achieved. This result indicates a reasonable‘order of magnitude’ check on the XPRAFTS results.
5.3.2 Hydraulics
Model setup
Peak flow rates of the critical duration storm from the hydrology assessment were input into thehydraulic model along with the existing waterway topography of Wangcol Creek determinedfrom available LIDAR survey. LIDAR was available downstream approximately 680 mdownstream from the confluence with Lamberts Gully where it then utilised 1 m contour data forthe remaining 1.6 km of creek.

GHD | Report for Springvale Coal/EnergyAustralia - Springvale Water Treatment Project, 21/25109 | 99
A Manning’s n value of 0.06 was adopted to represent the vegetated nature of the waterwaychannels and overbank areas (Chow, 1959). This decreased to 0.04 with areas where thecreeks were defined and the overbank areas were cleared of any trees with the typicalvegetation less than 0.5 m high.
For the consideration of the baseflow scenario within Wangcol Creek, the baseflow volume wasdefined as a constant flow rate of 1.22 ML/day.
The hydraulic model layout and assessment extent is provided in Figure 5-16. The hydraulicmodel layout also shows the location of existing waterway crossing structures.
Results
Due to limitations in the three-dimensional dataset from which the hydraulic model wasdeveloped, Wangcol Creek in some locations within the model is not truly representative of theactual waterway geometry. This is mostly due to the water line of the creek during surveyrepresenting the bottom of the creek. This results in the model cross-sections having flattercreek bases.
The flood extents from the hydraulic modelling for Wangcol Creek under existing conditions fora baseflow scenario, 1 year, 10 year and 100 year ARI events are provided in Figure 5-17.
The hydraulic results for all modelled events are provided in Table 5-8. Results have beenprovided at a number of key reporting locations including:
Wangcol Creek gauge (Section 2920.83).
The access road at the SCSS (Section 2269.62).
Midway down Wangcol Creek (Section 1272.77).
End of Wangcol Creek at the connection point to waterbody formed from theCommonwealth Mine open cut area (Section 311.22).
The results provided in Table 5-8 indicate a hydraulic gradient down Wangcol Creek ofapproximately 0.5% and velocities between 1.0 m/s to 2.5 m/s.
Figure 5-18 presents the hydraulic gradient for the 1 year and 100 year ARI events alongWangcol Creek. The results indicate varied velocity along the creek as a result of changing flowarea and the occurrence of overbank flows. A general flow constriction is indicated around theend of Wangcol Creek where it migrates through more narrow channels to enter into theCommonwealth Mine open cut area. Water levels indicate a flatter profile for approximately250 m in the results for both the 1 year and 100 year ARI events suggesting capacityconstraints and the choking of flows (supported with a corresponding drop in predicted velocity).
From the model predictions, overbank flooding from Wangcol Creek corridor occurred in eventsequal to or greater than the 10 year ARI event. Specifically, these overbank flows wereattributed to potential flooding of the Castlereagh Highway between model sections 1,644 to1,317, approximately 700 m to east of the proposed LDP. It is noted that previous assessmentsalong Wangcol Creek (WRM, 2005) did not predict this breakout and the fact that it waspredicted as part of this modelling may be a result varying surface elevation information used ineach of the models or detailed information not captured in the scale of the modelling.
Along the northern banks of Wangcol Creek, flows were mostly contained to the creek corridor.However, some areas of breakout occurred for the 100 year ARI event behind amenity andnoise bunding of Pine Dale Coal Mine’s operation that is currently in care and maintenance.
Results for stream power and stream shear are discussed within Section 5.4.

6. Railway Crossing(Bridge 3 sections,5 m wide x 2 m high, 2 piers)
5. Pine DaleAccess Road # 3(2 x 450 mm RCP)*4. Pine Dale Access
Road # 2 (3 cell RCBC,1.8 m wide x 2.0 m high)
3. Pine Dale Light VehicleAccess Road (Bridge, 5 m wide x 2 m high)2. Pine Dale Mine Gate
Road (1 Cell RCBC, 2.75 m wide x 1.0 m high)
1. Castlereagh Hwy Culvert (3 Cell RCBC, 4.6 m wide x 1.5 m high)
COXS RIVERWANGCOL CREEK
SECT
1-20
0.38
SECT
1-25
1.73
SECT 1-750.62 SECT
1-57
6.38
SECT
1-32
18.50
SECT
1-311
8.50
SECT
1-30
68.50
SECT
1-12
07.85
SECT 1-2872.40
SECT
1-95
3.15
SECT 1-2712.99
SECT
1-21
57.95
SECT
1-20
72.00
SECT 1-2769.28
SECT 1-2588.68
SECT
1-22
05.01
SECT
1-14
67.50
SECT
1-10
07.59
SECT
1-47
6.74
SECT
1-15
17.87
SECT
1-35
9.36
SECT
1-2986
.13
SECT
1-230
7.95
SECT
1-16
44.56
SECT 1-2437.50
SECT
1-13
67.47
SECT
1-12
72.77
© Land and Property Information 2015
Figure 5-16
Job NumberRevision 0
21-25109
G:\22\0105001\GIS\Maps\Deliverables\Western\Springvale\2125109\WRIA\10_3\2125109_WRIA014_HydraulicModel_0.mxd
Map Projection: Transverse MercatorHorizontal Datum: GDA 1994Grid: GDA 1994 MGA Zone 56
0 100 200 300 40050
Meters o© 2016. Whilst every care has been taken to prepare this map, GHD, Centennial Coal and LPI make no representations or warranties about its accuracy, reliability, completeness or suitability for any particular purpose and cannot accept liability and responsibility of any kind (whether in contract, tort or otherwise) for any expenses, losses, damages and/or costs (including indirect or consequential damage) which are or may be incurred by any party as a result of the map being inaccurate, incomplete or unsuitable in any way and for any reason.
Date 10 Aug 2016
Springvale CoalSpringvale Water Treatment ProjectWater Resources Impact Assessment
Hydraulic modellayout and extent
Data source: LPI: DTDB/Imagery, 2012, 2015. Centennial: Imagery, 2016. Created by: tmorton
Level 3, GHD Tower, 24 Honeysuckle Drive, Newcastle NSW 2300 T 61 2 4979 9999 F 61 2 4979 9988 E [email protected] W www.ghd.com.au
Paper Size A4
Model SectionsStructures within creekWatercourse - Non Perennial
Watercourse - PerennialLEGEND

!HLDP006COXS RIVER
WANGCOL CREEK
© Land and Property Information 2015
Figure 5-17
Job NumberRevision 0
21-25109
G:\22\0105001\GIS\Maps\Deliverables\Western\Springvale\2125109\WRIA\10_3\2125109_WRIA013_FloodingExst_0.mxd
Map Projection: Transverse MercatorHorizontal Datum: GDA 1994Grid: GDA 1994 MGA Zone 56
0 100 200 300 40050
Meters
LEGEND
o© 2016. Whilst every care has been taken to prepare this map, GHD, Centennial Coal and LPI make no representations or warranties about its accuracy, reliability, completeness or suitability for any particular purpose and cannot accept liability and responsibility of any kind (whether in contract, tort or otherwise) for any expenses, losses, damages and/or costs (including indirect or consequential damage) which are or may be incurred by any party as a result of the map being inaccurate, incomplete or unsuitable in any way and for any reason.
Date 10 Aug 2016
Springvale CoalSpringvale Water Treatment ProjectWater Resources Impact Assessment
Modelled flood extents alongWangcol Creek under existing conditions
Data source: LPI: DTDB/Imagery, 2012, 2015. Centennial: Monitoring location; imagery, 2016. Created by: tmorton
Level 3, GHD Tower, 24 Honeysuckle Drive, Newcastle NSW 2300 T 61 2 4979 9999 F 61 2 4979 9988 E [email protected] W www.ghd.com.au
Paper Size A4
Project application area100 year ARI flood event10 year ARI flood extent1 year ARI flood extent
Baseflow ScenarioTreated water pipelineWatercourse - Non PerennialWatercourse - Perennial

102 | GHD | Report for Springvale Coal/EnergyAustralia - Springvale Water Treatment Project, 21/25109
Table 5-8 Results of hydraulic model of Wangcol Creek for existing conditions
Event
Wangcol Creek gauge Access road at the SCSS Midway down Wangcol Creek End of Wangcol Creek
Flow depthAveragevelocity
Flow depthAveragevelocity
Flow depthAveragevelocity
Flow depthAveragevelocity
m m AHD m/s m m AHD m/s m m AHD m/s m m AHD m/s
Baseflow* 0.05 903.05 0.17 0.01 900.01 0.37 0.01 894.01 0.28 0.06 889.06 0.05
1 year ARI 1.25 904.25 1.08 1.24 901.24 1.92 1.36 895.36 1.37 2.08 891.08 0.86
10 year ARI 1.79 904.79 1.42 1.56 901.56 2.28 2.25 896.25 1.01 3.11 892.11 1.12
100 year ARI 2.27 905.27 1.70 1.83 901.83 2.51 2.82 896.82 1.03 3.97 892.97 1.22
* Limitations exist in modelling relatively small flow rates of baseflow in hydraulic model compared with the design events. Results indicate highly variable results betweensections and poor flood extent mapping.
Figure 5-18 Water level and velocity results for existing Wangcol Creek for 1 year and 100 year ARI events

GHD | Report for Springvale Coal/EnergyAustralia - Springvale Water Treatment Project, 21/25109 | 103
Culverts and other crossing structures
The following culverts and other waterway crossing structures existing along Wangcol Creek, asshown in Figure 5-16. Table 5-9 and Table 5-10 summarise the details of these structures.
Table 5-9 Description and dimensions of crossing structures alongWangcol Creek
Structure Description Dimensions
1 Castlereagh Highwayculvert
Three cell reinforced concrete boxculvert (RCBC)
4.6 ma wide x 1.5 mhigh
2 Pine Dale Mine Gate Road One cell RCBC 2.75 m wide x 1.0 mhigh
3 Pine Dale Light VehicleAccess Road
Bridge 5 m wide x 2 m high
4 Pine Dale Access Road # 2 Three cell RCBC 1.8 m wide x 2.0 mhigh
5 Pine Dale Access Road # 3 Two reinforced concrete pipes 450 mm diameterb
6 Railway crossing Bridge (three sections, two piers) 5 m wide x 2 m high
a Estimated from information provided by Roads and Maritime Services (RMS).b Estimated from visual inspection.
Table 5-10 Crossing structure details
StructureUpstreaminvert* (m
AHD)
Overflowinvert (m
AHD)
Distance fromSCSS entry (m)
Corresponding river stationin hydraulic model (m)
1 Unknown Unknown 0 N/A
2 898.2 900.9 100Upstream 2,269.62Downstream 2,233.97
3 896.2 898.9 530Upstream 1,849.91Downstream 1,822.24
4 892.6 894.9 1,150Upstream 1,217.86Downstream 1,207.85
5 Unknown Unknown 1,695Upstream 688.17Downstream 649.06
6 Unknown Unknown 2,207Upstream 168.78Downstream 156.47
* Where no downstream invert was provided, a gradient of Wangcol Creek was assumed.
The crossing structures on Wangcol Creek were assessed using Manning’s equations todetermine the approximate maximum flow capacity for each structure prior to overtopping orbypass (that is, the maximum allowable water level at overflow level). The results are presentedin Table 5-11.

104 | GHD | Report for Springvale Coal/EnergyAustralia - Springvale Water Treatment Project, 21/25109
Table 5-11 Flow capacity of crossing structures
Structure
Maximumpermissibleflow throughculvert (m3/s)
WatercourseCorresponding
velocity from culvert(m/s)
Depth at culvertinlet (m)
1 52.9 Lamberts Gully 3.9 1.0
2 11.4
Wangcol Creek
4.1 1.0
3 30.0 4.25 1.4
4 25.5 3.8 1.2
5 1.3 4.0 0.45
6 20.3 2.8 0.5
From the results provided in Table 5-11, the existing Wangcol Creek crossing structures have acapacity to convey a maximum of 30 m3/s. As this is less than the predicted flow from a 1 yearARI event within Wangcol Creek, predicted at a location nearby the entry to SCSS, it is likelythat structures along the creek operate generally as flow constraints. The expected floodimmunity design criteria for these crossings would be minimal with alternate routes of accessavailable for Pine Dale Coal Mine via the Mount Piper Private Haul road. Of note is thepredicted water depths at structures 2 and 5, compared with the structure height. Many of thestructures were visually determined to have a shallow amount of cover above the structure.From the results of Table 5-11, structures 2 and 5 would most likely be overtopped in flow ratesthat match their maximum permissible flow.
The crossing structure located directly downstream of LDP006 on Lamberts Gully andCastlereagh Highway (structure 1) has the largest determined capacity of all structuresconsidered. This is typical of the significance of the Lamberts Gully catchment contributing tothe highway at this location and the likely higher design flood immunity of the CastlereaghHighway. It should be noted that the culvert is currently significantly blocked with debris andvegetation.
5.4 Waterway geomorphology
A desktop assessment and site visit were undertaken to assess the existing geomorphiccharacteristics of the reaches of watercourses that may be affected by the Project. Specificreaches assessed were:
Wangcol Creek downstream of LDP006.
Coxs River in the vicinity of the alignment of the proposed pipeline.
Sawyer Swamp Creek and tributaries upstream of the Sawyers Swamp Creek Ash Dam.
The geomorphic assessment included characterising streams by stream order, watercoursetypes and watercourse condition. Stream ordering for waterways in the vicinity of the Project areshown in Figure 5-19.

!.
!.
!.
!.
NEUBECKS
CREE
KWANGCOL CREEK
PIPERS F LATCREEK
Pine DaleCoal Mine
SpringvaleCoal Services
Mount PiperPowerStation
© Land and Property Information 2015
Figure 5-19
Job NumberRevision 0
21-25109
G:\22\0105001\GIS\Maps\Deliverables\Western\Springvale\2125109\WRIA\10_3\2125109_WRIA017_Streamorder_0.mxd
Map Projection: Transverse MercatorHorizontal Datum: GDA 1994Grid: GDA 1994 MGA Zone 56
0 0.4 0.8 1.2 1.60.2
Kilometers
LEGEND
o© 2016. Whilst every care has been taken to prepare this map, GHD, Centennial Coal and LPI make no representations or warranties about its accuracy, reliability, completeness or suitability for any particular purpose and cannot accept liability and responsibility of any kind (whether in contract, tort or otherwise) for any expenses, losses, damages and/or costs (including indirect or consequential damage) which are or may be incurred by any party as a result of the map being inaccurate, incomplete or unsuitable in any way and for any reason.
Date 10 Aug 2016
Springvale CoalSpringvale Water Treatment ProjectWater Resources Impact Assessment
Stream order of waterwaysin the vicinity of the Project
Data source: LPI: DTDB/Imagery, 2012, 2015; Centennial: Site location, boundaries, alignment, imagery, 2016. Created by: tmorton
Level 3, GHD Tower, 24 Honeysuckle Drive, Newcastle NSW 2300 T 61 2 4979 9999 F 61 2 4979 9988 E [email protected] W www.ghd.com.au
Paper Size A4
!. Site location
Project application areaProposed water treatmentsiteSpringvale Coal ServicesDevelopment Consent
Mount Piper Power Station20m ContourWatercourse - NonPerennialWatercourse - PerennialWaterbody
!.
!.
!.
SAWYERS SWAMP CREEK
KANGAROO CREEK
COXS R IVER
SAWYERSSWAMP CREEK
ASH DAM
LAKEWALLACE
Springvale Mine
AngusPlace
Colliery
LidsdaleSiding
© Land and Property Information 2015
PROPOSED PIPELINEBrine transfer pipelineCrystallised salt transferpipelinesProposed raw watertransfer pipelineResiduals transfer pipelineTreated water pipelineTreated water pipeline tocooling tower forebayExisting CEY Conveyor
STREAM ORDER1st Order2nd Order3rd Order4th Order5th Order6th Order

106 | GHD | Report for Springvale Coal/EnergyAustralia - Springvale Water Treatment Project, 21/25109
5.4.1 Wangcol Creek
At LDP006, Wangcol Creek has a catchment area in the order of 20 km2 and is a 4th orderwatercourse. Downstream of LDP006, Wangcol Creek flows an approximate further 2.2 kmbefore discharging into the Coxs River. At this location, the Coxs River is characterised by alake-like environment created by the past capture of the river into the open cut pit voids of theabandoned Commonwealth Mine. Downstream of LDP006, Wangcol Creek exhibits fourdifferent watercourse types (per the River Styles framework, Brierley and Fryirs, 2005). Thewatercourse types identified were:
Valley fill system – These are relatively flat, featureless valley floor surfaces, lacking acontinuous, well-defined channel. Typically, the substrate comprises of fine alluvial siltsand muds vertically deposited out of suspension.
Low sinuosity, gravel bed system – Exhibits a low-sinuosity channel surrounded bycontinuous floodplains. The banks of this stream type are relatively cohesive and stabledue to the presence of fine-grained materials (clay, mud and silt). Bed sediments typicallyconsist of gravel and cobble materials.
Partly confined, gravel bed system – Exhibits a low-sinuosity channel set within a partlyconfined valley, whereby floodplain continuity is disrupted by the channel having regularcontact with the valley margins. Bed sediments typically consist of gravel and cobblematerials.
Gorge system – Exhibits a single, low-sinuosity channel confined within bedrock orterrace margins with no floodplains.
The headwaters of tributaries to Wangcol Creek largely drain forested catchments; however, themiddle and lower reaches have been disturbed by mining and agricultural practices. Inparticular, the channel is highly modified downstream of LDP006, having been diverted throughexcavation into in situ soil or bedrock materials as well as being bounded by overburden and/orreject coal material in sections. Despite this, the channel is generally stable and the reach ofWangcol Creek downstream of LDP006 is considered to be in poor to moderate geomorphiccondition.
Based on the watercourse types and condition, the assessed extent of Wangcol Creekdownstream of LDP006 has been subdivided into eight reaches as mapped in Figure 5-20 andsummarised in Table 5-12.

!.
!H!H
WANGCOL CREEK
Commonwealthopen cut
mining area
Proposed LDPLDP006
Pine DaleCoal Mine
© Land and Property Information 2015
Figure 5-20
Job NumberRevision 0
21-25109
G:\22\0105001\GIS\Maps\Deliverables\Western\Springvale\2125109\WRIA\10_3\2125109_WRIA006_Watercourse_ConditionAssessment_0.mxd
Map Projection: Transverse MercatorHorizontal Datum: GDA 1994Grid: GDA 1994 MGA Zone 56
0 0.085 0.17 0.255 0.340.0425
Kilometers
LEGEND
o© 2016. Whilst every care has been taken to prepare this map, GHD, Centennial Coal and LPI make no representations or warranties about its accuracy, reliability, completeness or suitability for any particular purpose and cannot accept liability and responsibility of any kind (whether in contract, tort or otherwise) for any expenses, losses, damages and/or costs (including indirect or consequential damage) which are or may be incurred by any party as a result of the map being inaccurate, incomplete or unsuitable in any way and for any reason.
Date 10 Aug 2016
Springvale CoalSpringvale Water Treatment ProjectWater Resources Impact Assessment
Distribution of reaches along WangcolCreek downstream of LDP006
Data source: LPI: DTDB/Imagery, 2012, 2015. Centennial Coal: Imagery, 2016. Created by: tmorton
Level 3, GHD Tower, 24 Honeysuckle Drive, Newcastle NSW 2300 T 61 2 4979 9999 F 61 2 4979 9988 E [email protected] W www.ghd.com.au
Paper Size A4
Springvale Coal ServicesDevelopment ConsentHistorical mining area
!H Proposed LDP
ReachWC1WC2WC3
WC4WC5WC6Waterbody
Watercourse - NonPerennialWatercourse - Perennial