springtime atmospheric mercury speciation in the mcmurdo, antarctica coastal region
TRANSCRIPT

ARTICLE IN PRESS
1352-2310/$ - se
doi:10.1016/j.at
�CorrespondE-mail addr
Atmospheric Environment 42 (2008) 2885–2893
www.elsevier.com/locate/atmosenv
Springtime atmospheric mercury speciation inthe McMurdo, Antarctica coastal region
Steven Brooksa,�, Steven Lindbergb, George Southworthc, Richard Arimotod
aNOAA Atmospheric Turbulence and Diffusion Division, 456 S. Illinois Avenue, P.O. Box 2456, Oak Ridge, TN 37830, USAbOak Ridge National Laboratory Environmental Sciences Division, Emeritus, USA
cOak Ridge National Laboratory Environmental Sciences Division, USAdNew Mexico State University, USA
Received 30 June 2006; received in revised form 1 June 2007; accepted 4 June 2007
Abstract
This paper describes springtime atmospheric mercury (Hg) speciation and snow pack mercury concentration
measurements in the McMurdo/Ross Island sea ice region of Antarctica. Near-surface gaseous elemental mercury
(GEM) depletions (to concentrations below our detection limit, o0.01 ngm�3), similar to those shown to occur in the
springtime Arctic, were observed and reactive gaseous mercury (RGM) and fine particulate mercury (FPM) were produced
in significant quantities (average 116 and 49 pg(Hg)m�3, respectively). GEM concentrations in the near-surface air were
significantly enhanced during brief afternoon terrestrial snowmelt events. Snow pack total mercury was significantly
elevated (40–430 ng l�1), with a maximum at the northern extent of the fast-ice (adjacent to the grease ice/freezing ocean
surface), and lesser values towards the coast and on Ross Island, suggesting that, similarly again to recent Arctic results,
marine halogens, released by the freezing sea surface, induce localized mercury depletion events. A possible secondary
contributing source of local halogens and mercury are direct emissions from the active Ross Island volcano, Mt. Erebus.
r 2007 Elsevier Ltd. All rights reserved.
Keywords: Antarctica; Mercury; Snow; Halogens; Bromine
1. Introduction
Our mercury study, based in McMurdo, RossIsland, Antarctica, in October–November 2003, waspart of the Antarctic Tropospheric ChemistryInvestigation (ANTCI), studying lower atmosphericand snow pack photochemistry. Mercury depletionevents at coastal areas in the Arctic are well known,and are thought to be the primary input of mercury
e front matter r 2007 Elsevier Ltd. All rights reserved
mosenv.2007.06.038
ing author.
ess: [email protected] (S. Brooks).
to the Arctic marine environment and biota (Schroe-der et al., 1998; Lindberg et al., 2001, 2002). Mercuryenhancements in the coastal Antarctic ecosystemadjacent to repeatedly freezing sea surfaces have beenreported by Bargagli et al. (2005).
In the Arctic, coastal studies at Barrow, Alaskahave shown air–snow pack mercury exchangesassociated with mercury depletion events (MDEs).These event fluxes are bi-directional and dominatedby reactive gaseous mercury (RGM) depositionenhanced by high in situ gaseous elemental mercury(GEM) oxidation rates and wind speeds 42m s�1
.

ARTICLE IN PRESSS. Brooks et al. / Atmospheric Environment 42 (2008) 2885–28932886
(o2m s�1 the near-surface aerodynamic resistanceto deposition is elevated; Skov et al., 2006), andGEM emission enhanced by high total mercurylevels in the surface snow, sunlight and warmertemperatures. The physical melting of the snowinduces the greatest magnitudes of GEM emissionfluxes (Brooks et al., 2006; Skov et al., 2006). Inaddition, the physical freezing of the sea surfaceappears to be a prerequisite, as the original sourceof the bromine halogens (Br2 and BrO) whichinitialize the mercury depletion events (Brookset al., 2006). Here, we investigated similar phenom-ena in an Antarctic coastal environment.
Major differences between Barrow, Alaska andMcMurdo, Antarctica include: a well-defined recur-ring flaw lead north of Barrow as a local freezing seasurface, and north of McMurdo, a vast freezing seasurface beyond the contiguous, or fast-ice edge. Thetopography of Barrow is featureless coastal plainfully snow covered in springtime, whereas RossIsland is dominated by strong relief with blackvolcanic debris penetrating above the terrestrialsnow layer. Comparisons of our Ross Islandmercury measurements to long-term Barrowmercury measurements (shifted by a half-yearto account for the offset seasons) are shown inSection 4.
2. Measurements
Measurements of mercury speciation in the near-surface air and total mercury in the snow pack wereconducted from 29 October to 14 November 2003 atthe McMurdo/Ross Island region of Antarctica.These measurements were part of the 2003 NationalScience Foundation Antarctic Tropospheric Chem-istry Investigation and were the first fully speciated(GEM, RGM, and fine particulate mercury (FPM))mercury measurements on the Antarctic continent.During previous campaigns on the Antarctic con-tinent, GEM had been measured by Ebinghaus et al.(2002) and GEM and RGM measured by Sprovieriet al. (2002) and Temme et al. (2003).
Our mercury speciation sensor suite consisted ofTekran models 2537a/1130/1135 for the determina-tion of GEM (Hgo), RGM (Hg(II,g)), and FPM(Hg(II,p)), respectively (Fitzgerald and Gill, 1979;Stevens et al., 1999; Landis et al., 2002). To ensureproper operation of the individual components, thesensor suite was activated in three stages with GEM(model 2537a) measurements started on day 302 (29October), followed by RGM (model 1130) on day
303, and FPM (model 1135) several hours later.Measurements ended on day 318 (14 November).Data are presented here in Julian Day format.For example, day 304.5 is 31 October 2003 at localnoon.
These near-surface ambient air mercury specia-tion measurements were conducted outside theCosmic Ray Observatory building (latitude77.861S, longitude 166.641E), located approximately1.5 km southeast of the main McMurdo complexedge, and well away (�2 km) from the McMurdoelectrical power generators. The building is approxi-mately 50m horizontally and 20m vertically fromthe Ross Sea sea-ice in an area of rough relief. Theground surface consisted mostly of black volcanicdebris from geologically recent Mt. Erebus lavaeruptions (the last significant eruption was observedin 1842). Terrestrial snow cover was estimated at90% on day 302, and 70% on day 317. The sea-icesurface was 100% snow covered for the duration ofthe study.
McMurdo is located on Ross Island at thenorthern edge of the Ross Ice Shelf. Sea-ice northof the Ross Shelf tends to be annual ice, butoccasionally the solid ice persists throughout theyear—as in 2002, 2003 and 2004. At the time of thisstudy, the predominate fast-ice edge was located�30 km to the north of McMurdo, althoughsmall areas of open water, such as the persistent‘‘Barne glacier crack’’, were significantly closer toMcMurdo.
Snow sampling was conducted daily at differentsnow patches approximately 50m from the CosmicRay Facility. At this location there was signifi-cant relief and volcanic debris protruding above thesnow pack. These snow samples were collectedfrom areas of uniform snow roughly 1–5m2.Additional snow samples were collected on 3November and 4 November (days 307 and 308) ona transect between McMurdo and the contiguous(or fast-ice) sea-ice edge, then located approxi-mately 30 km north of McMurdo. These transectsamples were collected from the top few centimetersof 10–15 cm deep snow over smooth sea ice thataveraged 2–3m in thickness. All snow surfaces weremedium to course grained (1.0–1.5mm) with asingle measured density of 211 kgm�3 on RossIsland. All snow samples were collected from thetop 3–5 cm of snow in pre-cleaned bottles usingclean techniques and later analyzed for totalmercury using EPA method 1631 (detectionlimit �1 ng l�1).

ARTICLE IN PRESSS. Brooks et al. / Atmospheric Environment 42 (2008) 2885–2893 2887
3. Quality assurance
The mercury system was leak tested and zero-airtested at least daily. Tekran model 2537a internalpermeation source calibrations were performed at26-h intervals. The building’s furnace (diesel)exhaust was located on the opposite side of thebuilding and elevated 5m above and 24mhorizontally from the sensor inlet. To check foreffects of the furnace exhaust, on a low-wind daythe furnace was switched on and off, on alternating1-h mercury absorption cycles. No significantdifferences or trends among the mercury readingswere detected.
The snow samples were refrigerated and hand-carried back to the analysis laboratory. Waterblanks, bubbler blanks and NIST standards wereanalyzed in conjunction with the samplers followingEPA method 1631 for determining total mercury inwater (titled—mercury in water by oxidation, purge,and trap, and cold vapor atomic fluorescencespectrometry).
0
2
4
6
8
10
12
301 302 303 304 305 306 307 308 309 310 31
GE
M (
ng
m-3
)
GEM RGM FPM
Julian day (
Fig. 1. Continuous measurements of gaseous elemental mercury (GE
gaseous mercury (RGM, Hg(II,g), 1 h sampling collections), and fine pa
daily surface snow 29 October to 14 November 2003. All from outside t
Station, and �30 km from the contiguous (or fast-ice) sea-ice edge to t
4. Results
The airborne mercury speciation and daily snowpack samples from near the Cosmic Ray Observatoryat McMurdo are shown in Fig. 1 and Table 1. Forcomparison purposes, our Barrow, Alaska data from1999 to 2004, accounting for the 6-month seasonalshift, are shown in Table 2. Barrow andMcMurdo areboth coastal sites adjacent to sea ice, and are locatedat 71.21N and 77.51S latitudes, respectively.
At McMurdo, GEM concentrations varied frombelow our detection limit (o0.01ngm�3) to11.16ngm�3, peaking when mercury reduction inthe snow pack was facilitated by sunlight (photo-reduction) and the physical melting. Hourly RGMconcentrations varied from 29 to 275pgm�3, andwere the least variable of the mercury species. HourlyFPM concentrations varied from 5 to 182pgm�3.Daily total mercury measurements of the surface snowadjacent to the airborne measurements (at the CosmicRay Facility) averaged 67ng(Hg) l�1 (water equiva-lence) with a standard deviation of 21ng(Hg) l�1.
1 312 313 314 315 316 317 318 319 320
0
50
100
150
200
250
300
RG
M o
r F
PM
(p
gm
-3)
or
(ng
/lit
er)
Total Hg surface snow
local)
M, Hgo, 5min sampling frequency during collection), reactive
rticulate mercury (FPM, Hg(II,p), also 1 h sampling collections),
he Cosmic Ray Facility building 1.5 km from the main McMurdo
he north.

ARTICLE IN PRESS
Table 2
Barrow, Alaska, Arctic mercury speciation measurements and surface snow at the NOAA CDML lab clean air sector for 1999–2004 Julian
days 120–136, or 30 April–15 May
Average S.D. Average of seasonal
minima
Average of seasonal
maxima
Coefficient of
variation
GEM (ngm�3) 0.94 0.54 BDL 2.44 0.57
RGM (pgm�3) 82 68 14 355 0.83
FPM (pgm�3) 24 25 3 116 1.04
Snow (ng l�1) 58 20 38 108 0.34
BDL (below detection limit) denotes that values were below the detection limit (o0.01 ngm�3) of the instrument. The maximum snow
value does not include blowing snow samples that were captured in natural depressions. Blowing snow samples at Barrow commonly have
total Hg levels as high as �500ng l�1.
Table 1
McMurdo, Ross Island, Antarctica mercury speciation measurements and surface snow near the speciation measurements
Average S.D. Minimum Maximum Coefficient
of variation
GEM (ngm�3) 1.20 1.08 BDL 11.16 0.90
RGM (pgm�3) 116 45 29 275 0.39
FPM (pgm�3) 49 36 5 182 0.72
Snow (ng l�1) 67 21 41 104 0.31
Dates are Julian days 302–318, or 29 October–14 November 2003. BDL (below detection limit) denotes that values were below the
detection limit (o0.01 ngm�3) of the instrument.
S. Brooks et al. / Atmospheric Environment 42 (2008) 2885–28932888
In comparison, from 1999 to 2004, Barrow GEMconcentrations varied from below our detectionlimit (o0.01 ngm�3) to 2.44 ngm�3 (average ofseasonal period maxima), and was the least variableof the mercury species. Similarly, GEM peakedwhen mercury reduction in the snow pack wasfacilitated by sunlight and warmer temperatures.Hourly RGM concentrations at Barrow varied from14 to 355 pgm�3 (averages of seasonal periodminima and maxima), and hourly FPM concentra-tions varied from 3 to 116 pgm�3. Daily totalmercury measurements of the surface snow withinthe Barrow clean air sector averaged 58 ng(Hg) l�1
(water equivalence) with a standard deviation of20 ng(Hg) l�1.
Maximum daily air temperatures and averagedaily wind speeds are shown in Fig. 2. In general,wind speeds and temperatures were strongly anti-correlated during the study period, making therelationships among these to the mercury speciesmore difficult to differentiate. Typically, we wouldexpect GEM to delete more readily on the colderdays (greater rate of sea-ice freezing—halogenproduction), and to be enhanced on days ofterrestrial snowmelt. We would also expect RGMto peak at very low wind speeds when deposition to
the snow surface is aerodynamically inefficient(Skov et al., 2006). Fig. 3 shows average dailyGEM concentrations and daily maximum tempera-ture. As shown in Fig. 3, the maximum GEMconcentration in the near-surface air occurred onthe warmest day, and the minimum GEM concen-tration occurred on the coldest day.
Spatial snow pack total mercury concentrationsare shown in Fig. 4 with the sampling locationsshown in Fig. 5 map of the Ross Island area. Thehighest concentrations were found at the far north-ern edge of the contiguous Ross Sea sea-ice (alsoknown as the fast-ice edge) adjacent to a vast area ofgrease ice, pancake ice, and, small and large floesthat extended far (4100 km) to the North. Thelowest average total mercury concentrations insnow were found at the Cosmic Ray Observatorysampling site. The standard deviation was alsohighest at the Cosmic Ray Observatory. This waslikely due to the non-uniformity of the snow fieldcaused by strong relief and scattered black volcanicdebris protruding above the patches of snow. Thesedaily samples were collected at different locationsapproximately 50m from the Cosmic Ray Facilityin areas of uniform snow patches roughly 1–5m2.As the terrain and snow patches were so varied, we

ARTICLE IN PRESS
-20.0
-15.0
-10.0
-5.0
0.0
5.0
10.0
15.0
20.0
302 303 304 305 306 307 308 309 310 311 312 313 314 315 316 317 318 319 320
Julian day (local)
m/s
or
deg
C
Max. daily T Avg. daily Wind spd m/s
Fig. 2. Daily values of maximum air temperature and average wind speed. Temperatures and wind speeds were strongly anti-correlated
during the study period.
0
0.5
1
1.5
2
2.5
3
-16.0 -14.0 -12.0 -10.0 -8.0 -6.0 -4.0 -2.0 0.0 2.0
Avera
ge D
aily G
EM
(n
g m
-3)
r2 = 0.49
Max Daily Temperature (C)
Fig. 3. Average daily GEM concentrations versus maximum
daily temperatures (r2 ¼ 0.49). Colder temperatures favor halo-
gen (i.e., Br) emissions from the freezing sea ice surface and
mercury (GEM) depletions. Temperatures near freezing promote
localized snowmelt, facilitating GEM emissions from the snow
pack and enhancing GEM in the near-surface air.
0
50
100
150
200
250
300
350
400
450
500
-35 -30 -25 -20 -15 -10 -5 0 5
tota
l H
g i
n s
urf
ac
e s
no
w (
ng
/l)
A B
C
D
Distance from freezing sea surface (fast ice edge; km)
Fig. 4. Average total Hg in the snow pack versus distance from
the edge of the contiguous sea ice (or fast-ice) extending north
from Ross Island. Snow samples collected near the speciation
measurements on Ross Island (Fig. 5, point ‘‘A’’ at �30 km) were
collected from 29 October to 14 November 2003. The other
points were collected from the sea ice surface on 3 November and
4 November (days 307 and 308). Mercury depletion events
occurred on both transect days with daily GEM minima at 0.35
and 0.17 ngm�3, respectively. The numbers of collected samples
for the datum points from left to right are 14, 3, 4 and 3. These
points are shown in relation to Ross Island and the surrounding
sea ice in Fig. 5.
S. Brooks et al. / Atmospheric Environment 42 (2008) 2885–2893 2889
caution the reader against forming strong conclu-sions from the day-to-day variations in totalmercury content as shown in Fig. 1 at McMurdo(Fig. 4, point ‘‘A’’).
The total mercury levels in surface snow adjacentto areas of open or freezing sea water may bestrongly influenced by local conditions at the time ofsampling (Douglas et al., 2005). While our 2003samples were far too few to associate with changing
conditions, for future reference our sampling con-ditions at point ‘‘D’’ (Figs. 4 and 5) are describedhere. The air temperatures were �11 to �9 1C, theskies were moderately sunny with a thin overcast
ARTICLE IN PRESS
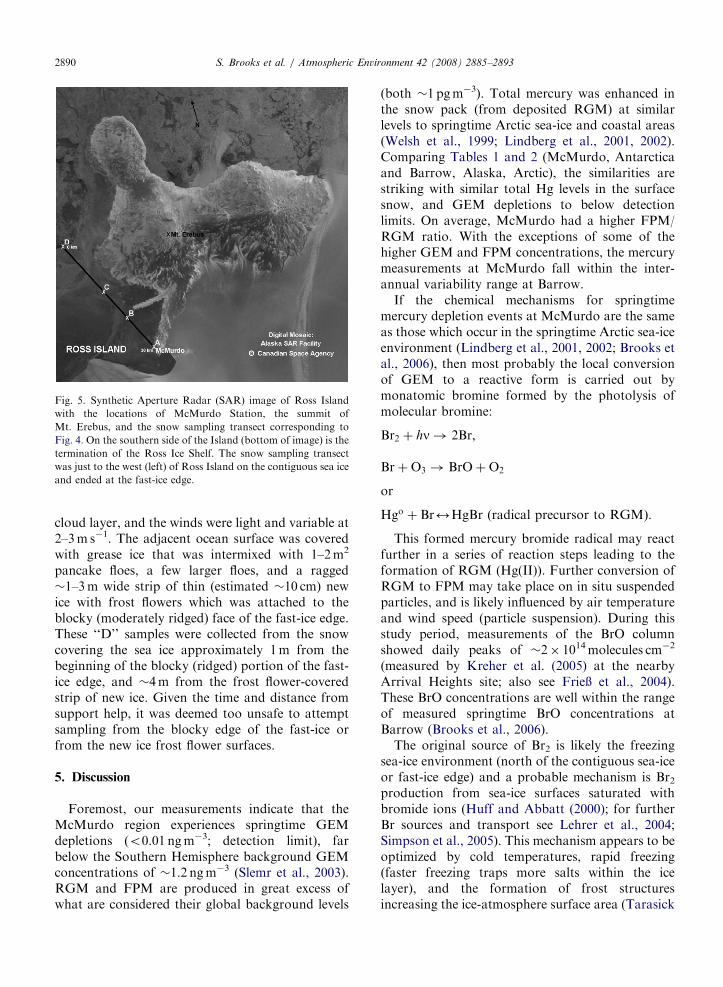
Fig. 5. Synthetic Aperture Radar (SAR) image of Ross Island
with the locations of McMurdo Station, the summit of
Mt. Erebus, and the snow sampling transect corresponding to
Fig. 4. On the southern side of the Island (bottom of image) is the
termination of the Ross Ice Shelf. The snow sampling transect
was just to the west (left) of Ross Island on the contiguous sea ice
and ended at the fast-ice edge.
S. Brooks et al. / Atmospheric Environment 42 (2008) 2885–28932890
cloud layer, and the winds were light and variable at2–3m s�1. The adjacent ocean surface was coveredwith grease ice that was intermixed with 1–2m2
pancake floes, a few larger floes, and a ragged�1–3m wide strip of thin (estimated �10 cm) newice with frost flowers which was attached to theblocky (moderately ridged) face of the fast-ice edge.These ‘‘D’’ samples were collected from the snowcovering the sea ice approximately 1m from thebeginning of the blocky (ridged) portion of the fast-ice edge, and �4m from the frost flower-coveredstrip of new ice. Given the time and distance fromsupport help, it was deemed too unsafe to attemptsampling from the blocky edge of the fast-ice orfrom the new ice frost flower surfaces.
5. Discussion
Foremost, our measurements indicate that theMcMurdo region experiences springtime GEMdepletions (o0.01 ngm�3; detection limit), farbelow the Southern Hemisphere background GEMconcentrations of �1.2 ngm�3 (Slemr et al., 2003).RGM and FPM are produced in great excess ofwhat are considered their global background levels
(both �1 pgm�3). Total mercury was enhanced inthe snow pack (from deposited RGM) at similarlevels to springtime Arctic sea-ice and coastal areas(Welsh et al., 1999; Lindberg et al., 2001, 2002).Comparing Tables 1 and 2 (McMurdo, Antarcticaand Barrow, Alaska, Arctic), the similarities arestriking with similar total Hg levels in the surfacesnow, and GEM depletions to below detectionlimits. On average, McMurdo had a higher FPM/RGM ratio. With the exceptions of some of thehigher GEM and FPM concentrations, the mercurymeasurements at McMurdo fall within the inter-annual variability range at Barrow.
If the chemical mechanisms for springtimemercury depletion events at McMurdo are the sameas those which occur in the springtime Arctic sea-iceenvironment (Lindberg et al., 2001, 2002; Brooks etal., 2006), then most probably the local conversionof GEM to a reactive form is carried out bymonatomic bromine formed by the photolysis ofmolecular bromine:
Br2 þ hn! 2Br;
BrþO3 ! BrOþO2
or
Hgo þ Br2HgBr ðradical precursor to RGMÞ:
This formed mercury bromide radical may reactfurther in a series of reaction steps leading to theformation of RGM (Hg(II)). Further conversion ofRGM to FPM may take place on in situ suspendedparticles, and is likely influenced by air temperatureand wind speed (particle suspension). During thisstudy period, measurements of the BrO columnshowed daily peaks of �2� 1014molecules cm�2
(measured by Kreher et al. (2005) at the nearbyArrival Heights site; also see FrieX et al., 2004).These BrO concentrations are well within the rangeof measured springtime BrO concentrations atBarrow (Brooks et al., 2006).
The original source of Br2 is likely the freezingsea-ice environment (north of the contiguous sea-iceor fast-ice edge) and a probable mechanism is Br2production from sea-ice surfaces saturated withbromide ions (Huff and Abbatt (2000); for furtherBr sources and transport see Lehrer et al., 2004;Simpson et al., 2005). This mechanism appears to beoptimized by cold temperatures, rapid freezing(faster freezing traps more salts within the icelayer), and the formation of frost structuresincreasing the ice-atmosphere surface area (Tarasick

ARTICLE IN PRESSS. Brooks et al. / Atmospheric Environment 42 (2008) 2885–2893 2891
and Bottenheim, 2002). During this study, concen-trations of frost flowers were observed atop thefreezing sea surface adjacent to the contiguous sea-ice edge. Possible secondary sources of BrO andmercury are direct emissions from the continuouslyactive Mt. Erebus volcano, �25 km from ourmeasurement site. Mercury emissions from activevolcanoes are well known, and BrO emissionsfrom active volcanoes were recently reported byBobrowski et al. (2003).
Mt. Erebus is one of only three volcanoes withpersistent molten lava calderas, and is a knownmercury and halogen source (Zreda-Gostynskaet al., 1997). Previous studies of mercury in thisregion (see Sheppard et al., 1991 for a review)associated high mercury concentrations in the snowpack directly to emissions from Mt. Erebus. Webelieve this conclusion is at least partly erroneous.Based on our measurements reported here, regionalsnow pack mercury levels are due primarily to in situmercury depletion events, similar to those studiedintensively at Barrow, Alaska. Further, the high snowpack mercury enhancements at the contiguous iceedge suggests that proximity to freezing surfacewaters, not Mt. Erebus (see Fig. 5 map), is theprimary driver of local mercury depletion eventsand subsequent deposition to the snow pack.
In general, GEM concentrations are a mix ofchemical in situ depletion, airmass advection,replenishment from the upper atmosphere andsurface emission of reduced Hg(II), facilitated bylocal melt. RGM is produced by local in-air GEMoxidation. FPM, believed to form by RGMabsorption onto particles, was primarily in peakabundances during periods of moderate to highwind speeds, when large numbers of bindableparticulates were suspended in the near-surface air.
Gaseous elemental mercury minimum occurredon day 305 in the early morning hours with coldtemperatures (�18 1C). GEM maximum occurredon day 313 in the afternoon with the warmest airtemperatures of the study period, moderate winds,and significant snowmelt. Snowmelt was observedonly during the afternoons of days 306, 307, 308,312 and 313, concurrent with GEM enhancements.These snowmelt events occurred during periods ofair temperature near freezing. It was observed thaton clear afternoons when the air temperature wasnear freezing or a few degrees below freezing, thesunlight on exposed black volcanic debris, particu-larly on north-facing slopes, absorbed the solarenergy and melted the surrounding snow, resulting
in the afternoon GEM peaks shown in Fig. 1. AtBarrow, snowmelt has been shown to facilitatephotoreduction of mercury within the snow packwith resultant enhancements of GEM in the near-surface air (Lindberg et al., 2001, 2002). Forextended results in other Arctic locations seePoulain et al. (2004).
RGM maximum occurred on day 318, withmoderate winds (�5m s�1) and moderate tempera-ture (��5 1C). RGM minima were observed duringhigh wind periods (45m s�1). FPM maximumoccurred on day 309 concurrent with the lowestair temperatures and the highest wind speeds(�17m s�1) of the measurement period. FPMminima were observed during low wind speed andwarmer air temperature periods.
The sole significant snowfall was observed duringthe morning hours of day 310, but the affect onmercury speciation is very questionable. It appearsthat FPM is enhanced pre- and post-snowfall, andthat FPM was removed from the air during thesnowfall event. However, as FPM showed some-what similar dynamics during non-snowfall events,and as snowfall was not repeated, this preliminaryassessment is tentative at best.
Based on our limited transect, snow pack totalmercury was highest at the contiguous sea-ice edgeand decreased with distance away from the freezingsea surface. Similar gradients of total mercury insnow pack (decreasing with inland distance fromactive/refreezing sea-ice) have been shown in theArctic by Landers et al. (1995), Garbarino et al.(2002) and Douglas and Sturm (2004). Morespecifically, greatly enhanced total mercury levels(up to �800 ng l�1) in snow and frost flowers havebeen frequently measured in the Arctic at the edgesof leads and polynyas (Douglas et al., 2005).Enhanced mercury in soils and biota in the coastalAntarctic environment, adjacent to repeatinglyfreezing sea surfaces (Polynyas) has been reportedby Bargagli et al. (2005). While the Antarctic icepack is different from the Arctic (land surroundedby ocean instead of ocean surrounded by land) thesimilarities with respect to mercury chemistry arestriking.
6. Summary
Measurements of GEM (Hgo), RGM (Hg(II,g)),and FPM (Hg(II,p)) in the near-surface air and totalmercury in the snow pack were conducted from 29October to 14 November 2003 in the McMurdo/

ARTICLE IN PRESSS. Brooks et al. / Atmospheric Environment 42 (2008) 2885–28932892
Ross Island sea ice region of Antarctica. Mercurydepletions to below detection limit (0.01 ngm�3),similar to those that occur in the springtime coastalArctic, were observed, and RGM and FPM wereproduced in significant quantities (averaged 116 and49 pgm�3, respectively). GEM concentrations in thenear-surface air were significantly enhanced duringafternoon terrestrial snowmelt events.
Total mercury was enhanced in the snow pack atMcMurdo at similar levels to the springtime Arcticsea-ice areas (�50–100 ng l�1; Welsh et al., 1999;Lindberg et al., 2001, 2002). The limited snowsampling transect samples suggest that total mer-cury in surface snow is greatly enhanced at thecontiguous sea-ice edge adjacent to the freezingocean surface.
Together these results show similar springtimemercury dynamics at McMurdo, Antarctica tothose intensively studied at Barrow, Alaska (Lind-berg et al., 2001, 2002; Brooks et al., 2006). With theexceptions of some of the higher GEM and FPMconcentrations, all the mercury measurements fromRoss Island and environs fall within the inter-annual variability (given a 6-month seasonal offset)of these same measurements at Barrow.
Acknowledgments
We would like to thank Laura Tudor (ScienceTech., McMurdo) for her time and assistance.Organizational aspects and logistics were providedby the NSF as part of the 2003 Antarctic Tropo-spheric Chemistry Investigation.
References
Bargagli, R., Agnorelli, C., Borghini, F., Monaci, F., 2005.
Enhanced deposition and bioaccumulation of mercury in
Antarctic terrestrial ecosystems facing a coastal polynya.
Environment Science and Technology 39 (21), 8150–8155.
Bobrowski, N., Honninger, G., Galle, B., Platt, U., 2003.
Detection of bromine monoxide in a volcanic plume. Nature
423, 273–276.
Brooks, S.B., Saiz-Lopez, A., Skov, H., Lindberg, S.E., Plane,
J.M.C., Goodsite, M.E., 2006. The mass balance of mercury
in the springtime arctic environment. Geophysical Research
Letters 33 (13), L13812.
Douglas, T.A., Sturm, M., 2004. Arctic haze, mercury and the
chemical composition of snow across northwestern Alaska.
Atmospheric Environment 38, 805–820.
Douglas, T.A., Sturm, M., Simpson, W., Brooks, S.B., Lindberg,
S.E., Perovich, D.K., 2005. Elevated mercury measured in
snow and frost flowers near arctic sea ice leads. Geophysical
Research Letters 32, L04502.
Ebinghaus, R., Kock, H.H., Temme, C., Einax, J.W., Lowe,
A.G., Richter, A., Burrows, J.P., Schroeder, W.H., 2002.
Antarctic springtime depletion of atmospheric mercury.
Environment Science and Technology 36, 1238–1244.
Fitzgerald, W.F., Gill, G.A., 1979. Sub-nanogram of mercury by
two-stage gold amalgamation and gas phase detection applied
to atmospheric analysis. Analytical Chemistry 15, 1714.
FrieX, U., Hollwedel, J., Konig-Langlo, G., Wagner, T., Platt, U.,
2004. Dynamics and chemistry of tropospheric bromine
explosion events in the Antarctic coastal region. Journal of
Geophysical Research 109 (D6), D06305.
Garbarino, J.R., Snyder-Conn, E., Leiker, T.J., Hoffman, G.L.,
2002. Contaminants in Arctic snow collected over sea ice.
Water, Air and Soil Pollution 139, 183–214.
Huff, A.K., Abbatt, J.P.D., 2000. Gas-phase Br2 production in
heterogeneous reactions of Cl2, HOCl, and BrCl with halide-
ice surfaces. The Journal of Physical Chemistry A 104, 31.
Kreher, K., Johnston, P.V., Wood, S.W., Struthers, H., Thomas,
A., Smale, D., Bodeker, G.E., Connor, B.J., Schofield, R.,
Dix, B., Friess, U., Oltmans, S.J., Chipperfield, M.P., 2005.
Long-term observations of BrO at Lauder, New Zealand and
Arrival Heights, Antarctica. EOS Transactions, American
Geophysical Union 86 (18) (Jt. Assem. Suppl., Abstract
A51A-07).
Landers, D.H., Ford, J., Gubala, C., Monetti, M., Lasorsa, B.K.,
Martinson, J., 1995. Mercury in vegetation and lake
sediments from the US Arctic. Water, Air and Soil Pollution
80, 591–601.
Landis, M.S., Stevens, R.K., Schaedlich, F.H., Prestbo, E., 2002.
Development and characterization of an annular denuder
methodology for the measurement of divalent reactive
gaseous mercury in ambient air. Environmental Science and
Technology 36, 3000–3009.
Lehrer, E., Honninger, G., Platt, U., 2004. A one dimensional
model study of the mechanism of halogen liberation and
vertical transport in the polar troposphere. Atmospheric
Chemistry and Physics 4, 2427–2440.
Lindberg, S.E., Brooks, S., Lin, C.-J., Scott, K., Meyers, T.,
Chambers, L., Landis, M., Stevens, R., 2001. Formation of
reactive gaseous mercury in the arctic: evidence of oxidation
of Hgo to gas-phase Hg-II compounds after arctic sunrise.
Water, Air, Soil, Pollution. Focus 1, 95.
Lindberg, S.E., Brooks, S.B., Lin, C.-J., Scott, K.J., Landis,
M.S., Stevens, R.K., Goodsite, M., Richter, A., 2002.
Dynamic oxidation of gaseous mercury in the arctic tropo-
sphere at polar sunrise. Environmental Science and Technol-
ogy 36 (6), 1245–1256.
Poulain, A.J., Lalonde, J.D., Amyot, M., Shead, J.A., Raofie, F.,
Ariya, P.A., 2004. Redox transformations of mercury in an
Arctic snowpack at springtime. Atmospheric Environment 38,
6763–6774.
Schroeder, W.H., Anlauf, K.G., Barrie, L.A., Lu, J.Y., Steffen,
A., Schneeberger, D.R., Berg, T., 1998. Arctic springtime
depletion of mercury. Nature 394, 331–332.
Sheppard, D.S., Patterson, J.E., McAdams, M.K., 1991. Mercury
in Antarctic snow: further results. Atmospheric Environment
25, 1657–1660.
Simpson, W.R., Alvarez-Aviles, L., Douglas, T.A., Sturm, M.,
Domine, F., 2005. Halogens in the coastal snow pack near
Barrow, Alaska: evidence for active bromine air–snow
chemistry during springtime. Geophysical Research Letters
32, L04811.

ARTICLE IN PRESSS. Brooks et al. / Atmospheric Environment 42 (2008) 2885–2893 2893
Skov, H., Brooks, S.B., Goodsite, M.E., Lindberg, S.E., Meyers,
T.P., Landis, M., Larsen, M.R.B., Jensen, B., McConville, G.,
Christensen, J., 2006. Fluxes of reactive gaseous mercury
measured with a newly developed method using relaxed eddy
accumulation. Atmospheric Environment 40, 5452–5463.
Slemr, F., Brunke, E.-G., Ebinghaus, R., Temme, C., Munthe, J.,
Wangberg, I., Schroeder, W., Steffen, A., Berg, T., 2003.
Worldwide trend of atmospheric mercury since 1977.
Geophysical Research Letters 30 (10), 1516.
Sprovieri, F., Pirrone, N., Hedgecock, I.M., 2002. Intensive
atmospheric mercury measurements at Terra Nova Bay in
Antarctica during November and December 2000. Journal of
Geophysical Research 107 (D23), 4722–4729.
Stevens, R.K., Schaedlich, F.H., Landis, M., Schneeberger, D.,
Prestbo, E., Lindberg, S., Keeler, G., 1999. Automated
instrument designed to measure Hgo and reactive gaseous
mercury in near real time: design and operational character-
istics. In: Paper presented at the fifth International Con-
ference on Mercury as a Global Pollutant, Rio de Janeiro,
Brazil, May, 1999.
Tarasick, D.W., Bottenheim, J.W., 2002. Surface ozone depletion
episodes in the Arctic and Antarctic from historical ozone-
sonde records. Atmospheric Chemistry and Physics 2, 197–205.
Temme, C., Einax, J.W., Ebinghaus, R., Schroeder, W.H., 2003.
Measurements of atmospheric mercury species at a coastal site
in the Antarctic and over the south Atlantic Ocean during polar
summer. Environmental Science and Technology 37, 22–31.
Welsh, H., Martin, K., Lockhart, L., Boila, G., 1999. Mercury
accumulation in snow on sea ice. Environmental Studies No.
75: Synopsis of Research under the 1997/98 Northern
Contaminates Program, Indian Affairs and Northern Affairs,
Ottawa, Canada, pp. 93–95.
Zreda-Gostynska, G., Kyle, P.R., Finnegan, D., Prestbo, K.M.,
1997. Volcanic gas emissions from Mount Erebus and their
impact on the Antarctic environment. Journal of Geophysical
Research 102 (B7), 15039.