springfield city school district · notes to the schedule of ... the chool district did not passs...
TRANSCRIPT


SPRINGFIELD CITY SCHOOL DISTRICT CLARK COUNTY
JUNE 30, 2017
TABLE OF CONTENTS TITLE PAGE Prepared by Management: Schedule of Expenditures of Federal Awards ........................................................................................... 1
Notes to the Schedule of Expenditures of Federal Awards....................................................................... 2
Independent Auditor’s Report on Internal Control Over Financial Reporting and on Compliance and Other Matters Required by Government Auditing Standards ........................................................................................... 3 Independent Auditor’s Report on Compliance with Requirements Applicable to the Major Federal Program and on Internal Control Over Compliance Required by the Uniform Guidance ....................................................................................... 5 Schedule of Findings ..................................................................................................................................... 9

This page intentionally left blank.

1
FEDERAL GRANTOR Federal Pass ThroughPass Through Grantor CFDA Entity Identifying Non-CashProgram / Cluster Title Number Number Disbursements Disbursements
U.S. DEPARTMENT OF AGRICULTURE
Direct Program
Farm to School Grant Program 10.575 N/A 2,715$
Passed Through Ohio Department of EducationChild Nutrition Cluster
Non-Cash Assistance (Food Distribution): National School Lunch Program 10.555 N/A 534,332$
Cash Assistance: School Breakfast Program 10.553 N/A 1,387,571 National School Lunch Program 10.555 N/A 3,470,398Total Child Nutrition Cluster 4,857,969 534,332
Child and Adult Care Food Program 10.558 N/A 31,187
Total U.S. Department of Agriculture 4,891,871 534,332
NATIONAL SCIENCE FOUNDATIONPassed Through University of Massachusetts Boston
Education and Human Resources 47.076 N/A 32,265
Total National Science Foundation 32,265
U.S. DEPARTMENT OF EDUCATIONPassed Through Ohio Department of Education
Adult Education - Basic Grants to States 84.002 N/A 79,598
Title I Grants to Local Education Agencies 84.010 N/A 5,230,269
Special Education Cluster (IDEA) Special Education_Grants to States 84.027 N/A 1,811,384
Special Education_Preschool Grants 84.173 N/A 63,942Total Special Education Cluster (IDEA) 1,875,326
Education for Homeless Children and Youth 84.196 N/A 20,443
Twenty-First Century Community Learning Centers 84.287 N/A 359,334
Advanced Placement Program (Advanced Placement Test Fee; Advanced Placement Incentive Program Grants) 84.330 N/A 120
English Language Acquisition State Grants 84.365 N/A 43,778
Supporting Effective Instruction State Grants (formerly Improving Teacher Quality State Grants) 84.367 N/A 710,027
Total U.S. Department of Education 8,318,895
Total Expenditures of Federal Awards $13,243,031 $534,332
The accompanying notes are an integral part of this schedule.
SPRINGFIELD CITY SCHOOL DISTRICTCLARK COUNTY
SCHEDULE OF EXPENDITURES OF FEDERAL AWARDSFOR THE FISCAL YEAR ENDED JUNE 30, 2017

Springfield City School District Notes to the Schedule of Expenditures of Federal Awards
For the Fiscal Year Ended June 30, 2017 NOTE 1 – GENERAL
The accompanying schedule of expenditures of federal awards is a summary activity of all federal award programs of the Springfield City School District. The information in this Schedule is presented in accordance with the requirements of Title 2 U.S. Code of Federal Regulations Part 200, Uniform Administrative Requirements, Cost Principles, and Audit Requirements for Federal Awards (Uniform Guidance). Because the Schedule presents only a selected portion of the operations of the School District, it is not intended to and does not present the financial position, changes in net position or cash flows of the School District.
NOTE 2 – SIGNIFICANT ACCOUNTING POLICIES
The accompanying schedule of expenditures of federal awards has been prepared on the cash basis of accounting. Expenditures are recognized following, as applicable, either the cost principles in OMB Circular A-87, Cost Principles for State, Local, and Indian Tribal Governments, or the cost principles contained in Title 2 U.S. Code of Federal Regulations Part 200, Uniform Administrative Requirements, Cost Principles, and Audit Requirements for Federal Awards wherein certain types of expenditures are not allowable or are limited as to reimbursement. In addition, the School District did not pass-through any federal awards to subrecipients during the year ended June 30, 2017.
The School District has not elected to use the 10 percent de minimus indirect cost rate to recover indirect costs as allowed under the Uniform Guidance.
NOTE 3 – U.S. DEPARTMENT OF AGRICULTURE PROGRAMS
Non-monetary assistance, such as food received from the U.S. Department of Agriculture, is reported on the schedule of expenditures of federal awards at the market value of the commodities received and consumed. Cash receipts from the U.S. Department of Agriculture are commingled with State grants. It is assumed federal monies are expended first.
2

3
One First National Plaza, 130 W. Second St., Suite 2040, Dayton, Ohio 45402 Phone: 937-285-6677 or 800-443-9274 Fax: 937-285-6688
www.ohioauditor.gov
INDEPENDENT AUDITOR’S REPORT ON INTERNAL CONTROL OVER FINANCIAL REPORTING AND ON COMPLIANCE AND OTHER MATTERS
REQUIRED BY GOVERNMENT AUDITING STANDARDS Springfield City School District Clark County 1500 West Jefferson Street Springfield, Ohio 45506 To the Board of Education: We have audited, in accordance with auditing standards generally accepted in the United States and the Comptroller General of the United States’ Government Auditing Standards, the financial statements of the governmental activities, each major fund and the aggregate remaining fund information of the Springfield City School District, Clark County, (the District) as of and for the fiscal year ended June 30, 2017, and the related notes to the financial statements, which collectively comprise the District’s basic financial statements and have issued our report thereon dated December 15, 2017. Internal Control Over Financial Reporting As part of our financial statement audit, we considered the District’s internal control over financial reporting (internal control) to determine the audit procedures appropriate in the circumstances to the extent necessary to support our opinions on the financial statements, but not to the extent necessary to opine on the effectiveness of the District’s internal control. Accordingly, we have not opined on it. A deficiency in internal control exists when the design or operation of a control does not allow management or employees, when performing their assigned functions, to prevent, or detect and timely correct misstatements. A material weakness is a deficiency, or combination of internal control deficiencies resulting in a reasonable possibility that internal control will not prevent or detect and timely correct a material misstatement of the District’s financial statements. A significant deficiency is a deficiency, or a combination of deficiencies, in internal control that is less severe than a material weakness, yet important enough to merit attention by those charged with governance. Our consideration of internal control was for the limited purpose described in the first paragraph of this section and was not designed to identify all internal control deficiencies that might be material weaknesses or significant deficiencies. Given these limitations, we did not identify any deficiencies in internal control that we consider material weaknesses. However, unidentified material weaknesses may exist.

Springfield City School District Clark County Independent Auditor’s Report on Internal Control Over Financial Reporting and on Compliance and Other Matters Required by Government Auditing Standards Page 2
4
Compliance and Other Matters
As part of reasonably assuring whether the District’s financial statements are free of material misstatement, we tested its compliance with certain provisions of laws, regulations, contracts, and grant agreements, noncompliance with which could directly and materially affect the determination of financial statement amounts. However, opining on compliance with those provisions was not an objective of our audit and accordingly, we do not express an opinion. The results of our tests disclosed no instances of noncompliance or other matters we must report under Government Auditing Standards. Purpose of this Report
This report only describes the scope of our internal control and compliance testing and our testing results, and does not opine on the effectiveness of the District’s internal control or on compliance. This report is an integral part of an audit performed under Government Auditing Standards in considering the District’s internal control and compliance. Accordingly, this report is not suitable for any other purpose. Dave Yost Auditor of State Columbus, Ohio December 15, 2017
5
OneFirstNationalPlaza,130W.SecondSt.,Suite2040,Dayton,Ohio45402Phone:937‐285‐6677or800‐443‐9274Fax:937‐285‐6688
www.ohioauditor.gov
INDEPENDENT AUDITOR’S REPORT ON COMPLIANCE WITH REQUIREMENTS APPLICABLE TO THE MAJOR FEDERAL PROGRAM AND ON INTERNAL CONTROL OVER
COMPLIANCE REQUIRED BY THE UNIFORM GUIDANCE
Springfield City School District Clark County 1500 West Jefferson Street Springfield, Ohio 45506 To the Board of Education:
Report on Compliance for the Major Federal Program
We have audited the Springfield City School District’s (the District) compliance with the applicable requirements described in the U.S. Office of Management and Budget (OMB) Compliance Supplement that could directly and materially affect the Springfield City School District’s major federal program for the fiscal year ended June 30, 2017. The Summary of Auditor’s Results in the accompanying schedule of findings identifies the District’s major federal program. Management’s Responsibility The District’s Management is responsible for complying with federal statutes, regulations, and the terms and conditions of its federal awards applicable to its federal program. Auditor’s Responsibility Our responsibility is to opine on the District’s compliance for the District’s major federal program based on our audit of the applicable compliance requirements referred to above. Our compliance audit followed auditing standards generally accepted in the United States of America; the standards for financial audits included in the Comptroller General of the United States’ Government Auditing Standards; and the audit requirements of Title 2 U.S. Code of Federal Regulations Part 200, Uniform Administrative Requirements, Cost Principles, and Audit Requirements for Federal Awards (Uniform Guidance). These standards and the Uniform Guidance require us to plan and perform the audit to reasonably assure whether noncompliance with the applicable compliance requirements referred to above that could directly and materially affect a major federal program occurred. An audit includes examining, on a test basis, evidence about the District’s compliance with those requirements and performing such other procedures as we considered necessary in the circumstances. We believe our audit provides a reasonable basis for our compliance opinion on the District’s major program. However, our audit does not provide a legal determination of the District’s compliance.

Springfield City School District Clark County Independent Auditor’s Report on Compliance With Requirements Applicable to the Major Federal Program and on Internal Control Over Compliance Required by the Uniform Guidance Page 2
6
Opinion on the Major Federal Program In our opinion, the Springfield City School District complied, in all material respects with the compliance requirements referred to above that could directly and materially affect its major federal program for the fiscal year ended June 30, 2017. Report on Internal Control Over Compliance
The District’s management is responsible for establishing and maintaining effective internal control over compliance with the applicable compliance requirements referred to above. In planning and performing our compliance audit, we considered the District’s internal control over compliance with the applicable requirements that could directly and materially affect a major federal program, to determine our auditing procedures appropriate for opining on each major federal program’s compliance and to test and report on internal control over compliance in accordance with the Uniform Guidance, but not to the extent needed to opine on the effectiveness of internal control over compliance. Accordingly, we have not opined on the effectiveness of the District’s internal control over compliance. A deficiency in internal control over compliance exists when the design or operation of a control over compliance does not allow management or employees, when performing their assigned functions, to prevent, or to timely detect and correct, noncompliance with a federal program’s applicable compliance requirement. A material weakness in internal control over compliance is a deficiency, or combination of deficiencies, in internal control over compliance, such that there is a reasonable possibility that material noncompliance with a federal program compliance requirement will not be prevented, or timely detected and corrected. A significant deficiency in internal control over compliance is a deficiency, or a combination of deficiencies, in internal control over compliance with federal program’s applicable compliance requirement that is less severe than a material weakness in internal control over compliance, yet important enough to merit attention by those charged with governance. Our consideration of internal control over compliance was for the limited purpose described in the first paragraph of this section and would not necessarily identify all deficiencies in internal control over compliance that might be material weaknesses or significant deficiencies. We did not identify any deficiencies in internal control over compliance that we consider to be material weaknesses. However, material weaknesses may exist that have not been identified.
This report only describes the scope of our internal control over compliance tests and the results of this testing based on Uniform Guidance requirements. Accordingly, this report is not suitable for any other purpose.

Springfield City School District Clark County Independent Auditor’s Report on Compliance With Requirements Applicable to the Major Federal Program and on Internal Control Over Compliance Required by the Uniform Guidance Page 3
7
Report on Schedule of Expenditures of Federal Awards Required by the Uniform Guidance We have also audited the financial statements of the governmental activities, each major fund and the aggregate remaining fund information of the Springfield City School District (the District) as of and for the fiscal year ended June 30, 2017, and the related notes to the financial statements, which collectively comprise the District’s basic financial statements. We issued our unmodified report thereon dated December 15, 2017. We conducted our audit to opine on the District’s basic financial statements as a whole. The accompanying schedule of expenditures of federal awards presents additional analysis required by the Uniform Guidance and is not a required part of the basic financial statements. The schedule is management’s responsibility, and was derived from and relates directly to the underlying accounting and other records management used to prepare the basic financial statements. We subjected this schedule to the auditing procedures we applied to the basic financial statements. We also applied certain additional procedures, including comparing and reconciling this schedule directly to the underlying accounting and other records used to prepare the basic financial statements or to the basic financial statements themselves, and other additional procedures in accordance with auditing standards generally accepted in the United States of America. In our opinion, this schedule is fairly stated, in all material respects, in relation to the basic financial statements taken as a whole. Dave Yost Auditor of State Columbus, Ohio December 15, 2017

8
This page intentionally left blank.

9
SPRINGFIELD CITY SCHOOL DISTRICT CLARK COUNTY
SCHEDULE OF FINDINGS
2 CFR § 200.515 JUNE 30, 2017
1. SUMMARY OF AUDITOR’S RESULTS
(d)(1)(i) Type of Financial Statement Opinion Unmodified
(d)(1)(ii) Were there any material weaknesses in internal control reported at the financial statement level (GAGAS)?
No
(d)(1)(ii) Were there any significant deficiencies in internal control reported at the financial statement level (GAGAS)?
No
(d)(1)(iii) Was there any reported material noncompliance at the financial statement level (GAGAS)?
No
(d)(1)(iv) Were there any material weaknesses in internal control reported for major federal programs?
No
(d)(1)(iv) Were there any significant deficiencies in internal control reported for major federal programs?
No
(d)(1)(v) Type of Major Programs’ Compliance Opinion Unmodified
(d)(1)(vi) Are there any reportable findings under 2 CFR § 200.516(a)?
No
(d)(1)(vii) Major Programs (list): Child Nutrition Cluster
(d)(1)(viii) Dollar Threshold: Type A\B Programs Type A: > $ 750,000 Type B: all others
(d)(1)(ix) Low Risk Auditee under 2 CFR §200.520? Yes
2. FINDINGS RELATED TO THE FINANCIAL STATEMENTS REQUIRED TO BE REPORTED IN ACCORDANCE WITH GAGAS
None
3. FINDINGS AND QUESTIONED COSTS FOR FEDERAL AWARDS
None

This page intentionally left blank.

COMPREHENSIVE ANNUAL FINANCIAL REPORT
For the Fiscal Year Ended June 30, 2017
1500 W Jefferson Street
Springfield, Ohio 45506
www.scsdoh.org
STUDENT-CENTERED
CO
LL
AB
OR
AT
IVE
CURIOUS
DIVERSE


Springfield City School District Comprehensive Annual Financial Report For the Fiscal Year Ended June 30, 2017
Prepared by:
Dale Miller, Treasurer/CFO


COLLABORATIVE
INTRODUCTORY SECTION
COMPREHENSIVE
ANNUAL FINANCIAL
REPORT
For the Fiscal Year Ended June 30, 2017
1500 W Jefferson Street, Springfield, Ohio 45506
Phone:(937) 505-2800 www.scsdoh.org
DIVERSE
STUDENT-CENTERED CURIOUS


i
Springfield City School District Comprehensive Annual Financial Report For the Fiscal Year Ended June 30, 2017
TABLE OF CONTENTS
INTRODUCTORY SECTION Table of Contents ............................................................................................................................. i Letter of Transmittal .......................................................................................................................v GFOA Certificate of Achievement .............................................................................................. xiii ASBO Certificate of Excellence .................................................................................................. xiv List of Principal Officials ..............................................................................................................xv Organizational Chart ................................................................................................................... xvi FINANCIAL SECTION Independent Auditor’s Report ..........................................................................................................1 Management’s Discussion and Analysis .........................................................................................5 Basic Financial Statements: Government-wide Financial Statements: Statement of Net Position ...............................................................................................12 Statement of Activities ....................................................................................................13 Fund Financial Statements: Balance Sheet - Governmental Funds .............................................................................14 Reconciliation of Total Governmental Fund Balances to Net Position of Governmental Activities ..................................................................15 Statement of Revenues, Expenditures and Changes in Fund Balances - Governmental Funds .......................................................16 Reconciliation of the Statement of Revenues, Expenditures and Changes in Fund Balances of Governmental Funds to the Statement of Activities ........................................................................................17 Statement of Revenues, Expenditures and Changes in Fund Balance - Budget (Non-GAAP Basis) and Actual - General Fund .....................18 Statement of Fund Net Position - Internal Service Fund ................................................19
ii
TABLE OF CONTENTS
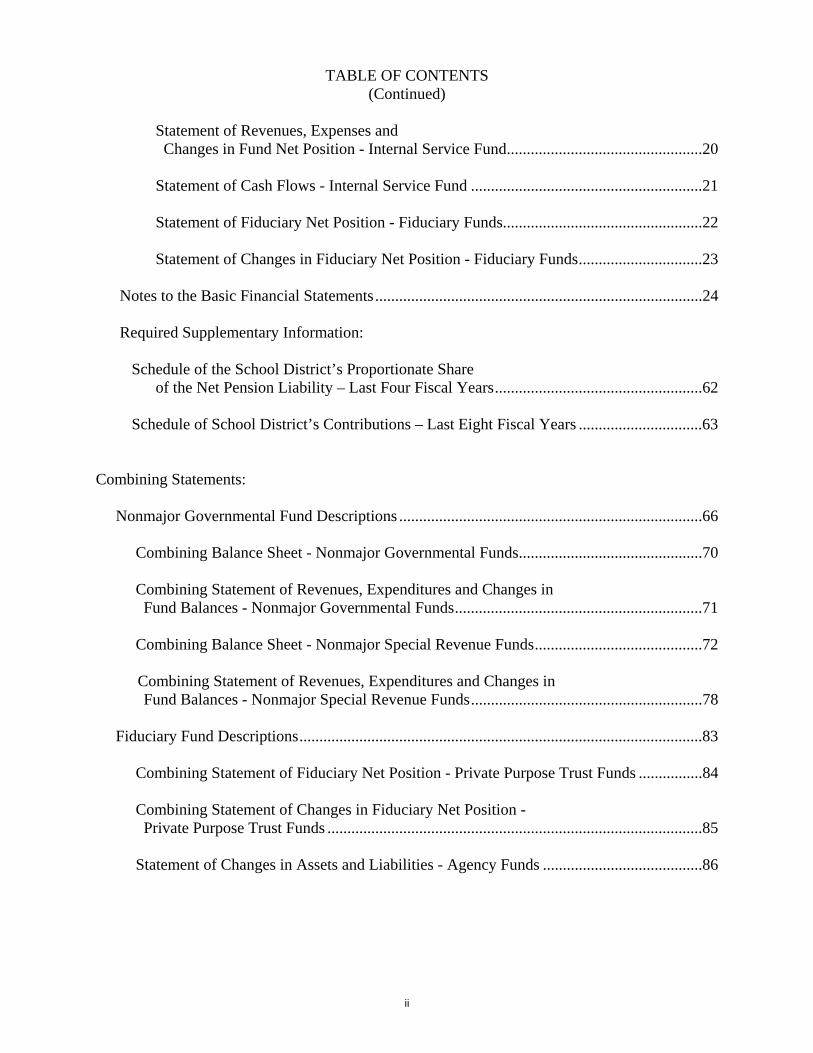
(Continued) Statement of Revenues, Expenses and Changes in Fund Net Position - Internal Service Fund .................................................20 Statement of Cash Flows - Internal Service Fund ..........................................................21 Statement of Fiduciary Net Position - Fiduciary Funds..................................................22 Statement of Changes in Fiduciary Net Position - Fiduciary Funds ...............................23 Notes to the Basic Financial Statements ..................................................................................24 Required Supplementary Information: Schedule of the School District’s Proportionate Share
of the Net Pension Liability – Last Four Fiscal Years ....................................................62 Schedule of School District’s Contributions – Last Eight Fiscal Years ...............................63 Combining Statements: Nonmajor Governmental Fund Descriptions ............................................................................66 Combining Balance Sheet - Nonmajor Governmental Funds ..............................................70 Combining Statement of Revenues, Expenditures and Changes in Fund Balances - Nonmajor Governmental Funds ..............................................................71 Combining Balance Sheet - Nonmajor Special Revenue Funds ..........................................72
Combining Statement of Revenues, Expenditures and Changes in Fund Balances - Nonmajor Special Revenue Funds ..........................................................78 Fiduciary Fund Descriptions .....................................................................................................83 Combining Statement of Fiduciary Net Position - Private Purpose Trust Funds ................84 Combining Statement of Changes in Fiduciary Net Position -
Private Purpose Trust Funds ..............................................................................................85 Statement of Changes in Assets and Liabilities - Agency Funds ........................................86

iii
TABLE OF CONTENTS (Continued)
Individual Fund Schedules of Revenues, Expenditures and Changes in Fund Balances - Budget (Non-GAAP Basis) and Actual:
Major Funds: Bond Retirement Fund ...........................................................................................................88 Building Fund ........................................................................................................................89 Non-major Funds: Permanent Improvement Fund ...............................................................................................90 Food Service Fund .................................................................................................................91
Mental Health/Early Start Fund .............................................................................................92 Other Grants Fund ..................................................................................................................93 School Age Child Care/After School Enrichment Fund ........................................................94 Basic Education Foundation Fund .........................................................................................95 Ohio School Facilities Classroom Maintenance Fund ...........................................................96 District Managed Student Activities Fund .............................................................................97 Auxiliary Services Fund ........................................................................................................98 Early Childhood Education Fund ...........................................................................................99 Data Communications Fund ................................................................................................100 Alternative Schools Fund .....................................................................................................101 Straight A Grant Fund ..........................................................................................................102 Miscellaneous State Grant Fund ..........................................................................................103 Adult Basic Education Fund ................................................................................................104 Title VI-B Special Education Part B - IDEA Fund ..............................................................105 Title I School Improvement Stimulus A Fund .....................................................................106 Title III Limited English Proficiency Fund .........................................................................107 Title I Fund ..........................................................................................................................108 Preschool Grant Fund ..........................................................................................................109 Title VI-R Fund....................................................................................................................110 Miscellaneous Federal Grants Fund .....................................................................................111 Public School Support Fund ................................................................................................112 Underground Storage Tank Fund.........................................................................................113 Self-Insurance Fund .............................................................................................................114 STATISTICAL SECTION Statistical Tables Descriptions ...................................................................................................115 Net Position by Component - Governmental Activities - Last Ten Fiscal Years ......................116 Changes in Net Position - Governmental Activities - Last Ten Fiscal Years ............................118 Fund Balances - Governmental Funds - Last Ten Fiscal Years ...............................................122 Changes in Fund Balances - Governmental Funds - Last Ten Fiscal Years ..............................124 Assessed Valuation and Estimated Actual Value of Taxable Property -
Last Ten Collection (Calendar) Years ..................................................................................128 Principal Real Property Taxpayers – Tax Year 2016 and 2009 .................................................130

iv
TABLE OF CONTENTS (Continued)
Property Tax Rates (Per $1,000 of Assessed Valuation) Direct and Overlapping
Governments - Last Ten Collection (Calendar) Years .........................................................132 Property Tax Levies and Collections - Real, Public Utility Personal and
General Business Personal Property - Last Ten Collection (Calendar) Years .....................136 Ratio of Debt to Estimated Actual Value, Personal Income and Debt Per Capita -
Last Ten Fiscal Years ...........................................................................................................138 Ratio of General Obligation Bonded Debt to Estimated Actual Value and General Obligation Bonded Debt Per Capita - Last Ten Fiscal Years .................................140 Computation of Direct and Overlapping Debt - June 30, 2017 ...................................................141 Computation of Legal Debt Margin - Last Ten Fiscal Years ......................................................142 Demographic and Economic Statistics - Last Ten Fiscal Years ..................................................144 Ranking of Top Ten Employers For Fiscal Year 2017 and Fiscal Year 2008 .............................145 Building Statistics - Last Nine Fiscal Years ................................................................................146 Per Pupil Cost - Last Ten Fiscal Years ........................................................................................148 Employees by Function - Last Ten Fiscal Years .........................................................................149 Enrollment – Last Nine Fiscal Years ...........................................................................................150 Percentage of Students who Receive Free and Reduced Lunches - Last Ten Fiscal Years ........152

v
December 18, 2017 To the Citizens and Board of Education of the Springfield City School District: We are pleased to present the Comprehensive Annual Financial Report (CAFR) of the Springfield City School District (District) for the fiscal year ended June 30, 2017. This CAFR is prepared in accordance with accounting principles generally accepted in the United States of America (GAAP) and in conformance with standards of financial reporting established by the Governmental Accounting Standards Board (GASB) using guidelines recommended by the Government Finance Officers Association of the United States and Canada (GFOA). The intent of this report is to provide taxpayers of the Springfield City School District with comprehensive financial data in a format that enables them to gain a true understanding of the School District’s financial affairs as well as provide management with better financial information for future decision making. This report was prepared by the Treasurer’s Office. Responsibility for both the accuracy of the data, and the completeness and fairness of the presentation, including all disclosures, rests with management based upon a comprehensive framework of internal control that it has established for this purpose. Because the cost of internal control should not exceed the anticipated benefits, the objective is to provide reasonable, rather than absolute, assurance that the financial statements are free of any material misstatements. Management’s discussion and analysis immediately follows the Independent Auditor’s Report and provides a narrative introduction, overview, and analysis of the basic financial statements. Management’s discussion and analysis complements this letter of transmittal and should be read in conjunction with it. This report includes all funds of the School District. The School District provides a full range of traditional and nontraditional educational programs and services. These include elementary and secondary curriculum offerings at the general, college preparatory and vocational levels; a broad range of co-curricular and extracurricular activities; adult and community education offerings; and special education programs and facilities. The basic financial statements of the School District for the fiscal year ended June 30, 2017, were audited by the Ohio Auditor of State whose unmodified opinion is included at the beginning of the Financial Section of this report. ORGANIZATION OF THE SCHOOL DISTRICT AND REPORTING ENTITY The Board of Education of the Springfield City School District (the “Board”) consists of five members and is incorporated as defined by Section 3313.02, Ohio Revised Code. The Board serves as the taxing authority, contracting body, policy maker, ensures that all other general laws of the State of Ohio are followed in the expenditure of the School District’s tax dollars, and approves the annual appropriation resolution and tax budget.
SuperintendentRobertHill
937.505.2806
TreasurerDaleMiller
937.505.2811
BoardMembersAnitaBiles
JamieCallanEdLeventhal
ChrisWilliamsWandaTruss

vi
The Board members represent a cross section of professions found in the City of Springfield. The Board members on June 30, 2017, were as follows: Service as a Board Member Board Member Began Expires
Ed Leventhal 01/01/08 12/31/19 Board President Wanda Truss 01/01/10 12/31/17 Board Vice-President Jamie Callan 01/01/08 12/31/19 Board Member Anita Biles 09/29/11 12/31/17 Board Member Chris Williams 06/18/15 12/31/19 Board Member
The Superintendent is the chief executive officer of the School District, responsible directly to the Board of Education for all educational and support operations. Dr. Robert Hill began his tenure as Superintendent on July 1, 2015. The Treasurer is the chief financial officer of the School District, responsible directly to the Board of Education for all financial records and statutorily defined duties which in part relate to paying all expenses, debt issuance, reporting, record retention, strategic planning and many other areas. Mr. Dale Miller began his tenure as Treasurer on April 1, 2013. A reporting entity is comprised of the primary government, component units, and other organizations that are included to ensure that the financial statements are not misleading. The primary government of the School District consists of all funds, departments, boards, and agencies that are not legally separate from the School District. This includes general operations, food service, and student related activities of the School District. Component units are legally separate organizations for which the School District is financially accountable. The School District is financially accountable for an organization if the School District appoints a voting majority of the organization’s governing board and (1) the School District is able to significantly influence the programs or services performed or provided by the organization; or (2) the School District is legally entitled to or can otherwise access the organization’s resources; the School District is legally obligated or has otherwise assumed the responsibility to finance the deficits of, or provide financial support to, the organization; or the School District is obligated for the debt of the organization. Component units may also include organizations that are fiscally dependent on the School District in that the School District approves the organization’s budget, the issuance of its debt, or the levying of its taxes. The School District has no component units. In addition to providing the general activities mentioned above, the School District has administrative responsibility for State funds distributed to private schools located within School District boundaries. In accordance with GASB Statement No. 24, this responsibility is included in the reporting entity as a special revenue fund. The private schools served are Catholic Central, Catholic Central Lagonda Elementary, Catholic Central Limestone Elementary, Springfield Christian and Nightingale Montessori School. While these organizations share operations and services similar with the School District, all are separate and distinct entities. Because of their independent nature, none of these organization’s financial statements are included in this report. The Clark County Family and Children First Council, the Southwestern Ohio Educational Purchasing Council, and the Springfield-Clark Career Technology Center are reported as jointly governed organizations in Note 16. The Ohio SchoolComp Group Retrospective Rating Program and the Ohio School Plan are reported as insurance purchasing pools in Note 17.

vii
The School Board adopts an annual budget by July 1 which may be amended any time during the fiscal year as new information becomes available. This annual budget serves as the foundation of the Springfield City School District’s financial planning and control. The objective of budgetary controls is to ensure compliance with legal provisions embodied in the annual appropriation resolution. The legal level of budgetary control (the level at which expenditures cannot legally exceed the appropriated amount) is established at the fund level. The Treasurer has been authorized to allocate Board appropriations to the object level within the funds. THE SCHOOL DISTRICT AND ITS FACILITIES The School District serves an area of approximately 17 square miles in and around the City of Springfield. It is located in Clark County, approximately 45 miles west of downtown Columbus, the State capital. The Springfield City School District is an urban school district with nearly 100 percent of the City of Springfield being located within the School District. According to City of Springfield, Springfield’s population is 59,680. Because of economic stress, as in most urban school districts, the Springfield City School District and its surrounding areas struggle. The School District had an enrollment of 7,938 students for the fiscal year ending June 30, 2017. This was an increase of 10 students compared to the fiscal year ending June 30, 2016. The School District estimates enrollment to be between 7,800 and 7,850 for the fiscal years ending June 30, 2017 through 2018. The School District’s enrollment figures do not include students living within the School District’s attendance area who attend charter schools. Currently, the School District has 790 students attending charter schools. The School District’s facilities include ten neighborhood elementary schools (grades K through 6), three middle schools (Grades 7 and 8), one alternative school, one high school (Grades 9 through 12), a maintenance building, a bus garage, an administration building/preschool and several athletic fields. The maintenance building and stadiums were built in 1960 and 1977, respectively. Of the School District’s 18 active buildings, 17 have been built since 2004. In August 2011, a new transportation facility which includes offices, a maintenance area, an automatic bus washing system, and a fueling system was completed. In August 2015, the Career ConnectED center was opened. This center includes teacher training and meeting rooms, District program offices and innovative spaces for students to develop success skills as they explore digital media, computer science, welding, and woodworking. In October 2016, the John Legend Theatre was opened to enhance the cultural opportunities for the students and the entire community. SERVICES PROVIDED BY THE SCHOOL DISTRICT The School District provides a wide variety of educational and support services as mandated by the Ohio Revised Code or by Board directives. At the center of the School District’s services are the instructional programs. The School District offers regular instructional programs daily to students in Grades K through 12. The School District serves approximately 150 students with an interest in vocational education, and approximately 1,400 children who need individual instruction or are physically or mentally handicapped. These students receive service through the wide array of special education programs offered in the School District. The School District issued 419 diplomas in 2017. There are also several academic and athletic programs for students, providing them with a number of enriching experiences. The programs and activities provide a lifetime of memories for the Springfield City School District students. In addition to the educational services provided, the School District’s fleet of 33 buses traveled approximately 1,500 miles each day providing transportation services to 1,400 public and 200 private and parochial students. Many of the School District’s students walk to school because of the proximity of neighborhood schools to the students’ homes. The Food Service Department serves over 9,500 breakfast

viii
and lunch meals daily for a total of over 1.7 million meals served annually through the School District’s lunchrooms. Along with transportation and school lunch services offered to children in the School District, the students also receive guidance, psychological, and health services free of charge. The guidance services are designed to help a student match his/her natural skills with vocational and/or academic programs to help him/her achieve his/her full potential in life. Psychological services offer a wide variety of help to students ranging from early developmentally handicapped identification to drug and behavior counseling. Health services provide limited medical services free of charge to many of the School District’s youths. EMPLOYEE RELATIONS The School District currently has 1,051 full-time and part-time employees. There are two organizations representing School District employees. The Springfield Education Association (SEA) represents certificated employees, including teachers and educational specialists, for collective bargaining purposes. Classified employees, which include bus drivers, cooks, and clerical staff, are represented for collective bargaining purposes by the Springfield Education United Support Staff (SEUSS). The Board successfully concluded negotiations with both labor organizations on a multi-year agreement for wages and fringe benefits. The SEA’s wage agreement is in effect for the period August 1, 2017, through July 31, 2020. The SEUSS’s wage agreement is in effect for the period September 1, 2017, through August 31, 2020. ECONOMIC CONDITION AND OUTLOOK The City of Springfield’s employment is dominated by healthcare activities, which includes the Springfield Regional Medical Center, one of the School District’s largest employers. Other large employers within the City of Springfield include a service industry with the corporate headquarters of the Assurant Specialty Property and governmental services. Ohio’s seasonally adjusted unemployment rate continues to decline as the economy begins to recover. The Ohio unemployment rate for June 2017 increased to 5.2 percent from 4.8 percent in June 2016. The nation’s unemployment rate for June 2017 was 4.4 percent. Specific employment figures for the Springfield City School District are not available. However, the Clark County unemployment rate for June 2017 was 5.7 percent (Ohio Department of Job and Family Services). The School District has an excellent relationship with the City of Springfield, which assures that development projects selected by the City are also highly desirable for the School District. The School District will continue to work with the City of Springfield and the other government agencies to attract desirable development to the community. FINANCIAL OUTLOOK It is important to review the financial history of the School District and to understand its current financial position requires constant review and accountability of the Board of Education, Administration, and Treasurer. The current financial plans are included in the five-year forecast which indicates the School District will maintain a positive cash balance through fiscal year 2022. Currently, the most significant risks to the School District are cost provisions in the current biennium State budget, declines in Federal grant funding and the Health Care and Education Reconciliation Act. For fiscal year 2017, the School District’s General Fund revenues exceeded its expenditures primarily due to increases in State funding and careful monitoring of expenditures. The School District intends to continue monitoring its revenue and expenditure streams in order to provide consistency each fiscal year.

ix
FINANCIAL PLANNING AND POLICIES The School District annually prepares a five-year financial forecast to ensure long-term financial success. The five-year financial forecast is prepared and approved by the Board in October and May of each fiscal year. The five-year financial forecast provides actual data on each major revenue and expenditure category for the past three fiscal years and forecasts these same categories for an additional five fiscal years. The five-year financial forecast is a planning tool used to certify if funds are available for future expenditures and additionally to strategize when the School District will need to return to voters for additional funds or reduce expenditures accordingly. The five-year financial forecast is published on the Ohio Department of Education’s website for public use. DISTRICT GOALS In fiscal year 2016 the Board engaged in a strategic planning process to ensure that the quality of educational opportunities for our students are the best available. The resulting strategic plan is based on a comprehensive assessment of organizational culture, strengths, weaknesses, opportunities, barriers and challenges. The strategic planning process also allowed the School District to incorporate stakeholder data that had been gathered over the past several years in order to identify what skills and competencies are necessary for a Springfield graduate to be successful in college or career and most importantly, life. The strategic plan identified four strategic priorities as follows:
1) Align and integrate resources to ensure academic and life success. 2) Build a culture of trust and empowerment across our School District 3) Forge strong community partnerships that support the whole child and connect the community
and schools. 4) Promote transparent communication and a sense of inclusion between staff, parents and students.
The School District has made a five year commitment to implementing the strategic plan and measuring progress. The School District will continue to revisit the plan over the next five years to make adjustments as necessary. MAJOR INITIATIVES AND EVENTS FOR THE YEAR In fiscal year 2017 the Springfield City School District began assessing and measuring the student 1:1 initiative which was implemented in fiscal year 2014 and provided each student a laptop or tablet to accelerate personalized learning. The results of the assessment indicated the School District will begin discussions to make decisions on a refresh of the program in the Spring of 2018. The Federal Government continued to reduce funding in several School District programs. The School District began budgeting to absorb certain grant funded positions into the operational funds of the School District in an effort to continue to improve student performance while maintaining fiscal solvency. Across the School District, additional resources were committed to support problem based learning, positive behavior intervention support and aligning instruction with standards. For the third year in a row, the School District increased the availability of high quality preschool to families regardless of ability to pay. The decision to absorb previously grant funded positions, commit additional resources to current programs and continue expansion of the preschool program were made because the School District believes they build the foundation to allow staff and students to grow together.
x
FOR THE FUTURE The School District continues to incorporate the strategic plan into the budgeting process and preparation of the five year forecast in an effort to balance programs and funding sources. The District will also begin revising the five year capital plan. The School District was very pleased with the community’s support of a renewal of an Emergency Operating Levy into a continuing substitute levy in November 2017. Instructional leaders are currently in the process of updating the curriculum at the middle schools and high school in an effort to continue to meet society’s demand for a 21st Century workforce. In addition, the School District is working toward a centralized registration location and modernizing the student registration process to provide easier access for parents and reduce the time needed to register current students and enroll new students. AWARDS AND ACKNOWLEDGEMENTS AWARDS GFOA Certificate of Achievement The Government Finance Officers Association of the United States and Canada (GFOA) awarded a Certificate of Achievement for Excellence in Financial Reporting to the Springfield City School District for its Comprehensive Annual Financial Report (CAFR) for the fiscal year ended June 30, 2016. This was the sixth year that the School District has achieved this prestigious award since discontinuing in fiscal year 2005. In order to be awarded a Certificate of Achievement, a government must publish an easily readable and efficiently organized CAFR. This report must satisfy both generally accepted accounting principles and applicable legal requirements. A Certificate of Achievement is valid for a period of one year only. We are submitting our current CAFR to GFOA to determine its eligibility for another certificate as we believe our current report conforms to the Certificate of Achievement Program’s requirements. ASBO Certificate The Springfield City School District received the Association of School Business Officials International (ASBO) Certificate of Excellence in Financial Reporting for its Comprehensive Annual Financial Report (CAFR) for the fiscal year ended June 30, 2016. This award certifies that the report substantially conforms to the principles and standards of financial reporting as recommended and adopted by the Association of School Business Officials International. An expert ASBO Panel of Review consisting of certified public accountants and practicing school business officials grants the award only after an intensive review of financial reports. Receiving the award is recognition that a school system has met the highest standards of excellence in school financial reporting. A Certificate of Excellence is valid for a period of one year only. We are submitting our current CAFR to ASBO, as we believe that our current report conforms to the Certificate of Excellence Program requirements. GFOA Certificate of Achievement for the Popular Annual Financial Report The Government Finance Officers Association of the United States and Canada (GFOA) awarded a Certificate of Achievement in Popular Annual Financial Reporting to the Springfield City School District for its Popular Annual Financial Report (PAFR) for the fiscal year ended June 30, 2016. This was the fifth year that the School District has achieved this prestigious award. In order to be awarded a Certificate of Achievement, a government must publish an easily readable and efficiently organized PAFR. This report must satisfy both generally accepted accounting principles and information requirements to the general public. A Certificate of Achievement is valid for a period of one year only. We are submitting our current PAFR to GFOA to determine its eligibility for another certificate as we believe our current report conforms to the Certificate of Achievement Program’s requirements.

xi
ACKNOWLEDGEMENTS The preparation and publication of this Comprehensive Annual Financial Report on a timely basis could not have been possible without the cooperation of the entire Treasurer’s Department. Finally, this report would not have been possible without the continued support of the Board of Education, who values quality financial information with which to help make decisions. Without their leadership and commitment to excellence, this report would not be possible. Sincerely,
Dale R Miller Dr. Robert F. Hill Treasurer/CFO Superintendent

xii

xiii

The Certificate of Excellence in Financial Reporting is presented to
Springfield City School District
for its Comprehensive Annual Financial Report (CAFR) for the Fiscal Year Ended June 30, 2016.
The CAFR has been reviewed and met or exceeded
ASBO International’s Certificate of Excellence standards.
Anthony N. Dragona, Ed.D., RSBA John D. Musso, CAE President Executive Director
xiv

The Springfield City School District Officials (937) 505-2800
www.spr.k12.oh.us
Robert F. Hill, Ed.D. Dale R. Miller Superintendent Treasurer/CFO (937) 505-2800 (937) 505-2811
Board of Education Mr. Ed Leventhal, President
Mrs. Wanda Truss, Vice President
Board Members Mr. Jamie Callan Ms. Anita Biles
Mr. Chris Williams
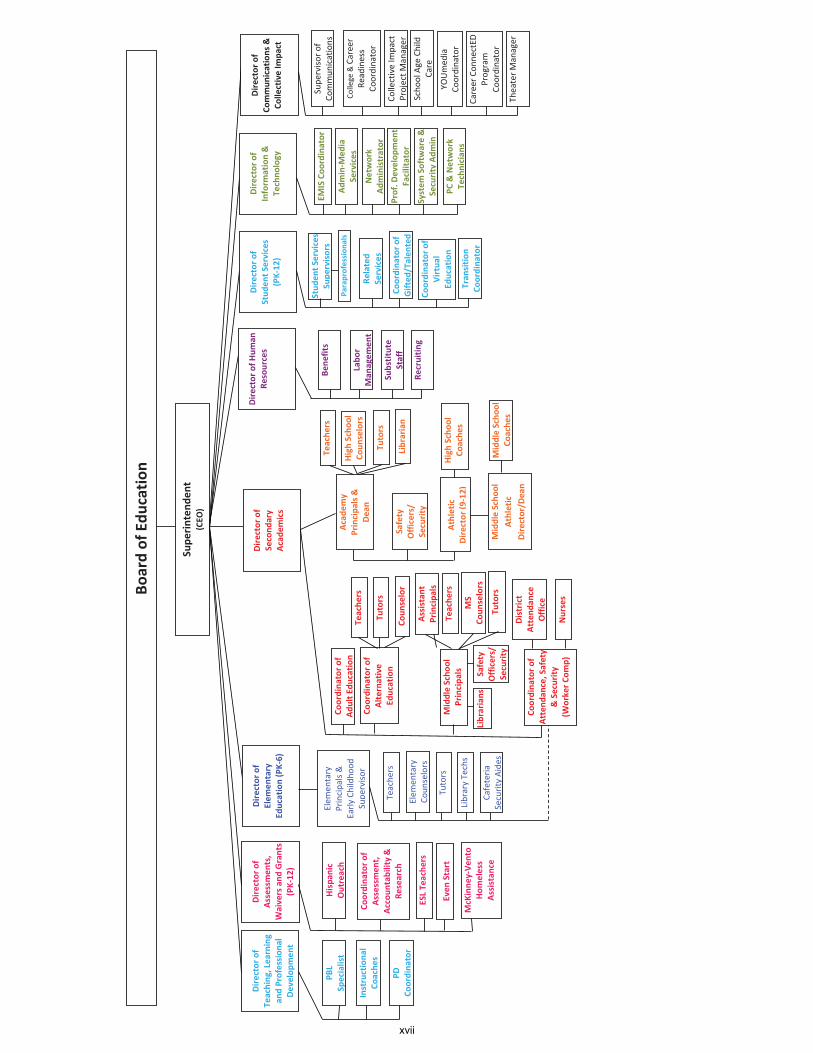
Director of Assessment, Waivers and Grants Paul Schneider Director of Teaching, Learning and Professional Development Emily Jablonka Director of Human Resources Stacey Tipler Director of Business Operations Vacant Director of Information & Technology Stacy Parr Director of Elementary Education Cristina Sanchez Director of Secondary Academics Marvin Jones Director of Student Services Karen Hall Director of Communications & Collective Impact Kim Fish
xv

Page
1of
2
Treasurer
(CFO
)
Boardof
Education
File:CC
A
BoardAd
opted:
__________,R
esolution
Controller
Assistan
tTreasurer
Payroll
Supe
rvisor
Payroll
Technician
Accoun
tsPa
yableClerk
Stud
entA
ctivity
Clerk/Secretary
Records
Retention
Director
ofBu
sine
ssOpe
ratio
ns(Procuremen
t,Co
ntracts,
PFLInsurance)
Supe
rvisor
ofTran
sportatio
nBu
sMecha
nic
PrintS
hop
Tran
sportatio
nStaff
Assistan
tSup
ervisoro
fTran
sportatio
n
Supe
rvisor
ofMainten
ance
&Cu
stod
ial
Services
Skilled
Workers
Assistan
tSup
ervisoro
fCu
stod
ianServices
Assistan
tCu
stod
ians
Head
Custod
ians
Head
Cook
s/Ca
féMan
ager
Supe
rvisor
ofFood
&NutritionServices
Assistan
tSup
ervisor
ofFood
Service
Cook
sHelpe
rs/
Cashiers
Food
Service
Drivers
Grou
ndskeepe
rs
xvi
Page
2of
2
Boardof
Education
BoardAd
opted:_______________,Re
solutio
n
File:CC
A
Supe
rintend
ent
(CEO
)
Director
ofAssessmen
ts,
Waiversan
dGrants
(PK12
)
Director
ofElem
entary
Education(PK6)
Director
ofSecond
ary
Acad
emics
Director
ofCo
mmun
ications
&Co
llectiveIm
pact
Director
ofHu
man
Resources
Substitute
Staff
Bene
fits
Labo
rMan
agem
ent
Recruitin
g
Director
ofStud
entS
ervices
(PK12
)
Stud
entS
ervices
Supe
rvisors
Related
Services
Paraprofession
als
Coordina
toro
fVirtua
lEd
ucation
Coordina
toro
fGifted
/Talen
ted
Tran
sitio
nCo
ordina
tor
Director
ofInform
ation&
Techno
logy
Director
ofTeaching
,Learning
andProfession
alDe
velopm
ent
PBL
Specialist
Instructiona
lCo
ache
s
PDCo
ordina
tor
TheaterM
anager
Hispan
icOutreach
ESLTeache
rs
Even
Start
Coordina
toro
fAssessmen
t,Ac
coun
tability&
Research
McKinne
yVe
nto
Homeless
Assistan
ce
Scho
olAg
eCh
ildCare
Supe
rviso
rof
Commun
ications
College
&Ca
reer
Readiness
Coordinator
YOUmed
iaCo
ordinator
CollectiveIm
pact
ProjectM
anager
Career
Conn
ectED
Program
Coordinator
EMISCo
ordina
tor
PC&Network
Technician
s
Prof.D
evelop
men
tFacilitator
Network
Administrator
Admin
Med
iaServices
System
Software&
SecurityAd
min
Coun
selor
Coordina
toro
fAd
ultE
ducatio
n
Coordina
toro
fAlternative
Education
Tutors
Teache
rs
Coordina
toro
fAttend
ance,Safety
&Security
(WorkerC
omp)
Distric
tAttend
ance
Office
Nurses
MiddleScho
olPrincipa
lsTeache
rs
Tutors
MS
Coun
selors
Assistan
tPrincipa
ls
Librarians
Safety
Officers/
Security
High
Scho
olCo
ache
sAthletic
Director
(912)
Safety
Officers/
Security
Acad
emy
Principa
ls&
Dean
High
Scho
olCo
unselors
Teache
rs
Tutors
Librarian
MiddleScho
olAthletic
Director/D
ean
MiddleScho
olCo
ache
s
Elem
entary
Principals&
Early
Childho
odSupe
rviso
r
Elem
entary
Coun
selors
Teache
rs
Cafeteria
SecurityAide
s
Tutors
LibraryTechs
xvii

xviii

FINANCIAL
SECTION
COMPREHENSIVE
ANNUAL FINANCIAL
REPORT
For the Fiscal Year Ended June 30, 2017
1500 W Jefferson Street, Springfield, Ohio 45506
Phone:(937) 505-2800 www.scsdoh.org
COLLABORATIVE
STUDENT-CENTERED
DIVERSE
CURIOUS


1
One First National Plaza, 130 W. Second St., Suite 2040, Dayton, Ohio 45402 Phone: 937-285-6677 or 800-443-9274 Fax: 937-285-6688
www.ohioauditor.gov
INDEPENDENT AUDITOR’S REPORT
Springfield City School District Clark County 1500 West Jefferson Street Springfield, Ohio 45506 To the Board of Education: Report on the Financial Statements We have audited the accompanying financial statements of the governmental activities, each major fund, and the aggregate remaining fund information
of the Springfield City School District, Clark County, Ohio (the District), as of and for the fiscal year ended June 30, 2017, and the related notes to the financial statements, which collectively comprise the District’s basic financial statements as listed in the table of contents. Management’s Responsibility for the Financial Statements Management is responsible for preparing and fairly presenting these financial statements in accordance with accounting principles generally accepted in the United States of America; this includes designing, implementing, and maintaining internal control relevant to preparing and fairly presenting financial statements that are free from material misstatement, whether due to fraud or error. Auditor's Responsibility Our responsibility is to opine on these financial statements based on our audit. We audited in accordance with auditing standards generally accepted in the United States of America and the financial audit standards in the Comptroller General of the United States’ Government Auditing Standards. Those standards require us to plan and perform the audit to reasonably assure the financial statements are free from material misstatement. An audit requires obtaining evidence about financial statement amounts and disclosures. The procedures selected depend on our judgment, including assessing the risks of material financial statement misstatement, whether due to fraud or error. In assessing those risks, we consider internal control relevant to the District’s preparation and fair presentation of the financial statements in order to design audit procedures that are appropriate in the circumstances, but not to the extent needed to opine on the effectiveness of the District's internal control. Accordingly, we express no such opinion. An audit also includes evaluating the appropriateness of management’s accounting policies and the reasonableness of their significant accounting estimates, as well as our evaluation of the overall financial statement presentation. We believe the audit evidence we obtained is sufficient and appropriate to support our audit opinions.

Springfield City School District Clark County Independent Auditor’s Report Page 2
2
Opinion In our opinion, the financial statements referred to above present fairly, in all material respects, the respective financial position of the governmental activities, each major fund, and the aggregate remaining fund information of the Springfield City School District, Clark County, Ohio, as of June 30, 2017, and the respective changes in financial position and, where applicable, cash flows thereof and the budgetary comparison for the General fund thereof for the fiscal year then ended in accordance with the accounting principles generally accepted in the United States of America. Other Matters Required Supplementary Information Accounting principles generally accepted in the United States of America require this presentation to include management’s discussion and analysis and schedules of net pension liabilities and pension contributions listed in the table of contents, to supplement the basic financial statements. Although this information is not part of the basic financial statements, the Governmental Accounting Standards Board considers it essential for placing the basic financial statements in an appropriate operational, economic, or historical context. We applied certain limited procedures to the required supplementary information in accordance with auditing standards generally accepted in the United States of America, consisting of inquiries of management about the methods of preparing the information and comparing the information for consistency with management’s responses to our inquiries, to the basic financial statements, and other knowledge we obtained during our audit of the basic financial statements. We do not opine or provide any assurance on the information because the limited procedures do not provide us with sufficient evidence to opine or provide any other assurance. Supplementary and Other Information Our audit was conducted to opine on the District’s basic financial statements taken as a whole. The introductory section, the financial section’s combining statements, individual fund statements and schedules and the statistical section information present additional analysis and are not a required part of the basic financial statements. The statements and schedules are management’s responsibility, and derive from and relate directly to the underlying accounting and other records used to prepare the basic financial statements. We subjected this information to the auditing procedures we applied to the basic financial statements. We also applied certain additional procedures, including comparing and reconciling this information directly to the underlying accounting and other records used to prepare the basic financial statements or to the basic financial statements themselves in accordance with auditing standards generally accepted in the United States of America. In our opinion, this information is fairly stated in all material respects in relation to the basic financial statements taken as a whole. We did not subject the introductory section and statistical section information to the auditing procedures applied in the audit of the basic financial statements and, accordingly, we express no opinion or any other assurance on them.

Springfield City School District Clark County Independent Auditor’s Report Page 3
3
Other Reporting Required by Government Auditing Standards In accordance with Government Auditing Standards, we have also issued our report dated December 15, 2017, on our consideration of the District’s internal control over financial reporting and our tests of its compliance with certain provisions of laws, regulations, contracts and grant agreements and other matters. That report describes the scope of our internal control testing over financial reporting and compliance, and the results of that testing, and does not opine on internal control over financial reporting or on compliance. That report is an integral part of an audit performed in accordance with Government Auditing Standards in considering the District’s internal control over financial reporting and compliance. Dave Yost Auditor of State Columbus, Ohio December 15, 2017

This page intentionally left blank.

4

This page intentionally left blank.

Springfield City School District Management’s Discussion and Analysis For the Fiscal Year Ended June 30, 2017
Unaudited
The discussion and analysis of the Springfield City School District’s financial performance provides an overall review of the School District’s financial activities for the fiscal year ended June 30, 2017. The intent of this discussion and analysis is to look at the School District’s financial performance as a whole; readers should also review the transmittal letter, the financial statements and the notes to the basic financial statements to enhance their understanding of the School District’s financial performance. Financial Highlights Key financial highlights for fiscal year 2017 are as follows:
� Total net position for fiscal year 2017 decreased $5.6 million from the fiscal year 2016 net position. This decrease was primarily due to an increase in health insurance claims and the effects of the changes in the net pension liability.
� General revenues accounted for $102,122,589 or 83.7% of total revenues. Program specific
revenues accounted for $19,836,902 or 16.3% of total revenues of $121,959,491. � The School District had $127,595,944 in expenses related to governmental activities; only
$19,836,902 of these expenses were offset by program specific charges for services, grants, contributions, and interest. General revenues (primarily grants and entitlements and property taxes) of $102,122,589 were not adequate to provide for these programs.
Using this Basic Financial Report This annual report consists of a series of financial statements and notes to those statements. These statements are organized so the reader can understand Springfield City School District as a financial whole, an entire operating entity. The Statement of Net Position and the Statement of Activities provide information about the activities of the whole School District, presenting both an aggregated view of the School District’s finances and a longer-term view of those statements. Fund financial statements provide the next level of detail. For governmental funds, these statements tell how services were financed in the short-term as well as what remains for future spending. The fund financial statements also look at the School District’s most significant funds with all other nonmajor funds presented in total in one column. Reporting the School District as a Whole One of the most important questions asked about the School District is “How did we do financially during fiscal year 2017?” The Statement of Net Position and the Statement of Activities, which appear first in the School District’s financial statements, report information on the School District as a whole and its activities in a way that helps answer this question. These government-wide financial statements include all assets, deferred outflows, liabilities and deferred inflows using the accrual basis of accounting, which is similar to the accounting used by most private-sector companies. This basis of accounting takes into account all of the current fiscal year’s revenues and expenses regardless of when cash is received or paid. These two statements report the School District’s net position and changes in net position. This change in net position is important because it tells the reader that, for the School District as a whole, the financial position of the School District has improved or diminished. However, the School District’s goal is to provide services to our students, not to generate profits as commercial entities do. One must consider many other non-financial factors, such as the School District’s property tax base, current property tax laws in Ohio restricting revenue growth, required educational programs and other factors.
5

Springfield City School District Management’s Discussion and Analysis For the Fiscal Year Ended June 30, 2017
Unaudited
Reporting the School District’s Most Significant Funds Fund Financial Statements Fund financial reports provide detailed information about the School District’s major funds. The School District uses many funds to account for a multitude of financial transactions. However, these fund financial statements focus on the School District’s major funds. The major funds for Springfield City School District are the General Fund, Bond Retirement Debt Service Fund and Building Capital Projects Fund. Governmental Funds Most of the School District’s activities are reported in governmental funds, which focus on how money flows into and out of those funds and the balances left at fiscal year-end available for spending in future periods. These funds are reported using an accounting method called modified accrual accounting, which measures cash and all other financial assets that can readily be converted to cash. The governmental fund statements provide a detailed short-term view of the School District’s general government operations and the basic services it provides. Governmental fund information helps you determine whether there are more or fewer financial resources that can be spent in the near future to finance educational programs. The relationship (or differences) between governmental activities (reported in the Statement of Net Position and the Statement of Activities) and governmental funds is reconciled in the financial statements. Proprietary Fund Proprietary funds use the same basis of accounting as business-type activities. The Internal Service Fund is used to report activities that provide services to the School District’s other funds and departments. Fiduciary Funds The School District’s fiduciary funds are private purpose trust funds and agency funds. All of the School District’s fiduciary funds are reported in a separate Statement of Fiduciary Net Position. We exclude these activities from the School District’s other financial statements because the School District cannot use these assets to finance its operations. The School District is responsible for ensuring that the assets reported in these funds are used for their intended purposes. Agency funds are custodial in nature (assets equal liabilities) and do not involve measurement of results of operations. Fiduciary funds use the accrual basis of accounting.
6

Springfield City School District Management’s Discussion and Analysis For the Fiscal Year Ended June 30, 2017
Unaudited
The School District as a Whole Recall that the Statement of Net Position provides the perspective of the School District as a whole. Table 1 provides a summary of the School District’s Net Position for fiscal year 2017 compared to fiscal year 2016:
(Table 1)Net Position
2017 2016Assets:
Current and Other Assets 85,476,202$ 83,936,193$ Capital Assets, Net 172,896,371 174,837,166
Total Assets 258,372,573 258,773,359
Deferred Outflows of ResourcesDeferred Charge on Refunding 173,281 730,956
Pension 32,729,692 13,153,205
Total Deferred Outflows of Resources 32,902,973 13,884,161
Liabilities:Current and Other Liabilities 12,771,471 13,135,013 Long-term Liabilities
Due Within One Year 3,883,599 3,770,138 Due in More than One Year:
Net Pension Liability 155,217,169 121,717,742
Other Amounts 25,047,834 27,226,111
Total Liabilities 196,920,073 165,849,004
Deferred Inflows of ResourcesProperty Taxes 19,880,711 18,545,072 Pension 95,107 8,247,336
Total Deferred Inflows of Resources 19,975,818 26,792,408
Net PositionNet Investment in Capital Assets 152,049,477 152,888,984 Restricted 13,136,246 12,577,780 Unrestricted (90,806,068) (85,450,656)
Total Net Position 74,379,655$ 80,016,108$
In fiscal year 2015, the School District adopted GASB Statement 68, “Accounting and Financial Reporting for Pensions—an Amendment of GASB Statement 27,” which significantly revises accounting for pension costs and liabilities. For reasons discussed below, many end users of this financial statement will gain a clearer understanding of the School District’s actual financial condition by adding deferred inflows related to pension and the net pension liability to the reported net position and subtracting deferred outflows related to pension.
7

Springfield City School District Management’s Discussion and Analysis For the Fiscal Year Ended June 30, 2017
Unaudited
Governmental Accounting Standards Board standards are national and apply to all government financial reports prepared in accordance with generally accepted accounting principles. When accounting for pension costs, GASB 27 focused on a funding approach. This approach limited pension costs to contributions annually required by law, which may or may not be sufficient to fully fund each plan’s net pension liability. GASB 68 takes an earnings approach to pension accounting; however, the nature of Ohio’s statewide pension systems and state law governing those systems requires additional explanation in order to properly understand the information presented in these statements. Under the new standards required by GASB 68, the net pension liability equals the School District’s proportionate share of each plan’s collective:
1. Present value of estimated future pension benefits attributable to active and inactive employees’ past service
2 Minus plan assets available to pay these benefits GASB notes that pension obligations, whether funded or unfunded, are part of the “employment exchange” – that is, the employee is trading his or her labor in exchange for wages, benefits, and the promise of a future pension. GASB noted that the unfunded portion of this pension promise is a present obligation of the government, part of a bargained-for benefit to the employee, and should accordingly be reported by the government as a liability since they received the benefit of the exchange. However, the School District is not responsible for certain key factors affecting the balance of this liability. In Ohio, the employee shares the obligation of funding pension benefits with the employer. Both employer and employee contribution rates are capped by State statute. A change in these caps requires action of both Houses of the General Assembly and approval of the Governor. Benefit provisions are also determined by State statute. The employee enters the employment exchange with the knowledge that the employer’s promise is limited not by contract but by law. The employer enters the exchange also knowing that there is a specific, legal limit to its contribution to the pension system. In Ohio, there is no legal means to enforce the unfunded liability of the pension system as against the public employer. State law operates to mitigate/lessen the moral obligation of the public employer to the employee, because all parties enter the employment exchange with notice as to the law. The pension system is responsible for the administration of the plan. Most long-term liabilities have set repayment schedules or, in the case of compensated absences (i.e. sick and vacation leave), are satisfied through paid time-off or termination payments. There is no repayment schedule for the net pension liability. As explained above, changes in pension benefits, contribution rates, and return on investments affect the balance of the net pension liability, but are outside the control of the local government. In the event that contributions, investment returns, and other changes are insufficient to keep up with required pension payments, State statute does not assign/identify the responsible party for the unfunded portion. Due to the unique nature of how the net pension liability is satisfied, this liability is separately identified within the long-term liability section of the statement of net position. In accordance with GASB 68, the School District’s statements prepared on an accrual basis of accounting include an annual pension expense for their proportionate share of each plan’s change in net pension liability not accounted for as deferred inflows/outflows.
8

Springfield City School District Management’s Discussion and Analysis For the Fiscal Year Ended June 30, 2017
Unaudited
With the exception of the pension deferred outflows, there was no significant change to assets of the School District. Liabilities (with the exception of the net pension liability) primarily decreased as a result of the School District refunding long term debt and decreases in accounts payable due to the completion of construction projects. Table 2 shows the changes in Net Position for fiscal years 2017 and 2016.
Table 2Change in Net Position
2017 2016REVENUES:
Program Revenues:Charges for Services 3,163,075$ 3,007,689$ Operating Grants and Contributions 16,673,827 16,370,983 Capital Grants and Contributions - 108,954
Total Program Revenues 19,836,902 19,487,626 General Revenues:
Property Taxes 23,192,592 24,576,457 Grants and Entitlements 78,093,810 72,808,491 Investment Earnings 190,483 230,961 Other 645,704 1,057,731
Total General Revenues 102,122,589 98,673,640
Total Revenues 121,959,491 118,161,266
PROGRAM EXPENSES:Instruction 70,022,750 64,700,727 Support Services:
Pupils and Instructional Staff 15,278,008 13,556,587 Board of Education, Administration
Fiscal and Business 11,880,500 10,455,450 Operation and Maintenance of Plant 8,658,008 8,395,747 Pupil Transportation 2,902,373 2,723,857 Central 4,091,097 2,199,399
Operation of Non-Instructional Services 7,340,430 6,665,390 Extracurricular Activities 1,354,644 1,324,026 Interest and Fiscal Charges 784,016 1,060,057 Depreciation Expense 5,284,118 5,154,810
Total Expenses 127,595,944 116,236,050
Change in Net Position (5,636,453) 1,925,216
Net Position at Beginning of Year 80,016,108 78,090,892 Net Position at End of Year 74,379,655$ 80,016,108$
Program revenues increased as a result of the School District receiving additional grant funding for the expansion of the Pre-School Program. Grants and Entitlements not Restricted to Specific programs increased as a result of the School District receiving $4.8 million more in State funding from the prior year due to the formula provisions in the State biennium budget.
9

Springfield City School District Management’s Discussion and Analysis For the Fiscal Year Ended June 30, 2017
Unaudited
Grants and Entitlements not Restricted to Specific Programs made up $78.1 million or 76.5% of the total general revenues for governmental activities of the School District for fiscal year 2017. Property Tax revenues made up $23.2 million or 22.7% of the total general revenues for governmental activities. Grants not restricted for specific programs and property tax revenues totaled $101.3 million, or 83% of total revenues. The increase in program expenses is a result of the following:
Salaries and benefits expense increased approximately $5 million due to the School District adding staff in an effort to improve student performance and increase the educational options and support services available to students.
Health insurance claim expenses increased approximately $3 million due to increased enrollment and changes in plan coverage elections.
Pension expense increased approximately $5 million due to changes in the net pension liability. The School District’s Funds On a modified accrual basis of accounting, all governmental funds had total revenues and other financing sources of $136.3 million and expenditures and other financing uses of $133.8 million. The net change in fund balances was most significant in the General Fund with an increase of $3.3 million. The increase in the General Fund is a result of receiving additional state revenue and efforts made to keep costs under control. The fund balance for the Building fund had a decrease of $314,156. This fund was used to account for the bond proceeds received in fiscal year 2013 for various capital improvements and building or grounds maintenance. The balance is decreasing as a result of using the fund balance to continue with those improvements and maintenance items. The Building fund had an ending fund balance of $18,443. The fund balance for the Bond Retirement Debt Service Fund had an increase of $188,319 due to savings from refunding long term debt. The Bond Retirement Debt Service Fund had an ending fund balance of $5,661,513. General Fund Budgeting Highlights The School District’s budget is prepared according to Ohio law and is based on accounting for certain transactions on a basis of cash receipts, disbursements, and encumbrances. The most significant budgeted fund is the General Fund. During the course of fiscal year 2017, the School District revised its budget as it attempted to deal with unexpected changes in revenues and expenditures. A variance comparison is presented between the final budgeted amount and the actual amounts. For the General Fund, original and final budget basis revenues were $98.9 million with final actual revenues of $101.1 million for a difference of $2.2 million. The excess of actual revenue over final budgeted revenues is due primarily to an increase in property tax revenue and intergovernmental revenue. Original budget basis appropriations were $98.6 million with final budget basis appropriations of $98.7 million for an increase of $61,657. Actual expenditures were less than budgeted expenditures by $802,141. The primary reason for the decrease is due to the School District closely monitoring expenditures to keep expenditures at or below the budgeted appropriations.
10

Springfield City School District Management’s Discussion and Analysis For the Fiscal Year Ended June 30, 2017
Unaudited
The School District’s ending unobligated cash balance was $3.03 million above the final budgeted amount. Capital Assets and Debt Administration Capital Assets At the end of fiscal year 2017, the School District had $172.9 million invested in land, construction in progress, buildings, furniture and equipment, and vehicles in governmental activities. The primary reason for the decrease from the fiscal year 2016 balance of $174.8 million was current year depreciation exceeding current year additions. (See Note 8 of the Notes to the Basic Financial Statements). Debt At June 30, 2017, the School District had total bonded debt outstanding in the amount of $22 million, which includes $2.3 million of accretion on capital appreciation bonds. $2.5 million of the total bonded debt outstanding is due within one year. The School District also had capital lease obligations outstanding of $456,316 of which $82,003 is due within one year. See Note 13 of the Notes to the Basic Financial Statements for capital lease details and Note 14 for details on the long-term obligations. As of June 30, 2017, the overall legal debt margin was $38,221,341 with an unvoted debt margin of $609,123, and an Energy Conservation debt margin of $4,887,111. Current Financial Issues and Concerns There are three major concerns for fiscal year 2018:
1) There are several variables related to some provisions in the State’s biennium budget that could increase District expenditures in the form of school choice scholarships or vouchers, additional special education costs, school reform initiatives and college credit plus.
2) Renewal of a $6.4 million Emergency Renewal Levy in November 2017 is critical to maintaining the District’s fiscal stability.
3) Continuing to provide the level of services the community expects when federal grant revenues have declined over the past three fiscal years and there is the expectation that at the very least federal grant revenue will remain flat in fiscal year 2018.
Contacting the School District’s Financial Management This financial report is designed to provide our citizens, taxpayers, investors and creditors with a general overview of the School District’s finances and to show the School District’s accountability for the money it receives. If you have questions about this report or need additional financial information, contact the Treasurer’s Office at Springfield City School District, 1500 West Jefferson Street, Springfield, Ohio 45506, or call (937) 505-2811.
11

Springfield City School DistrictStatement of Net Position
June 30, 2017
GovernmentalActivities
Assets:Equity in Pooled Cash, Cash Equivalents and Investments $50,232,869Accounts Receivable 3,326Property Taxes Receivable 32,920,909Intergovernmental Receivable 2,319,098Capital Assets: Land 15,374,624 Construction in Progress 19,965 Depreciable Capital Assets, Net 157,501,782
Total Assets 258,372,573
Deferred Outflows of Resources:Deferred Charge on Refunding 173,281Pension 32,729,692
Total Deferred Outflows of Resources 32,902,973
Liabilities:Accounts Payable 748,525Accrued Wages and Benefits Payable 8,781,831Intergovernmental Payable 1,917,015Accrued Interest Payable 153,821Matured Compensated Absences Payable 16,381Claims Payable 1,153,898Long-Term Liabilities: Due Within One Year 3,883,599 Due in More Than One Year: Net Pension Liability 155,217,169 Other Amounts 25,047,834
Total Liabilities 196,920,073
Deferred Inflows of Resources:Property Taxes 19,880,711Pension 95,107
Total Deferred Inflows of Resources 19,975,818
Net Position:Net Investment in Capital Assets 152,049,477Restricted for: Debt Service 3,811,657 Capital Improvements 3,038,508 Food Service Operations 2,079,807 Classroom Facilities Maintenance 2,628,972 Auxiliary Services 10,392 Title Programs 586,189 Other Purposes 980,721Unrestricted (90,806,068)
Total Net Position $74,379,655
See accompanying notes to the basic financial statements12

Springfield City School DistrictStatement of Activities
For the Fiscal Year Ended June 30, 2017
Net (Expense)Revenue and Changes
in Net Position
OperatingGrants,
Charges for Contributions, GovernmentalExpenses Services and Interest Activities
Governmental Activities:Instruction: Regular 36,303,389$ 1,491,595$ 64,427$ (34,747,367)$ Special 16,967,107 545 4,414,412 (12,552,150) Vocational 368,300 - - (368,300) Adult/Continuing 121,459 - 66,521 (54,938) Student Intervention Services 16,262,495 - 1,154,900 (15,107,595) Support Services: Pupils 9,420,341 - 740,920 (8,679,421) Instructional Staff 5,857,667 - 2,926,217 (2,931,450) Board of Education 258,826 - - (258,826) Administration 9,319,267 - 645,881 (8,673,386) Fiscal 2,114,845 - 24,090 (2,090,755) Business 187,562 - - (187,562) Operation and Maintenance of Plant 8,658,008 - 317,735 (8,340,273) Pupil Transportation 2,902,373 74,545 - (2,827,828) Central 4,091,097 - 104,886 (3,986,211) Operation of Non-Instructional Services 7,340,430 1,065,121 6,213,838 (61,471) Extracurricular Activities 1,354,644 531,269 - (823,375) Interest and Fiscal Charges 784,016 - - (784,016) Unallocated Depreciation * 5,284,118 - - (5,284,118)
Total Governmental Activities 127,595,944$ 3,163,075$ 16,673,827$ (107,759,042)
General Revenues:Property Taxes Levied for:
General Purposes 19,686,341Debt Service 2,606,580Capital Outlay 665,801Facilities Maintenance 233,870
Operating Grants and Entitlements not Restricted to Specific Programs 78,093,810Investment Earnings 190,483Miscellaneous 645,704
Total General Revenues 102,122,589
Change in Net Position (5,636,453)
Net Position at Beginning of Year 80,016,108
Net Position at End of Year $74,379,655
* This amount excludes the depreciation that is included in the direct expenses of the various programs.
See accompanying notes to the basic financial statements
Program Revenues
13

Springfield City School DistrictBalance Sheet
Governmental FundsJune 30, 2017
Nonmajor TotalBond Building Governmental Governmental
General Retirement Fund Funds Funds
Assets:Equity in Pooled Cash, Cash Equivalents and Investments 33,485,068$ 5,222,469$ 18,443$ 9,422,224$ 48,148,204$ Receivables: Property Taxes 28,296,688 3,365,525 - 1,258,696 32,920,909 Accounts 862 - - - 862 Intergovernmental 29,880 - - 2,289,218 2,319,098 Interfund 847,000 - - - 847,000
Total Assets 62,659,498$ 8,587,994$ 18,443$ 12,970,138$ 84,236,073$
Liabilities:Accounts Payable 397,026$ -$ -$ 212,049$ 609,075$ Accrued Wages and Benefits Payable 7,920,522 - - 857,161 8,777,683 Intergovernmental Payable 1,657,408 - - 259,607 1,917,015 Interfund Payable - - - 847,000 847,000 Matured Compensated Absences Payable 16,381 - - - 16,381
Total Liabilities 9,991,337 - - 2,175,817 12,167,154
Deferred Inflows of Resources:Unavailable Revenue 6,677,483 596,392 - 1,775,179 9,049,054 Property Taxes Not Levied for Current Year 16,704,012 2,330,089 - 846,610 19,880,711
Total Deferred Inflows of Resources 23,381,495 2,926,481 - 2,621,789 28,929,765
Fund Balances:Restricted - 5,661,513 18,443 8,195,138 13,875,094 Committed 11,000 - - 93,337 104,337 Assigned 1,309,480 - - - 1,309,480 Unassigned (Deficit) 27,966,186 - - (115,943) 27,850,243
Total Fund Balances 29,286,666 5,661,513 18,443 8,172,532 43,139,154
Total Liabilities, Deferred Inflows of Resources and Fund Balances 62,659,498$ 8,587,994$ 18,443$ 12,970,138$ 84,236,073$
See accompanying notes to the basic financial statements
14

Springfield City School DistrictReconciliation of Total Governmental Fund Balances to
Net Position of Governmental ActivitiesJune 30, 2017
Total Governmental Fund Balances $43,139,154
Amounts reported for governmental activities in the Statement of Net Position are different because:
Capital assets used in governmental activities are not financial resources and therefore are not reported in the funds. These assets consist of:
Land 15,374,624Construction in Progress 19,965Other Capital Assets 230,661,182Accumulated Depreciation (73,159,400)
Total Capital Assets 172,896,371
Some of the School District's revenues will be collected after fiscal year-end, but are not available soon enough to pay for the current period's expenditures and therefore are reported as deferred inflows in the funds.
Property Taxes 7,511,229Intergovernmental 1,537,825
9,049,054
The Internal Service Fund is used by management to charge the costs ofinsurance to individual funds. The assets and liabilities of the Internal ServiceFund are included in governmental activities in the Statement of Net Position. 789,633
In the Statement of Activities, interest is accrued on outstanding bonds, whereas in governmental funds, an interest expenditure is recorded when due. (153,821)
Some liabilities and miscellaneous deferred outflows of resources are not due and payable in the current period and therefore are not reported in the funds. Those liabilities consist of:
Bonds Payable (19,104,095)Energy Conservation Notes (595,000)Deferred Charge on Refunding 173,281Accretion on Capital Appreciation Bonds (2,292,427)Premium on Bonds (864,764)Capital Leases (456,316)Compensated Absences (5,618,831)
Total Liabilities (28,758,152)
The net pension liability is not due and payable in the current period; therefore,the liability and related deferred inflows/outflows are not reported in thegovernmental funds:
Deferred Outflows - Pension 32,729,692Deferred Inflows - Pension (95,107)Net Pension Liability (155,217,169)
(122,582,584)
Net Position of Governmental Activities $74,379,655
See accompanying notes to the basic financial statements
15

Springfield City School DistrictStatement of Revenues, Expenditures and Changes in Fund Balances
Governmental FundsFor the Fiscal Year Ended June 30, 2017
Nonmajor TotalBond Building Governmental Governmental
General Retirement Fund Funds Funds
Revenues:Property Taxes 19,798,105$ 2,627,323$ -$ 903,206$ 23,328,634$ Intergovernmental 77,415,894 486,286 - 16,370,117 94,272,297 Investment Earnings 156,770 - 1 33,712 190,483 Tuition and Fees 1,534,003 - - 373,513 1,907,516 Extracurricular Activities 154,474 - - 376,795 531,269 Rentals 168,187 - - - 168,187 Charges for Services 32,137 - - 692,153 724,290 Contributions and Donations 28,714 - - 30,255 58,969 Miscellaneous 308,509 - - 54,773 363,282
Total Revenues 99,596,793 3,113,609 1 18,834,524 121,544,927
Expenditures:Current: Instruction: Regular 32,708,418 - - 117,733 32,826,151 Special 11,299,779 - - 4,207,829 15,507,608 Vocational 368,300 - - - 368,300 Adult/Continuing 49,488 - - 64,529 114,017 Student Intervention Services 297,467 - - 993,204 1,290,671 Other 14,618,977 - - 168,122 14,787,099 Support Services: Pupils 7,950,112 - - 732,189 8,682,301 Instructional Staff 2,500,358 - 1,294 2,869,678 5,371,330 Board of Education 257,123 - - - 257,123 Administration 7,525,656 - - 622,723 8,148,379 Fiscal 2,002,116 75,828 - 339,558 2,417,502 Business 170,442 - - - 170,442 Operation and Maintenance of Plant 7,775,927 - - 554,807 8,330,734 Pupil Transportation 2,427,518 - - 240,596 2,668,114 Central 3,594,146 - - 296,015 3,890,161 Operation of Non-Instructional Services 471,194 - - 6,931,713 7,402,907 Extracurricular Activities 786,089 - - 524,527 1,310,616 Capital Outlay 111,683 - 312,863 2,544,419 2,968,965 Debt Service: Principal Retirement 147,608 2,350,000 - - 2,497,608 Interest and Fiscal Charges 50,615 499,462 - - 550,077 Issuance Costs - 167,818 - - 167,818
Total Expenditures 95,113,016 3,093,108 314,157 21,207,642 119,727,923
Excess of Revenues Over (Under) Expenditures 4,483,777 20,501 (314,156) (2,373,118) 1,817,004
Other Financing Sources (Uses):Proceeds from Sale of Capital Assets 47,265 - - - 47,265 Premium on Bonds Issued - 800,859 - - 800,859 Refunding Bonds Issued 11,675,000 - - 11,675,000 Payment to Refunding Bond Escrow Agent - (12,308,041) - - (12,308,041) Inception of Capital Lease 489,449 - - - 489,449 Transfers In - - - 1,730,000 1,730,000 Transfers Out (1,730,000) - - - (1,730,000)
Total Other Financing Sources (Uses) (1,193,286) 167,818 - 1,730,000 704,532
Net Change in Fund Balances 3,290,491 188,319 (314,156) (643,118) 2,521,536
Fund Balances at Beginning of Year 25,996,175 5,473,194 332,599 8,815,650 40,617,618
Fund Balances at End of Year 29,286,666$ 5,661,513$ 18,443$ 8,172,532$ 43,139,154$
See accompanying notes to the basic financial statements16

Springfield City School DistrictReconciliation of the Statement of Revenues, Expenditures
and Changes in Fund Balances of Governmental Fundsto the Statement of Activities
For the Fiscal Year Ended June 30, 2017
Net Change in Fund Balances - Total Governmental Funds $2,521,536
Amounts reported for governmental activities in the Statement of Activities are different because:
Capital outlays are reported as expenditures in governmental funds. However, in the Statement of Activities, the cost of capital assets is allocated over their estimated useful lives as depreciation expense. In the current period, these amounts are:
Capital Assets Additions 4,607,917Depreciation Expense (6,391,181)
Excess of Depreciation Expense over Capital Outlay (1,783,264)
The proceeds from the sale of capital assets are reported as revenue in the governmental funds. However, the cost of capital assets is removed from the capital assets account in the Statement of Net Position and offset against the proceeds from the sale of capital assets resulting in a loss on the sale of capital assets in the Statement of Activities.
Loss on Disposal of Capital Assets (157,531)Gain on Disposal of Leased Assets 165,568
8,037Because some revenues will not be collected for several months after the School District's fiscal year end, they are not considered "available" revenues and are reported as deferred inflows in the governmental funds.
Delinquent Property Taxes (136,042)Intergovernmental 495,339
359,297Repayment of long-term debt is reported as an expenditure in governmental funds, but the repayment reduces long-term liabilities in the Statement of Net Position. In the current fiscal year, these amounts consist of:
Payment to Refunding Bond Escrow Agent 12,308,041Principal Retirement 2,415,000Capital Lease Payments 82,608
Total Long-Term Debt Repayment 14,805,649
Debt proceeds are reported as other financing sources in governmental funds and thus contribute to the change in fund balances. In the government-wide statements, however, issuing debt increases long-term liabilities in the Statement of Net Position and does not affect the Statement of Activities.
Inception of Capital Lease (489,449)Refunding Bonds Issued (11,675,000)Refunding Bond Premium (800,859)
(12,965,308)Accretion and amortization of bond premium, the deferred loss on refunding of debt, as well as accrued interest payable on the bonds are not reported in the funds, but is allocated as an expense over the life of the debt in the Statement of Activities.
Amortization of Bond Premium 121,297Amortization of Deferred Charge on Refunding (79,146)Accretion on Bonds (178,349)Decrease in Accrued Interest 70,077
(66,121)Contractually required contributions are reported as expenditures in governmental funds;
however, the statement of activities reports these amount as deferred outflows 7,754,552
Except for amounts reported as deferred inflows/outflows, changes in the net pension liabilityare reported as pension expense in the statement of activities (13,525,263)
The Internal Service Fund used by management to charge the cost of insurance toindividual funds is reported in the entity-wide Statement of Activities. (2,382,998)
Some items reported in the Statement of Activities do not require the use of current financial resources and therefore are not reported as expenditures in governmental funds. These activities consist of:
Increase in Compensated Absences Payable (362,570)
Change in Net Position of Governmental Activities ($5,636,453)
See accompanying notes to the basic financial statements
17

Original Budget Final Budget ActualVariance with Final
BudgetREVENUES:Property and Other Local Taxes 19,907,341$ 19,907,341$ 20,764,221$ 856,880$ Intergovernmental 76,619,864 76,619,864 77,392,999 773,135Interest 45,000 45,000 448,885 403,885Tuition and Fees 1,259,345 1,259,345 1,534,003 274,658Rent 27,000 27,000 168,187 141,187Extracurricular Activities - - 1,005 1,005Customer Sales and Services - - 32,137 32,137Miscellaneous 851,500 851,500 512,760 (338,740)
Total Revenues 98,710,050 98,710,050 100,854,197 2,144,147
EXPENDITURES:Current: Instruction: Regular 33,498,170 32,679,790 32,852,473 (172,683) Special 10,405,982 10,947,409 11,266,023 (318,614) Vocational 417,203 417,203 408,850 8,353 Adult/Continuing 32,170 52,136 49,617 2,519 Student Intervention Services 349,092 363,873 301,994 61,879 Other 15,782,541 14,599,192 14,686,323 (87,131) Support Services: Pupils 8,258,722 8,332,863 8,183,827 149,036 Instructional Staff 2,243,792 2,319,239 2,467,783 (148,544) Board of Education 239,257 509,257 260,141 249,116 Administration 7,772,933 7,788,705 7,533,329 255,376 Fiscal 1,465,391 1,601,684 1,541,113 60,571 Business 312,853 312,329 196,330 115,999 Operation and Maintenance of Plant 8,466,669 8,542,350 8,133,175 409,175 Pupil Transportation 2,591,793 2,449,721 2,434,511 15,210 Central 3,298,162 4,159,483 4,103,875 55,608 Operation of Non-Instructional/Shared Services: Community Services 346,282 361,339 497,093 (135,754) Extracurricular Activities: Academic Oriented Activities 63,276 64,581 54,611 9,970 Occupation Oriented Activities 209,567 183,619 178,316 5,303 Sport Oriented Activities 560,877 560,881 492,466 68,415Capital Outlay: Site Improvement Services - 19,550 19,550 - Building Improvement Services 350,953 211,259 211,259 - Debt Service: Principal 65,000 65,000 65,000 - Interest 36,144 37,023 37,023 -
Total Expenditures 96,766,829 96,578,486 95,974,682 603,804
Excess of Revenues Over (Under) Expenditures 1,943,221 2,131,564 4,879,515 2,747,951
OTHER FINANCING SOURCES AND USES:Advances In 128,000 128,000 13,500 (114,500)Proceeds from Sale of Capital Assets - - 48,773 48,773Insurance Recoveries 3,000 3,000 - (3,000)Refund of Prior Year Expenditures 65,000 65,000 217,937 152,937Transfers Out (1,730,000) (1,730,000) (1,730,000) - Advances Out (128,000) (128,000) - 128,000Refund of Prior Year Receipts - (250,000) (179,663) 70,337
Total Other Financing Sources and Uses (1,662,000) (1,912,000) (1,629,453) 282,547
Net Change in Fund Balances 281,221 219,564 3,250,062 3,030,498
Fund Balance (Deficit) at Beginning of Year 27,143,288 27,143,288 27,143,288 -
Prior Year Encumbrances Appropriated 1,510,210 1,510,210 1,510,210 -
Fund Balance (Deficit) at End of Year 28,934,719$ 28,873,062$ 31,903,560$ 3,030,498$
See accompanying notes to the basic financial statements
Springfield City SchoolsStatement of Revenues, Expenditures and Changes
In Fund Balance - Budget (Non-GAAP Basis) and ActualGeneral Fund
For the Fiscal Year Ended June 30, 2017
18
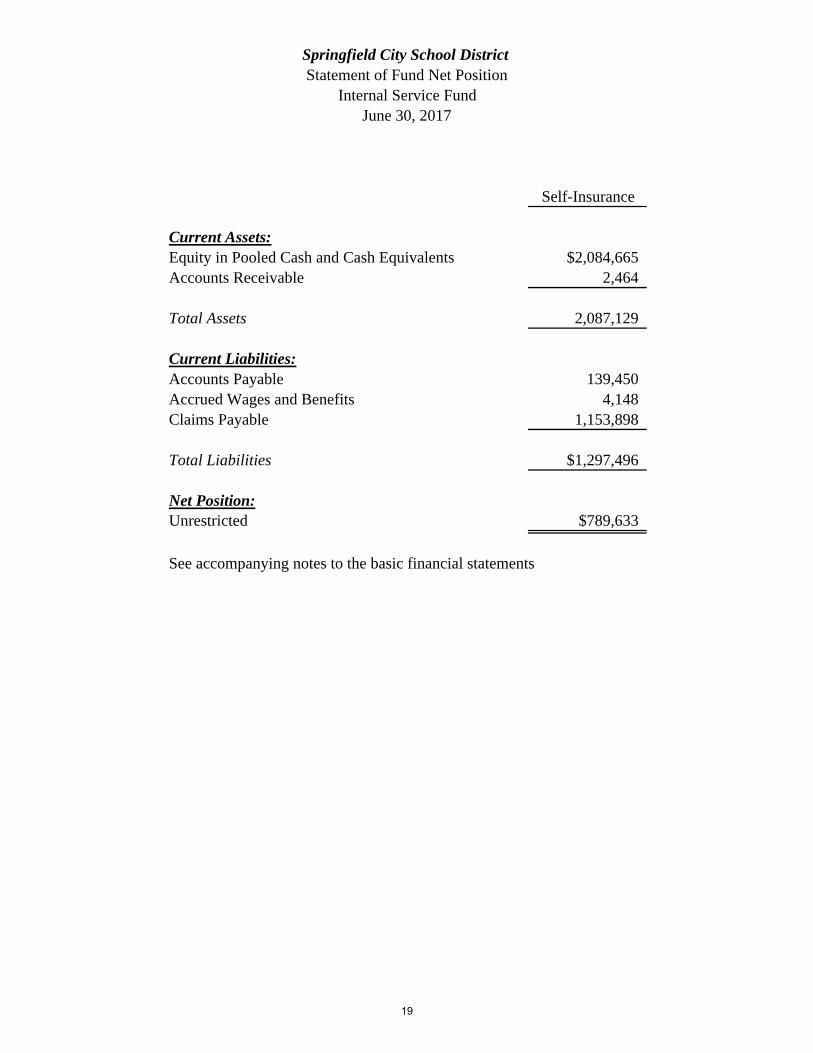
Self-Insurance
Current Assets:Equity in Pooled Cash and Cash Equivalents $2,084,665Accounts Receivable 2,464
Total Assets 2,087,129
Current Liabilities:Accounts Payable 139,450Accrued Wages and Benefits 4,148Claims Payable 1,153,898
Total Liabilities $1,297,496
Net Position:Unrestricted $789,633
See accompanying notes to the basic financial statements
Springfield City School DistrictStatement of Fund Net Position
Internal Service FundJune 30, 2017
19

Self-InsuranceOperating Revenues: Charges for Services $14,397,295 Other 681,848
Total Operating Revenues 15,079,143
Operating Expenses: Salaries 20,090 Fringe Benefits 14,818 Purchased Services 210,608 Claims 17,234,578
Total Operating Expenses 17,480,094
Operating Loss (2,400,951)
Non-Operating Revenues: Investment Earnings 17,953
Change in Net Position (2,382,998)
Net Position at Beginning of Year 3,172,631
Net Position at End of Year $789,633
See accompanying notes to the basic financial statements
Springfield City School DistrictStatement of Revenues, Expensesand Changes in Fund Net Position
Internal Service FundFor the Fiscal Year Ended June 30, 2017
20

Self-InsuranceIncrease (Decrease) in Cash and Cash Equivalents:Cash Flows From Operating Activities:Receipts from Interfund Services Provided $14,397,295Receipts from Other Sources 681,649Cash Payments to Suppliers for Goods and Services (73,348)Cash Payments to Employees for Services (18,273)Cash Payments for Employee Benefits (14,181)Cash Payments for Claims (17,060,895)
Net Cash Used by Operating Activities (2,087,753)
Cash Flows From Investing Activities:Investment Earnings 17,953
Decrease in Cash and Cash Equivalents (2,069,800)
Cash and Cash Equivalents at Beginning of Year 4,154,465
Cash and Cash Equivalents at End of Year $2,084,665
Reconciliation of Operating Loss to Net Cash Used by Operating Activities:
Operating Loss ($2,400,951)
Adjustments to Reconcile Operating Loss toNet Cash Used by Operating Activities:
Changes in Assets and Liabilities: Increase in Accounts Receivable (199) Increase in Accounts Payable 137,897 Increase in Accrued Wages and Benefits 1,817
Increase in Claims Payable 173,683
Net Cash Used by Operating Activities ($2,087,753)
See accompanying notes to the basic financial statements
Springfield City School DistrictStatement of Cash Flows
Internal Service FundFor the Fiscal Year Ended June 30, 2017
21

Springfield City School DistrictStatement of Fiduciary Net Position
Fiduciary FundsJune 30, 2017
PrivatePurpose Trust Agency
Assets:
Equity in Pooled Cash and Cash Equivalents 77,362$ 1,246,995$
Total Assets 77,362 1,246,995
Liabilities:Due to Students - 76,977 Due to Other Governments - 1,170,018
Total Liabilities - 1,246,995$
Net Position:Restricted - Nonexpendable 10,000 Held in Trust for Scholarships 67,362
Total Net Position 77,362$
See accompanying notes to the basic financial statements
22

Springfield City School DistrictStatement of Changes in Fiduciary Net Position
Fiduciary FundsFor the Fiscal Year Ended June 30, 2017
PrivatePurpose Trust
Additions:Investment Earnings $546Contributions and Donations 9,630Miscellaneous 1,703
Total Additions 11,879
Deductions:Payment in Accordance with Trust Agreements 2,679
Change in Net Position 9,200
Net Position at Beginning of Year 68,162
Net Position at End of Year $77,362
See accompanying notes to the basic financial statements
23

Springfield City School District Notes to the Basic Financial Statements For the Fiscal Year Ended June 30, 2017
NOTE 1 - DESCRIPTION OF THE SCHOOL DISTRICT AND REPORTING ENTITY Springfield City School District (the "School District") is organized under Article VI, Sections 2 and 3 of the Constitution of the State of Ohio. The School District operates under a locally-elected Board form of government consisting of five members elected at-large for staggered four-year terms. The first official body designated as the Springfield Board of Education was formed on April 28, 1855. The School District provides educational services as authorized by State statute and federal guidelines. The Board controls the School District’s 18 instructional/support facilities staffed by 333 non-certificated employees, 616 certificated full-time teaching personnel and 96 administrative employees who provide services to 7,946 students and other community members. Reporting Entity A reporting entity is comprised of the primary government, component units, and other organizations that are included to ensure that the financial statements are not misleading. The primary government of the School District consists of all funds, departments, boards, and agencies that are not legally separate from the School District. For Springfield City School District, this includes general operations, food service, and student related activities of the School District. Component units are legally separate organizations for which the School District is financially accountable. The School District is financially accountable for an organization if the School District appoints a voting majority of the organization’s governing board and (1) the School District is able to significantly influence the programs or services performed or provided by the organization; or (2) the School District is legally entitled to or can otherwise access the organization’s resources; the School District is legally obligated or has otherwise assumed the responsibility to finance the deficits of, or provide financial support to, the organization; or the School District is obligated for the debt of the organization. Component units may also include organizations that are fiscally dependent on the School District in that the School District approves the budget, the issuance of debt, or the levying of taxes. The School District has no component units. The following activities are included within the reporting entity:
Parochial Schools - Within the School District boundaries, Catholic Central, Catholic Central Lagonda Elementary, Central Catholic Limestone Elementary, Springfield Christian and Nightingale Montessori School are operated as private schools. Current State legislation provides funding to these parochial schools. These monies are received and disbursed on behalf of the parochial schools by the Treasurer of the School District, as directed by the parochial schools. This activity is reflected in a nonmajor special revenue fund for financial reporting purposes.
The School District participates in three jointly governed organizations and two insurance purchasing pools. These organizations are the Clark County Family and Children First Council, the Southwestern Ohio Educational Purchasing Council, the Springfield-Clark Career Technology Center, the Ohio SchoolComp Group Retrospective Rating Program and the Ohio School Plan. These organizations are presented in Notes 16 and 17 to the basic financial statements.
24

Springfield City School District Notes to the Basic Financial Statements For the Fiscal Year Ended June 30, 2017
NOTE 2 - SUMMARY OF SIGNIFICANT ACCOUNTING POLICIES The financial statements of the Springfield City School District have been prepared in conformity with generally accepted accounting principles (GAAP) as applied to governmental units. The Governmental Accounting Standards Board (GASB) is the accepted standards-setting body for establishing governmental accounting and financial reporting principles. The more significant of the School District’s accounting policies are described below. Basis of Presentation The School District’s basic financial statements consist of government-wide statements, including a Statement of Net Position and a Statement of Activities, and fund financial statements which provide a more detailed level of financial information. Government-wide Financial Statements The Statement of Net Position and the Statement of Activities display information about the School District as a whole. These statements include the financial activities of the primary government, except for fiduciary funds. The activity of the Internal Service Fund is eliminated to avoid “doubling up” revenues and expenses. The government-wide financial statements usually distinguish between activities that are governmental and those that are considered business-type. The School District, however, has no activities which are reported as business-type. The Statement of Net Position presents the financial condition of the governmental activities of the School District at fiscal year-end. The Statement of Activities presents a comparison between direct expenses and program revenues for each program or function of the School District’s governmental activities. Direct expenses are those that are specifically associated with a service, program or department and are therefore clearly identifiable to a particular function. Program revenues include charges paid by the recipient of the goods or services offered by the program, grants and contributions that are restricted to meeting the operational or capital requirements of a particular program, and interest earned on grants that is required to be used to support a particular program. Revenues which are not classified as program revenues are presented as general revenues of the School District with certain limited exceptions. The comparison of direct expenses with program revenues identifies the extent to which each governmental function is self-financing or draws from the general revenues of the School District. Fund Financial Statements During the fiscal year, the School District segregates transactions related to certain School District functions or activities in separate funds in order to aid financial management and to demonstrate legal compliance. Fund financial statements are designed to present financial information of the School District at this more detailed level. The focus of governmental fund financial statements is on major funds rather than reporting by type. Each major fund is presented in a separate column. Nonmajor funds are aggregated and presented in a single column. The Internal Service Fund is presented in a single column on the face of the proprietary fund statements. Fiduciary funds are reported by type.
25

Springfield City School District Notes to the Basic Financial Statements For the Fiscal Year Ended June 30, 2017
NOTE 2 - SUMMARY OF SIGNIFICANT ACCOUNTING POLICIES (continued) Fund Accounting The School District uses funds to maintain its financial records during the fiscal year. A fund is defined as a fiscal and accounting entity with a self-balancing set of accounts. All funds of the School District fall within three categories: governmental, proprietary and fiduciary. Governmental Funds Governmental funds are those through which most governmental functions of the School District typically are financed. Governmental fund reporting focuses on the sources, uses and balances of current financial resources. Expendable assets are assigned to the various governmental funds according to the purposes for which they may or must be used. Current liabilities are assigned to the fund from which they will be paid. The difference between governmental fund assets compared with liabilities and deferred inflows of resources is reported as fund balance. The following are the School District’s major governmental funds:
General Fund - The General Fund is the operating fund of the School District and is used to account for and report all financial resources not accounted for in another fund. The General Fund balance is available to the School District for any purpose provided it is expended or transferred according to the general laws of Ohio.
Bond Retirement Fund - The Bond Retirement Debt Service Fund is used to account for and report restricted financial resources, including property taxes, for the repayment of principal, interest and related costs of general long-term obligations.
Building Fund – The Building Fund is used to account for and report restricted proceeds from the sale of bonds, notes or certificates of indebtedness, except premiums and accrued interest, paid into this fund. Expenditures recorded in this fund represent costs of acquiring capital facilities as well as the costs of renovating, improving, refurbishing and maintaining existing school facilities.
The other governmental funds of the School District account for grants and other resources whose use is restricted or committed to a particular purpose. Proprietary Fund Proprietary fund reporting focuses on the determination of operating income, changes in net position, financial position and cash flows. Proprietary funds are classified as enterprise or internal service; the School District has no enterprise funds.
Self-Insurance Fund - The Self-Insurance Internal Service Fund is used to account for medical and dental benefits provided to employees.
26

Springfield City School District Notes to the Basic Financial Statements For the Fiscal Year Ended June 30, 2017
NOTE 2 - SUMMARY OF SIGNIFICANT ACCOUNTING POLICIES (continued) Fiduciary Funds Fiduciary fund reporting focuses on net position and changes in net position. The fiduciary fund category is split into four classifications: pension trust funds, investment trust funds, private purpose trust funds and agency funds. Trust funds are used to account for assets held by the School District under a trust agreement for individuals, private organizations, or other governments and are therefore not available to support the School District’s own programs. Agency funds are custodial in nature (assets equal liabilities) and do not involve measurement of results of operations. The School District has two private purpose trust funds. Both funds provide scholarships to its students, one from donations and the other from an endowment. The School District also has two agency funds, one is used to account for student activity programs which consist of a student body, student president, student treasurer, and faculty advisor and the second is used to account for worker’s compensation payments. Measurement Focus Government-wide Financial Statements The government-wide financial statements are prepared using the economic resources measurement focus. All assets, deferred outflows, liabilities and deferred inflows associated with the operation of the School District are included on the Statement of Net Position. The Statement of Activities presents increases (e.g., revenues) and decreases (e.g., expenses) in total net position. Fund Financial Statements All governmental funds are accounted for using a flow of current financial resources measurement focus. With this measurement focus, only current assets, deferred outflows, current liabilities and deferred inflows generally are included on the Balance Sheet. The Statement of Revenues, Expenditures and Changes in Fund Balances reports on the sources (i.e., revenues and other financing sources) and uses (i.e., expenditures and other financing uses) of current financial resources. This approach differs from the manner in which the governmental activities of the government-wide financial statements are prepared. Governmental fund financial statements therefore include a reconciliation with brief explanations to better identify the relationship between the government-wide statements and the statements for governmental funds. Like the government-wide statements, the Internal Service Fund is accounted for on a flow of economic resources measurement focus. All assets and all liabilities associated with the operation of these funds are included on the Statement of Fund Net Position. The Statement of Revenues, Expenses and Changes in Fund Net Position presents increases (e.g., revenues) and decreases (e.g., expenses) in total net position. The Statement of Cash Flows provides information about how the School District finances and meets the cash flow needs of its internal service activities. The private purpose trust funds are reported using the economic resources measurement focus.
27

Springfield City School District Notes to the Basic Financial Statements For the Fiscal Year Ended June 30, 2017
NOTE 2 - SUMMARY OF SIGNIFICANT ACCOUNTING POLICIES (continued) Basis of Accounting Basis of accounting determines when transactions are recorded in the financial records and reported on the financial statements. Government-wide financial statements and the financial statements of the proprietary and fiduciary funds are prepared using the accrual basis of accounting. Governmental funds use the modified accrual basis of accounting. Differences in the accrual and the modified accrual basis of accounting arise in the recognition of revenue, the recording of deferred inflows of resources, and in the presentation of expenses versus expenditures. Revenues - Exchange and Non-exchange Transactions Revenue resulting from exchange transactions, in which each party gives and receives essentially equal value, is recorded on the accrual basis when the exchange takes place. On a modified accrual basis, revenue is recorded in the fiscal year in which the resources are measurable and become available. “Measurable” means that the amount of the transaction can be determined, and “available” means that the resources are collectible within the current fiscal year, or are expected to be collected soon enough thereafter to be used to pay liabilities of the current fiscal year. For the School District, available means expected to be received within 60 days of fiscal year-end. Non-exchange transactions, in which the School District receives value without directly giving equal value in return, include property taxes, grants, entitlements and donations. On an accrual basis, revenue from property taxes is recognized in the fiscal year for which the taxes are levied (See Note 6). Revenue from grants, entitlements and donations is recognized in the fiscal year in which all eligibility requirements have been satisfied. Eligibility requirements include timing requirements, which specify the fiscal year when the resources are required to be used or the fiscal year when use is first permitted; matching requirements, in which the School District must provide local resources to be used for a specified purpose; and expenditure requirements, in which the resources are provided to the School District on a reimbursement basis. On a modified accrual basis, revenue from non-exchange transactions must also be available before it can be recognized. Under the modified accrual basis, the following revenue sources are considered to be both measurable and available at fiscal year-end: property taxes available for advance, tuition and fees and grants. Deferred Outflows/Inflows of Resources In addition to assets, the statements of Net Position will sometimes report a separate section for deferred outflows of resources. Deferred outflows of resources, represents a consumption of net position that applies to a future period and will not be recognized as an outflow of resources (expense/expenditure) until then. For the School District, deferred outflows of resources are reported on the government-wide statement of net position for deferred charges on refunding and for pension. A deferred charge on refunding results from the difference in the carrying value of refunded debt and its reacquisition price. This amount is deferred and amortized over the shorter of the life of the refunded or refunding debt. The deferred outflows of resources related to pension are explained in Note 10.
28

Springfield City School District Notes to the Basic Financial Statements For the Fiscal Year Ended June 30, 2017
NOTE 2 - SUMMARY OF SIGNIFICANT ACCOUNTING POLICIES (continued) In addition to liabilities, the statements of Net Position report a separate section for deferred inflows of resources. Deferred inflows of resources represent an acquisition of net position that applies to a future period and will not be recognized as an inflow of resources (revenue) until that time. For the School District, deferred inflows of resources include property taxes, pension and unavailable revenue. Property taxes represent amounts for which there is an enforceable legal claim as of June 30, 2017, but which were levied to finance fiscal year 2018 operations. These amounts have been recorded as deferred inflow on both the government-wide statement of net position and the governmental fund financial statements. Unavailable revenue is reported only on the governmental funds balance sheet, and represents receivables which will not be collected within the available period. For the School District, unavailable revenue includes delinquent property taxes and intergovernmental grants. These amounts are deferred and recognized as an inflow of the resources in the period the amounts become available. Deferred inflows of resources related to pension are reported on the government-wide statement of net position. (See Note 10) Pensions For purposes of measuring the net pension liability, deferred outflows of resources and deferred inflows of resources related to pensions, and pension expense, information about the fiduciary net position of the pension plans and additions to/deductions from their fiduciary net position have been determined on the same basis as they are reported by the pension systems. For this purpose, benefit payments (including refunds of employee contributions) are recognized when due and payable in accordance with the benefit terms. The pension systems report investments at fair value. Expenses/Expenditures On the accrual basis of accounting, expenses are recognized at the time they are incurred. The measurement focus of governmental fund accounting is on decreases in net financial resources (expenditures) rather than expenses. Expenditures are generally recognized in the accounting period in which the related fund liability is incurred, if measurable. Allocations of cost, such as depreciation and amortization, are not recognized in the governmental funds. Cash and Cash Equivalents To improve cash management, all cash received by the School District is pooled. Monies for all funds are maintained in this pool. Individual fund integrity is maintained through the School District’s records. Interest in the pool is presented as “Equity in Pooled Cash and Cash Equivalents and Investments” on the financial statements. During fiscal year 2017, the School District’s investments were limited to STAROhio, negotiable certificates of deposit, US Treasuries and money market mutual funds. Investments in negotiable certificates of deposit, US Treasuries and money market mutual funds are reported at fair value which is based on quoted market prices or current share prices.
29

Springfield City School District Notes to the Basic Financial Statements For the Fiscal Year Ended June 30, 2017
NOTE 2 - SUMMARY OF SIGNIFICANT ACCOUNTING POLICIES (continued) During fiscal year 2017, the School District invested in STAR Ohio. STAR Ohio (the State Treasury Asset Reserve of Ohio), is an investment pool managed by the State Treasurer’s Office which allows governments within the State to pool their funds for investment purposes. STAR Ohio is not registered with the SEC as an investment company, but has adopted Governmental Accounting Standards Board (GASB), Statement No. 79, “Certain External Investment Pools and Pool Participants.” The School District measures their investment in STAR Ohio at the net asset value (NAV) per share provided by STAR Ohio. The NAV per share is calculated on an amortized cost basis that provides an NAV per share that approximates fair value. For the fiscal year 2017, there were no limitations or restrictions on any participant withdrawals due to redemption notice periods, liquidity fees, or redemption gates. However, notice must be given 24 hours in advance of all deposits and withdrawals exceeding $25 million. STAR Ohio reserves the right to limit the transaction to $50 million, requiring the excess amount to be transacted the following business day(s), but only to the $50 million limit. All accounts of the participant will be combined for these purposes. Following Ohio statutes, the Board of Education has, by resolution, specified the funds to receive an allocation of interest earnings. Investment earnings credited to the General Fund during fiscal year 2017 amounted to $156,770 of which $35,287 was earned by other funds. Investments of the cash management pool and investments with an original maturity of three months or less at the time they are purchased by the School District are presented on the financial statements as cash and cash equivalents. Additional information regarding the fair value measurement of investments is disclosed in Note 5. Capital Assets The School District’s only capital assets are general capital assets. General capital assets are those assets specifically related to governmental activities. General capital assets generally result from expenditures in the governmental funds. These assets are reported in the government-wide Statement of Net Position but are not reported in the fund financial statements. Capital assets are capitalized at cost (or estimated historical cost, which is determined by indexing the current replacement cost back to the year of acquisition) and updated for additions and retirements during the fiscal year. Donated capital assets are recorded at their acquisition value. The School District maintains a capitalization threshold of $2,500. The School District does not possess any infrastructure. Improvements are capitalized; the costs of normal maintenance and repairs that do not add to the value of the asset or materially extend an asset’s life are not capitalized. All reported capital assets, except land and construction in progress are depreciated. Improvements are depreciated over the remaining useful lives of the related capital assets. Depreciation is computed using the straight-line method over the following useful lives:
Description Estimated Lives
Buildings 40 yearsFurniture and Equipment 7 - 20 yearsVehicles 7 years
30
Springfield City School District Notes to the Basic Financial Statements For the Fiscal Year Ended June 30, 2017
NOTE 2 - SUMMARY OF SIGNIFICANT ACCOUNTING POLICIES (continued)
Interfund Balances On fund financial statements, receivables and payables resulting from short-term interfund loans are classified as “Interfund Receivable” and “Interfund Payable”. These amounts are eliminated in the governmental activities column of the Statement of Net Position. Compensated Absences Vacation benefits are accrued as a liability as the benefits are earned if the employees’ rights to receive compensation are attributable to services already rendered and it is probable that the School District will compensate the employees for the benefits through paid time off or some other means. The School District records a liability for accumulated unused vacation time when earned for all employees with more than one year of service. Sick leave benefits are accrued as a liability using the termination method. An accrual for earned sick leave is made to the extent it is probable that benefits will result in termination payments. The liability is an estimate based on the School District’s past experience of making termination payments. The entire compensated absences liability is reported on the government-wide financial statements. On the governmental fund financial statements, compensated absences are recognized as liabilities and expenditures to the extent payments come due each period upon the occurrence of employee resignations and retirements. These amounts are recorded in the account “Matured Compensated Absences Payable” in the funds from which the employees will be paid. Accrued Liabilities and Long-term Obligations All payables, accrued liabilities and long-term obligations are reported in the government-wide financial statements. All payables, accrued liabilities, and long-term obligations payable from the Internal Service Fund are reported on the proprietary fund financial statements. In general, governmental fund payables and accrued liabilities that, once incurred, are paid in a timely manner and in full from current financial resources are reported as obligations of the governmental funds. However, compensated absences that will be paid from governmental funds are reported as a liability in the fund financial statements only to the extent that they are due for payment with current available resources. Long-term bonds, notes, and capital leases that will be paid from governmental funds are recognized as an expenditure and liability in the governmental fund financial statements when due. Bond Premiums and Compounded Interest on Capital Appreciation Bonds For governmental activities, bond premiums are deferred and amortized over the term of the bonds using the straight-line method since the results are not significantly different from the effective interest method. Capital appreciation bonds are accreted each fiscal year for the compounded interest accrued during the fiscal year. Bond premiums and the compounded interest on the capital appreciation bonds are presented as an addition to the face amount of the bonds payable. On the governmental fund financial statements bond premiums are recognized in the period in which the bonds were issued. Accretion on the capital appreciation bonds is not reported. Interest on the capital appreciation bonds is recorded as an expenditure when the debt becomes due.
31

Springfield City School District Notes to the Basic Financial Statements For the Fiscal Year Ended June 30, 2017
NOTE 2 - SUMMARY OF SIGNIFICANT ACCOUNTING POLICIES (continued) Deferred Charge on Refunding On the government-wide financial statements an advance refunding resulting in the defeasance of debt generates an accounting loss calculated by comparing the reacquisition price and the net carrying amount of the old debt. This accounting loss is presented as a deferred outflow on the government-wide financial statements and is not reported on the governmental fund financial statements. Net Position Net position represents the difference between assets and deferred outflows compared with liabilities and deferred inflows. Net investment in capital assets consists of capital assets, net of accumulated depreciation, reduced by the outstanding balances of any borrowings used for the acquisition, construction or improvement of those assets. Net position is reported as restricted when there are limitations imposed on its use either through enabling legislation adopted by the School District or through external restrictions imposed by creditors, grantors or laws or regulations of other governments. Net position restricted for other purposes include resources restricted for student activities and federal and State grants restricted to expenditures for specified purposes. The School District applies restricted resources when an expense is incurred for purposes for which both restricted and unrestricted net position is available. Internal Activity Transfers within governmental activities are eliminated on the government-wide financial statements. Internal allocations of overhead expenses from one function to another or within the same function are eliminated of the Statement of Activities. Payments for interfund services provided and used are not eliminated. Exchange transactions between funds are reported as revenues in the seller funds and as expenditures/expenses in the purchaser funds. Flows of cash or goods from one fund to another without a requirement for repayment are reported as interfund transfers and are eliminated from the Statement of Activities. Interfund transfers are reported as other financing sources/uses in governmental funds. Repayments from funds responsible for particular expenditures/expenses to the funds that initially paid for them are not presented on the financial statements. Operating Revenues and Expenses Operating revenues are those revenues that are generated directly from the primary activity of the Internal Service Fund. For the School District, these revenues are charges for services for medical and dental insurance. Operating expenses are the necessary costs incurred to provide the service that is the primary activity of the fund. Revenues and expenses that do not meet these definitions are reported as non-operating.
32

Springfield City School District Notes to the Basic Financial Statements For the Fiscal Year Ended June 30, 2017
NOTE 2 - SUMMARY OF SIGNIFICANT ACCOUNTING POLICIES (continued) Fund Balance Fund balance is divided into four classifications based primarily on the extent to which the School District is bound to observe constraints imposed upon the use of the resources in the governmental funds. The classifications are as follows: Restricted Fund balance is reported as restricted when constraints placed on the use of resources are either externally imposed by creditors (such as through debt covenants), grantors, contributors, or laws or regulations of other governments or is imposed by law through constitutional provisions. Committed The committed fund balance classification includes amounts that can be used only for the specific purposes imposed by a formal action (resolution) of the Board of Education. Those committed amounts cannot be used for any other purpose unless the Board removes or changes the specified use by taking the same type of action (resolution) it employed to previously commit those amounts. Committed fund balance also incorporates contractual obligations to the extent that existing resources in the fund have been specifically committed for use in satisfying those contractual requirements. Assigned Amounts in the assigned fund balance classification are intended to be used by the School District for specific purposes but do not meet the criteria to be classified as restricted or committed. In governmental funds other than the General Fund, assigned fund balance represents the remaining amount that is not restricted or committed. In the General Fund, through the School District’s purchasing policy, the Board has given the Treasurer the authority to constrain monies for intended purposes, which are reported as assigned. Unassigned Unassigned fund balance is the residual classification for the General Fund and includes all spendable amounts not contained in the other classifications. In other governmental funds, the unassigned classification is used only to report a deficit balance resulting from overspending for specific purposes for which amounts had been restricted, committed, or assigned. The School District applies restricted resources first when expenditures are incurred for purposes for which either restricted or unrestricted (committed, assigned, and unassigned) amounts are available. Similarly, within unrestricted fund balance, committed amounts are reduced first followed by assigned, and then unassigned amounts when expenditures are incurred for purposes for which amounts in any of the unrestricted fund balance classifications could be used.
33

Springfield City School District Notes to the Basic Financial Statements For the Fiscal Year Ended June 30, 2017
NOTE 2 - SUMMARY OF SIGNIFICANT ACCOUNTING POLICIES (continued) Budgetary Process All funds, other than the agency funds, are legally required to be budgeted and appropriated. In fiscal year 2017, the Race to the Top fund did not have a legally adopted budget. The major documents prepared are the tax budget, the appropriation resolution and the certificate of estimated resources, all of which are prepared on the budgetary basis of accounting. The tax budget demonstrates a need for existing or increased tax rates. The certificate of estimated resources establishes a limit on the amounts that the Board of Education may appropriate. The appropriation resolution is the Board’s authorization to spend resources and sets annual limits on expenditures plus encumbrances at a level of control selected by the Board. The legal level of budgetary control has been established by the Board of Education at the fund level. The Treasurer has been authorized to allocate Board appropriations to the object level within each fund. The certificate of estimated resources may be amended during the fiscal year if projected increases or decreases in revenue are identified by the School District Treasurer. The amounts reported as the original budgeted amounts in the budgetary statements reflect the amounts in the certificate when the original appropriations were adopted. The amounts reported as final budgeted amounts reflect the amounts in the amended certificate in effect at the time the final appropriations were passed by the Board of Education. The appropriation resolution is subject to amendment by the Board throughout the fiscal year with the restriction that appropriations may not exceed estimated revenues. The amounts reported as the original budgeted amounts in the budgetary statements reflect the first appropriation for that fund that covered the entire fiscal year, including amounts automatically carried over from prior fiscal years. The amounts reported as the final budgeted amounts represent the final appropriation amounts passed by the Board during the fiscal year, including all supplemental appropriations. Estimates The preparation of financial statements in conformity with generally accepted accounting principles requires management to make estimates and assumptions that affect the amounts reported in the financial statements and accompanying notes. Actual results may differ from those estimates. NOTE 3 - ACCOUNTABILITY At June 30, 2017, the following funds had deficit fund balances:
DeficitFund Equity
Special Revenue Funds:Early Childhood Education $ 80,245 Miscellaneous State Grants $ 583 Title VI-B Special Education Part B - IDEA $ 1,463 Preschool Grant $ 1,252 Title VI-R $ 32,400
The General Fund provides transfers to cover deficit balances in these funds; however, this is done when cash is needed rather than when accruals occur.
34

Springfield City School District Notes to the Basic Financial Statements For the Fiscal Year Ended June 30, 2017
NOTE 4 - BUDGETARY BASIS OF ACCOUNTING While the School District is reporting financial position, results of operations, and changes in fund balances on the basis of generally accepted accounting principles (GAAP), the budgetary basis as provided by law is based upon accounting for certain transactions on a basis of cash receipts, disbursements, and encumbrances. The Statement of Revenues, Expenditures and Changes in Fund Balance - Budget and Actual (Non-GAAP Basis) is presented for the General Fund on the budgetary basis to provide a meaningful comparison of actual results with the budget. The major differences between the budget basis and GAAP basis are that:
1. Revenues are recorded when received in cash (budget basis) as opposed to when susceptible to accrual (GAAP basis).
2. Expenditures are recorded when paid in cash (budget basis) as opposed to when the liability is
incurred (GAAP basis). 3. Encumbrances are treated as expenditures (budget basis) rather than restricted, committed, or
assigned fund balance (GAAP basis).
4. Advances In and Advances Out are operating transactions (budget basis) as opposed to balance sheet transactions (GAAP basis).
5. Investments are recorded at fair value (GAAP) rather than cost (budget basis). The following table summarizes the adjustments necessary to reconcile the GAAP and budgetary basis statements for the General Fund.
Net Change in Fund Balances
GeneralFund
GAAP Basis $ 3,290,491 Revenue Accruals 1,061,148 Expenditure Accruals 788,311 Encumbrances (1,439,707) Other Financing Sources (Uses) (437,675) Perspective Difference (12,506) Budget (Non-GAAP) Basis $ 3,250,062
35

Springfield City School District Notes to the Basic Financial Statements For the Fiscal Year Ended June 30, 2017
NOTE 5 - DEPOSITS AND INVESTMENTS Monies held by the School District are classified by State statute into three categories. Active monies are public monies determined to be necessary to meet current demands upon the School District treasury. Active monies must be maintained either as cash in the School District Treasury, in commercial accounts payable or withdrawable on demand, including negotiable order of withdrawal (NOW) accounts, or in money market deposit accounts. Inactive deposits are public deposits that the Board of Education has identified as not required for use within the current five year period of designation of depositories. Inactive deposits must either be evidenced by certificates of deposit maturing not later than the end of the current period of designation of depositories, or by savings or deposit accounts including, but not limited to, passbook accounts. Interim deposits are deposits of interim monies. Interim monies are those monies which are not needed for immediate use but which will be needed before the end of the current period of designation of depositories. Interim deposits must be evidenced by time certificates of deposit maturing not more than five years from the date of deposit, or by savings or deposit accounts, including passbook accounts. Interim monies held by the School District may be deposited or invested in the following securities:
1. United States treasury notes, bills, bonds, or any other obligation or security issued by the United States Treasury, or any other obligation guaranteed as to principal and interest by the United States;
2. Bonds, notes, debentures, or any other obligations or securities issued by any federal government agency or instrumentality including, but not limited to, the Federal National Mortgage Association, Federal Home Loan Bank, Federal Farm Credit Bank, Federal Home Loan Mortgage Corporation, Government National Mortgage Association, and Student Loan Marketing Association. All federal agency securities shall be direct issuances of federal government agencies or instrumentalities;
3. Written repurchase agreements in the securities listed above;
4. Bonds and other obligations of the State of Ohio;
5. Time certificates of deposit or savings or deposit accounts including, but not limited to,
passbook accounts;
6. No-load money market mutual funds consisting exclusively of obligations described in division (1) or (2) above;
7. The State Treasurer’s investment pool (STAROhio); and
8. Commercial paper and bankers’ acceptances if training requirements have been meet.
36

Springfield City School District Notes to the Basic Financial Statements For the Fiscal Year Ended June 30, 2017
NOTE 5 - DEPOSITS AND INVESTMENTS (continued) Investments in stripped principal or interest obligations, reverse repurchase agreements and derivatives are prohibited. The issuance of taxable notes for the purpose of arbitrage, the use of leverage and short selling are also prohibited. Investments may only be made through specified dealers and institutions. Deposits Custodial credit risk for deposits is the risk that in the event of bank failure, the School District will not be able to recover deposits or collateral securities that are in the possession of an outside party. At fiscal year-end, $15,198,443 of the School District’s bank balance of $22,198,443 was exposed to custodial credit risk because it was uninsured and collateralized with securities held by the pledging financial institution but not in the name of the School District. The School District has no deposit policy for custodial risk beyond the requirements of State statute. Ohio law requires that deposits either be insured or be protected by eligible securities pledged to and deposited either with the School District or a qualified trustee by the financial institution as security for repayment, or by a collateral pool of eligible securities deposited with a qualified trustee and pledged to secure the repayment of all public monies deposited in the financial institution that are not FDIC insured whose market value at all times shall be at least 105 percent of the deposits being secured. Investments The School District categorizes its fair value measurements within the fair value hierarchy established by generally accepted accounting principles. The hierarchy is based on the valuation inputs used to measure fair value of the asset. Level 1 inputs are quoted prices in active markets for identical assets; Level 2 inputs are significant other observable inputs; Level 3 inputs are significant unobservable inputs. As of June 30, 2017 the School District had the following recurring fair value measurements.
U.S. Agency securities of $8,466,455, money market mutual funds of $1,760,477 and negotiable certificates of deposit of $5,117,230 are valued using significant other observable inputs (Level 2 inputs).
Interest Rate Risk As a means of limiting its exposure to fair value losses caused by rising interest rates, the School District’s investment policy requires that, to the extent possible, investments will match anticipated cash flow requirements. No investment shall be made unless the Treasurer, at the time of making the investment, reasonably expects it can be held to its maturity. Unless matched to a specific obligation or debt of the School District, the School District will not directly invest in securities maturing more than five years from the date of investment.
37

Springfield City School District Notes to the Basic Financial Statements For the Fiscal Year Ended June 30, 2017
NOTE 5 - DEPOSITS AND INVESTMENTS (continued) Credit Risk The Standard and Poor’s rating of the investment securities are listed in the table below. Ohio law requires that STAROhio maintain the highest rating provided by at least one nationally recognized standard rating service and that the mutual fund be rated in the highest category at the time of purchase by at least one nationally recognized rating service. The School District’s investment policy limits investments to those authorized by State statute. Concentration of Credit Risk The School District’s investment policy provides that the School District will diversify its investments in securities by maturity, issue, and class. The percentage that each investment represents of the total investments is listed in the table below. As of June 30, 2017, the School District had the following investments. All investments are in an internal investment pool.
Fair Maturity (in years) Percent of CreditValue 0 - 1 2 - 3 4 - 5 Total Portfolio Rating*
Money Market $ 1,760,477 1,760,477 - - 5.92% AAAmNegotiable Certificates of Deposit 5,117,230 3,618,853 1,498,377 - 17.21% N/AFederal Home Loan Bank 3,484,205 - - 3,484,205 11.72% AA+Federal Home Loan Mortgage 4,982,250 - 1,988,140 2,994,110 16.76% AA+STAROhio 14,387,116 14,387,116 - - 48.39% AAAmTotal Investments $ 29,731,278 19,766,446 3,486,517 6,478,315
* - as rated by Standard & Poor's rating services NOTE 6 - PROPERTY TAXES Property taxes are levied and assessed on a calendar year basis while the School District’s fiscal year runs from July through June. First half tax collections are received by the School District in the second half of the fiscal year. Second half tax distributions occur in the first half of the following fiscal year. Property taxes include amounts levied against all real and public utility property located in the School District. Real property tax revenue received in fiscal year 2017 represents collections of calendar year 2016 taxes. Real property taxes received in calendar year 2017 were levied after April 1, 2016, on the assessed value listed as of January 1, 2016, the lien date. Assessed values for real property taxes are established by State statute at 35 percent of appraised market value. Real property taxes are payable annually or semi-annually. If paid annually, payment is due December 31; if paid semi-annually, the first payment is due December 31 with the remainder payable by June 20. Under certain circumstances, State statute permits alternate payment dates to be established. Public utility property tax revenue received in fiscal year 2017 represents collections of calendar year 2016 taxes. Public utility real and tangible personal property taxes received in calendar year 2016 became a lien December 31, 2015, were levied after April 1, 2016, and are collected with real property taxes. Public utility real property is assessed at 35 percent of true value; public utility tangible personal property currently is assessed at varying percentages of true value.
38

Springfield City School District Notes to the Basic Financial Statements For the Fiscal Year Ended June 30, 2017
NOTE 6 - PROPERTY TAXES (continued) The School District receives property taxes from Clark County. The County Auditor periodically advances to the School District its portion of the taxes collected. Second-half real property tax payments collected by the County by June 30, 2017, are available to finance fiscal year 2018 operations. The amount available to be advanced can vary based on the date the tax bills are sent. Accrued property taxes receivable includes real property and public utility property taxes which were measurable as of June 30, 2017 and for which there is an enforceable legal claim. Although total property tax collections for the next fiscal year are measurable, only the amount of real property taxes available as an advance at June 30 was levied to finance current fiscal year operations and is reflected as revenue at fiscal year-end. The portion of the receivable not levied to finance current fiscal year operations is offset by a credit to deferred inflow of resources. The amounts available as an advance at June 30, 2017 was, $4,915,193 in the General Fund, $439,044 in the Bond Retirement Debt Service Fund, and $174,732 in the Other Governmental Funds. The amounts available as an advance at June 30, 2016 was, $5,881,309 in the General Fund, $536,944 in the Bond Retirement Debt Service Fund, and $209,588 in the Other Governmental Funds. On an accrual basis, collectible delinquent property taxes have been recorded as a receivable and revenue, while on a modified accrual basis the revenue has been reported as deferred inflows of resources – unavailable revenue. The assessed values upon which fiscal year 2017 taxes were collected are:
2017 First Half Collections 2016 Second Half CollectionsAmount Percent Amount Percent
Agricultural/Residential and Other Real Estate $ 565,616,890 92.86% 557,912,900 93.59%
Public Utility 43,506,600 7.14% 38,210,300 6.41%Total Assessed Value $ 609,123,490 100.00% 596,123,200 100.00%
Tax rate per $1,000 ofassessed valuation $64.93 $65.26
NOTE 7 - RECEIVABLES Receivables at June 30, 2017, consisted of property taxes, accounts, intergovernmental grants, and interfund. All receivables are considered collectible in full. With the exception of delinquent property taxes, all receivables will be received within one year. Property taxes, although ultimately collectible, include some portion of delinquents that will not be collected within one year.
39

Springfield City School District Notes to the Basic Financial Statements For the Fiscal Year Ended June 30, 2017
NOTE 7 – RECEIVABLES (continued) A summary of the principal items of intergovernmental receivables follows:
Governmental Activities: AmountGeneral Fund $ 29,880 Food Service 33,296 Mental Health/Early Start 26,946 School Age Child Care/After School Enrichment 1,043 Early Childhood Education 330,027 Alternative Schools 10,430 Straight A Grant 69,675 Miscellaneous State Grants 3,109 Adult Basic Education 18,268 Special Education Part B - IDEA 479,481 Title I School Improvement. Stimulus A 96,105 Title III 35,772 Title I 1,126,514 Pre-School Grant 11,037 Title VIR 40,047 Miscellaneous Federal Grants 7,468
Total Intergovernmental Receivables $ 2,319,098
NOTE 8 - CAPITAL ASSETS Capital assets activity for the fiscal year ended June 30, 2017, was as follows:
Balance at Balance atGovernmental Activities: 6/30/2016 Additions Deductions 6/30/2017Capital Assets Not Being Depreciated
Land 15,421,889$ -$ (47,265)$ 15,374,624$ Construction in Progress 1,442,712 19,965 (1,442,712) 19,965
Total Capital Assets Not Being Depreciated 16,864,601 19,965 (1,489,977) 15,394,589
Depreciable Capital AssetsBuildings 212,310,082 3,744,636 - 216,054,718 Furniture and Equipment 9,736,263 2,006,090 (618,515) 11,123,838 Vehicles 3,205,359 279,938 (2,671) 3,482,626
Total Depreciable Capital Asseets 225,251,704 6,030,664 (621,186) 230,661,182
Accumulated DepreciationBuildings (58,976,339) (5,178,509) - (64,154,848) Furniture and Equipment (6,349,794) (832,444) 508,249 (6,673,989) Vehicles (1,953,006) (380,228) 2,671 (2,330,563)
Total Accumulated Depreciation (67,279,139) (6,391,181) 510,920 (73,159,400)
Depreciable Capital Assets, Net 157,972,565 (360,517) (110,266) 157,501,782
Governmental Activities Capital Assets, Net 174,837,166$ (340,552)$ (1,600,243)$ 172,896,371$
40

Springfield City School District Notes to the Basic Financial Statements For the Fiscal Year Ended June 30, 2017
NOTE 8 - CAPITAL ASSETS (continued)
* - Depreciation expense was charged to governmental functions as follows:
InstructionRegular 81,872$ Special 32,618 Student Intervention Services 1,843
Support ServicesPupils 47,037 Instructional Staff 17,128 Administration 1,198 Fiscal 102,034 Operation and Maintenance of Plant 146,462 Pupil Transportation 327,662 Central 183,240 Operation of Non-Instructional Services 154,543 Extracurricular Activities 11,426
1,107,063 Unallocated Depreciation 5,284,118 Total Depreciation Expense 6,391,181$
NOTE 9 - RISK MANAGEMENT Workers’ Compensation For fiscal year 2017, the School District participated in the Ohio SchoolComp Group Retrospective Rating Program (GRRP), an insurance purchasing pool (See Note 17). The intent of the GRRP is to reward participants that are able to keep their claims costs below a predetermined amount. As part of the GRRP, school districts join together as a group. Each school district continues to pay its own individual premium to the State. However, each school district has the opportunity to receive retrospective premium adjustments (refunds or assessments) at 12, 24, and 36 months after the end of the policy year. At the end of each policy year, the Bureau of Workers’ Compensation (BWC) will take a snap-shot of the incurred claims losses (indemnity, medical, and reserves) for the entire group and calculate the group’s retrospective premium. If the retrospective premium that is calculated is less than the group’s total standard premium, the participants will receive a refund. However, if the retrospective premium is greater than the group’s total standard premium, an assessment will be levied by BWC. Each group limits the maximum assessment by selecting a premium cap between five percent and 100 percent of merit rated premium. Participation in the GRRP is limited to school districts that can meet the GRRP’s selection criteria. The firm of CompManagement, Inc. provides administrative, cost control, and actuarial services to the GRRP.
41

Springfield City School District Notes to the Basic Financial Statements For the Fiscal Year Ended June 30, 2017
NOTE 9 - RISK MANAGEMENT (continued) Property and Liability The School District is exposed to various risks of loss related to torts; theft of, damage to, and destruction of assets; errors and omissions; injuries to employees; and natural disasters. The School District, along with other school districts in Ohio, participates in the Ohio School Plan (OSP), an insurance purchasing pool. Each individual School District enters into an agreement with the OSP and its premium is based on types of coverage, limits of coverage, and deductibles that it selects. The School District pays this annual premium to the OSP. (See Note 17). During fiscal year 2017, the School District contracted with the Ohio School Plan for property, inland marine, crime, automobile liability and general liability insurance coverage. Settled claims have not exceeded this commercial coverage in any of the past three fiscal years. There has been no significant change in insurance coverage from last fiscal year. Employee Health Insurance The School District is self-insured for health benefits with United Health Care as the plan administrator. It is the stated goal of the insurance committee to maintain a balance of one to two months’ average claims history. The School District purchased additional stop-loss coverage from United Health Care Insurance Company. The specific stop-loss limit is $225,000 with a maximum aggregate limit of $2,000,000 per person. The School District is self-insured for dental benefits with Delta Dental as the plan administrator. The District made claims payments of $587,522 during the fiscal year. The liability for unpaid claims of $1,153,898 reported in the Self-Insurance Fund at June 30, 2017, is based on the requirements of GASB Statement No. 10, “Accounting and Financial Reporting for Risk Financing and Related Insurance Issues,” as amended by GASB Statement No. 30, “Risk Management Omnibus,” which requires that a liability for unpaid claims costs, including estimates of costs relating to incurred but not reported claims, be reported. Estimates were calculated based upon an independent actuarial evaluation of claims payable. The estimate was not affected by incremental claims adjustment expenses and does not include other allocated or unallocated claims adjustment expenses. Due to nature of health claims, payment of all claims outstanding at June 30, 2017, is expected to be made within one year. Changes in claims activity for the past two fiscal years are as follows:
Balance at Current Claim Balance atYear Beginning of Year Year Claims Payments End of Year2016 $ 877,861 12,521,286 (12,418,932) 980,215 2017 $ 980,215 17,234,578 (17,060,895) 1,153,898
42

Springfield City School District Notes to the Basic Financial Statements For the Fiscal Year Ended June 30, 2017
NOTE 10 - DEFINED BENEFIT PENSION PLANS Net Pension Liability
The net pension liability reported on the statement of net position represents a liability to employees for pensions. Pensions are a component of exchange transactions-–between an employer and its employees—of salaries and benefits for employee services. Pensions are provided to an employee—on a deferred-payment basis—as part of the total compensation package offered by an employer for employee services each financial period. The obligation to sacrifice resources for pensions is a present obligation because it was created as a result of employment exchanges that already have occurred.
The net pension liability represents the School District’s proportionate share of each pension plan’s collective actuarial present value of projected benefit payments attributable to past periods of service, net of each pension plan’s fiduciary net position. The net pension liability calculation is dependent on critical long-term variables, including estimated average life expectancies, earnings on investments, cost of living adjustments and others. While these estimates use the best information available, unknowable future events require adjusting this estimate annually.
Ohio Revised Code limits the School District’s obligation for this liability to annually required payments. The School District cannot control benefit terms or the manner in which pensions are financed; however, the School District does receive the benefit of employees’ services in exchange for compensation including pension.
GASB 68 assumes the liability is solely the obligation of the employer, because (1) they benefit from employee services; and (2) State statute requires all funding to come from these employers. All contributions to date have come solely from these employers (which also includes costs paid in the form of withholdings from employees). State statute requires the pension plans to amortize unfunded liabilities within 30 years. If the amortization period exceeds 30 years, each pension plan’s board must propose corrective action to the State legislature. Any resulting legislative change to benefits or funding could significantly affect the net pension liability. Resulting adjustments to the net pension liability would be effective when the changes are legally enforceable.
The proportionate share of each plan’s unfunded benefits is presented as a long-term net pension liability on the accrual basis of accounting. Any liability for the contractually-required pension contribution outstanding at the end of the year is included in intergovernmental payable on both the accrual and modified accrual bases of accounting. Plan Description - School Employees Retirement System (SERS) Plan Description – School District non-teaching employees participate in SERS, a cost-sharing multiple-employer defined benefit pension plan administered by SERS. SERS provides retirement, disability and survivor benefits, annual cost-of-living adjustments, and death benefits to plan members and beneficiaries. Authority to establish and amend benefits is provided by Ohio Revised Code Chapter 3309. SERS issues a publicly available, stand-alone financial report that includes financial statements, required supplementary information and detailed information about SERS’ fiduciary net position. That report can be obtained by visiting the SERS website at www.ohsers.org under Employers/Audit Resources.
43

Springfield City School District Notes to the Basic Financial Statements For the Fiscal Year Ended June 30, 2017
NOTE 10 - DEFINED BENEFIT PENSION PLANS (continued) Age and service requirements for retirement are as follows:
Eligible to Eligible toRetire on or before retire on or afterAugust 1, 2017 ** August 1, 2017
Full benefits Any age with 30 years of service credit Age 67 with 10 years of service credit; orage 57 with 30 years of service credit
Actuarially reduced benefits Age 60 with 5 years of service credit; or Age 62 with 10 years of service credit; orage 55 with 25 years of service credit age 60 with 25 years of service credit
** - Members with 25 years of service credit as of August 1, 2017 will be included in this plan.
Annual retirement benefits are calculated based on final average salary multiplied by a percentage that varies based on year of service; 2.2 percent for the first thirty years of service and 2.5 percent for years of service credit over 30. Final average salary is the average of the highest three years of salary. One year after an effective benefit date, a benefit recipient is entitled to a three percent cost-of-living adjustment (COLA). This same COLA is added each year to the base benefit amount on the anniversary date of the benefit. Funding Policy – Plan members are required to contribute 10 percent of their annual covered salary and the School District is required to contribute 14 percent of annual covered payroll. The contribution requirements of plan members and employers are established and may be amended by the SERS’ Retirement Board up to statutory maximum amounts of 10 percent for plan members and 14 percent for employers. The Retirement Board, acting with the advice of the actuary, allocates the employer contribution rate among four of the System’s funds (Pension Trust Fund, Death Benefit Fund, Medicare B Fund, and Health Care Fund). For the fiscal year ended June 30, 2017, the allocation to pension, death benefits, and Medicare B was 14 percent. There was no allocation to the Health Care Fund. The School District’s contractually required contribution to SERS was $1,754,659 for fiscal year 2017. Of this amount, $621,767 is reported as an intergovernmental payable. Plan Description - State Teachers Retirement System (STRS) Plan Description – School District licensed teachers and other faculty members participate in STRS Ohio, a cost-sharing multiple-employer public employee retirement system administered by STRS. STRS provides retirement and disability benefits to members and death and survivor benefits to beneficiaries. STRS issues a stand-alone financial report that includes financial statements, required supplementary information and detailed information about STRS’ fiduciary net position. That report can be obtained by writing to STRS, 275 E. Broad St., Columbus, OH 43215-3771, by calling (888) 227-7877, or by visiting the STRS Web site at www.strsoh.org.
44

Springfield City School District Notes to the Basic Financial Statements For the Fiscal Year Ended June 30, 2017
NOTE 10 - DEFINED BENEFIT PENSION PLANS (continued) New members have a choice of three retirement plans; a Defined Benefit (DB) Plan, a Defined Contribution (DC) Plan and a Combined Plan. Benefits are established by Ohio Revised Code Chapter 3307. The DB plan offers an annual retirement allowance based on final average salary multiplied by a percentage that varies based on years of service. Effective August 1, 2015, the calculation will be 2.2 percent of final average salary for the five highest years of earnings multiplied by all years of service. With certain exceptions, the basic benefit is increased each year by two percent of the original base benefit. For members retiring August 1, 2013, or later, the first two percent is paid on the fifth anniversary of the retirement benefit. Members are eligible to retire at age 60 with five years of qualifying service credit, or age 55 with 25 years of service, or 30 years of service regardless of age. Age and service requirements for retirement will increase effective August 1, 2015, and will continue to increase periodically until they reach age 60 with 35 years of service or age 65 with five years of service on August 1, 2026. The DC Plan allows members to place all their member contributions and 9.5 percent of the 14 percent employer contributions into an investment account. Investment allocation decisions are determined by the member. The remaining 4.5 percent of the 14 percent employer rate is allocated to the defined benefit unfunded liability. A member is eligible to receive a retirement benefit at age 50 and termination of employment. The member may elect to receive a lifetime monthly annuity or a lump sum withdrawal. The Combined Plan offers features of both the DB Plan and the DC Plan. In the Combined Plan, member contributions are allocated among investment choices by the member, and employer contributions are used to fund the defined benefit payment at a reduced level from the regular DB Plan. The defined benefit portion of the Combined Plan payment is payable to a member on or after age 60 with five years of services. The defined contribution portion of the account may be taken as a lump sum payment or converted to a lifetime monthly annuity at age 50. New members who choose the DC plan or Combined Plan will have another opportunity to reselect a permanent plan during their fifth year of membership. Members may remain in the same plan or transfer to another STRS plan. The optional annuitization of a member’s defined contribution account or the defined contribution portion of a member’s Combined Plan account to a lifetime benefit results in STRS bearing the risk of investment gain or loss on the account. STRS has therefore included all three plan options as one defined benefit plan for GASB 68 reporting purposes. A DB or Combined Plan member with five or more years of credited service who is determined to be disabled may qualify for a disability benefit. Eligible survivors of members who die before service retirement may qualify for monthly benefits. New members on or after July 1, 2013, must have at least ten years of qualifying service credit that apply for disability benefits. Members in the DC Plan who become disabled are entitled only to their account balance. If a member of the DC Plan dies before retirement benefits begin, the member’s designated beneficiary is entitled to receive the member’s account balance. Funding Policy – Employer and member contribution rates are established by the State Teachers Retirement Board and limited by Chapter 3307 of the Ohio Revised Code. The statutory maximum employee contribution rate was increased one percent July 1, 2016, to reach 14 percent. For the fiscal year ended June 30, 2017, plan members were required to contribute 14 percent of their annual covered salary. The School District was required to contribute 14 percent; the entire 14 percent was the portion used to fund pension obligations. The fiscal year 2017 contribution rates were equal to the statutory maximum rates.
45

Springfield City School District Notes to the Basic Financial Statements For the Fiscal Year Ended June 30, 2017
NOTE 10 - DEFINED BENEFIT PENSION PLANS (continued) The School District’s contractually required contribution to STRS was $5,999,893 for fiscal year 2017. Of this amount $1,120,447 is reported as an intergovernmental payable. Pension Liabilities, Pension Expense, and Deferred Outflows of Resources and Deferred Inflows of Resources Related to Pensions The net pension liability was measured as of June 30, 2016, and the total pension liability used to calculate the net pension liability was determined by an actuarial valuation as of that date. The School District's proportion of the net pension liability was based on the School District's share of contributions to the pension plan relative to the contributions of all participating entities. Following is information related to the proportionate share and pension expense:
SERS STRS Total
Proportionate share of the net pension liability 27,656,747$ 127,560,422$ 155,217,169$
Proportion of the net pension liability 0.37787203% 0.38108436%Change in proportionate share 0.14779830% 0.01563560%
Pension expense 2,702,404$ 10,822,859$ 13,525,263$
At June 30, 2017, the School District reported deferred outflows of resources and deferred inflows of resources related to pensions from the following sources: Deferred Outlfows of Resources: SERS STRS Total
Differences between expected andactual experience 373,026$ 5,154,055$ 5,527,081$
Net difference between projected and actualearnings on pension plan investments 2,281,279 10,590,942 12,872,221
Change in assumptions 1,846,238 - 1,846,238
Change in School District's proportionate shareand difference in employer contributions 606,142 4,123,458 4,729,600
School district contributions subsequentto the measurement date 1,754,659 5,999,893 7,754,552
Total 6,861,344$ 25,868,348$ 32,729,692$
Deferred Inflows of Resources:Changes in proportionate share 95,107$ -$ 95,107$
46

Springfield City School District Notes to the Basic Financial Statements For the Fiscal Year Ended June 30, 2017
NOTE 10 - DEFINED BENEFIT PENSION PLANS (continued) $7,754,552 reported as deferred outflows of resources related to pension resulting from School District contributions subsequent to the measurement date will be recognized as a reduction of the net pension liability in the year ending June 30, 2018. Other amounts reported as deferred outflows of resources and deferred inflows of resources related to pension will be recognized in pension expense as follows:
Fiscal YearEnding SERS STRS Total2018 1,304,393$ 3,586,897$ 4,891,290$ 2019 1,302,749 3,586,897 4,889,646 2020 1,748,662 7,650,941 9,399,603 2021 655,774 5,043,720 5,699,494
5,011,578$ 19,868,455$ 24,880,033$ Actuarial Assumptions - SERS SERS’ total pension liability was determined by their actuaries in accordance with GASB Statement No. 67, as part of their annual actuarial valuation for each defined benefit retirement plan. Actuarial valuations of an ongoing plan involve estimates of the value of reported amounts (e.g., salaries, credited service) and assumptions about the probability of occurrence of events far into the future (e.g., mortality, disabilities, retirements, employment termination). Actuarially determined amounts are subject to continual review and potential modifications, as actual results are compared with past expectations and new estimates are made about the future. Projections of benefits for financial reporting purposes are based on the substantive plan (the plan as understood by the employers and plan members) and include the types of benefits provided at the time of each valuation and the historical pattern of sharing benefit costs between the employers and plan members to that point. The projection of benefits for financial reporting purposes does not explicitly incorporate the potential effects of legal or contractual funding limitations. Actuarial calculations reflect a long-term perspective. For a newly hired employee, actuarial calculations will take into account the employee’s entire career with the employer and also take into consideration the benefits, if any, paid to the employee after termination of employment until the death of the employee and any applicable contingent annuitant. In many cases actuarial calculations reflect several decades of service with the employer and the payment of benefits after termination. Key methods and assumptions used in calculating the total pension liability in the latest actuarial valuation, prepared as of June 30, 2016, are presented below: Wage inflation 3.00 percentFuture salary increases, including inflation 3.50 percent to 18.20 percentCOLA or Ad Hoc COLA 3 percentInvestment rate of return 7.50 percent of net investments expense, including inflationActuarial cost method Entry Age Normal
47

Springfield City School District Notes to the Basic Financial Statements For the Fiscal Year Ended June 30, 2017
NOTE 10 - DEFINED BENEFIT PENSION PLANS (continued) Mortality rates were based on the RP-2014 Blue Collar Mortality Table with fully generational projection and a five-year age set-back for both males and females. Mortality among service retired members, and beneficiaries were based upon the RP-2014 Blue Collar Mortality Table with fully generational projection with Scale BB, 120% of male rates and 110% of female rates. Mortality among disabled members were based upon the RP-2000 Disabled Mortality Table, 90% for male rates and 100% for female rates, set back five years is used for the period after disability retirement. The actuarial assumptions used were based on the results of an actuarial experience study for the period ending July 1, 2010 to June 30, 2015 adopted by the Retirement Board on April 21, 2016. The long-term return expectation for the Pension Plan Investments has been determined using a building-block approach and assumes a time horizon, as defined in SERS’ Statement of Investment Policy. A forecasted rate of inflation serves as the baseline for the return expectation. Various real return premiums over the baseline inflation rate have been established for each asset class. The long-term expected nominal rate of return has been determined by calculating a weighted averaged of the expected real return premiums for each asset class, adding the projected inflation rate, and adding the expected return from rebalancing uncorrelated asset classes. The target allocation and best estimates of arithmetic real rates of return for each major assets class are summarized in the following table:
Target Long-Term ExpectedAsset Class Allocation Real Rate of Return
Cash 1.00% 0.50%US stocks 22.50% 4.75%Non-US stocks 22.50% 7.00%Fixed income 19.00% 1.50%Private equity 10.00% 8.00%Real assets 15.00% 5.00%Multi-asset strategies 10.00% 3.00%
Total 100.00%
Discount Rate The total pension liability was calculated using the discount rate of 7.50 percent. The projection of cash flows used to determine the discount rate assumed the contributions from employers and from the members would be computed based on contribution requirements as stipulated by State statute. Projected inflows from investment earning were calculated using the long-term assumed investment rate of return (7.50 percent). Based on those assumptions, the plan’s fiduciary net position was projected to be available to make all future benefit payments of current plan members. Therefore, the long-term expected rate of return on pension plan investments was applied to all periods of projected benefits to determine the total pension liability. Sensitivity of the School District's Proportionate Share of the Net Pension Liability to Changes in the Discount Rate Net pension liability is sensitive to changes in the discount rate, and to illustrate the potential impact the following table presents the net pension liability calculated using the discount rate of 7.50 percent, as well as what each plan’s net pension liability would be if it were calculated using a discount rate that is one percentage point lower (6.50 percent), or one percentage point higher (8.50 percent) than the current rate.
48

Springfield City School District Notes to the Basic Financial Statements For the Fiscal Year Ended June 30, 2017
NOTE 10 - DEFINED BENEFIT PENSION PLANS (continued)
Current1% Decrease Discount Rate 1% Increase
(6.50%) (7.50%) (8.50%)School District's proportionate share of
the net pension liability 36,615,808$ 27,656,747$ 20,157,638$
Change in Assumptions The following changes in the actuarial assumptions were made during the June 30, 2016 actuarial valuation period:
Discount rate was reduced from 7.75% to 7.50% Assumed rate of inflation was reduced from 3.25% to 3.00% Payroll growth assumption was reduced from 4.00% to 3.50% Assumed real wage growth was reduced from 0.75% to 0.50% Rates of withdrawal, retirement and disability were updated to reflect recent experience Mortality among active members was updated to the following:
o RP-2014 Blue Collar Mortality Table with fully generational projection and a five-year age set-back for both males and females
Mortality among service retired members and beneficiaries was updated to the following: o RP-2014 Blue Collar Mortality Table with fully generational projection with Scale BB,
120% of male rates and 110% of female rates Mortality among disabled members was updated to the following:
o RP-2000 Disabled Mortality Table, 90% for male rates and 100% for female rates, and a five-year set-back for the period after disability retirement.
Actuarial Assumptions - STRS The total pension liability in the June 30, 2016, actuarial valuation was determined using the following actuarial assumptions, applied to all periods included in the measurement:
Inflation 2.75 percentFuture salary increases 2.75 percent at age 70 to 12.25 percent at age 20Investment rate of return 7.75 percent, net of investment expensesCost-of-Living Adjustments (COLA) 2 percent simple applied as follows: for members retiring
before August 1, 2013, 2 percent per year; for membersretiring August 1, 2013, or later, 2 percent COLA paid onfifth anniversary of retirement date.
Mortality rates were based on the RP-2000 Combined Mortality Table (Projection 2022—Scale AA) for Males and Females. Males’ ages are set-back two years through age 89 and no set-back for age 90 and above. Females younger than age 80 are set back four years, one year set back from age 80 through 89 and not set back from age 90 and above. Actuarial assumptions used in the June 30, 2016, valuation are based on the results of an actuarial experience study, effective July 1, 2012.
49

Springfield City School District Notes to the Basic Financial Statements For the Fiscal Year Ended June 30, 2017
NOTE 10 - DEFINED BENEFIT PENSION PLANS (continued) The 10 year expected real rate of return on pension plan investments was determined by STRS’ investment consultant by developing best estimates of expected future real rates of return for each major asset class. The target allocation and best estimates of geometric real rates of return for each major asset class are summarized as follows:
Target Long-Term ExpectedAsset Class Allocation Real Rate of Return
Domestic equity 31.00% 8.00%International equity 26.00% 7.85%Alternatives 14.00% 8.00%Fixed income 18.00% 3.75%Real estate 10.00% 6.75%Liquidity reserves 1.00% 3.00%
Total 100.00%
Discount Rate The discount rate used to measure the total pension liability was 7.75 percent as of June 30, 2016. The projection of cash flows used to determine the discount rate assumes member and employer contributions will be made at the statutory contribution rates in accordance with rate increases described above. For this purpose, only employer contributions that are intended to fund benefits of current plan members and their beneficiaries are included. Projected employer contributions that are intended to fund the service costs of future plan members and their beneficiaries, as well as projected contributions from future plan members, are not included. Based on those assumptions, STRS’ fiduciary net position was projected to be available to make all projected future benefit payments to current plan members as of June 30, 2016. Therefore, the long-term expected rate of return on pension plan investments of 7.75 percent was applied to all periods of projected benefit payment to determine the total pension liability as of June 30, 2016. Sensitivity of the School District's Proportionate Share of the Net Pension Liability to Changes in the Discount Rate The following table presents the School District's proportionate share of the net pension liability calculated using the current period discount rate assumption of 7.75 percent, as well as what the School District's proportionate share of the net pension liability would be if it were calculated using a discount rate that is one-percentage-point lower (6.75 percent) or one-percentage-point higher (8.75 percent) than the current rate:
Current1% Decrease Discount Rate 1% Increase
(6.75%) (7.75%) (8.75%)School District's proportianate share of
the net pension liability 169,517,436$ 127,560,422$ 92,167,208$
Changes Between Measurement Date and Report Date In March 2017, the STRS Board adopted certain assumption changes which will impact their annual actuarial valuation prepared as of June 30, 2017. The most significant change is a reduction in the discount rate from 7.75% to 7.45%. In April 2017, the STRS Board voted to suspend cost of living adjustments granted on or after July 1, 2017. Although the exact amount of these changes is not known, the overall change in the School District’s net pension liability is expected to be significant.
50

Springfield City School District Notes to the Basic Financial Statements For the Fiscal Year Ended June 30, 2017
NOTE 11 - POSTEMPLOYMENT BENEFITS School Employees Retirement System In addition to a cost-sharing multiple-employer defined benefit pension plan the School Employees Retirement System of Ohio (SERS) administers a postemployment benefit plan. Health Care Plan State Statute permits SERS to offer health care benefits to eligible retirees and beneficiaries. SERS’ Retirement Board reserves the right to change or discontinue any health plan or program. SERS offers several types of health plans from various vendors, including HMOs, PPOs, Medicare Advantage and traditional indemnity plans. A prescription drug program is also available to those who elect health coverage. SERS employs two third-party administrators and a pharmacy benefit manager to manage the self-insurance and prescription drug plans, respectively. State Statute provides the authority to fund SERS’ postemployment benefits through employer contributions. Active employee members do not contribute to the postemployment benefit plan. The Health Care Fund was established under, and is administered in accordance with Internal Revenue Code 105(e). Each year after the allocation for statutorily required pensions and benefits, the Retirement Board allocates the remainder of the employer 14% contribution to the Health Care Fund to be used to subsidize the cost of health care coverage. For the year ended June 30, 2017, SERS did not allocate any of the employer contributions to post-employment health care. An additional health care surcharge on employers is collected for employees earning less than an actuarially determined minimum compensation amount, prorated if less than a full year of service credit was earned. By statue no employer shall pay a health care surcharge greater than 2% of that employer’s SERS-covered payroll; nor may SERS collect in aggregate more than 1.5% of the total statewide SERS-covered payroll for the health care surcharge. For fiscal year 2017, the minimum compensation level was established at $23,500. The surcharge added to the unallocated portion of the 14% employer contribution rate is the total amount assigned to the Health Care Fund. For fiscal years 2016 and 2017 SERS did not allocate any of the employer contributions to post-employment health care. The School District’s contributions for health care for the fiscal year ended June 30, 2015 was $246,228. The full amount has been contributed for fiscal year 2015. State Teachers Retirement System of Ohio Plan Description – The School District participates in the cost-sharing multiple-employer defined benefit Health Plan administered by the State Teachers Retirement System of Ohio (STRS Ohio) for eligible retirees who participated in the defined benefit or combined pension plans offered by STRS Ohio. Ohio law authorizes STRS to offer this plan. Benefits include hospitalization, physicians’ fees, prescription drugs and reimbursement of monthly Medicare Part B premiums. The Plan is included in the report of STRS Ohio which can be obtained by visiting www.strsoh.org or by calling (888) 227-7877. Funding Policy – Ohio Revised Code Chapter 3307 authorizes STRS Ohio to offer the Plan and gives the Retirement Board authority over how much, if any, of the health care costs will be absorbed by STRS Ohio. Active employee members do not contribute to the Health Care Plan. All benefit recipients, for the most recent year, pay a monthly premium. Under Ohio law, funding for post-employment health care may be deducted from employer contributions. For fiscal years 2015, 2016 and 2017, STRS Ohio did not allocate any of the employer contributions to post-employment health care.
51

Springfield City School District Notes to the Basic Financial Statements For the Fiscal Year Ended June 30, 2017
NOTE 12 - EMPLOYEE BENEFITS Compensated Absences The criteria for determining vacation and sick leave benefits are derived from negotiated agreements and State laws. Classified employees and administrators earn 10 to 25 days of vacation per fiscal year, depending upon length of service, except for the Superintendent and the Treasurer. The Superintendent receives 25 days and the Treasurer receives 20 days per fiscal year. Accumulated, unused vacation time is paid to classified employees and administrators upon termination of employment. Teachers do not earn vacation time. Teachers, administrators, and classified employees earn sick leave at the rate of one and one-fourth days per month. Sick leave may be accumulated up to a maximum of 246 days for teachers, 3,120 hours for classified employees, and 320 days for administrative personnel. Upon retirement, payment is made for one-fourth of the total sick leave accumulation up to a maximum of 61.5 days for teachers. For administrators, payment is made for one-fourth of the total sick leave accumulation. For classified personnel, payment is made for one-fourth of the total sick leave accumulation up to a maximum of 512 hours. Insurance The School District provides life insurance and accidental death and dismemberment insurance to most employees through various life insurance companies. The School District provides health benefits to employees through a self-insurance plan administered through United Health Care. Dental insurance is provided by the School District to all employees through a self-insurance plan administered through Delta Dental. Deferred Compensation School District employees may participate in the ING Financial, VALIC or Ohio Public Employees Deferred Compensation plans in accordance with Internal Revenue Code Section 457. The employees may also participate in a qualified annuity plan, sponsored by multiple providers, in accordance with Internal Revenue Code Section 403(b). Participation is on a voluntary payroll deduction basis. The plans permit deferral of compensation until future years. According to the plans, the deferred compensation is not available until termination, retirement, death or an unforeseeable emergency.
52

Springfield City School District Notes to the Basic Financial Statements For the Fiscal Year Ended June 30, 2017
NOTE 13 - LEASES - LESSEE DISCLOSURE During fiscal year 2017, the School District cancelled the capital lease that was entered into in fiscal year 2013 in order to enter into a new capital lease for copiers. The lease meets the criteria of a capital lease as the benefits and risks of ownership have transferred to the School District. Capital lease payments have been reclassified and are reflected as debt service expenditures in the basic financial statements for the governmental funds. These expenditures are reflected as program/function expenditures on a budgetary basis. Capital assets acquired by the 2017 lease are capitalized in the amount of $489,449, which is equal to the present value of the minimum lease payments at the time of acquisition. A corresponding liability was recorded on the Statement of Net Position for governmental activities. Principal payments in fiscal year 2017 on the new lease totaled $33,133 and were paid from the General Fund. Principal payments in fiscal year 2017 on the old fiscal year 2013 lease totaled $49,475 and were also paid from the General Fund. The balance remaining on the fiscal year 2013 lease of $165,568 was removed in conjunction with the removal of the net book value of the copiers of $104,577. The assets acquired through capital leases as of June 30, 2017, are as follows:
Asset Value
Accumulated Depreciation
Net Book Value
Furniture and Equipment 489,449$ (40,791)$ 448,658$
The following is a schedule of the future long-term minimum lease payments required under the capital leases and the present value of the minimum lease payments as of June 30, 2017:
Year Amount2018 100,200 2019 100,200 2020 100,200 2021 100,200 2022 100,200 2023 8,350
509,350 Less: Amount representing interest (53,034) Total Present value of minimum lease payments 456,316$
53

Springfield City School District Notes to the Basic Financial Statements For the Fiscal Year Ended June 30, 2017
NOTE 14 - LONG-TERM OBLIGATIONS The changes in the School District’s long-term obligations during fiscal year 2017 were as follows:
Balance Balance Due WithinJune 30, 2016 Additions Deductions June 30, 2017 One Year
Government Activities:2006 Various Purpose Refunding Bond Serial Bonds (4.00% - 4.60%) 14,140,000 - (14,140,000) - - Capital Appreciation Bonds (4.25% - 4.30%) 2,014,095 - - 2,014,095 - Accretion on Capital Appreciation Bonds 2,114,078 178,349 - 2,292,427 - Bond Premium 761,570 - (761,570) - -
2010 Energy Conservation Notes (5.9%) 660,000 - (65,000) 595,000 65,000
2013 School Facility Construction Bonds Serial Bonds (2.00% - 4.00%) 5,650,000 - (235,000) 5,415,000 240,000 Bond Premium 185,202 - (16,837) 168,365 -
2016 Various Purpose Refunding Bond Serial Bonds (1.25% - 4.00%) - 11,675,000 - 11,675,000 2,170,000 Bond Premium - 800,859 (104,460) 696,399 -
Net Pension Liability State Teachers Retirement System 100,999,349 26,561,073 - 127,560,422 - School Employees Retirement System 20,718,393 6,938,354 - 27,656,747 -
Capital Lease 215,043 489,449 (248,176) 456,316 82,003
Compensated Absences 5,256,261 1,622,159 (1,259,589) 5,618,831 1,326,596 Total Governmental Activities Long Term Obligations 152,713,991$ 48,265,243$ (16,830,632)$ 184,148,602$ 3,883,599$
Annual debt service requirements to maturity for governmental long-term obligations are:
Capital Capital Fiscal Serial Bond Serial Bond Appreciation AppreciationYear Principal Interest Bond Principal Bond Interest Total
2018 2,410,000 535,213 - - 2,945,213 2019 2,495,000 441,963 - - 2,936,963 2020 2,590,000 357,713 - - 2,947,713 2021 2,670,000 268,813 - - 2,938,813 2022 2,770,000 189,013 - - 2,959,013
2023-2027 4,155,000 525,119 2,014,095 3,535,905 10,230,119 17,090,000$ 2,317,834$ 2,014,095$ 3,535,905$ 24,957,834$
The School District’s overall legal debt margin was $38,221,341 with an unvoted debt margin of $609,123 and an Energy Conservation debt margin of $4,887,111 at June 30, 2017.
54

Springfield City School District Notes to the Basic Financial Statements For the Fiscal Year Ended June 30, 2017
NOTE 14 - LONG-TERM OBLIGATIONS (continued) 2006 Various Purpose Refunding Bonds - On December 21, 2006, the School District issued bonds for the purpose of advance refunding the $19,890,000 outstanding 2001 Classroom Facilities Assistance General Obligation Term Bonds. The serial bonds, issued at $17,875,000, maturing on December 1, 2007 to December 1, 2021, are subject to optional redemption. Bonds maturing on December 1, 2016 and thereafter are subject to optional redemption, in whole or in part on any date and by lot within a maturity, at the option of the School District on or after December 1, 2016 at par plus accrued interest to the date of redemption. The capital appreciation bonds, issued at $2,014,095, are not subject to prior redemption. The capital appreciation bonds will mature in fiscal years 2023 and 2024. The maturity amounts of the capital appreciation bonds are $2,775,000 in fiscal years 2023 and 2024. Accretion on the capital appreciation bonds for fiscal year 2017 was $178,349. 2013 School Facility Construction Bonds – On September 12, 2013, the School District issued $5,880,000 of School Facilities Construction and Improvement Bonds for the purpose of renovating, improving, refurbishing and maintaining existing school facilities; furnishing and equipping the same; acquiring school buses; and upgrading and improving technology and building security. The bonds were issued for an 11 year period and will be retired from the Debt Service fund. 2016 Refunding Bonds - On September 22, 2016, the School District issued refunding bonds in the amount of $11,675,000 for the redemption of the outstanding serial bonds of the 2006 Various Purpose Refunding Bonds. As a result, the serial bonds are considered to be defeased and the liability for those bonds has been removed from the Statement of Net Position. The purpose of the refunding was to reduce the School District’s total debt service payments through fiscal year 2027 and to obtain an economic gain of $1.29 million. The bonds were issued for a five year period and will be retired from the Debt Service fund. 2010 Energy Conservation Notes - On December 21, 2010, the School District issued $985,000 in Energy Conservation Notes, Series 2010 (Taxable Qualified School Construction Bonds), for the purpose of making energy conservation improvements to the School District’s various buildings. The notes were issued for a 15 year period. The federal government is expected to subsidize the interest on the notes by reimbursing the School District for 95 percent of the interest payments made. The notes will be retired from the General Fund. The School District will make annual principal payments, with the first payment due on December 1, 2011 and the final payment on December 1, 2025 as follows:
Fiscal InterestYear Principal Interest Subsidy
2018 65,000$ 32,400$ 30,881$ 2019 65,000 25,656 27,313 2020 65,000 24,912 23,744 2021 65,000 21,168 20,176 2022 65,000 17,424 16,607
2023-2026 270,000 31,680 30,195 595,000$ 153,240$ 148,916$
55

Springfield City School District Notes to the Basic Financial Statements For the Fiscal Year Ended June 30, 2017
NOTE 14 - LONG-TERM OBLIGATIONS (continued) The notes are subject to extraordinary optional redemption by the School District prior to maturity, in whole at any time or in any part on any interest date, at a redemption price of 100 percent, plus interest accrued to date fixed for redemption in the event that the subsidy payments from the federal government cease or are in an amount less than the lesser of (i) of the interest payable under such bond or (ii) the amount of interest which would have been payable under such bond if interest were determined at the applicable credit rate determined under Section 54A(b)(3) of the Code with respect to such bond. Capital leases will be paid from the General Fund. Compensated absences and net pension liability will be paid from the General Fund and the Food Service, Mental Health – Early Start, School Age Childcare/After School Enrichment, Auxiliary Services, Early Childhood Education, Miscellaneous State Grants, Adult Basic Education, Race to the Top, Special Education Part B-IDEA, Title I School Improvement, Title I, Preschool Grant, Title VI-R, and Miscellaneous Federal Grants Special Revenue Funds. NOTE 15 - INTERFUND ACTIVITY Transfers made during the fiscal year ended June 30, 2017, were as follows:
Transfer In Transfer OutPermanent Improvement $ 1,700,000 - General Fund - 1,730,000 District Managed Student Activities 30,000 -
$ 1,730,000 1,730,000
The transfer from the General Fund to the Permanent Improvement Fund is to provide continuing funds for future capital improvements and the transfer to the District Managed Student Activity Fund was to make the fund whole as a result of suspending pay to participate fees. Interfund balances at June 30, 2017, consist of the following interfund receivables and payables:
Fund Due To Fund Due From AmountGeneral Fund Permanent Improvement 847,000$
General Fund advances are made to move unrestricted balances to support programs and projects accounted for in other funds. Advancing monies to other funds is necessary due to timing differences in the receiving of grant monies and pledged donations. When the grant monies and donations are finally received, those restricted monies will be used to reimburse the General Fund for the initial advance.
56

Springfield City School District Notes to the Basic Financial Statements For the Fiscal Year Ended June 30, 2017
NOTE 16 - JOINTLY GOVERNED ORGANIZATIONS Clark County Family and Children First Council The School District participates in the Clark County Family and Children First Council. The Council coordinates and integrates services within Clark County, which are available for families and children, and establishes a comprehensive, coordinated, multi-disciplinary, interagency system for the delivery of such services in order to more effectively meet the needs of families and children. A board of 18 trustees, one of which is the Superintendent of the Springfield City School District, governs the Council. During fiscal year 2017, the School District paid $10,335 to the Council. Financial information can be obtained from Leslie Crew, Executive Director, at 1345 Lagonda Ave, Springfield, Ohio 45501. Southwestern Ohio Educational Purchasing Council The Southwestern Ohio Educational Purchasing Council (SOEPC) is a purchasing council made up of nearly 100 school districts in 12 counties. The purpose of the cooperative is to obtain prices for quality merchandise and services commonly used by schools. All member districts are obligated to pay all fees, charges, or other assessments as established by the SOEPC. Each member district has one voting representative. Title to any and all equipment, furniture, and supplies purchased by the SOEPC is held in trust for the member district. Any district withdrawing from SOEPC forfeits its claim to any and all SOEPC assets. One year prior notice is necessary for withdrawal from the SOEPC. During this time, the withdrawing member is liable for all member obligations. Payments to SOEPC are made from the General Fund. The School District made no financial contributions to the SOEPC during fiscal year 2017. To obtain financial information, write to the Southwestern Ohio Educational Purchasing Council, Ken Swink, who serves as Director, at 303 Corporate Center Drive, Suite 208, Vandalia, Ohio 45377. Springfield-Clark Career Technology Center Springfield-Clark Career Technology Center is a distinct political subdivision of the State of Ohio operated under the direction of a Board consisting of one or two representatives from each of the eight participating school districts’ and educational service centers’ elected boards, which possesses its own budgeting and taxing authority. One member is appointed from the following: Clark-Shawnee Local School District, Greenon Local School District, Northeastern Local School District, Northwestern Local School District, Southeastern Local School District, Tecumseh Local School District, and the Clark County Educational Service Center. Two members are appointed from the Springfield City School District. The School District makes payments to the Career Technology Center through direct deductions by the Ohio Department of Education from the School District’s State funding. To obtain financial information, write to the Springfield-Clark Career Technology Center, Steve Clark, who serves as Treasurer, at 1901 Selma Road, Springfield, Ohio 45505-4329.
57

Springfield City School District Notes to the Basic Financial Statements For the Fiscal Year Ended June 30, 2017
NOTE 17 - INSURANCE PURCHASING POOL Ohio SchoolComp Group Retrospective Rating Program The School District participates in the Ohio SchoolComp Group Retrospective Rating Program (GRRP), an insurance purchasing pool. The GRRP’s business and affairs are conducted by a five member Board of Directors. Each fiscal year, the participants pay an enrollment fee to CompManagement, Inc. to cover the costs of administering the program. Ohio School Plan The School District participates in the Ohio School Plan (OSP), an insurance purchasing pool. The OSP was created and organized pursuant to and as authorized by Section 2744.081 of the Ohio Revised Code. The OSP is an unincorporated, non-profit association of its members and an instrumentality for each member for the sole purpose of enabling members of the OSP to provide for a formalized, jointly administered self-insurance program to maintain adequate insurance protection, risk management programs and other administrative services. The OSP’s business and affairs are conducted by a 13 member Board of Directors consisting of school district superintendents and treasurers. The OSP has an agreement with Hylant Administrative Services, LLC to provide underwriting, claims management, risk management, accounting, system support services, sales and marketing for the OSP. Hylant Administrative Services, LLC also coordinates reinsurance brokerage services for the OSP. NOTE 18 - SET-ASIDES The School District is required by State statute to annually set aside, in the General Fund, an amount based on a statutory formula for the acquisition and construction of capital improvements. Amounts not spent by fiscal year-end or offset by similarly restricted resources received during the fiscal year must be held in cash at fiscal year-end and carried forward to be used for the same purposes in future fiscal years. The following cash basis information describes the change in the fiscal year-end set-aside amounts for capital improvements. Disclosure of this information is required by State statute.
CapitalAcquisition
Set-aside Cash Balance as of June 30, 2016 -$ Current Year Set-aside Requirement 1,352,720 Current Year Off-Sets (1,352,720) Total -$
Balance Carried Forward to FY 2018 -$
Amounts of offsets and qualifying disbursements presented in the table for capital improvements were limited to those necessary to reduce the fiscal year-end balance to zero. Although the School District may have had additional offsets and qualifying disbursements for capital improvements during the fiscal year, this extra amount may not be used to reduce the set-aside requirements of future fiscal years.
58

Springfield City School District Notes to the Basic Financial Statements For the Fiscal Year Ended June 30, 2017
NOTE 19 – COMMITMENTS At June 30, 2017, the School District had the following significant outstanding encumbrances:
General Fund 1,439,707$ Permanent Improvement Fund 1,313,518 Food Service Fund 429,253 Total 3,182,478$
NOTE 20 - FUND BALANCES Fund balance is classified as nonspendable, restricted, committed, assigned and/or unassigned based primarily on the extent to which the School District is bound to observe constraints imposed upon the use of the resources in the governmental funds. The constraints placed on fund balance for the major governmental funds and all other governmental funds are presented below:
Bond OtherGeneral Retirement Building Governmental Total
Restricted for:Debt Service -$ 5,661,513$ -$ -$ 5,661,513$ Food Service Operations - - - 2,254,057 2,254,057 Classroom Facilities Maintenance - - - 2,571,136 2,571,136 District Managed Activities - - - 230,903 230,903 Auxiliary Services - - - 23,150 23,150 Title Programs - - - 110,577 110,577 Other Purposes - - - 164,768 164,768 Capital Improvements - - 18,443 2,840,547 2,858,990
Total Restricted - 5,661,513 18,443 8,195,138 13,875,094
Committed to:Underground Storage 11,000 - - - 11,000 School Age Child Care - - - 93,337 93,337
Total Committed 11,000 - - 93,337 104,337
Assigned to:Purchases on Order 1,151,977 - - - 1,151,977 Student Activities 157,503 - - - 157,503
Total Assigned 1,309,480 - - - 1,309,480
Unassigned (Deficit) 27,966,186 - - (115,943) 27,850,243
Total Fund Balances 29,286,666$ 5,661,513$ 18,443$ 8,172,532$ 43,139,154$
Fund Balances
59

Springfield City School District Notes to the Basic Financial Statements For the Fiscal Year Ended June 30, 2017
NOTE 21 - CONTINGENCIES Grants The School District received financial assistance from federal and State agencies in the form of grants. The expenditure of funds received under these programs generally requires compliance with terms and conditions specified in the grant agreements and is subject to audit by the grantor agencies. Any disallowed claims resulting from such audits could become a liability of the General Fund or other applicable funds. However, the effect of any such disallowed claims on the overall financial position of the School District at June 30, 2017, if applicable, cannot be determined at this time. Litigation The School District is party to legal proceedings. The School District is of the opinion that ultimate disposition of claims will not have a material effect, if any, on the financial condition of the School District. Full-Time Equivalency Review State Foundation funding is based on the annualized full-time equivalent (FTE) enrollment of each student. Effective for the 2014-2015 school year, traditional school districts were required to comply with minimum hours of instruction, instead of a minimum number of school days each year. The funding formula the Ohio Department of Education (ODE) is legislatively required to follow will continue to adjust as enrollment information is updated by the school district, which can extend past the fiscal year. As of the date of this report, ODE has not finalized the impact of the of enrollment adjustments to the Foundation funding for the School District for fiscal year 2017; however based on information currently available, management does not believe the results of that review will have a material effect on the School District’s financial statement. NOTE 22 – TAX ABATEMENTS Government Accounting Standards Board (GASB) Statement No. 77, Tax Abatement Disclosures, requires disclosures about certain tax abatements resulting from both (a) agreements that are entered into by the reporting government and (b) agreements that are entered into by other governments that reduce the reporting government’s tax revenues. The School District’s property tax revenues were reduced by $120,138 under agreements entered into by the City of Springfield. NOTE 23 – CHANGE IN ACCOUNTING PRINCIPLE For fiscal year 2017, the School District implemented the Governmental Accounting Standards Board (GASB) Statements No. 74, Financial Reporting for Postemployment Benefit Plans Other than Pension Plans, No. 77, Tax Abatement Disclosures, No. 78, Pension Plans provided through Certain Multi-Employer Defined Benefit Plans, No. 80, Blending Requirements for Certain Component Units and No. 82, Pension Issues – an amendment of GASB Statements No.67, No. 68 and No. 73. GASB Statement No. 74 enhances the note disclosures and required supplementary information schedules required by OPEB plans that are administered through trusts that meet the specified criteria. The implementation of this Standard had no effect on the School District’s financial statements.
60

Springfield City School District Notes to the Basic Financial Statements For the Fiscal Year Ended June 30, 2017
NOTE 23 – CHANGE IN ACCOUNTING PRINCIPLE(continued) GASB Statement No. 77 requires disclosures that provide users with information concerning the government’s tax abatement programs, including nature and magnitude, which will provide information on ability to raise resources and the impact abatement programs have on the financial position of the government. The implementation of this Standard had no effect on the School District’s beginning net position. GASB Statement No. 78 amends the scope and applicability of GASB Statement No. 68 to exclude certain pensions provided to employees of governmental employers through cost-sharing multiple-employer defined benefit plans that meet certain specified criteria. The implementation of this Standard had no effect on the School District’s financial statements. GASB Statement No. 80 amends the blending requirements of GASB Statement No. 14 to include blending of a component unit, incorporated as a not-for-profit corporation, in which the reporting government is the sole corporate member. The implementation of this Standard had no effect on the School District’s financial statements. GASB Statement No. 82 improves financial reporting by enhancing consistency in the application of financial reporting requirements related to certain pension issues, including presentation of payroll-related measures in RSI, selection of assumptions, and classification of employer-paid member contributions. The implementation of this Standard had no effect on the School District’s beginning net position. It should also be noted that in June 2015, the GASB issued statement No. 75, Accounting and Financial Reporting for Postemployment Benefits Other Than Pensions, which will require the reporting entity to recognize on the face of the financial statements, its proportionate share of the net OPEB liability related to its participation in the School Employees Retirement System (SERS) and the State Teachers Retirement System (STRS). This Standard also enhances accountability and transparency through revised note disclosures and required supplementary information. The provisions of this Standard is required to be implemented for reporting periods beginning after June 15, 2017. The School District has not early implemented GASB Statement No. 75 and is currently in the process of evaluating the impact this Standard will have on its financial statements.
61

Springfield City School DistrictRequired Supplementary Information
Schedule of the School District's Proportionate Share of the Net Pension LiabilityLast Four Fiscal Years (1)
2016 2015 2014 2013
School District's Proportion of the Net Pension Liability 0.377872% 0.363092% 0.366736% 0.366736%
School District's Proportionate Share of the Net Pension Liability 27,656,747$ 20,718,393$ 18,560,300$ 21,808,613$
School District's Covered-Employee Payroll 11,735,300$ 11,611,047$ 10,764,257$ 9,634,292$
School District's Proportionate Share of the Net Pension Liability as apercentage of its Covered-Employee Payroll 235.67% 178.44% 172.43% 226.36%
Plan Fiduciary Net Position as a Percentage of the Total Pension 62.98% 69.16% 71.70% 65.52%Liability
School District's Proportion of the Net Pension Liability 0.38108436% 0.36544876% 0.36025825% 0.36025825%
School District's Proportionate Share of the Net Pension Liability 127,560,422$ 100,999,349$ 87,627,274$ 104,381,036$
School District's Covered-Employee Payroll 40,097,400$ 38,128,457$ 39,639,862$ 37,119,969$
School District's Proportionate Share of the Net Pension Liability as apercentage of its Covered-Employee Payroll 318.13% 264.89% 221.06% 281.20%
Plan Fiduciary Net Position as a Percentage of the Total Pension 66.80% 72.10% 74.70% 69.30%Liability
(1) The School District is required to present information for a ten year period, however, information prior to 2013 is not available.
School Employees Retirement System of Ohio
State Teachers Retirement System of Ohio
62

Springfield City School DistrictRequired Supplementary Information
Schedule of School District's ContributionsLast Eight Fiscal Years (1)
2017 2016 2015 2014 2013 2012 2011 2010
Contractually Required Contribution 1,754,659$ 1,642,942$ 1,530,336$ 1,491,926$ 1,333,386$ 1,273,481$ 1,162,928$ 1,421,793$
Contributions in Relation to the ContractuallyRequired Contribution (1,754,659) (1,642,942) (1,530,336) (1,491,926) (1,333,386) (1,273,481) (1,162,928) (1,421,793)
Contribution Deficiency (Excess) -$ -$ -$ -$ -$ -$ -$ -$
School District Covered-Employee Payroll 12,533,279$ 11,735,300$ 11,611,047$ 10,764,257$ 9,634,292$ 9,468,260$ 9,251,615$ 10,500,687$
Contributions as a Percentage of School District Covered-Employee Payroll 14.00% 14.00% 13.18% 13.86% 13.84% 13.45% 12.57% 13.54%
Contractually Required Contribution 5,999,893$ 5,613,636$ 5,337,984$ 5,153,182$ 4,825,596$ 4,925,937$ 4,681,903$ 4,566,512$
Contributions in Relation to the ContractuallyRequired Contribution (5,999,893) (5,613,636) (5,337,984) (5,153,182) (4,825,596) (4,925,937) (4,681,903) (4,566,512)
Contribution Deficiency (Excess) -$ -$ -$ -$ -$ -$ -$ -$
School District Covered-Employee Payroll 42,856,379$ 40,097,400$ 38,128,457$ 39,639,862$ 37,119,969$ 37,891,823$ 36,014,638$ 35,127,015$
Contributions as a Percentage of School District Covered-Employee Payroll 14.00% 14.00% 14.00% 13.00% 13.00% 13.00% 13.00% 13.00%
(1) The School District is required to present information for a ten year period, however, information prior to 2010 is not available.
School Employees Retirement System of Ohio
State Teachers Retirement System of Ohio
63

64

Springfield City School District Combining and Individual Fund Statements and Schedules
65

Springfield City School District
Nonmajor Governmental Fund Descriptions
NONMAJOR SPECIAL REVENUE FUNDS Special Revenue Funds are established to account for and report the proceeds of specific revenue sources that are restricted or committed to expenditure for specified purposes other than debt or capital projects. The following are descriptions of the School District’s nonmajor special revenue funds. Food Service To account for and report monies restricted to the food service operations of the School District. Mental Health/Early Start To account for and report revenues and expenditures restricted in conjunction with programs entered into with the Boards of Mental Health and Developmental Disabilities of Clark County. Other Grants To account for and report the proceeds of restricted revenue sources, except for State and federal grants that are legally restricted to expenditures for specified purposes. School Age Childcare/After School Enrichment To account for and report the revenues and expenditures committed for after-school care and instructional services to students whose parents are not at home when the student gets out of school. Basic Education Foundation A fund used to account for and report restricted donations that are used to recognize student and staff achievements. Ohio School Facilities Classroom Maintenance To account for and report the revenues restricted to expenditures for the maintenance and upkeep of School District classroom facilities. District Managed Student Activities To account for and report the revenues and expenditures restricted for student activity programs which have student participation in the activity, but are not student managed programs. Auxiliary Services To account for and report restricted monies which provide services and materials to pupils attending non-public schools within the School District.
(continued)
66

NONMAJOR SPECIAL REVENUE FUNDS (continued)
Early Childhood Education To account for and report restricted monies used to assist school districts in paying the cost of preschool programs for three and four year-olds. Data Communications To account for and report restricted monies for Ohio Educational Computer Network connections. Alternative Schools To account for and report restricted monies used to provide alternative educational programs for existing and new at-risk and delinquent youth. Programs focus on youth that have been expelled or suspended, have dropped out of school, are at risk of dropping out of school, are habitually truant or disruptive, or are on probation or on parole from a Department of Youth Services facility. Straight A Grant To account for and report restricted monies used to implement initiatives identified in the Straight A Grant proposal. The initiatives focus on expanding the School District’s college and career readiness system and making it available to more staff and students; adding a deliberate focus on developing soft skills and habits that are required for success in college, career and life; renovating a school building that was no longer being used to better meet the purpose of a location for educational tenants, a center for professional development and a dedicated space for student skill development and career exploration. Miscellaneous State Grants To account for and report various restricted state monies received from state agencies which are not classified elsewhere Adult Basic Education To account for and report restricted monies used for planning and conducting programs for persons 16 years of age and older who are not enrolled in secondary school and who have less than a twelfth grade education or its equivalent; development of basic educational skills; or do not have a secondary school diploma or its recognized equivalent, and have not achieved an equivalent level of education, or are unable to speak, read, or write the English language. Race to the Top To account for and report restricted monies that provide for either a new program or expansion of an existing program to support initiatives in the following areas: Standards and Assessments; Using Data to Improve Instruction; Great Teachers and Leaders; and Turning Around the Lowest-Achieving School.
(continued)
67

NONMAJOR SPECIAL REVENUE FUNDS (continued)
Title VI-B Special Education Part B - IDEA To account for and report restricted federal monies used to offer full educational opportunities to handicapped children at the preschool, elementary and secondary levels, and to assist in the training of teachers, supervisors and other specialists in providing educational services to the handicapped. Title I – School Improvement, Stimulus A To account for and report restricted federal monies allocated from the American Recovery and Reinvestment Act to Ohio for distribution to school districts based on four distinct funding formulas as affected by census poverty data. The funding is to provide supplemental funding to economically disadvantaged school districts and some of their eligible schools for improving educational outcomes for students who are failing or at risk of failing to meet State standards. Title III – Limited English Proficiency To account for and report restricted monies used to develop and carry out elementary and secondary school programs, including activities at the preschool level, to meet the educational needs of children of limited English proficiency. Title I To account for and report restricted financial assistance to meet the special needs of educationally deprived children. Preschool Grant To account for and report restricted federal monies used to support preschool improvement and expansion of services for handicapped children ages three through five years. Title VI-R To account for and report restricted monies received from the Preschool Grant Program, Section 619 of Public Law 99-457, which addresses the improvement and expansion of services for handicapped children ages three through five years.
Miscellaneous Federal Grants To account for and report various restricted federal monies received from federal agencies which are not classified elsewhere.
68

NONMAJOR CAPITAL PROJECTS FUNDS
The Capital Projects Funds are established to account for and report financial resources that are restricted to expenditure for capital outlays, including the acquisition or construction of capital facilities and other, committed or assigned capital assets. Capital projects funds exclude those types of capital-related outflows financed by proprietary funds or for assets that will be held in trust for individuals, private organization, or other governments. The following are descriptions of each Capital Projects Fund. Permanent Improvement To account for and report all restricted transactions relating to the acquiring, constructing, or improving facilities within the School District.
FUNDS WITH LEGALY ADOPTED BUDGETS The following funds have been combined with the General Fund for reporting purposes but have legally adopted budgets as a nonmajor special revenue fund. Public School Support To account for special local revenue sources, other than taxes and permanent fund monies (i.e., profits from vending machines, sales of pictures, etc.) that are restricted to specified purposes approved by Board resolution Underground Storage Tank To account for the underground storage tank money as required by Ohio Administrative Code.
69

Springfield City School DistrictCombining Balance Sheet
Nonmajor Governmental FundsJune 30, 2017
PermanentNonmajor Improvement TotalSpecial Capital NonmajorRevenue Projects Governmental
Funds Fund Funds
Assets:Equity in Pooled Cash, Cash Equivalents and Investments 5,864,027$ 3,558,197$ 9,422,224$ Receivables: Property Taxes 313,848 944,848 1,258,696 Intergovernmental 2,289,218 - 2,289,218
Total Assets 8,467,093$ 4,503,045$ 12,970,138$
Liabilities:Accounts Payable 209,244$ 2,805$ 212,049$ Accrued Wages and Benefits Payable 857,161 - 857,161 Intergovernmental Payable 259,607 - 259,607 Interfund Payable - 847,000 847,000
Total Liabilities 1,326,012 849,805 2,175,817
Deferred Inflows of Resources:Unavailable Revenue 1,595,661 179,518 1,775,179 Property Taxes Not Levied for Current Year 213,435 633,175 846,610
Total Deferred Inflows of Resources 1,809,096 812,693 2,621,789
Fund Balances:Restricted 5,354,591 2,840,547 8,195,138 Committed 93,337 - 93,337 Unassigned (Deficit) (115,943) - (115,943)
Total Fund Balances 5,331,985 2,840,547 8,172,532
Total Liabilities, Deferred Inflows of Resources and Fund Balances 8,467,093$ 4,503,045$ 12,970,138$
70

Springfield City School DistrictCombining Statement of Revenues, Expenditures and Changes in Fund Balances
Nonmajor Governmental FundsFor the Fiscal Year Ended June 30, 2017
PermanentNonmajor Improvement Total
Special Capital NonmajorRevenue Projects Governmental
Funds Fund FundsRevenues:Property Taxes 234,918$ 668,288$ 903,206$ Intergovernmental 16,273,941 96,176 16,370,117 Investment Earnings 20,685 13,027 33,712 Tuition and Fees 373,513 - 373,513 Extracurricular Activities 376,795 - 376,795 Charges for Services 692,153 - 692,153 Contributions and Donations 28,755 1,500 30,255 Miscellaneous 54,773 - 54,773
Total Revenues 18,055,533 778,991 18,834,524
Expenditures:Current: Instruction: Regular 68,754 48,979 117,733 Special 4,207,829 - 4,207,829 Adult/Continuing 64,529 - 64,529 Student Intervention Services 993,204 - 993,204 Other 168,122 - 168,122 Support Services: Pupils 730,707 1,482 732,189 Instructional Staff 2,857,966 11,712 2,869,678 Administration 593,556 29,167 622,723 Fiscal 325,005 14,553 339,558 Operation and Maintenance of Plant 443,466 111,341 554,807 Pupil Transportation 3,796 236,800 240,596 Central 78,904 217,111 296,015 Operation of Non-Instructional Services 6,915,680 16,033 6,931,713 Extracurricular Activities 473,146 51,381 524,527 Capital Outlay - 2,544,419 2,544,419
Total Expenditures 17,924,664 3,282,978 21,207,642
Excess of Revenues Over (Under) Expenditures 130,869 (2,503,987) (2,373,118)
Other Financing Sources (Uses):Transfers In 30,000 1,700,000 1,730,000
Net Change in Fund Balances 160,869 (803,987) (643,118)
Fund Balances at Beginning of Year 5,171,116 3,644,534 8,815,650
Fund Balances at End of Year 5,331,985$ 2,840,547$ 8,172,532$
71

Springfield City School DistrictCombining Balance Sheet
Nonmajor Special Revenue FundsJune 30, 2017
School AgeMental Childcare/
Food Health/ Other After SchoolService Early Start Grants Enrichment
Assets:Equity in Pooled Cash, Cash Equivalents and Investments 2,391,737$ 40,423$ 49,658$ 122,184$ Receivables: Property Taxes - - - - Intergovernmental 33,296 26,946 - 1,043
Total Assets 2,425,033$ 67,369$ 49,658$ 123,227$
Liabilities:Accounts Payable 56,885$ 427$ 2,911$ 205$ Accrued Wages and Benefits Payable 62,108 6,664 - 15,537 Intergovernmental Payable 18,687 9,726 714 14,148
Total Liabilities 137,680 16,817 3,625 29,890
Deferred Inflows of Resources:Unavailable Revenue 33,296 - - - Property Taxes Not Levied for Current Year - - - -
Total Deferred Inflows of Resources 33,296 - - -
Fund Balances: Restricted 2,254,057 50,552 46,033 - Committed - - - 93,337 Unassigned (Deficit) - - - -
Total Fund Balances (Deficit) 2,254,057 50,552 46,033 93,337
Total Liabilities, Deferred Inflows of Resources and Fund Balances 2,425,033$ 67,369$ 49,658$ 123,227$
72
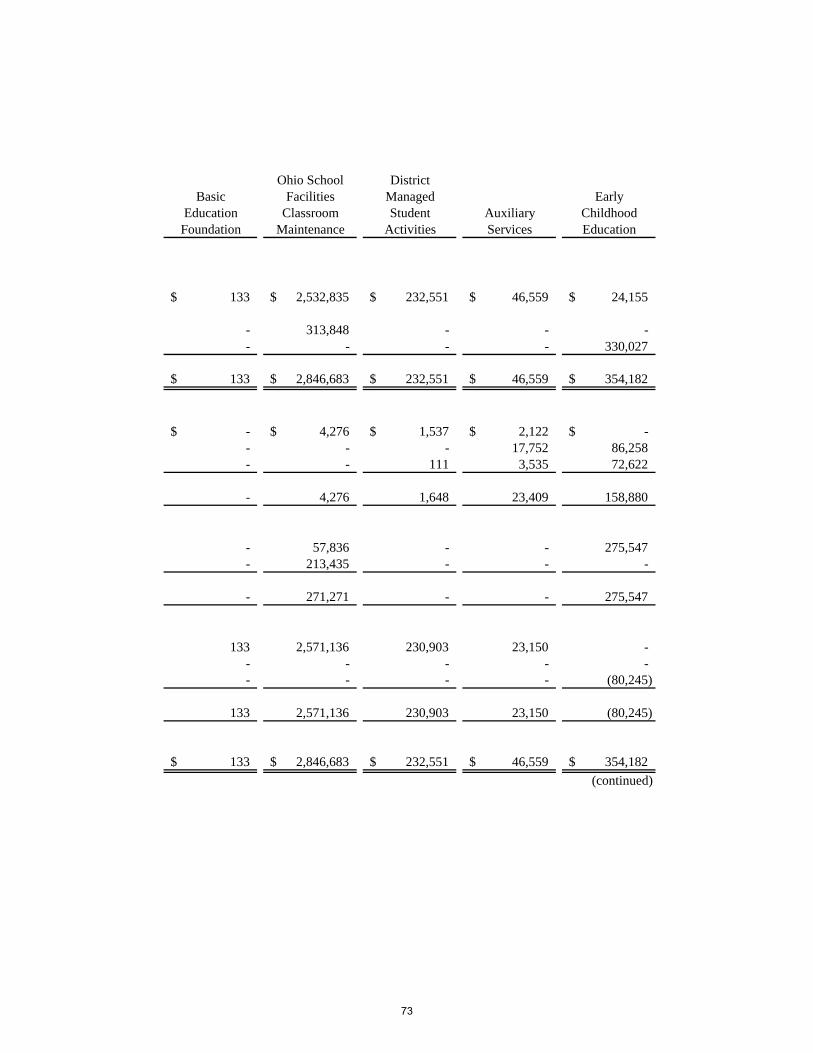
Ohio School DistrictBasic Facilities Managed Early
Education Classroom Student Auxiliary ChildhoodFoundation Maintenance Activities Services Education
133$ 2,532,835$ 232,551$ 46,559$ 24,155$
- 313,848 - - - - - - - 330,027
133$ 2,846,683$ 232,551$ 46,559$ 354,182$
-$ 4,276$ 1,537$ 2,122$ -$ - - - 17,752 86,258 - - 111 3,535 72,622
- 4,276 1,648 23,409 158,880
- 57,836 - - 275,547 - 213,435 - - -
- 271,271 - - 275,547
133 2,571,136 230,903 23,150 - - - - - - - - - - (80,245)
133 2,571,136 230,903 23,150 (80,245)
133$ 2,846,683$ 232,551$ 46,559$ 354,182$ (continued)
73

Data Alternative Straight A MiscellaneousCommunications Schools Grant State Grants
Assets:Equity in Pooled Cash, Cash Equivalents and Investments 10,527$ 9,239$ 100,058$ 637$ Receivables: Property Taxes - - - - Intergovernmental - 10,430 69,675 3,109
Total Assets 10,527$ 19,669$ 169,733$ 3,746$
Liabilities:Accounts Payable -$ 6,545$ 35,393$ -$ Accrued Wages and Benefits Payable - - 10,800 3,750 Intergovernmental Payable - 187 5,534 579
Total Liabilities - 6,732 51,727 4,329
Deferred Inflows of Resources:Unavailable Revenue - 10,430 69,675 - Property Taxes Not Levied for Current Year - - - -
Total Deferred Inflows of Resources - 10,430 69,675 -
Fund Balances: Restricted 10,527 2,507 48,331 - Committed - - - - Unassigned (Deficit) - - - (583)
Total Fund Balances (Deficit) 10,527 2,507 48,331 (583)
Total Liabilities, Deferred Inflows of Resources and Fund Balances 10,527$ 19,669$ 169,733$ 3,746$
Springfield City School DistrictCombining Balance Sheet
Nonmajor Special Revenue FundsJune 30, 2017(Continued)
74

Title VI-BAdult Special Title I - School Title III -Basic Race to Education Improvement, Limited English
Education the Top Part B - IDEA Stimulus A Proficiency Title I
3,128$ 789$ 46,903$ 6,223$ 1,087$ 198,850$
- - - - - - 18,268 - 479,481 96,105 35,772 1,126,514
21,396$ 789$ 526,384$ 102,328$ 36,859$ 1,325,364$
-$ -$ 3,068$ 54,536$ 195$ 24,217$ 13,239 - 159,383 - - 390,769
3,135 - 37,405 350 - 80,174
16,374 - 199,856 54,886 195 495,160
1,592 - 327,991 44,978 35,772 722,983 - - - - - -
1,592 - 327,991 44,978 35,772 722,983
3,430 789 - 2,464 892 107,221 - - - - - - - - (1,463) - - -
3,430 789 (1,463) 2,464 892 107,221
21,396$ 789$ 526,384$ 102,328$ 36,859$ 1,325,364$ (continued)
75

Springfield City School DistrictCombining Balance Sheet
Nonmajor Special Revenue FundsJune 30, 2017(Continued)
TotalNonmajor
Miscellaneous SpecialPreschool Federal Revenue
Grant Title VI-R Grants Funds
Assets:Equity in Pooled Cash, Cash Equivalents and Investments 2,182$ 25,659$ 18,510$ 5,864,027$ Receivables: Property Taxes - - - 313,848 Intergovernmental 11,037 40,047 7,468 2,289,218
Total Assets 13,219$ 65,706$ 25,978$ 8,467,093$
Liabilities:Accounts Payable -$ -$ 16,927$ 209,244$ Accrued Wages and Benefits Payable 4,760 86,141 - 857,161 Intergovernmental Payable 735 11,965 - 259,607
Total Liabilities 5,495 98,106 16,927 1,326,012
Deferred Inflows of Resources:Unavailable Revenue 8,976 - 6,585 1,595,661 Property Taxes Not Levied for Current Year - - - 213,435
Total Deferred Inflows of Resources 8,976 - 6,585 1,809,096
Fund Balances: Restricted - - 2,466 5,354,591 Committed - - - 93,337 Unassigned (Deficit) (1,252) (32,400) - (115,943)
Total Fund Balances (Deficit) (1,252) (32,400) 2,466 5,331,985
Total Liabilities, Deferred Inflows of Resources and Fund Balances 13,219$ 65,706$ 25,978$ 8,467,093$
76

77

School AgeMental Childcare/
Food Health/ Other After SchoolService Early Start Grants Enrichment
Revenues:Property Taxes -$ -$ -$ -$ Intergovernmental 4,909,160 382,423 95,454 30,975 Investment Earnings 16,828 - - 920 Tuition and Fees - - 545 372,968 Extracurricular Activities - - - - Charges for Services 692,153 - - - Contributions and Donations - - 1,000 - Miscellaneous 40,114 4,836 - -
Total Revenues 5,658,255 387,259 96,999 404,863
Expenditures:Current: Instruction: Regular - - 115 - Special - - 1,787 - Adult/Continuing - 16,636 - - Student Intervention Services - - 923 - Other - - 5,259 - Support Services: Pupils - 15,777 14,423 - Instructional Staff - 251,310 20,243 - Administration - 73,991 - - Fiscal 294,273 - - - Operation and Maintenance of Plant 39,249 - 850 - Pupil Transportation - 2,536 - - Central - - - - Operation of Non-Instructional Services 5,204,985 715 23,451 417,833 Extracurricular Activities 10,111 - - -
Total Expenditures 5,548,618 360,965 67,051 417,833
Excess of Revenues Over (Under) Expenditures 109,637 26,294 29,948 (12,970)
Other Financing Sources:Transfers In - - - -
Net Change in Fund Balances 109,637 26,294 29,948 (12,970)
Fund Balances (Deficit) at Beginning of Year 2,144,420 24,258 16,085 106,307
Fund Balances (Deficit) at End of Year 2,254,057$ 50,552$ 46,033$ 93,337$
Springfield City School DistrictCombining Statement of Revenues, Expenditures and Changes in Fund Balances
Nonmajor Special Revenue FundsFor the Fiscal Year Ended June 30, 2017
78

Ohio School DistrictBasic Facilities Managed Early
Education Classroom Student Auxiliary ChildhoodFoundation Maintenance Activities Services Education
-$ 234,918$ -$ -$ -$ - 317,735 - 633,492 969,286 - - 1,806 1,131 - - - - - - - - 376,795 - - - - - - -
5,950 - 21,805 - - - - 9,793 - -
5,950 552,653 410,199 634,623 969,286
- - - - - - - - - 1,056,245 - - - - - - - - - - - - - - -
5,824 - - - - - - - - - - - - - - - 5,147 - 25,053 - 403,367 - - - - - - - - - - - - - - - - 633,764 - - - 463,035 - -
5,824 408,514 463,035 658,817 1,056,245
126 144,139 (52,836) (24,194) (86,959)
- - 30,000 - -
126 144,139 (22,836) (24,194) (86,959)
7 2,426,997 253,739 47,344 6,714
133$ 2,571,136$ 230,903$ 23,150$ (80,245)$ (continued)
79

Springfield City School DistrictCombining Statement of Revenues, Expenditures and Changes in Fund Balances
Nonmajor Special Revenue FundsFor the Fiscal Year Ended June 30, 2017
(Continued)
Data Alternative Straight A MiscellaneousCommunications Schools Grant State Grants
Revenues:Property Taxes -$ -$ -$ -$ Intergovernmental 27,000 136,979 397,725 27,288 Investment Earnings - - - - Tuition and Fees - - - - Extracurricular Activities - - - - Charges for Services - - - - Contributions and Donations - - - - Miscellaneous - - - -
Total Revenues 27,000 136,979 397,725 27,288
Expenditures:Current: Instruction: Regular - - 48,146 - Special - - - - Adult/Continuing - - - - Student Intervention Services - 61,145 - - Other - - - - Support Services: Pupils - 78,443 79,580 27,483 Instructional Staff 6,300 - 84,339 - Administration - - 79,018 - Fiscal - - - - Operation and Maintenance of Plant - - - - Pupil Transportation - - - - Central 20,700 - 58,204 - Operation of Non-Instructional Services - - - - Extracurricular Activities - - - -
Total Expenditures 27,000 139,588 349,287 27,483
Excess of Revenues Over (Under) Expenditures - (2,609) 48,438 (195)
Other Financing Sources:Transfers In - - - -
Net Change in Fund Balances - (2,609) 48,438 (195)
Fund Balances (Deficit) at Beginning of Year 10,527 5,116 (107) (388)
Fund Balances (Deficit) at End of Year 10,527$ 2,507$ 48,331$ (583)$
80

Title VI-BAdult Special Title I - School Title III -Basic Race to Education Improvement, Limited English
Education the Top Part B - IDEA Stimulus A Proficiency Title I
-$ -$ -$ -$ -$ -$ 127,606 - 1,788,197 500,958 43,777 4,791,424
- - - - - - - - - - - - - - - - - - - - - - - - - - - - - - - 30 - - - -
127,606 30 1,788,197 500,958 43,777 4,791,424
- - - - - 16,983 - - 1,105,831 - 24,843 1,294,189
47,893 - - - - - - - 15,750 31,240 4,860 701,150 - - - 350 - 162,513
- - 299,426 - 8,630 74,163 48,818 - 29,426 466,028 3,468 1,920,784 30,253 - 270,296 - - 139,998
- - - - - - - - - - - -
240 - - - - - - - - - - - - - 71,212 - 1,672 512,100 - - - - - -
127,204 - 1,791,941 497,618 43,473 4,821,880
402 30 (3,744) 3,340 304 (30,456)
- - - - - -
402 30 (3,744) 3,340 304 (30,456)
3,028 759 2,281 (876) 588 137,677
3,430$ 789$ (1,463)$ 2,464$ 892$ 107,221$ (continued)
81

Springfield City School DistrictCombining Statement of Revenues, Expenditures and Changes in Fund Balances
Nonmajor Special Revenue FundsFor the Fiscal Year Ended June 30, 2017
(Continued)
TotalNonmajor
Miscellaneous SpecialPreschool Federal Revenue
Grant Title VI-R Grants FundsRevenues:Property Taxes -$ -$ -$ 234,918$ Intergovernmental 56,229 663,822 374,411 16,273,941 Investments Earnings - - - 20,685 Tuition and Fees - - - 373,513 Extracurricular Activities - - - 376,795 Charges for Services - - - 692,153 Contributions and Donations - - - 28,755 Miscellaneous - - - 54,773
Total Revenues 56,229 663,822 374,411 18,055,533
Expenditures:Current: Instruction: Regular - - 3,510 68,754 Special 33,679 691,255 - 4,207,829 Adult/Continuing - - - 64,529 Student Intervention Services - - 178,136 993,204 Other - - - 168,122 Support Services: Pupils - - 126,958 730,707 Instructional Staff 3,997 - 23,253 2,857,966 Administration - - - 593,556 Fiscal - - 532 325,005 Operation and Maintenance of Plant - - - 443,466 Pupil Transportation - - 1,020 3,796 Central - - - 78,904 Operation of Non-Instructional Services - 8,981 40,967 6,915,680 Extracurricular Activities - - - 473,146
Total Expenditures 37,676 700,236 374,376 17,924,664
Excess of Revenues Over (Under) Expenditures 18,553 (36,414) 35 130,869
Other Financing Sources:Transfers In - - - 30,000
Net Change in Fund Balances 18,553 (36,414) 35 160,869
Fund Balances (Deficit) at Beginning of Year (19,805) 4,014 2,431 5,171,116
Fund Balances (Deficit) at End of Year (1,252)$ (32,400)$ 2,466$ 5,331,985$
82

FIDUCIARY FUNDS
Private Purpose Trust Funds
Private Purpose Trust Funds are used to account for any trust arrangement under which principal and income benefit individuals, private organizations, or other governments. College Scholarship To account for contributions and donations to be used as scholarships for students in the School District. Endowment To account for contributions and donations which have been set aside as an investment to provide scholarships to students of the School District. The income from this fund may be expended, but the principal must remain intact.
Agency Funds Agency Funds are used to account for assets held by the School District as an agent for individuals, private organizations, other governmental units, and/or other funds. District Agency To account for money that is set aside each pay period to make the School District’s semi-annual workers’ compensation payments. Student Managed Activities To account for student activity programs which have student participation in the activity and have students involved in the management of the program. This fund typically includes those student activities which consist of a student body, student president, student treasurer, and faculty advisor.
83

Springfield City School DistrictCombining Statement of Fiduciary Net Position
Private Purpose Trust FundsJune 30, 2017
CollegeScholarship Endowment Total
Assets: Equity in Pooled Cash and Cash Equivalents 60,678$ 16,684$ 77,362$
Net Position: Restricted - Nonexpendable - 10,000 10,000 Held in Trust for Scholarships 60,678 6,684 67,362
Total Net Position 60,678$ 16,684$ 77,362$
84
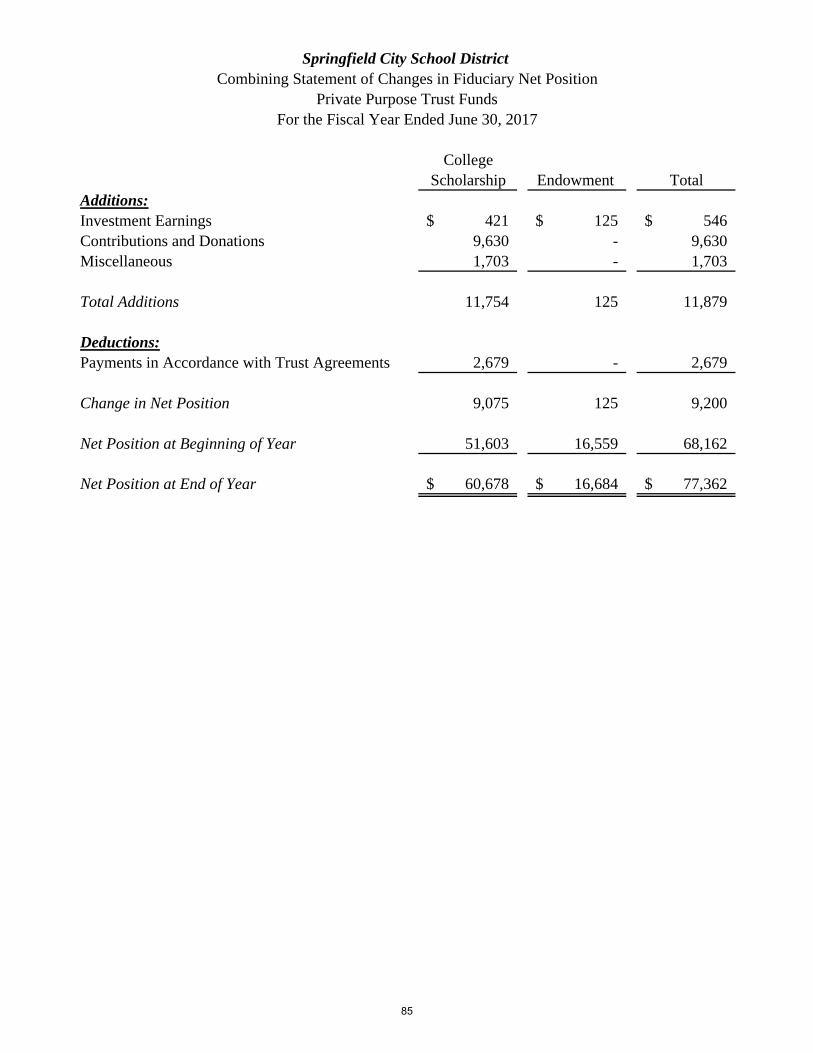
CollegeScholarship Endowment Total
Additions:Investment Earnings 421$ 125$ 546$ Contributions and Donations 9,630 - 9,630 Miscellaneous 1,703 - 1,703
Total Additions 11,754 125 11,879
Deductions:Payments in Accordance with Trust Agreements 2,679 - 2,679
Change in Net Position 9,075 125 9,200
Net Position at Beginning of Year 51,603 16,559 68,162
Net Position at End of Year 60,678$ 16,684$ 77,362$
Springfield City School DistrictCombining Statement of Changes in Fiduciary Net Position
Private Purpose Trust FundsFor the Fiscal Year Ended June 30, 2017
85

Springfield City School DistrictStatement of Changes in Assets and Liabilities
Agency FundsFor the Fiscal Year Ended June 30, 2017
Beginning EndingBalance Balance
July 1, 2016 Additions Reductions June 30, 2017
District Agency Fund
Assets: Equity in Pooled Cash and Cash Equivalents 1,565,774$ 291,751$ 687,507$ 1,170,018$
Total Assets 1,565,774$ 291,751$ 687,507$ 1,170,018$
Liabilities: Due to Other Governments 1,565,774$ 291,751$ 687,507$ 1,170,018$
Student Managed Activities Fund
Assets: Equity in Pooled Cash and Cash Equivalents 74,349$ 47,265$ 44,637$ 76,977$
Liabilities: Due to Students 74,349$ 47,265$ 44,637$ 76,977$
Total Agency Funds
Assets: Equity in Pooled Cash and Cash Equivalents 1,640,123$ 339,016$ 732,144$ 1,246,995$
Total Assets 1,640,123$ 339,016$ 732,144$ 1,246,995$
Liabilities: Due to Students 74,349$ 47,265$ 44,637$ 76,977$ Due to Other Governments 1,565,774 291,751 687,507 1,170,018
Total Liabilities 1,640,123$ 339,016$ 732,144$ 1,246,995$
86

Springfield City School District
Individual Fund Schedules of Revenues, Expenditures and Changes in Fund Balance – Budget (Non-GAAP Basis) and Actual
87

Final Budget ActualVariance with Final Budget
REVENUES:Property and Other Local Taxes 2,836,309$ 2,725,223$ (111,086)$ Intergovernmental 281,612 486,286 204,674
Total Revenues 3,117,921 3,211,509 93,588
EXPENDITURES:Current: Support Services: Fiscal 252,818 225,646 27,172Debt Service: Principal 2,350,000 2,350,000 - Interest 647,751 499,462 148,289
Total Expenditures 3,250,569 3,075,108 175,461
Net Change in Fund Balances (132,648) 136,401 269,049
Fund Balance (Deficit) at Beginning of Year 4,936,250 4,936,250 -
Fund Balance (Deficit) at End of Year 4,803,602$ 5,072,651$ 269,049$
Springfield City SchoolsSchedule of Revenues, Expenditures and Changes
In Fund Balance - Budget (Non-GAAP Basis) and ActualBond Retirement Fund
For the Fiscal Year Ended June 30, 2017
88

Final Budget ActualVariance with Final Budget
REVENUES:Interest - 1 1
Total Revenues - 1 1
EXPENDITURES:Current: Support Services: Instructional Staff 56,893 53,898 2,995Capital Outlay: Site Improvement Services 544,175 530,644 13,531 Building Acquisition and Construction Services 1,919 1,919 Building Improvement Services 7,988 7,988 -
Total Expenditures 610,975 592,530 18,445
Net Change in Fund Balances (610,975) (592,529) 18,446
Fund Balance (Deficit) at Beginning of Year 20,645 20,645 -
Prior Year Encumbrances Appropriated 590,330 590,330 -
Fund Balance (Deficit) at End of Year -$ 18,446$ 18,446$
Springfield City SchoolsSchedule of Revenues, Expenditures and Changes
In Fund Balance - Budget (Non-GAAP Basis) and ActualBuilding Fund
For the Fiscal Year Ended June 30, 2017
89

Final Budget ActualVariance with Final Budget
REVENUES:Property and Other Local Taxes 720,268 694,488 (25,780)Intergovernmental 69,144 96,176 27,032Interest 6,000 13,027 7,027Gifts and Donations 1,500 1,500 -
Total Revenues 796,912 805,191 8,279
EXPENDITURES:Current: Instruction: Regular 89,557 67,519 22,038 Support Services: Pupils 2,500 1,482 1,018 Instructional Staff 61,872 61,841 31 Administration 29,167 29,167 0 Fiscal 214,866 14,553 200,313 Operation and Maintenance of Plant 180,145 116,241 63,904 Pupil Transportation 239,700 236,800 2,900 Central 217,111 217,111 - Operation of Non-Instructional/Shared Services: Community Services 16,033 16,033 - Extracurricular Activities: Sport Oriented Activities 1,146,298 1,146,298 - Capital Outlay: Site Improvement Services 3,071,633 2,994,751 76,882 Architecture and Engineering Services 162,343 108,641 53,702 Building Improvement Services 71,950 69,257 2,693
Total Expenditures 5,503,175 5,079,694 423,481
Excess of Revenues Over (Under) Expenditures (4,706,263) (4,274,503) 431,760
OTHER FINANCING SOURCES AND USES:Transfers In 1,700,000 1,700,000 -
Total Other Financing Sources and Uses 1,700,000 1,700,000 -
Net Change in Fund Balances (3,006,263) (2,574,503) 431,760
Fund Balance (Deficit) at Beginning of Year 2,416,011 2,416,011 -
Prior Year Encumbrances Appropriated 2,403,174 2,403,174 -
Fund Balance (Deficit) at End of Year 1,812,922$ 2,244,682$ 431,760$
Springfield City SchoolsSchedule of Revenues, Expenditures and Changes
In Fund Balance - Budget (Non-GAAP Basis) and ActualPermanent Improvement Fund
For the Fiscal Year Ended June 30, 2017
90

Final Budget ActualVariance with Final Budget
REVENUES:Intergovernmental 4,760,635 4,958,628 197,993Interest 4,000 16,828 12,828Customer Sales and Services 691,897 695,562 3,665Miscellaneous 21,918 13,284 (8,634)
Total Revenues 5,478,450 5,684,302 205,852
EXPENDITURES:Current: Support Services: Fiscal 294,273 294,273 - Operation and Maintenance of Plant 157,681 81,607 76,074 Operation of Non-Instructional/Shared Services: Food Service Operations 6,573,734 5,452,855 1,120,879 Extracurricular Activities: Sport Oriented Activities 10,111 10,111 - Capital Outlay: Site Improvement Services 45,790 - 45,790
Total Expenditures 7,081,589 5,838,846 1,242,743
Excess of Revenues Over (Under) Expenditures (1,603,139) (154,544) 1,448,595
OTHER FINANCING SOURCES AND USES:Proceeds from Sale of Capital Assets - 1,201 1,201Refund of Prior Year Expenditures - 33,535 33,535Refund of Prior Year Receipts (403) (403) -
Total Other Financing Sources and Uses (403) 34,333 34,736
Net Change in Fund Balances (1,603,542) (120,211) 1,483,331
Fund Balance (Deficit) at Beginning of Year 1,401,586 1,401,586 -
Prior Year Encumbrances Appropriated 681,105 681,105 -
Fund Balance (Deficit) at End of Year 479,149$ 1,962,480$ 1,483,331$
Springfield City SchoolsSchedule of Revenues, Expenditures and Changes
In Fund Balance - Budget (Non-GAAP Basis) and ActualFood Service Fund
For the Fiscal Year Ended June 30, 2017
91

Final Budget ActualVariance with Final Budget
REVENUES:Intergovernmental 413,794 383,209 (30,585)Miscellaneous 4,500 4,836 336
Total Revenues 418,294 388,045 (30,249)
EXPENDITURES:Current: Instruction: Adult/Continuing 20,619 18,409 2,210 Support Services: Pupils 19,396 15,793 3,603 Instructional Staff 311,737 257,713 54,024 Administration 76,104 73,845 2,259 Pupil Transportation 3,500 2,699 801 Operation of Non-Instructional/Shared Services: Community Services 1,548 762 786
Total Expenditures 432,904 369,221 63,683
Net Change in Fund Balances (14,610) 18,824 33,434
Fund Balance (Deficit) at Beginning of Year 10,700 10,700 -
Prior Year Encumbrances Appropriated 3,910 3,910 -
Fund Balance (Deficit) at End of Year -$ 33,434$ 33,434$
Springfield City SchoolsSchedule of Revenues, Expenditures and Changes
In Fund Balance - Budget (Non-GAAP Basis) and ActualMental Health - Early Start Fund
For the Fiscal Year Ended June 30, 2017
92

Final Budget ActualVariance with Final Budget
REVENUES:Intergovernmental 95,454 95,454 - Tuition and Fees 545 545 - Gifts and Donations 1,000 1,000 -
Total Revenues 96,999 96,999 -
EXPENDITURES:Current: Instruction: Regular 210 115 95 Special 5,320 1,787 3,533 Student Intervention Services 923 923 - Other 5,314 5,223 91 Support Services: Pupils 34,348 30,877 3,471 Instructional Staff 35,959 28,670 7,289 Operation and Maintenance of Plant 900 900 - Operation of Non-Instructional/Shared Services: Community Services 29,036 26,776 2,260
Total Expenditures 112,010 95,271 16,739
Excess of Revenues Over (Under) Expenditures (15,011) 1,728 16,739
OTHER FINANCING SOURCES AND USES:Refund of Prior Year Receipts (2,136) (2,136) -
Total Other Financing Sources and Uses (2,136) (2,136) -
Net Change in Fund Balances (17,147) (408) 16,739
Fund Balance (Deficit) at Beginning of Year 13,077 13,077 -
Prior Year Encumbrances Appropriated 4,370 4,370 -
Fund Balance (Deficit) at End of Year 300$ 17,039$ 16,739$
Springfield City SchoolsSchedule of Revenues, Expenditures and Changes
In Fund Balance - Budget (Non-GAAP Basis) and ActualOther Grants Fund
For the Fiscal Year Ended June 30, 2017
93

Final Budget ActualVariance with Final Budget
REVENUES:Intergovernmental 37,000 31,187 (5,813)Interest 200 920 720Tuition and Fees 350,000 372,968 22,968
Total Revenues 387,200 405,075 17,875
EXPENDITURES:Current: Operation of Non-Instructional/Shared Services: Community Services 513,466 422,645 90,821
Total Expenditures 513,466 422,645 90,821
Net Change in Fund Balances (126,266) (17,570) 108,696
Fund Balance (Deficit) at Beginning of Year 115,839 115,839 -
Prior Year Encumbrances Appropriated 18,715 18,715 -
Fund Balance (Deficit) at End of Year 8,288$ 116,984$ 108,696$
Springfield City SchoolsSchedule of Revenues, Expenditures and Changes
In Fund Balance - Budget (Non-GAAP Basis) and ActualSchool Age Child Care/After School Enrichment Fund
For the Fiscal Year Ended June 30, 2017
94

Final Budget ActualVariance with Final Budget
REVENUES:Gifts and Donations 5,951 5,951 -
Total Revenues 5,951 5,951 -
EXPENDITURES:Current: Support Services: Pupils 5,958 5,824 134
Total Expenditures 5,958 5,824 134
Net Change in Fund Balances (7) 127 134
Fund Balance (Deficit) at Beginning of Year 7 7 -
Fund Balance (Deficit) at End of Year -$ 134$ 134$
Springfield City SchoolsSchedule of Revenues, Expenditures and Changes
In Fund Balance - Budget (Non-GAAP Basis) and ActualBasic Education Foundation Fund
For the Fiscal Year Ended June 30, 2017
95

Final Budget ActualVariance with Final Budget
REVENUES:Property and Other Local Taxes 253,821 243,574 (10,247)Intergovernmental 25,062 317,735 292,673
Total Revenues 278,883 561,309 282,426
EXPENDITURES:Current: Support Services: Fiscal 10,013 5,147 4,866 Operation and Maintenance of Plant 514,331 441,773 72,558
Total Expenditures 524,344 446,920 77,424
Net Change in Fund Balances (245,461) 114,389 359,850
Fund Balance (Deficit) at Beginning of Year 2,361,395 2,361,395 -
Prior Year Encumbrances Appropriated 14,344 14,344 -
Fund Balance (Deficit) at End of Year 2,130,278$ 2,490,128$ 359,850$
Springfield City SchoolsSchedule of Revenues, Expenditures and Changes
In Fund Balance - Budget (Non-GAAP Basis) and ActualOhio School Facilities Classroom Maintenance Fund
For the Fiscal Year Ended June 30, 2017
96

Final Budget ActualVariance with Final Budget
REVENUES:Interest 691 1,806 1,115Extracurricular Activities 389,104 376,795 (12,309)Gifts and Donations 25,396 21,805 (3,591)Miscellaneous 11,294 10,223 (1,071)
Total Revenues 426,485 410,629 (15,856)
EXPENDITURES:Current: Support Services: Fiscal 299 - 299 Operation of Non-Instructional/Shared Services: Community Services 590 - 590 Extracurricular Activities: Academic Oriented Activities 120,805 89,708 31,097 Occupation Oriented Activities 24,003 21,539 2,464 Sport Oriented Activities 376,746 321,541 55,205 School and Public Service Co-Curricular Activities 42,816 39,315 3,501
Total Expenditures 565,259 472,103 93,156
Excess of Revenues Over (Under) Expenditures (138,774) (61,474) 77,300
OTHER FINANCING SOURCES AND USES:Transfers In 50,000 30,000 (20,000)Refund of Prior Year Expenditures 100 - (100)
Total Other Financing Sources and Uses 50,100 30,000 (20,100)
Net Change in Fund Balances (88,674) (31,474) 57,200
Fund Balance (Deficit) at Beginning of Year 250,603 250,603 -
Prior Year Encumbrances Appropriated 6,848 6,848 -
Fund Balance (Deficit) at End of Year 168,777$ 225,977$ 57,200$
Springfield City SchoolsSchedule of Revenues, Expenditures and Changes
In Fund Balance - Budget (Non-GAAP Basis) and ActualDistrict Managed Student Activities FundFor the Fiscal Year Ended June 30, 2017
97

Final Budget ActualVariance with Final Budget
REVENUES:Intergovernmental 633,492 633,492Interest 552 1,131 579
Total Revenues 634,044 634,623 579
EXPENDITURES:Current: Support Services: Fiscal 25,340 25,340 - Operation of Non-Instructional/Shared Services: Community Services 683,940 647,490 36,450
Total Expenditures 709,280 672,830 36,450
Excess of Revenues Over (Under) Expenditures (75,236) (38,207) 37,029
OTHER FINANCING SOURCES AND USES:Refund of Prior Year Expenditures 287 287 -
Total Other Financing Sources and Uses 287 287 -
Net Change in Fund Balances (74,949) (37,920) 37,029
Fund Balance (Deficit) at Beginning of Year 65,376 65,376 -
Prior Year Encumbrances Appropriated 9,573 9,573 -
Fund Balance (Deficit) at End of Year -$ 37,029$ 37,029$
Springfield City SchoolsSchedule of Revenues, Expenditures and Changes
In Fund Balance - Budget (Non-GAAP Basis) and ActualAuxiliary Services Fund
For the Fiscal Year Ended June 30, 2017
98

Final Budget ActualVariance with Final Budget
REVENUES:Intergovernmental 1,322,980 992,953 (330,027)
Total Revenues 1,322,980 992,953 (330,027)
EXPENDITURES:Current: Instruction: Special 1,334,488 1,114,706 219,782
Total Expenditures 1,334,488 1,114,706 219,782
Net Change in Fund Balances (11,508) (121,753) (110,245)
Fund Balance (Deficit) at Beginning of Year 11,470 11,470 -
Prior Year Encumbrances Appropriated 38 38 -
Fund Balance (Deficit) at End of Year -$ (110,245)$ (110,245)$
Springfield City SchoolsSchedule of Revenues, Expenditures and Changes
In Fund Balance - Budget (Non-GAAP Basis) and ActualEarly Childhood Education Fund
For the Fiscal Year Ended June 30, 2017
99

Final Budget ActualVariance with Final Budget
REVENUES:Intergovernmental 27,000 27,000 -
Total Revenues 27,000 27,000 -
EXPENDITURES:Current: Support Services: Instructional Staff 12,600 6,300 6,300 Central 20,700 20,700 -
Total Expenditures 33,300 27,000 6,300
Net Change in Fund Balances (6,300) - 6,300
Fund Balance (Deficit) at Beginning of Year 7,579 7,579 -
Prior Year Encumbrances Appropriated 2,949 2,949 -
Fund Balance (Deficit) at End of Year 4,228$ 10,528$ 6,300$
Springfield City SchoolsSchedule of Revenues, Expenditures and Changes
In Fund Balance - Budget (Non-GAAP Basis) and Actual
Data Communications Fund
For the Fiscal Year Ended June 30, 2017
100

Final Budget ActualVariance with Final Budget
REVENUES:Intergovernmental 148,712$ 138,282$ (10,430)$
Total Revenues 148,712 138,282 (10,430)
EXPENDITURES:Current: Instruction: Student Intervention Services 74,929 61,802 13,127 Support Services: Pupils 88,416 88,416 -
Total Expenditures 163,345 150,218 13,127
Net Change in Fund Balances (14,633) (11,936) 2,697
Fund Balance (Deficit) at Beginning of Year 1,185 1,185 -
Prior Year Encumbrances Appropriated 13,448 13,448 -
Fund Balance (Deficit) at End of Year -$ 2,697$ 2,697$
Springfield City SchoolsSchedule of Revenues, Expenditures and Changes
In Fund Balance - Budget (Non-GAAP Basis) and ActualAlternative Schools Fund
For the Fiscal Year Ended June 30, 2017
101

Final Budget ActualVariance with Final Budget
REVENUES:Intergovernmental 467,400 397,725 (69,675)
Total Revenues 467,400 397,725 (69,675)
EXPENDITURES:Current: Instruction: Regular 55,000 54,999 1 Support Services: Pupils 102,600 89,605 12,995 Instructional Staff 160,196 123,259 36,937 Administration 102,105 74,527 27,578 Central 47,500 47,500 -
Total Expenditures 467,401 389,890 77,511
Net Change in Fund Balances (1) 7,835 7,836
Fund Balance (Deficit) at Beginning of Year 2 2 -
Fund Balance (Deficit) at End of Year 1$ 7,837$ 7,836$
Springfield City SchoolsSchedule of Revenues, Expenditures and Changes
In Fund Balance - Budget (Non-GAAP Basis) and Actual
Straight A Grant Fund
For the Fiscal Year Ended June 30, 2017
102

Final Budget ActualVariance with Final Budget
REVENUES:Intergovernmental 30,465 27,356 (3,109)
Total Revenues 30,465 27,356 (3,109)
EXPENDITURES:Current: Support Services: Pupils 31,197 27,451 3,746
Total Expenditures 31,197 27,451 3,746
Net Change in Fund Balances (732) (95) 637
Fund Balance (Deficit) at Beginning of Year 732 732 -
Fund Balance (Deficit) at End of Year -$ 637$ 637$
Springfield City SchoolsSchedule of Revenues, Expenditures and Changes
In Fund Balance - Budget (Non-GAAP Basis) and Actual
Miscellaneous State Grant Fund
For the Fiscal Year Ended June 30, 2017
103

Final Budget ActualVariance with Final Budget
REVENUES:Intergovernmental 144,974 126,706 (18,268)
Total Revenues 144,974 126,706 (18,268)
EXPENDITURES:Current: Instruction: Adult/Continuing 58,463 48,657 9,806 Support Services: Instructional Staff 58,441 50,155 8,286 Administration 34,706 31,681 3,025 Pupil Transportation 356 240 116
Total Expenditures 151,966 130,733 21,233
Net Change in Fund Balances (6,992) (4,027) 2,965
Fund Balance (Deficit) at Beginning of Year 6,943 6,943 -
Prior Year Encumbrances Appropriated 49 49 -
Fund Balance (Deficit) at End of Year -$ 2,965$ 2,965$
Springfield City SchoolsSchedule of Revenues, Expenditures and Changes
In Fund Balance - Budget (Non-GAAP Basis) and ActualAdult Basic Education Fund
For the Fiscal Year Ended June 30, 2017
104

Final Budget ActualVariance with Final Budget
REVENUES:Intergovernmental 2,275,696 1,796,215 (479,481)
Total Revenues 2,275,696 1,796,215 (479,481)
EXPENDITURES:Current: Instruction: Special 1,394,407 1,121,523 272,884 Student Intervention Services 15,750 15,750 - Support Services: Pupils 368,648 309,963 58,685 Instructional Staff 63,697 30,927 32,770 Administration 310,474 270,366 40,108 Operation of Non-Instructional/Shared Services: Community Services 184,815 71,410 113,405
Total Expenditures 2,337,791 1,819,939 517,852
Net Change in Fund Balances (62,095) (23,724) 38,371
Fund Balance (Deficit) at Beginning of Year 47,902 47,902 -
Prior Year Encumbrances Appropriated 14,193 14,193 -
Fund Balance (Deficit) at End of Year -$ 38,371$ 38,371$
Springfield City SchoolsSchedule of Revenues, Expenditures and Changes
In Fund Balance - Budget (Non-GAAP Basis) and ActualTitle VI-B Special Education Part B - IDEA Fund
For the Fiscal Year Ended June 30, 2017
105

Final Budget ActualVariance with Final Budget
REVENUES:Intergovernmental 547,742 451,637 (96,105)
Total Revenues 547,742 451,637 (96,105)
EXPENDITURES:Current: Instruction: Student Intervention Services 36,701 31,240 5,461 Support Services: Instructional Staff 509,543 483,476 26,067
Total Expenditures 546,244 514,716 31,528
Excess of Revenues Over (Under) Expenditures 1,498 (63,079) (64,577)
OTHER FINANCING SOURCES AND USES:Advances Out (1,500) (1,500) -
Total Other Financing Sources and Uses (1,500) (1,500) -
Net Change in Fund Balances (2) (64,579) (64,577)
Fund Balance (Deficit) at Beginning of Year (185) (185) -
Prior Year Encumbrances Appropriated 187 187 -
Fund Balance (Deficit) at End of Year -$ (64,577)$ (64,577)$
Springfield City SchoolsSchedule of Revenues, Expenditures and Changes
In Fund Balance - Budget (Non-GAAP Basis) and ActualTitle I School Improvement Stimulus A Fund
For the Fiscal Year Ended June 30, 2017
106

Final Budget ActualVariance with Final Budget
REVENUES:Intergovernmental 81,268 45,496 (35,772)
Total Revenues 81,268 45,496 (35,772)
EXPENDITURES:Current: Instruction: Special 30,072 24,931 5,141 Student Intervention Services 9,100 4,860 4,240 Support Services: Pupils 10,750 10,749 1 Instructional Staff 14,450 3,469 10,981 Operation of Non-Instructional/Shared Services: Community Services 16,263 2,081 14,182
Total Expenditures 80,635 46,090 34,545
Excess of Revenues Over (Under) Expenditures 633 (594) (1,227)
OTHER FINANCING SOURCES AND USES:Advances Out (1,000) (1,000) -
Total Other Financing Sources and Uses (1,000) (1,000) -
Net Change in Fund Balances (367) (1,594) (1,227)
Fund Balance (Deficit) at Beginning of Year (900) (900) -
Prior Year Encumbrances Appropriated 1,267 1,267 -
Fund Balance (Deficit) at End of Year -$ (1,227)$ (1,227)$
Springfield City SchoolsSchedule of Revenues, Expenditures and Changes
In Fund Balance - Budget (Non-GAAP Basis) and ActualTitle III Limited English Proficiency FundFor the Fiscal Year Ended June 30, 2017
107

Final Budget ActualVariance with Final Budget
REVENUES:Intergovernmental 5,964,471 4,837,957 (1,126,514)
Total Revenues 5,964,471 4,837,957 (1,126,514)
EXPENDITURES:Current: Instruction: Regular 21,533 17,333 4,200 Special 1,623,665 1,301,437 322,228 Student Intervention Services 1,005,180 739,741 265,439 Other 208,182 167,533 40,649 Support Services: Pupils 142,440 82,279 60,161 Instructional Staff 2,314,996 1,894,414 420,582 Administration 180,496 154,580 25,916 Operation of Non-Instructional/Shared Services: Food Service Operations 13,614 9,709 3,905 Community Services 622,089 501,182 120,907
Total Expenditures 6,132,195 4,868,208 1,263,987
Excess of Revenues Over (Under) Expenditures (167,724) (30,251) 137,473
OTHER FINANCING SOURCES AND USES:Refund of Prior Year Receipts (150) (150) -
Total Other Financing Sources and Uses (150) (150) -
Net Change in Fund Balances (167,874) (30,401) 137,473
Fund Balance (Deficit) at Beginning of Year (33,013) (33,013) -
Prior Year Encumbrances Appropriated 200,887 200,887 -
Fund Balance (Deficit) at End of Year -$ 137,473$ 137,473$
Springfield City SchoolsSchedule of Revenues, Expenditures and Changes
In Fund Balance - Budget (Non-GAAP Basis) and ActualTitle I Fund
For the Fiscal Year Ended June 30, 2017
108

Final Budget ActualVariance with Final Budget
REVENUES:Intergovernmental 76,756 65,719 (11,037)
Total Revenues 76,756 65,719 (11,037)
EXPENDITURES:Current: Instruction: Special 68,820 59,442 9,378 Support Services: Instructional Staff 8,335 5,986 2,349
Total Expenditures 77,155 65,428 11,727
Net Change in Fund Balances (399) 291 690
Fund Balance (Deficit) at Beginning of Year (160) (160) -
Prior Year Encumbrances Appropriated 561 561 -
Fund Balance (Deficit) at End of Year 2$ 692$ 690$
Springfield City SchoolsSchedule of Revenues, Expenditures and Changes
In Fund Balance - Budget (Non-GAAP Basis) and ActualPreSchool Grant Fund
For the Fiscal Year Ended June 30, 2017
109

Final Budget ActualVariance with Final Budget
REVENUES:Intergovernmental 753,506 713,459 (40,047)
Total Revenues 753,506 713,459 (40,047)
EXPENDITURES:Current: Instruction: Special 764,096 701,049 63,047 Operation of Non-Instructional/Shared Services: Community Services 11,645 9,197 2,448
Total Expenditures 775,741 710,246 65,495
Net Change in Fund Balances (22,235) 3,213 25,448
Fund Balance (Deficit) at Beginning of Year 19,100 19,100 -
Prior Year Encumbrances Appropriated 3,135 3,135 -
Fund Balance (Deficit) at End of Year -$ 25,448$ 25,448$
Springfield City SchoolsSchedule of Revenues, Expenditures and Changes
In Fund Balance - Budget (Non-GAAP Basis) and ActualTitle VI-R Fund
For the Fiscal Year Ended June 30, 2017
110
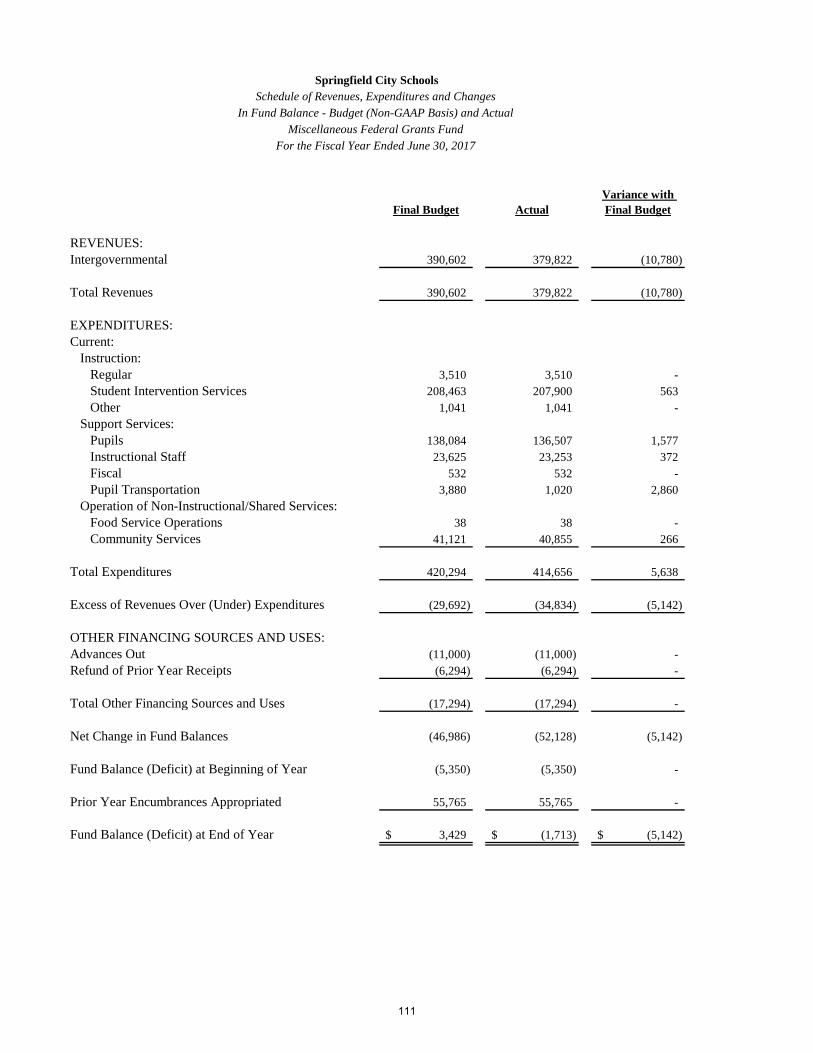
Final Budget ActualVariance with Final Budget
REVENUES:Intergovernmental 390,602 379,822 (10,780)
Total Revenues 390,602 379,822 (10,780)
EXPENDITURES:Current: Instruction: Regular 3,510 3,510 - Student Intervention Services 208,463 207,900 563 Other 1,041 1,041 - Support Services: Pupils 138,084 136,507 1,577 Instructional Staff 23,625 23,253 372 Fiscal 532 532 - Pupil Transportation 3,880 1,020 2,860 Operation of Non-Instructional/Shared Services: Food Service Operations 38 38 - Community Services 41,121 40,855 266
Total Expenditures 420,294 414,656 5,638
Excess of Revenues Over (Under) Expenditures (29,692) (34,834) (5,142)
OTHER FINANCING SOURCES AND USES:Advances Out (11,000) (11,000) - Refund of Prior Year Receipts (6,294) (6,294) -
Total Other Financing Sources and Uses (17,294) (17,294) -
Net Change in Fund Balances (46,986) (52,128) (5,142)
Fund Balance (Deficit) at Beginning of Year (5,350) (5,350) -
Prior Year Encumbrances Appropriated 55,765 55,765 -
Fund Balance (Deficit) at End of Year 3,429$ (1,713)$ (5,142)$
Springfield City SchoolsSchedule of Revenues, Expenditures and Changes
In Fund Balance - Budget (Non-GAAP Basis) and ActualMiscellaneous Federal Grants Fund
For the Fiscal Year Ended June 30, 2017
111

Final Budget ActualVariance with Final Budget
REVENUES:Intergovernmental 2,300 1,490 (810)Extracurricular Activities 157,734 153,469 (4,265)Gifts and Donations 32,930 28,714 (4,216)Miscellaneous 15,325 18,127 2,802
Total Revenues 208,289 201,800 (6,489)
EXPENDITURES:Current: Instruction: Regular 21,187 20,978 209 Special 2,427 2,347 80 Adult/Continuing 1,467 12 1,455 Support Services: Pupils 17,526 13,741 3,785 Instructional Staff 21,170 15,196 5,974 Operation of Non-Instructional/Shared Services: Community Services 30 - 30 Other 1,445 - 1,445 Extracurricular Activities: Academic Oriented Activities 20,758 2,715 18,043 School and Public Service Co-Curricular Activities 201,177 142,009 59,168
Total Expenditures 287,187 196,998 90,189
Excess of Revenues Over (Under) Expenditures (78,898) 4,802 83,700
OTHER FINANCING SOURCES AND USES:Refund of Prior Year Expenditures - 1,061 1,061
Total Other Financing Sources and Uses - 1,061 1,061
Net Change in Fund Balances (78,898) 5,863 84,761
Fund Balance (Deficit) at Beginning of Year 139,683 139,683 -
Prior Year Encumbrances Appropriated 7,392 7,392 -
Fund Balance (Deficit) at End of Year 68,177$ 152,938$ 84,761$
Springfield City SchoolsSchedule of Revenues, Expenditures and Changes
In Fund Balance - Budget (Non-GAAP Basis) and ActualPublic School Support Fund
For the Fiscal Year Ended June 30, 2017
112

Final Budget ActualVariance with Final Budget
EXPENDITURES:Current: Support Services: Operation and Maintenance of Plant 11,000 - 11,000
Total Expenditures 11,000 - 11,000
Net Change in Fund Balances (11,000) - 11,000
Fund Balance (Deficit) at Beginning of Year 11,000 11,000 -
Fund Balance (Deficit) at End of Year -$ 11,000$ 11,000$
Springfield City SchoolsSchedule of Revenues, Expenditures and Changes
In Fund Balance - Budget (Non-GAAP Basis) and Actual
Underground Storage Tank Fund
For the Fiscal Year Ended June 30, 2017
113
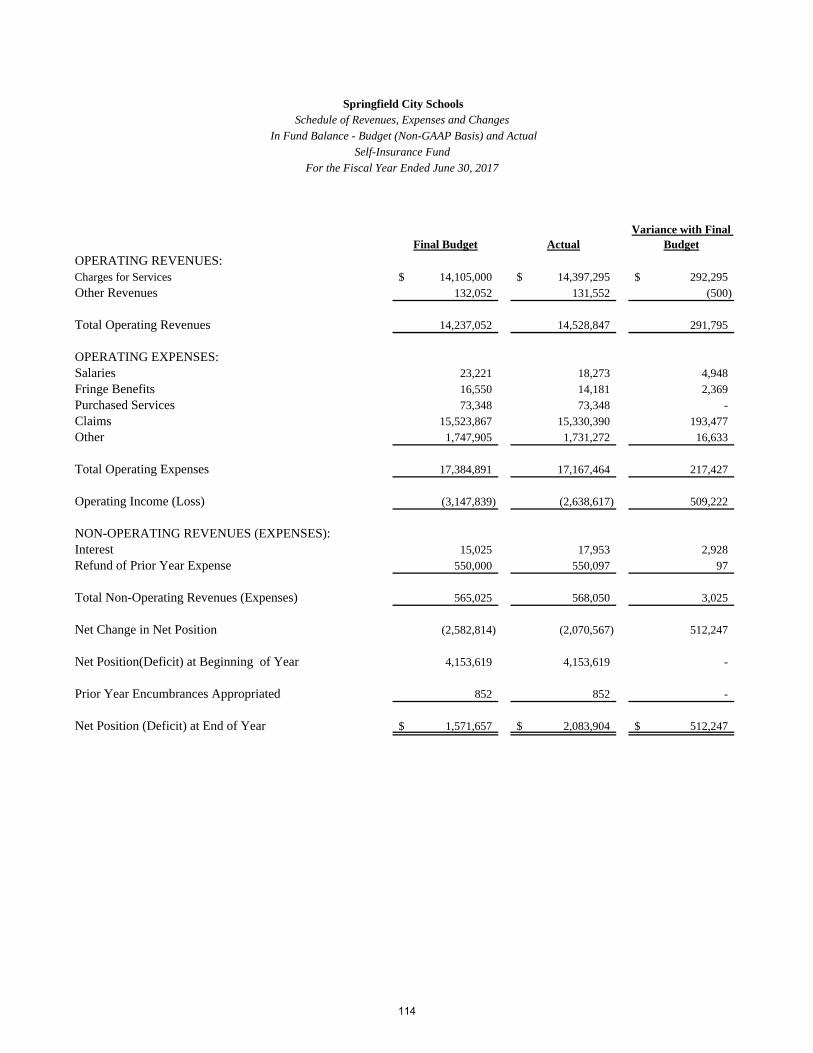
Final Budget ActualVariance with Final
BudgetOPERATING REVENUES:Charges for Services 14,105,000$ 14,397,295$ 292,295$ Other Revenues 132,052 131,552 (500)
Total Operating Revenues 14,237,052 14,528,847 291,795
OPERATING EXPENSES:Salaries 23,221 18,273 4,948Fringe Benefits 16,550 14,181 2,369Purchased Services 73,348 73,348 - Claims 15,523,867 15,330,390 193,477Other 1,747,905 1,731,272 16,633
Total Operating Expenses 17,384,891 17,167,464 217,427
Operating Income (Loss) (3,147,839) (2,638,617) 509,222
NON-OPERATING REVENUES (EXPENSES):Interest 15,025 17,953 2,928Refund of Prior Year Expense 550,000 550,097 97
Total Non-Operating Revenues (Expenses) 565,025 568,050 3,025
Net Change in Net Position (2,582,814) (2,070,567) 512,247
Net Position(Deficit) at Beginning of Year 4,153,619 4,153,619 -
Prior Year Encumbrances Appropriated 852 852 -
Net Position (Deficit) at End of Year 1,571,657$ 2,083,904$ 512,247$
Springfield City SchoolsSchedule of Revenues, Expenses and Changes
In Fund Balance - Budget (Non-GAAP Basis) and ActualSelf-Insurance Fund
For the Fiscal Year Ended June 30, 2017
114

STATISTICAL SECTION
COMPREHENSIVE
ANNUAL FINANCIAL
REPORT
For the Fiscal Year Ended June 30, 2017
1500 W Jefferson Street, Springfield, Ohio 45506
www.scsdoh.org
COLLABORATIVE
STUDENT-CENTERED
CURIOUS
DIVERSE


STATISTICAL TABLES
This part of Springfield City School District’s comprehensive annual financial report presents detailed information as a context for understanding what the information in the financial statements, note disclosures, and required supplementary information says about the School District’s overall financial health. CONTENTS PAGES Financial Trends 116-127
These schedules contain trend information to help the reader understand how the School District’s financial performance and well-being have changed over time.
Revenue Capacity 128-137
These schedules contain information to help the reader assess the School District’s most significant local revenue sources.
Debt Capacity 138-143
These schedules present information to help the reader assess the affordability of the School District’s current levels of outstanding debt and the School District’s ability to issue additional debt in the future.
Demographic and Economic Information 144-145
These schedules offer demographic and economic indicators to help the reader understand the environment within which the School District’s financial activities take place.
Operating information 146-152
These schedules contain service and capital assets data to help the reader understand how the information in the School District’s financial report relates to the services the School District provides and the activities it performs.
Unless otherwise noted, the information in these schedules is derived from the comprehensive annual financial reports for the relevant year.
115

Springfield City School DistrictNet Position by ComponentGovernmental ActivitiesLast Ten Fiscal Years (accrual basis of accounting)
Fiscal Year 2008 2009 2010 2011
Net Investment in Capital Assets 154,126,291$ 157,096,582$ 155,009,658$ 153,803,982$ Restricted 25,439,929 17,127,725 15,596,423 19,585,138 Unrestricted (Deficit) 3,011,251 8,937,593 18,912,126 22,677,618
Total Net Position 182,577,471$ 183,161,900$ 189,518,207$ 196,066,738$
The District implemented GASB 68 in 2015
116

2012 2013 2014 2015 2016 2017
153,769,985$ 147,160,678$ 142,878,068$ 148,898,831$ 152,888,984$ 152,049,477$ 11,651,741 14,155,592 14,293,037 15,275,859 12,577,780 13,136,246 30,725,501 28,684,131 32,527,326 (86,083,798) (85,450,656) (90,806,068)
196,147,227$ 190,000,401$ 189,698,431$ 78,090,892$ 80,016,108$ 74,379,655$
117

Springfield City School DistrictChanges in Net PositionGovernmental ActivitiesLast Ten Fiscal Years (accrual basis of accounting)
Fiscal Year 2008 2009 2010 2011
Expenses:Current:
Instruction: Regular 39,199,235$ 41,317,982$ 39,305,210$ 43,206,893$ Special 10,004,147 10,467,442 11,654,525 10,446,395 Vocational 412,139 191,489 198,117 198,230 Adult/Continuing 263,628 145,162 119,608 130,193 Student Intervention Services 1,734,542 1,929,098 1,488,378 391,333 Support Services: Pupils 5,869,183 5,855,781 6,228,605 7,029,551 Instructional Staff 7,019,596 6,940,114 7,482,630 7,017,109 Board of Education 205,787 207,244 323,239 233,064 Administration 5,906,938 6,679,185 6,357,072 6,892,481 Fiscal 1,630,265 1,562,836 1,685,061 1,545,232 Business 356,499 395,008 578,731 298,592 Operation and Maintenance of Plant 8,981,875 8,374,131 8,739,837 8,539,156 Pupil Transportation 1,953,952 2,188,121 2,160,195 2,398,981 Central 790,228 527,764 616,503 1,238,962 Operation of Non-Instructional Services 6,326,691 7,573,260 5,475,323 4,985,764 Extracurricular Activities 953,138 1,214,731 758,748 880,975 Interest and Fiscal Charges 2,643,336 2,596,675 2,356,708 2,295,411 Unallocated Depreciation 3,250,259 4,757,102 4,709,637 4,733,369
Total Expenses 97,501,438 102,923,125 100,238,127 102,461,691
Program Revenues:Charges for Services:
Instruction: Regular 6,260 9,835 267 764,143 Special 743,729 627,922 716,601 12,111 Vocational - 18,820 19,195 - Adult/Continuing 7 - - - Support Services: Pupils - - - 4,623 Instructional Staff 360,720 183,791 180,412 - Administration - - - - Fiscal - - - - Operation and Maintenance of Plant 16,898 19,912 28,690 31,029 Pupil Transportation - - - - Central - - - - Operation of Non-Instructional Services 1,247,487 1,430,653 1,368,210 1,413,084 Extracurricular Activities 772,927 325,145 302,965 334,245
Operating Grants, Contributions, and Interest 30,453,610 26,340,799 23,113,839 25,703,076 Capital Grants and Contributions - - - -
Total Program Revenues 33,601,638 28,956,877 25,730,179 28,262,311
Net Expense (63,899,800)$ (73,966,248)$ (74,507,948)$ (74,199,380)$
118

2012 2013 2014 2015 2016 2017
42,585,310$ 30,603,988$ 28,304,925$ 32,729,214$ 33,299,111$ 36,303,389$ 10,839,302 11,454,695 13,282,992 13,372,436 14,301,335 16,967,107
199,176 235,148 221,834 297,577 388,387 368,300 150,523 325,703 99,254 88,041 113,516 121,459 669,752 15,069,726 15,817,670 17,588,982 16,598,378 16,262,495
7,732,168 7,457,141 7,216,500 8,093,932 8,521,514 9,420,341 7,245,080 7,459,472 4,134,605 5,091,965 5,035,073 5,857,667
335,410 264,601 155,191 301,796 143,439 258,826 7,276,306 7,408,066 7,468,692 7,384,742 8,196,928 9,319,267 1,640,152 1,777,031 1,788,430 2,105,149 1,918,952 2,114,845
402,992 391,781 281,957 251,433 196,131 187,562 7,033,279 7,423,986 7,528,706 7,591,939 8,395,747 8,658,008 2,232,768 2,580,468 2,422,546 2,561,420 2,723,857 2,902,373 1,568,814 1,481,061 2,014,929 2,026,274 2,199,399 4,091,097 5,568,068 6,146,987 6,710,022 8,093,844 6,665,390 7,340,430 1,068,171 977,180 1,081,018 1,081,167 1,324,026 1,354,644 1,738,970 2,498,213 1,579,546 1,090,791 1,060,057 784,016 4,733,369 4,733,369 4,815,340 4,862,059 5,154,810 5,284,118
103,019,610 108,288,616 104,924,157 114,612,761 116,236,050 127,595,944
962,362 905,890 1,282,628 1,029,543 1,261,926 1,491,595 12,960 17,320 18,705 19,665 10,005 545
- - - - - - - - - - - -
1,536 - - - - - 1,167 - - - - -
- - - - - - - - - - - -
31,944 - - - - - - 217,065 88,352 79,051 104,865 74,545 - - - - - -
1,333,773 1,131,229 1,065,941 1,095,420 1,053,871 1,065,121 269,987 318,828 424,589 480,322 577,022 531,269
21,613,045 16,606,922 15,264,059 15,545,074 16,370,983 16,673,827 - - - 11,289,980 108,954 -
24,226,774 19,197,254 18,144,274 29,539,055 19,487,626 19,836,902
(78,792,836)$ (89,091,362)$ (86,779,883)$ (85,073,706)$ (96,748,424)$ (107,759,042)$ (continued)
119

Springfield City School DistrictChanges in Net PositionGovernmental ActivitiesLast Ten Fiscal Years (accrual basis of accounting)(continued)
Fiscal Year 2008 2009 2010 2011
General Revenues:Property Taxes Levied for: General Purposes 21,606,509$ 22,126,066$ 20,978,321$ 19,890,366$ Debt Service 3,910,137 3,812,724 4,312,062 4,163,701 Capital Outlay 959,601 713,133 650,578 1,141,206 Facilities Maintenance 254,555 250,471 240,884 238,146 Grants and Entitlements not Restricted to Specific Programs 43,674,024 46,431,981 54,043,542 54,806,827 Investment Earnings 1,774,771 665,442 286,221 90,151 Miscellaneous 445,563 550,860 352,647 417,514
Gain on Sale of Capital Assets - - - -
Total General Revenues 72,625,160 74,550,677 80,864,255 80,747,911
Prior Year Restatement - - - -
Change in Net Position 8,725,360$ 584,429$ 6,356,307$ 6,548,531$
120

2012 2013 2014 2015 2016 2017
20,056,407$ 19,342,891$ 20,346,092$ 20,587,370$ 20,894,336$ 19,686,341$ 4,105,034 3,269,688 2,603,938 2,609,543 2,741,429 2,606,580
197,061 654,546 672,263 683,514 696,561 665,801 233,025 229,821 236,075 240,578 244,131 233,870
52,933,220 58,543,009 61,870,010 67,762,794 72,808,491 78,093,810 284,901 126,065 173,477 87,201 230,961 190,483
1,063,677 778,516 576,058 1,039,708 1,057,731 645,704 - - - - - -
78,873,325 82,944,536 86,477,913 93,010,708 98,673,640 102,122,589
- - - - - -
80,489$ (6,146,826)$ (301,970)$ 7,937,002$ 1,925,216$ (5,636,453)$
121

Springfield City School DistrictFund Balances - Governmental FundsLast Ten Fiscal Years(modified accrual basis of accounting)
2008 2009 2010 2011
General Fund: Restricted -$ -$ 1,326,046$ 1,249,178$ Committed - - 11,000 11,000 Assigned - - 569,315 1,816,872 Unassigned - - 20,087,757 21,190,116 Reserved 5,189,476 6,740,373 - - Unreserved (Deficit) (1,379,067) 4,380,681 - -
Total General Fund (Deficit) 3,810,409 11,121,054 21,994,118 24,267,166
All Other Governmental Funds: Nonspendable - - 41,620 16,953 Restricted - - 14,557,617 13,730,432 Committed - - 75,425 136,326 Unassigned - - (3,781,698) (1,903,296) Reserved 8,319,515 3,680,185 - - Unreserved, Undesignated (Deficit), Reported in: Special Revenue Funds 3,675,599 2,727,072 - - Debt Service Funds 6,637,702 6,398,209 - - Capital Projects Funds 1,273,530 893,990 - -
Total All Other Governmental Funds 19,906,346 13,699,456 10,892,964 11,980,415
Total Governmental Funds 23,716,755$ 24,820,510$ 32,887,082$ 36,247,581$
The School District implemented GASB 54 in fiscal year 2010.
122

2012 2013 2014 2015 2016 2017
-$ -$ -$ -$ -$ -$ 11,000 11,000 11,000 11,000 11,000 11,000
4,889,849 2,044,205 2,050,295 5,781,891 4,950,450 1,309,480 20,990,372 22,051,560 24,003,989 19,352,136 21,034,725 27,966,186
- - - - - - - - - - - -
25,891,221 24,106,765 26,065,284 25,145,027 25,996,175 29,286,666
19,567 - - - - - 13,424,532 12,571,081 16,014,346 15,769,265 14,536,312 13,875,094
128,645 68,473 80,332 109,172 106,307 93,337 (1,680,879) (1,295,527) (535,717) (414) (21,176) (115,943)
- - - - - -
- - - - - - - - - - - - - - - - - -
11,891,865 11,344,027 15,558,961 15,878,023 14,621,443 13,852,488
37,783,086$ 35,450,792$ 41,624,245$ 41,023,050$ 40,617,618$ 43,139,154$
123

Springfield City School DistrictChanges in Fund Balances - Governmental FundsLast Ten Fiscal Years(modified accrual basis of accounting)
2008 2009 2010 2011
Revenues:Property Taxes 26,037,975$ 27,397,079$ 25,523,863$ 24,700,079$ Intergovernmental 91,072,774 74,101,419 78,338,410 77,593,123 Investment Earnings 1,798,633 591,030 246,957 62,376 Increase (Decrease) in Fair Value of Investments (84,598) - - - Tuition and Fees 1,853,954 1,195,941 1,263,384 1,192,957 Extracurricular Activities 358,925 279,393 251,343 287,905 Rentals 16,898 19,912 28,690 31,029 Charges for Services 918,251 1,120,832 1,072,923 1,047,344 Contributions and Donations 54,459 75,338 15,603 12,339 Miscellaneous 445,563 550,860 352,647 405,858
Total Revenues 122,472,834 105,331,804 107,093,820 105,333,010
Expenditures:Current:
Instruction: Regular 39,375,026 40,154,588 39,452,176 43,298,640 Special 10,083,496 10,152,738 11,787,128 10,549,482 Vocational 414,629 213,312 198,329 198,329 Adult/Continuing 261,753 141,456 119,716 128,281 Student Intervention Services 1,737,343 1,882,924 1,490,488 400,869 Support Services: Pupils 5,898,809 5,687,337 6,514,307 6,980,301 Instructional Staff 7,136,895 6,677,472 7,478,741 7,190,667 Board of Education 205,787 202,439 329,567 233,064 Administration 6,018,205 6,438,872 6,380,678 6,905,072 Fiscal 1,645,196 1,530,193 1,553,080 1,532,929 Business 354,993 362,042 576,928 296,916 Operation and Maintenance of Plant 7,599,335 8,026,038 7,513,983 7,641,074 Pupil Transportation 1,908,896 2,085,567 2,133,109 2,725,609 Central 766,860 476,258 688,599 1,214,151 Operation of Non-Instructional Services 6,010,956 7,047,588 5,284,008 4,758,326 Extracurricular Activities 949,361 1,170,683 751,944 1,009,326
Capital Outlay 29,962,375 9,441,964 1,596,306 2,632,858 Debt Service:
Principal Retirement 3,349,783 4,054,503 2,473,778 2,523,131 Interest and Fiscal Charges 1,861,975 1,661,639 1,481,789 1,428,132 Escrow - - - - Accretion - - 1,262,206 1,291,292 Issuance Costs - 71,586 - 19,062
Total Expenditures 125,541,673 107,479,199 99,066,860 102,957,511
Excess of Revenues Over (Under) Expenditures (3,068,839)$ (2,147,395)$ 8,026,960$ 2,375,499$
124

2012 2013 2014 2015 2016 2017
23,770,433$ 23,930,875$ 23,547,802$ 23,953,967$ 24,542,230$ 23,328,634$ 76,898,961 75,646,031 77,111,332 94,738,218 89,663,907 94,272,297
305,194 132,154 173,477 87,201 230,961 190,483 - - - - - -
1,302,183 1,368,403 1,728,198 1,465,523 1,691,562 1,907,516 308,708 353,868 424,589 480,322 577,022 531,269 31,944 28,474 23,620 26,079 110,603 168,187
1,009,793 868,061 727,428 758,156 739,105 724,290 37,470 38,975 30,430 45,462 39,913 58,969
1,076,333 711,065 522,008 958,294 907,215 363,282
104,741,019 103,077,906 104,288,884 122,513,222 118,502,518 121,544,927
42,683,517 30,151,615 28,515,528 33,168,097 33,284,220 32,826,151 10,768,489 11,205,565 13,301,443 13,537,505 14,294,574 15,507,608
199,176 235,148 221,834 298,439 388,387 368,300 147,745 325,382 98,711 83,021 112,366 114,017 666,101 15,068,825 15,818,217 17,666,227 16,588,827 16,077,770
7,560,144 7,349,161 7,249,731 8,098,967 8,624,926 8,682,301 7,168,923 7,404,501 4,197,510 5,140,932 5,008,586 5,371,330
335,410 264,601 155,191 302,426 144,079 257,123 7,246,785 7,379,307 7,476,384 7,646,462 8,113,276 8,148,379 1,635,984 2,230,244 1,684,117 2,007,124 1,790,412 2,417,502
400,872 395,968 279,331 241,702 204,052 170,442 7,131,654 7,278,455 7,580,203 7,786,023 8,471,791 8,330,734 2,689,835 2,726,276 2,551,218 2,633,329 2,664,889 2,668,114 2,497,400 1,376,274 1,925,881 2,072,321 2,475,891 3,890,161 5,477,580 6,054,537 6,563,349 6,523,784 6,707,200 7,402,907 1,081,203 987,839 1,091,994 1,102,028 1,298,772 1,310,616
462,870 545,747 2,000,728 9,534,374 5,352,818 2,968,965
2,656,658 2,709,221 1,145,060 2,562,273 2,430,549 2,497,608 1,143,807 2,313,715 2,378,033 2,614,995 952,335 550,077
- - - 104,258 - - 1,316,383 - - - - -
- - - - - 167,818
103,270,536 106,002,381 104,234,463 123,124,287 118,907,950 119,727,923
1,470,483$ (2,924,475)$ 54,421$ (611,065)$ (405,432)$ 1,817,004$ (continued)
125
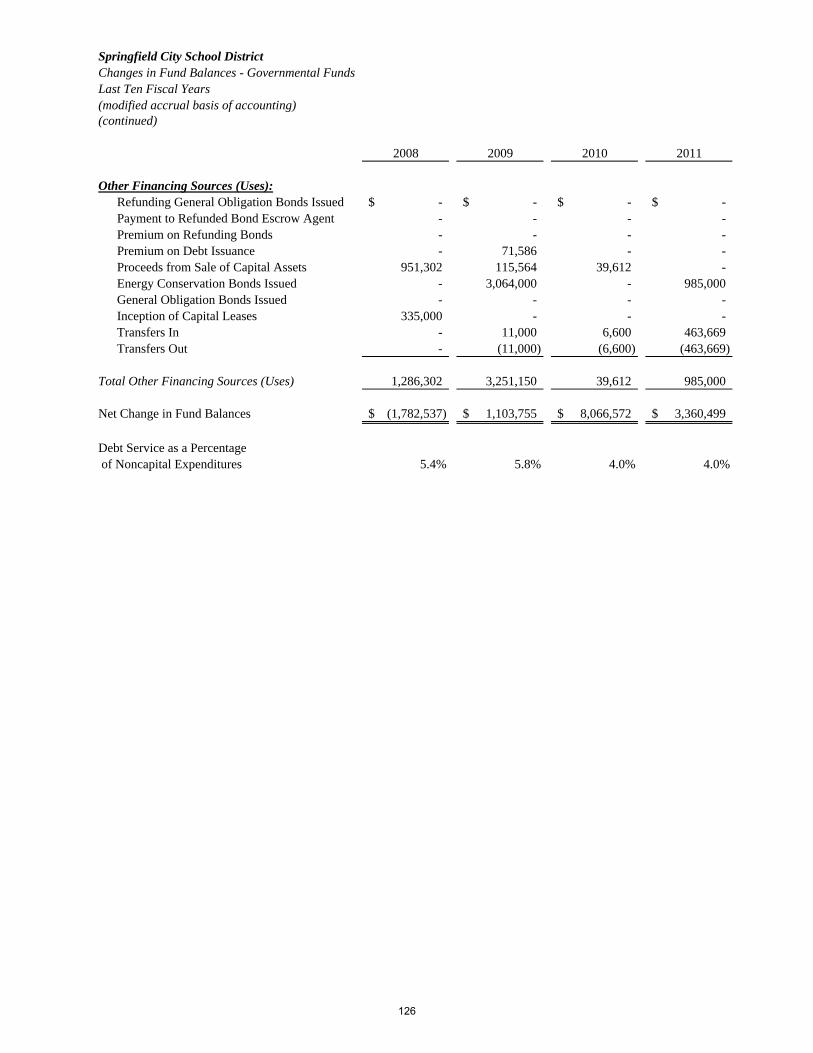
Springfield City School DistrictChanges in Fund Balances - Governmental FundsLast Ten Fiscal Years(modified accrual basis of accounting)(continued)
2008 2009 2010 2011
Other Financing Sources (Uses): Refunding General Obligation Bonds Issued -$ -$ -$ -$ Payment to Refunded Bond Escrow Agent - - - - Premium on Refunding Bonds - - - - Premium on Debt Issuance - 71,586 - - Proceeds from Sale of Capital Assets 951,302 115,564 39,612 - Energy Conservation Bonds Issued - 3,064,000 - 985,000 General Obligation Bonds Issued - - - - Inception of Capital Leases 335,000 - - - Transfers In - 11,000 6,600 463,669 Transfers Out - (11,000) (6,600) (463,669)
Total Other Financing Sources (Uses) 1,286,302 3,251,150 39,612 985,000
Net Change in Fund Balances (1,782,537)$ 1,103,755$ 8,066,572$ 3,360,499$
Debt Service as a Percentage of Noncapital Expenditures 5.4% 5.8% 4.0% 4.0%
126

2012 2013 2014 2015 2016 2017
-$ -$ -$ -$ -$ 11,675,000$ - - - - - (12,308,041) - - - - - - - - 227,294 - - 800,859
65,022 69,428 11,738 9,870 - 47,265 - - - - - - - - 5,880,000 - - - - 522,753 - - - 489,449
295,218 716,273 547,250 525,750 1,730,000 1,730,000 (295,218) (716,273) (547,250) (525,750) (1,730,000) (1,730,000)
65,022 592,181 6,119,032 9,870 - 704,532
1,535,505$ (2,332,294)$ 6,173,453$ (601,195)$ (405,432)$ 2,521,536$
3.8% 4.9% 3.5% 4.3% 3.0% 2.8%
127

Springfield City School DistrictAssessed Valuation and Estimated Actual Value of Taxable PropertyLast Ten Collection (Calendar) Years
Real Property Tangible Personal Property
Collection Residential/ Commercial/ Total Estimated Assessed EstimatedYear Agricultural Industrial/PU Real Property Actual Value Value Actual Value
2008 501,845,620 212,070,710 713,916,330 2,039,760,943 24,561,290 98,245,160
2009 496,581,440 214,643,590 711,225,030 2,032,071,514 25,631,950 102,527,800
2010 484,517,960 195,478,840 679,996,800 1,942,848,000 26,700,460 106,801,840
2011 448,100,050 199,437,871 647,537,921 1,850,108,346 27,559,950 110,239,800
2012 445,578,690 197,361,610 642,940,300 1,836,972,286 27,795,160 111,180,640
2013 442,793,780 180,881,040 623,674,820 1,781,928,057 30,231,110 120,924,440
2014 399,539,970 173,118,880 572,658,850 1,636,168,143 30,731,110 122,924,440
2015 395,474,060 167,194,220 562,668,280 1,607,623,657 36,181,960 144,727,840
2016 393,717,610 164,195,290 557,912,900 1,594,036,857 38,210,300 152,841,200
2017 397,906,370 167,710,520 565,616,890 1,616,048,257 43,506,600 174,026,400
Real property is reappraised every six years with a State mandated update of the current market value in thethird year following each reappraisal.
The assessed value of real property (including public utility real property) is 35 percent of estimated true value. The assessed value of public utility personal property ranges from 25 percent of true value for railroad property to 88 percent for electrictransmission and distribution property. General business tangible property was assessed in previous years at 25 percent for machinery and equipment and 23 percent for inventories. General business tangible personal property tax has been phased out.The assessment percent was 18.75 percent for 2006, 12.5 percent for 2007, 6.25 percent for 2008, and zero for 2009. Beginning in 2007, House Bill 66 switched telephone companies from being public utilities to general business taxpayers and began a four year phase out of the tangible personal property tax on local and inter-exchange telephone companies. No tangible personal property taxes were levied or collected in 2009 from general business taxpayers, except telephone companies whose last year to pay tangible personal property tax is 2010. The percentages for telecommunications are 10.0 percent for 2009, 5.0 percent for 2010 and zero for 2011.
The tangible personal property values associated with each year are the values that, when multiplied by the applicable rates,generated the property tax revenue billed in that year. For real property, the amounts generated by multiplying the assessed values by the applicable rates would be reduced by the 10 percent rollback, 2 1/2 percent rollback, and homestead exemptions before being billed. The 10 percent rollback for commercial/industrial property was eliminated in 2006.
Source: Ohio Department of Taxation
(1) Ratio represents assessed value/total estimated actual value.
Public UtilityAssessed Value
128

Tangible Personal Property
Direct RateAssessed Estimated Assessed Estimated (per $1,000 of
Value Actual Value Value Actual Value Ratio (1) assessed value)
17,337,190 277,395,040 755,814,810 2,415,401,143 31.29 63.25
2,210,900 22,109,000 739,067,880 2,156,708,314 34.27 63.74
2,147,940 42,958,800 708,845,200 2,092,608,640 33.87 64.82
0 0 675,097,871 1,960,348,146 34.44 65.25
0 0 670,735,460 1,948,152,926 34.43 65.34
0 0 653,905,930 1,902,852,497 34.36 64.02
0 0 603,389,960 1,759,092,583 34.30 64.60
0 0 598,850,240 1,752,351,497 34.17 65.05
0 0 596,123,200 1,746,878,057 34.13 65.26
0 0 609,123,490 1,790,074,657 34.03 64.93
General BusinessTotal
129

Percentageof RealProperty
Assessed AssessedTax Payer Value Valuation
Allied Park LLC 3,732,370$ 0.66%The City of Springfield 3,651,740 0.65%FB Springfeild NP LLC 1,343,300 0.24%FB Springfield GA LLC 1,409,590 0.25%HCP CC SNF LLC 2,657,900 0.47%Springfield Surgical Properties 2,655,480 0.47%Westerville Square Inc 2,384,930 0.42%CREFIII Waramaug Springfield 2,275,910 0.40%Coventry Village LLC 2,054,790 0.36%Jan LTD 2,004,300 0.35%
Subtotal 24,170,310 4.27%
All Others 541,446,580 95.73%
Total Assessed Valuation 565,616,890$ 100.00%
Percentageof RealProperty
Assessed AssessedTax Payer Value Valuation
Ohio Edison Company 17,403,670$ 2.36%American Transmission System 3,434,290 0.47%Allied SSR Shopping Center Inc. 3,420,190 0.46%AHE of Ohio, Inc 3,086,760 0.42%Community Hospital of Springfield 2,762,510 0.37%Coventry Village LLC 1,945,540 0.26%Eby Brown Company LLC 1,815,300 0.25%Wellington Square Hotel 1,750,000 0.24%DW28 Sylvania Towers LLC 1,731,500 0.23%JAN Ltd. 1,713,910 0.23%
Subtotal 39,063,670 5.29%
All Others 700,004,210 94.71%
Total Assessed Valuation 739,067,880$ 100.00%
Source: Clark County Auditor(1) Earliest year available is 2009
Springfield City School DistrictPrincipal Real Property Taxpayers Tax Year 2016 and 2009(1)
2016
2009
130

131

Springfield City School DistrictProperty Tax Rates (Per $1,000 of Assessed Valuation)Direct and Overlapping GovernmentsLast Ten Collection (Calendar) Years
2008 2009 2010 UNVOTED MILLAGE:Operating $6.60 $6.60 $6.60
VOTED MILLAGE - BY LEVY:1976 Current Expense Residential/Agricultural Real $6.10 $6.17 $6.32 Commercial/Industrial and Public Utility Real 11.72 12.12 12.60 General Business and Public Utility Personal 26.50 26.50 26.50
1987 Current Expense Residential/Agricultural Real 3.05 3.08 3.16 Commercial/Industrial and Public Utility Real 4.07 4.21 4.38 General Business and Public Utility Personal 7.00 7.00 7.00
1991 Bond Levy ($20,000,000) Residential/Agricultural Real 2.16 2.21 2.37 Commercial/Industrial and Public Utility Real 2.16 2.21 2.37 General Business and Public Utility Personal 2.16 2.21 2.37
1996 Permanent Improvement Residential/Agricultural Real 0.99 1.00 1.02 Commercial/Industrial and Public Utility Real 1.16 1.20 1.24 General Business and Public Utility Personal 1.55 1.55 1.55
2000 Current Expense Residential/Agricultural Real 5.07 5.13 5.25 Commercial/Industrial and Public Utility Real 5.41 5.59 5.81 General Business and Public Utility Personal 7.00 7.00 7.00
2000 Bond Levy ($29,853,000) Residential/Agricultural Real 2.80 2.83 3.33 Commercial/Industrial and Public Utility Real 2.80 2.83 3.33 General Business and Public Utility Personal 2.80 2.83 3.33
2000 Site Acquisition ($8,250,000) Residential/Agricultural Real 0.79 0.79 0.82 Commercial/Industrial and Public Utility Real 0.79 0.79 0.82 General Business and Public Utility Personal 0.79 0.79 0.82
2001 Classroom Facilities Residential/Agricultural Real 0.36 0.37 0.38 Commercial/Industrial and Public Utility Real 0.39 0.40 0.42 General Business and Public Utility Personal 0.50 0.50 0.50
2006 Emergency Levy ($6,462,895) Residential/Agricultural Real 8.35 8.76 9.15 Commercial/Industrial and Public Utility Real 8.35 8.76 9.15 General Business and Public Utility Personal 8.35 8.76 9.15
132

2011 2012 2013 2014 2015 2016 2017
$6.60 $6.60 $6.60 $6.60 $6.60 $6.60 $6.60
$6.83 $6.85 $6.88 $7.64 $7.72 $7.74 $7.6412.84 13.01 13.18 13.83 14.31 14.51 14.2926.50 26.50 26.50 26.50 26.50 26.50 26.50
3.41 3.42 3.44 3.82 3.86 3.87 3.824.46 4.52 4.57 4.80 4.97 5.04 4.967.00 7.00 7.00 7.00 7.00 7.00 7.00
2.49 2.51 0.00 0.00 0.00 0.00 0.002.49 2.51 0.00 0.00 0.00 0.00 0.002.49 2.51 0.00 0.00 0.00 0.00 0.00
1.11 1.11 1.11 1.24 1.25 1.25 1.241.27 1.28 1.30 1.36 1.41 1.43 1.411.55 1.55 1.55 1.55 1.55 1.55 1.55
5.67 5.69 5.72 6.35 6.41 6.43 6.355.92 6.00 6.78 6.37 6.60 6.69 6.597.00 7.00 7.00 7.00 7.00 7.00 7.00
3.14 3.12 4.08 3.48 3.52 3.62 3.473.14 3.12 0.00 0.00 3.52 3.62 3.473.14 3.12 4.08 3.48 3.52 3.62 3.47
0.88 0.87 0.90 0.96 0.85 0.91 0.970.88 0.87 0.90 0.96 0.85 0.91 0.970.88 0.87 0.90 0.96 0.85 0.91 0.97
0.41 0.41 0.41 0.45 0.46 0.46 0.450.42 0.43 0.43 0.45 0.47 0.48 0.470.50 0.50 0.50 0.50 0.50 0.50 0.50
9.59 0.00 0.00 0.00 0.00 0.00 0.009.59 0.00 0.00 0.00 0.00 0.00 0.009.59 0.00 0.00 0.00 0.00 0.00 0.00
(continued)
133

2008 2009 2010
2011 Emergency Levy ($6,462,895) Residential/Agricultural Real 0.00 0.00 0.00 Commercial/Industrial and Public Utility Real 0.00 0.00 0.00 General Business and Public Utility Personal 0.00 0.00 0.00
2013 Bond Levy Residential/Agricultural Real 0.00 0.00 0.00 Commercial/Industrial and Public Utility Real 0.00 0.00 0.00 General Business and Public Utility Personal 0.00 0.00 0.00
TOTAL VOTED MILLAGE BY TYPE OF PROPERTY Residential/Agricultural Real $29.67 $30.34 $31.80 Commercial/Industrial and Public Utility Real 36.85 38.11 40.12 General Business and Public Utility Personal 56.65 57.14 58.22
TOTAL MILLAGE BY TYPE OF PROPERTY Residential/Agricultural Real 36.27 36.94 38.40 Commercial/Industrial and Public Utility Real 43.45 44.71 46.72 General Business and Public Utility Personal 63.25 63.74 64.82
OVERLAPPING RATES BY TAXING DISTRICT (1)TOWNSHIPS: Residential/Agricultural Real 0.03 - 1.85 0.03 - 1.87 0.03 - 1.87 Commercial/Industrial and Public Utility Real 0.03 - 1.64 0.03 - 1.66 0.03 - 1.69 General Business and Public Utility Personal 0.03 - 2.00 0.03 - 2.00 0.03 - 2.00 CORPORATIONS: Residential/Agricultural Real 0.30 - 3.00 0.30 - 3.00 0.30 - 3.00 Commercial/Industrial and Public Utility Real 0.30 - 3.00 0.30 - 3.00 0.30 - 3.00 General Business and Public Utility Personal 0.30 - 3.00 0.30 - 3.00 0.30 - 3.00 SPRINGFIELD-CLARK COUNTY JOINT VOCATIONAL SCHOOL DISTRICT: Residential/Agricultural Real 0.77 - 1.54 0.77 - 1.55 0.79 - 1.57 Commercial/Industrial and Public Utility Real 0.76 - 1.51 0.77 - 1.53 0.78 - 1.56 General Business and Public Utility Personal 1.00 - 2.00 1.00 - 2.00 1.00 - 2.00 COUNTY AND OTHER UNITS:
Residential/Agricultural Real 0.03 - 3.01 0.03 - 3.03 0.03 - 3.08 Commercial/Industrial and Public Utility Real 0.03 - 2.84 0.03 - 2.87 0.03 - 2.92 General Business and Public Utility Personal 0.03 - 3.50 0.03 - 3.50 0.03 - 3.50
Source: Ohio Department of Taxation
The rates presented for a particular calendar year are the rates that, when applied to the assessed values presented in the
Assessed Value Table, generated the property tax revenue for that year.
Rates may only be raised by obtaining the approval of the voters at a public election.
Real property tax rates are reduced so that inflationary increases in value do not generate additional taxes. Real property
is reappraised every six years and property values are updated in the third year following each reappraisal.
(1) The overlapping rates by taxing district are presented for all overlapping governments by type of government and
property type. Each corresponding range provides the lowest and highest tax rate for each type of property by
government type. All property tax rates for each type of government fall within the ranges presented.
(continued)
Springfield City School DistrictProperty Tax Rates (Per $1,000 of Assessed Valuation)Direct and Overlapping GovernmentsLast Ten Collection (Calendar) Years
134

2011 2012 2013 2014 2015 2016 2017
0.00 9.69 9.89 10.67 10.80 10.84 10.620.00 9.69 9.89 10.67 10.80 10.84 10.620.00 9.69 9.89 10.67 10.80 10.84 10.62
0.00 0.00 0.00 0.34 0.73 0.74 0.720.00 0.00 0.00 0.34 0.73 0.74 0.720.00 0.00 0.00 0.34 0.73 0.74 0.72
$33.53 $33.67 $32.43 $34.95 $35.60 $35.86 $35.2841.01 41.43 37.04 38.77 43.66 44.25 43.4958.65 58.74 57.42 58.00 58.45 58.66 58.33
40.13 40.27 39.03 41.55 42.20 42.46 41.8847.61 48.03 43.64 45.37 50.26 50.85 50.0965.25 65.34 64.02 64.60 65.05 65.26 64.93
0.03 - 2.00 0.03 - 2.00 0.03 - 2.00 0.03 - 2.00 0.03 - 2.00 0.03 - 2.00 0.03 - 2.000.03 - 1.74 0.03 - 1.76 0.03 - 1.76 0.03 - 1.76 0.03 - 1.76 0.03 - 1.76 0.03 - 1.760.03 - 2.00 0.03 - 2.00 0.03 - 2.00 0.03 - 2.00 0.03 - 2.00 0.03 - 2.00 0.03 - 2.00
0.30 - 3.00 0.30 - 3.00 0.30 - 3.00 0.30 - 3.00 0.30 - 3.00 0.30 - 3.00 0.30 - 3.000.30 - 3.00 0.30 - 3.00 0.30 - 3.00 0.30 - 3.00 0.30 - 3.00 0.30 - 3.00 0.30 - 3.000.30 - 3.00 0.30 - 3.00 0.30 - 3.00 0.30 - 3.00 0.30 - 3.00 0.30 - 3.00 0.30 - 3.00
0.82 - 1.64 0.82 - 1.64 0.82 - 1.64 0.82 - 1.64 0.82 - 1.64 0.82 - 1.64 0.82 - 1.640.79 - 1.57 0.82 - 1.64 0.82 - 1.64 0.87 - 1.75 0.87 - 1.75 0.87 - 1.75 0.87 - 1.751.00 - 2.00 1.00 - 2.00 1.00 - 2.00 1.00 - 2.00 1.00 - 2.00 1.00 - 2.00 1.00 - 2.00
0.48 - 3.20 0.60 - 3.21 0.60 - 3.21 0.60 - 3.21 0.60 - 3.21 0.60 - 3.21 0.60 - 3.210.58 - 2.95 0.60 - 3.07 0.60 - 3.07 0.60 - 3.07 0.60 - 3.07 0.60 - 3.07 0.60 - 3.071.00 - 3.50 0.60 - 3.50 0.60 - 3.50 0.60 - 3.50 0.60 - 3.50 0.60 - 3.50 0.60 - 3.50
135

Springfield City School District
Property Tax Levies and Collections - Real, Public Utility Personal
and General Business Personal PropertyLast Ten Collection (Calendar) Years
Total Current Percent DelinquentCollection Tax Tax of Current Levy Tax Total TaxYear (1) Levied (2) Collection Collected Collection (3) Collections
2007 33,077,855 26,611,945 80.45% 1,450,860 28,062,805
2008 34,003,514 25,447,519 74.84% 1,629,100 27,076,619
2009 32,505,854 25,626,121 78.84% 1,870,135 27,496,256
2010 31,700,100 26,587,887 83.87% 1,708,664 28,296,551
2011 32,045,110 26,580,451 82.95% 1,464,534 28,044,985
2012 32,224,077 22,679,782 70.38% 1,464,564 24,144,346
2013 30,763,752 22,637,334 73.58% 1,297,985 23,935,319
2014 30,806,645 22,054,543 71.59% 1,471,964 23,526,507
2015 31,177,109 22,199,346 71.20% 1,337,038 23,536,384
2016 31,435,805 22,902,117 72.85% 1,302,857 24,204,974
Source: Clark County Auditor
(1) The 2017 information cannot be presented because all collections have not been made by June 30, 2017.
(2) Taxes levied and collected are presented on a cash basis because thatis the manner that information is maintained by the County Auditor.
(3) Penalties and interest are included since, by Ohio law, they become part of the tax obligation as assessment occurs.
136

Percent Percent ofof Total Outstanding Outstanding
Collections Delinquent Delinquent TaxesTo Total Levy Taxes To Total Tax Levied
84.84% 5,031,848 15.21%
79.63% 6,214,388 18.28%
84.59% 5,603,350 17.24%
89.26% 6,146,955 19.39%
87.52% 6,354,319 19.83%
74.93% 6,600,544 20.48%
77.80% 6,717,322 21.84%
76.37% 7,280,138 23.63%
75.49% 7,640,725 24.51%
77.00% 7,511,229 23.89%
137

Springfield City School DistrictRatio of Debt to Estimated Actual Value, Personal Income and Debt Per CapitaLast Ten Fiscal Years
General Energy TotalFiscal Obligation Conservation Capital Outstanding EstimatedYear Bonds (1) Notes (1) Leases (1) Debt Actual Value (2)
2008 36,945,713 0 1,011,799 37,957,512 2,415,401,143
2009 37,727,063 0 227,296 37,954,359 2,156,708,314
2010 34,913,791 0 161,312 35,075,103 2,092,608,640
2011 32,012,913 985,000 91,889 33,089,802 1,960,348,146
2012 28,754,776 920,000 18,848 29,693,624 1,948,152,926
2013 26,828,194 855,000 480,930 28,164,124 1,902,852,497
2014 31,032,142 790,000 394,090 32,216,232 1,759,092,583
2015 27,082,368 725,000 310,592 28,117,960 1,752,351,497
2016 24,864,945 660,000 215,043 25,739,988 1,746,878,057
2017 22,261,286 595,000 456,316 23,312,602 1,790,074,657
Source: (1) School District Financial Records; includes outstanding principal on debt issuances, as well as accretion on capital appreciation bonds, unamortized premiums, and loss on refunding of bonds.(2) Ohio Department of Taxation(3) City of Springfield Comprehensive Annual Financial Report; information is reported for calendar years 2007 through 2016 as fiscal years 2008 through 2017.
138

Total Ratio of Ratio ofPersonal Debt to Estimated Debt to Personal Debt
Population (3) Income (3) Actual Value Income Per Capita
64,483 1,329,346,768 1.57% 2.86% 588.64
62,417 1,413,044,050 1.76% 2.69% 608.08
62,269 1,135,131,514 1.68% 3.09% 563.28
60,608 1,089,004,544 1.69% 3.04% 545.96
60,652 1,263,706,413 1.52% 2.35% 489.57
60,147 1,297,648,541 1.48% 2.17% 468.25
60,147 1,232,106,100 1.83% 2.61% 535.62
59,357 1,105,998,981 1.60% 2.54% 473.71
59,680 1,121,117,244 1.47% 2.30% 431.30
59,680 1,150,093,280 1.30% 2.03% 390.63
139

Ratio of GeneralGeneral Obligation Debt General
Fiscal Obligation Estimated to Estimated Obligation DebtYear Bonded Debt (1) Actual Value (2) Population (3) Actual Value Per Capita
2008 36,945,713 2,415,401,143 64,483 1.53% 572.95
2009 37,727,063 2,156,708,314 62,417 1.75% 604.44
2010 34,913,791 2,092,608,640 62,269 1.67% 560.69
2011 32,997,913 1,960,348,146 60,608 1.68% 544.45
2012 29,674,776 1,948,152,926 60,652 1.52% 489.26
2013 27,683,194 1,902,852,497 60,147 1.45% 460.26
2014 31,822,142 1,759,092,583 60,147 1.81% 529.07
2015 27,807,368 1,752,351,497 59,357 1.59% 468.48
2016 25,524,945 1,746,878,057 59,680 1.46% 427.70
2017 22,856,286 1,790,074,657 59,680 1.28% 382.98
Source: (1) Includes the School District's general obligation bonds and energy conservation bonds(2) Ohio Department of Taxation(3) City of Springfield Comprehensive Annual Financial Report; information is reported for calendar years 2007 through 2016 as fiscal years 2008 through 2017.
Note: Although the general obligation bond retirement fund is restricted for debt service, it is not specifically restricted to the payment of principal. Therefore, these resources are not shown as a deduction from general obligation bonded debt.
Springfield City School DistrictRatio of General Obligation Bonded Debt to Estimated Actual Value and General Obligation Bonded Debt Per CapitaLast Ten Fiscal Years
140

DebtAttributable to Percentage AmountGovernmental Applicable to Applicable to
Jurisdiction Activities District (1) District
Direct:Springfield City School District:
General Obligation Bonds $22,261,286 100.00 $22,261,286Energy Conservation Notes 595,000 100.00 595,000Capital Lease Obligation 456,316 100.00 456,316
Total Direct Debt 23,312,602 23,312,602
Overlapping:Clark County:
General Obligation Bonds 8,625,000 25.88 2,232,150General Obligation Note 7,805,000 25.88 2,019,934
Springfield-Clark County Joint Vocational School District:Capital Lease Obligation 432,427 25.75 111,350HB 264 Bonds 720,000 25.75 185,400
City of Springfield:General Obligation Bonds 1,575,000 75.45 1,188,338Department of Development Loan 1,274,000 75.45 961,233
Total Overlapping Debt 20,431,427 6,698,405
Total Direct and Overlapping Debt $43,744,029 $30,011,007
Source: Ohio Municipal Advisory Council (1) Overlapping governments are those that coincide, at least in part, with the geographic boundaries of theSchool District. This schedule estimates the portion of the outstanding debt of those overlapping governments that is borne by the residents and businesses of the School District. This process recognizes that, when considering the School District's ability to issue and repay long-term debt, the entiredebt burden borne by the residents and businesses should be taken into account. However, this does notimply that every taxpayer is a resident, and therefore, responsible for repaying the debt of eachoverlapping government.
Springfield City School DistrictComputation of Direct and Overlapping DebtJune 30, 2017
141

2008 2009 2010
Total Assessed Valuation 755,814,810$ 739,067,880$ 708,845,200$ Less Railroad and Telephone Property Valuation (122,050) (116,630) (121,570) Less General Business Tangible Personal Property Valuation (17,337,190) (2,210,900) (2,147,940)
Total Assessed Valuation used to Calculate Legal Debt Margin (1) 738,355,570 736,740,350 706,575,690
Overall debt limitation - 9.0% of assessed valuation (2) 66,452,001 66,306,632 63,591,812
Gross indebtedness authorized by the School District 31,770,760 31,564,760 29,156,966 Less exempt debt: Energy Conservation Notes - (3,064,000) (2,814,000)
Debt within 9.0% limitation 31,770,760 28,500,760 26,342,966
Less amount available in the debt service fund (7,004,400) (6,962,224) (6,895,042)
Net debt within 9.0% limitation 24,766,360 21,538,536 19,447,924
Legal debt margin within 9.0% limitation 41,685,641$ 44,768,096$ 44,143,888$
Legal Debt Margin as a Percentage of the Debt Limit 62.7% 67.5% 69.4%
Energy Conservation Debt limitation 0.9% of assessed valuation 6,645,200$ 6,630,663$ 6,359,181$
Net debt within 0.9% limitation - (3,064,000) (2,814,000)
Energy Conservation Debt Margin 6,645,200$ 3,566,663$ 3,545,181$
Energy Conservation Debt Margin as a Percentage of theEnergy Conservation Debt Limit 100.0% 53.8% 55.7%
Unvoted debt limitation .10% of assessed valuation (2) 738,356$ 736,740$ 706,576$
Gross indebtedness authorized by the School District - 3,064,000 2,814,000 Less exempt debt: Energy Conservation Notes - (3,064,000) (2,814,000)
Legal debt margin within .10% limitation 738,356$ 736,740$ 706,576$
Unvoted Legal Debt Margin as a Percentage of theExcess of Revenues Over (Under) Expenditures 100.0% 100.0% 100.0%
Source: Ohio Department of Taxation and School District Records
(1) The definition of tax valuation for the purpose of calculating the debt margin was modified by H.B. 530, effective 3/30/06, to exclude tangible personal property used in business, telephone or telegraph property, interexchange telecommunications company property, and personal property owned or leased by a railroad company and used in railroad operations.
(2) Ohio Bond Law sets a limit of 9 percent for voted debt and .10 percent for unvoted debt.
Springfield City School DistrictComputation of Legal Debt MarginLast Ten Fiscal Years
142

2011 2012 2013 2014 2015 2016 2017
675,097,871$ 670,735,460$ 653,905,930$ 603,389,960$ 598,850,240$ 596,123,200$ 609,123,490$ - - - - - - - - - - - - - -
675,097,871 670,735,460 653,905,930 603,389,960 598,850,240 596,123,200 609,123,490
60,758,808 60,366,191 58,851,534 54,305,096 53,896,522 53,651,088 54,821,114
27,688,258 25,104,641 22,456,091 31,822,142 27,807,368 25,524,945 22,856,286
(3,544,000) (3,214,000) (2,874,000) (2,529,000) (725,000) (660,000) (595,000)
24,144,258 21,890,641 19,582,091 29,293,142 27,082,368 24,864,945 22,261,286
(6,485,072) (6,261,514) (5,201,938) (5,445,537) (5,488,403) (5,473,194) (5,661,513)
17,659,186 15,629,127 14,380,153 23,847,605 21,593,965 19,391,751 16,599,773
43,099,622$ 44,737,064$ 44,471,381$ 30,457,491$ 32,302,557$ 34,259,337$ 38,221,341$
70.9% 74.1% 75.6% 56.1% 59.9% 63.9% 69.7%
6,075,881$ 6,036,619$ 5,885,153$ 5,430,510$ 5,389,652$ 5,365,109$ 5,482,111$
(3,544,000) (3,214,000) (2,874,000) (2,529,000) (725,000) (660,000) (595,000)
2,531,881$ 2,822,619$ 3,011,153$ 2,901,510$ 4,664,652$ 4,705,109$ 4,887,111$
41.7% 46.8% 51.2% 53.4% 86.5% 87.7% 89.1%
675,098$ 670,735$ 653,906$ 603,390$ 598,850$ 596,123$ 609,123$
3,544,000 3,214,000 2,874,000 2,529,000 725,000 660,000 595,000
(3,544,000) (3,214,000) (2,874,000) (2,529,000) (725,000) (660,000) (595,000)
675,098$ 670,735$ 653,906$ 603,390$ 598,850$ 596,123$ 609,123$
100.0% 100.0% 100.0% 100.0% 100.0% 100.0% 100.0%
143

ClarkTotal Per Capita County
Personal Personal Unemployment Year Population (1) Income (1) Income (2) Rate (3)
2008 64,483 1,329,346,768 20,615 6.50
2009 62,417 1,413,044,050 22,639 10.80
2010 62,269 1,135,131,514 18,229 10.70
2011 60,608 1,089,004,544 17,968 10.20
2012 60,652 1,263,706,413 20,835 8.10
2013 60,147 1,297,648,541 21,575 6.60
2014 60,147 1,232,106,100 20,485 6.20
2015 59,357 1,105,998,981 18,633 4.80
2016 59,680 1,121,117,244 18,785 4.80
2017 59,680 1,150,093,280 19,271 5.40
Source: (1) City of Springfield Comprehensive Annual Financial Report; information is reported for calendar years 2007 through 2016 as fiscal years 2008 through 2017.(2) Computation of total personal income divided by population(3) Ohio Department of Job and Family Services
Springfield City School DistrictDemographic and Economic StatisticsLast Ten Fiscal Years
144

Springfield City School DistrictRanking of Top Ten EmployersFor Fiscal Year 2017 and Fiscal Year 2008
2017 2008
Employer Rank Rank
Community Mercy Health Partners 1 1American Security Group 2 2Springfield City School District 3 4Clark County, Ohio 4 3Dole Fresh Vegetables 5 5City of Springfield 6 6Clark State Community College 7 -Kroger (5 stores) 8 7Wal-Mart (2 stores) 9 8Gordon Food Services, LLC 10 10Wittenberg University - 9
Source: City of Springfield Comprehensive Annual Financial report; information reported for calendar year 2016 and 2007 as fiscal years 2017 and 2008. Note: Number of employees by employer is unavailable
145

2009 2010Primary Use Year Built/ Average Daily Average Daily
Buildings of Building Renovated Membership Membership
Fulton Elementary School Elementary K to 6 2004 309 348Kenton Elementary School Elementary K to 6 2004 394 429Kenwood Elementary School Elementary K to 6 2004 371 413Lagonda Elementary School Elementary K to 6 2004 451 358Lincoln Elementary School Elementary K to 6 2004 369 387Mann Elementary School Elementary K to 6 2004 422 484Perrin Woods Elementary School Elementary K to 6 2004 398 444Snowhill Elementary School Elementary K to 6 2006 425 485Snyder Park Elementary Elementary K to 6 2006 400 404Warder Park - Wayne Elementary School Elementary K to 6 2004 330 468Springfield High School High School 9 to 12 2008 2,174 1,965Hayward Middle School Middle School 7 to 8 2005 415 395Roosevelt Middle School Middle School 7 to 8 2005 456 362Schaefer Middle School Middle School 7 to 8 2005 407 283Clark Center Administration and Preschool 2005 284 241
Keifer Alternative School
Administration, K to 12 Special Education, and 9 to 12 Alternative
Education 2006 93 183Service Center Administration and Warehouse 2004Transportation Center Transportation 2011South High School Community Center 1981Evans Stadium Athletic Activities 1985North Stadium Athletic Activities 1973
Source: School District Records
Information prior to fiscal year 2009 is not available
Prior to fiscal year 2010, the elmentary schools were Pre-K through 5th grade and the middle schools were 6th through 8th grade
Springfield City School DistrictBuilding StatisticsLast Nine Fiscal Years
146

2011 2012 2013 2014 2015 2016 2017Average Daily Average Daily Average Daily Average Daily Average Daily Average Daily Average DailyMembership Membership Membership Membership Membership Membership Membership
365 335 374 406 395 396 368 384 391 434 418 453 504 497 393 381 415 431 458 456 468 371 349 403 394 398 422 337 408 398 390 418 435 438 424 458 498 422 406 457 466 462 425 431 419 405 432 411 426 487 473 467 502 491 462 487 385 389 402 397 369 370 407 523 531 431 440 447 456 462
1,963 1,795 1,742 1,853 1745 1,761 1,833 403 416 408 363 331 330 319 393 405 414 419 445 433 443 272 280 273 315 297 287 282 253 259 258 242 329 402 420
179 294 292 280 377 334 303
147

Springfield City School DistrictPer Pupil CostLast Ten Fiscal Years
Average Per Pupil/General Government Daily Pupil Teaching Teacher
Year Expenditures (1) Membership Cost Staff Ratio
2008 125,541,673 7,760 16,178 559 13.88
2009 107,479,199 7,698 13,962 540 14.26
2010 99,066,860 7,649 12,952 557 13.73
2011 102,957,511 7,662 13,437 453 16.91
2012 103,270,536 7,625 13,544 463 16.47
2013 106,002,381 7,544 14,051 482 15.65
2014 104,288,884 7,689 13,563 473 16.26
2015 123,124,287 7,859 15,667 556 14.13
2016 118,907,950 7,928 14,998 598 13.26
2017 119,727,923 7,938 15,083 616 12.89 Source: School District Records
(1) Statement of Revenues, Expenditures and Changes in Fund Balances - Governmental Funds
148

2008 2009 2010 2011 2012 2013 2014 2015 2016 2017Governmental Activities
Instruction:Regular 356 352 334 336 344 383 386 382 412 380Special 118 118 107 111 113 93 94 98 91 209Vocational 4 4 3 3 3 2 1 2 2 3Adult/Continuing 2 2 1 1 1 1 1 1 1 1
Student Intervention Services 5 5 2 2 2 3 3 3 3 0Support Services:
Pupils 59 57 55 68 68 70 69 70 73 80Instructional Staff 118 118 110 111 113 118 120 119 154 47Administration 76 78 68 72 82 85 86 82 80 100Fiscal 8 7 7 8 8 8 8 8 8 8Business 4 5 5 5 5 5 4 4 5 2Operation and Maintenance of Plant 61 63 57 58 58 75 62 64 66 69Pupil Transportation 40 36 32 33 33 54 60 60 55 55
Operation of Non-Instructional Services 84 82 70 71 71 80 73 74 75 97
Total Number of Employees 935 927 851 879 901 977 967 967 1,025 1,051
Source: School District Records (Count is taken on June 30th of each fiscal year)
Springfield City School DistrictEmployees by FunctionLast Ten Fiscal Years
149

Year Preschool K 1 2 3 4 5
2009 205 633 624 615 624 622 551
2010 242 625 613 609 595 613 627
2011 252 657 608 589 573 592 596
2012 259 704 637 580 567 558 571
2013 258 695 661 591 572 539 565
2014 242 711 722 626 554 544 527
2015 329 730 772 641 614 528 545
2016 402 693 737 710 636 583 509
2017 420 624 691 627 706 617 597
Source: School District Records
Information prior to fiscal year 2009 is not available
Springfield City School DistrictEnrollmentLast Nine Fiscal Years
150

6 7 8 9 10 11 12 Total
555 521 503 875 520 441 409 7,698
550 558 503 813 510 415 376 7,649
600 535 545 704 556 458 397 7,662
573 584 526 616 574 481 395 7,625
545 540 585 586 535 490 374 7,536
555 566 559 662 496 503 407 7,674
530 573 558 646 536 438 407 7,847
554 538 579 611 524 456 396 7,928
511 539 561 634 504 451 456 7,938
151

Free ReducedLunches Lunches Total
2008 63.62% 5.78% 69.40%
2009 66.60% 6.40% 73.00%
2010 69.09% 5.46% 74.55%
2011 70.04% 3.40% 73.44%
2012 74.51% 3.91% 78.42%
2013(1) 100.00% 0.00% 100.00%
2014 100.00% 0.00% 100.00%
2015 100.00% 0.00% 100.00%
2016 100.00% 0.00% 100.00%
2017 100.00% 0.00% 100.00%
Source: Ohio Department of Education
Springfield City School DistrictPercentage of Students who Receive Free and Reduced LunchesLast Ten Fiscal Years
(1) Fiscal year 2013 was the first full school year that the District qualified as a Provision 1 District. Provision 1allows free eligibility for all students for a two year period, regardless of whether or not the individual student qualifies. The District renewed it's Provision 1 status in fiscal year 2015 for an additional two year period.
152

88EastBroadStreet,FourthFloor,Columbus,Ohio43215‐3506Phone:614‐466‐4514or800‐282‐0370Fax:614‐466‐4490
www.ohioauditor.gov
SPRINGFIELD CITY SCHOOL DISTRICT
CLARK COUNTY
CLERK’S CERTIFICATION This is a true and correct copy of the report which is required to be filed in the Office of the Auditor of State pursuant to Section 117.26, Revised Code, and which is filed in Columbus, Ohio.
CLERK OF THE BUREAU CERTIFIED DECEMBER 28, 2017