spring evaluation of three sampling methods to...
TRANSCRIPT

193Animal Biodiversity and Conservation 40.2 (2017)
© 2017 Museu de Ciències Naturals de BarcelonaISSN: 1578–665 XeISSN: 2014–928 X
Castro, J., Tortosa, F. S., Jimenez, J. & Carpio, A. J., 2017. Spring evaluation of three sampling methods to estimate family richness and abundance of arthropods in olive groves. Animal Biodiversity and Conservation, 40.2: 193–210.
AbstractSpring evaluation of three sampling methods to estimate family richness and abundance of arthropods in olive groves.— The intensification and expansion of agriculture is currently one of the greatest threats to biodiver�sity worldwide. Olive groves are one of the most extensive and diverse agroecosystems in the Mediterranean region. However, the efficiency of the methods used to sample arthropods in olive crops remains unclear. We compared the effectiveness of pan traps, sweep net and bait traps used to sample arthropods in olive groves. The pan traps collected 19 orders and 182 families, with an abundance that was 76% and 86% higher than that of sweep nets and bait traps, respectively. The composition of families differed significantly according to the method used; from a total of 234 families, 23% were sampled only by pan traps, 16% only by sweep net and 5% only by bait traps. The sampling method was the best predictor of arthropod abundance and number of families, followed by the vegetation and landscape diversity indexes. As pan trap, sweep net and bait trap methods do not obtain the same results when sampling arthropods, we recommend a combination of pan traps and a sweep net, depending on the goal of the studies and the arthropod groups targeted.
Key words: Agro–ecosystems, Arthropod surveys, Bait traps, Pan traps, Sweep net
ResumenEvaluación en primavera de tres métodos de muestreo para estimar la riqueza de familias y la abundancia de los artrópodos en olivares.— En la actualidad, la intensificación y expansión de la agricultura es una de las mayores amenazas para la biodiversidad mundial. El cultivo de olivo es uno de los agroecosistemas más extensivo y diverso de la región mediterránea. Sin embargo, aún no está clara la eficiencia de los métodos empleados para muestrear artrópodos en cultivos de olivo. Hemos comparado la efectividad de las trampas de bandeja, la red de barrido y las trampas de cebo que se emplean para muestrear artrópodos en olivares. Con las trampas de bandeja se capturaron 19 órdenes y 182 familias, cuya abundancia fue un 76% y un 86% superior a la de los ar�trópodos capturados por las redes de barrido y las trampas de cebo, respectivamente. La composición de familias taxonómicas fue significativamente diferente según el método de captura empleado: de un total de 234 familias, un 23% fue capturado únicamente con las trampas de bandeja; un 16%, únicamente con las redes de barrido; y un 5%, únicamente con las trampas de cebo. Además, el método de muestreo fue el mejor factor para predecir la abundancia y el número de familias de artrópodos, seguido por los índices de vegetación y de diversidad del paisaje. Debido a que las trampas de bandeja, la red de barrido y las trampas de cebo no obtuvieron los mismos resultados en los muestreos de artrópodos, recomendamos el uso combinado de trampas de bandeja y una red de barrido, dependiendo del propósito de la investigación y del grupo de artrópodos objetivo del estudio.
Palabras clave: Agroecosistema, Muestreo de artrópodos, Trampas de cebo, Trampas de bandeja, Red de barrido
Received: 21 XI 16; Conditional acceptance: 22 I 17; Final acceptance: 21 III 17
Jesus Castro, Dept. of Ecology and Animal Biology, Univ. of Vigo, 36310 Vigo, Spain.– Francisco S. Tortosa, José Jimenez & Antonio J. Carpio, Dept. of Zoology, Univ. of Córdoba, Campus de Rabanales, 14071 Córdoba, Spain.– Antonio J. Carpio, Inst. de Agricultura Sostenible (IAS–CSIC), Alameda del Obispo s/n.,14080 Córdoba, Spain.
Corresponding author: Jesús Castro. E–mail: [email protected]
Spring evaluation of three sampling methods to estimate family richness and abundance of arthropods in olive groves
J. Castro, F. S. Tortosa, J. Jimenez & A. J. Carpio
194 Castro et al.
Introduction
The intensification of agricultural practices has led to a dramatic decline in the biodiversity of agro–ecosystems (Matson et al., 1997; Tilman et al., 2001; Nentwig, 2003; Pfiffner & Luka, 2003). The survival of the arthropods in these intensive agro–ecosystems depends on the suitability of the habitat, which is in turn influenced by both agricultural management and the surrounding landscape (Jeanneret et al., 2003) in which arthropods are part of important functional groups in food webs (Gonçalves & Pereira, 2012). The diverse agricultural landscapes provide several available niches and micro–niches (canopy–ground: soil, grass, roots) in different types of management regimes, which could be used by arthropods.
Assessing the effects of these different mana�gements and micro–niches on arthropod and plant communities is essential for the management and preservation of biological diversity (Bardgett, 2002). The evaluation, protection and management of biodiversity in agro–ecosystems have been identified as a major challenge of the future in Europe (Jerez–Valle et al., 2014). Methods to sample arthropod assemblages must be efficient, repeatable and representative because they are commonly used in environmental monitoring (Rubene et al., 2015). Monitoring and biodiversity inventories require survey methods that will permit the most efficient and comprehensive completion of study aims (Hutchens & DePerno, 2009; Popic et al., 2013). However, the effectiveness of each method may depend on a range of factors, including the location of the study plots, the type of vegetation (Pedigo & Buntin, 1993), the availability of resources (such as flowering), the sampling season, and the composition of the arthropod community (Baum & Wallen, 2011; Gollan et al., 2011). The most appropriate sampling methods will, moreover, depend on the aims and the target taxa of the study, in addition to resources and time consumption (Popic et al., 2013).
Previous studies have compared different sampling methods in different habitats (see Spafford & Lortie, 2013), such as those in Australia (Popic et al., 2013), New Zealand (Larsen et al., 2014), North America (Shapiro et al., 2014; Joshi et al., 2015), Central and North Europe (Niedobová & Fric, 2014; Rubene et al., 2015) and South America (Nemesio & Morato, 2005). However, few studies have compared their effectiveness in Mediterranean regions (Nielsen et al., 2011; Ponce et al., 2011).
One of the main crops in the Mediterranean basin is the olive tree (Olea europaea) (Sokos et al., 2013). The olive culture is deeply rooted in Mediterranean countries, which produce 99% of olive oil throughout the world (Lo�umo & Giourga 2003). Spain occupies the first place as regards surface and olive production and its production represents 60% of the European olive production and 45% of the world olive production (MAGRAMA, 2016). The large surface area occupied by olive crops in the Iberian Peninsula, particularly in the south, means these agro–ecosystems play a crucial role in biodiversity con�servation, but this role varies according to key factors such as the use of pesticides, the presence of natural
and semi–natural features (such as scrub, woodland, dry–stone walls, etc) and the age of the trees (Beaufoy, 2000). The flora present in olive crops is similar to that in a natural Mediterranean ecosystem (Margaris, 1980; Giourga et al., 1994), providing suitable conditions for arthropod communities, which are, together with the plant communities, the key factors on which mammal and bird communities depend (Beaufoy, 2000).
Olive groves have currently reached record levels in terms of area and production in the Mediterranean region. Intensive agriculture has simultaneously impo�verished the arthropod fauna in the agro–ecosystem of olive orchards (Ruano et al., 2004; Allen et al., 2006; Santos et al., 2007; Castro–Caro et al., 2014; Jerez–Valle et al., 2014). However, little is as yet known about the effect of different olive orchard ma�nagement regimes (organic production, conventional non–tillage, traditional farming), with different uses of agrochemicals, irrigation, tree density or cover ground, on arthropod diversity (Ruano et al., 2004; Gkisakis et al., 2015, 2016). Little is therefore known about the simultaneous effectiveness and repeatability of the different methods in this habitat.
Our objective was to compare and evaluate the three commonly used arthropod survey methods (pan traps, sweep nets and bait traps) in terms of capture rates, arthropod richness and the family composition of arthropod communities in olive groves, and to de�termine the influence of landscape and the diversity of herbaceous plants on the efficiency of the three sampling methods.
Material and methods
Study area and sampling design The study was conducted in Andalusia (37o 30'–37o 58' N, 4o 17'–4o 56’ W; between 159–369 m a.s.l.), which is located in the south of the Iberian Peninsula (fig. 1). We selected 123 study sites in a representative geographical range of olive groves in Guadalquivir valley. All the sites were located in an olive–domi�nated landscape, in which agricultural intensification has eliminated most of the natural vegetation (Rey, 2011). The mean distance between study sites was 15 ± 17 km.
Sampling was conducted in the middle of May 2014. Data from three meteorological stations close to the orchards were used to obtain mean humi�dity, mean temperature and mean rainfall during the sampling period. The climatic conditions in the study sites were similar during the sampling period: 54.37% ± 0.95% (mean humidity ± SE), 20.56 ± 0.27ºC (mean temperature ± SE) and 12.67 ± 4,31 mm (rainfall ± SE). The study sites were managed with similar farming system methods (conventional tillage, mineral fertilization, and planting using a tra�ditional framework), but plant communities differed. To take the plant biodiversity on arthropod captures into account, we calculated two landscape indices and the vegetation Shannon index at each study site (see below).

Animal Biodiversity and Conservation 40.2 (2017) 195
We tested three arthropod survey methods: pan traps, sweep netting and bait traps. These sampling surveys are appropriate to sample canopy and flying arthropods, but not soil arthropods, which were not therefore included in this research. Each survey method was deployed in two transects on each study site for three consecuti�ve days (78 transects per method). The arthropods collected on different days in the same transect were pooled to compare the arthropods captured by pan and bait traps with arthropods captured in sweep netss. To avoid the edge effect (the major vegetal complexity or simultaneous availability of one or more elements, Yahner, 1988) all the transects were surveyed at > 30 m from the nearest edge (fig. 2), and a distance of 100 m was established between the transects to ensure their independence and avoid pseudoreplication.
Arthropod sampling
Pan trapsThe traps were placed in two transects (each of which was 90 m in length) with 10 traps (spaced every 10 m) per transect (fig. 2). The traps were set at each study site for three consecutive days; they were placed above the ground and between olive trees to be seen easily by arthropods. The trap–trays were made from polyethylene plastic bowls (400 ml, 110 mm in diameter, 70 mm high) and painted in UV
fluorescent yellow (Popic et al., 2013). One hundred ml of soapy water was placed in each pan (to break the superficial tension). There were a total of 260 (10 traps x 2 transects x 13 study sites) pan traps per day (780 pan traps in total, 260 x 3 days). The pans were checked and cleared of captures daily and the arthropods were transferred to plastic bottles with 70% ethanol for transportation to the laboratory. As mentioned above, the arthropods collected on different days in the same transect were pooled to allow com�parison of the three methods (n = 26 transect data).
Sweep nettingFlower–visiting arthropods and arthropods that live or feed on vegetation were sampled along two sweep–net transects on each site. One collector (always the same person, A. J. C.) carried out the sampling of both transects for three consecutive days on each site. The sweep net transects were 90 m in length and 5 m in width (fig. 2; Popic et al., 2013) and the collector sampled arthropods from all the plant species along both transects for 1 h (each transect was sampled for 30 minutes). Sweep netting took place in morning sessions (11:00–12:00 h) in order to match the activity patterns of arthropods and to avoid the extreme midday heat (Popic et al., 2013). Sampling only took place during fine weather (days without wind or rain) so as to minimise any potential
Fig. 1. Study area showing distribution of study sites (circles) and olive groves (shaded areas) in the province of Córdoba.
Fig. 1. Área de estudio en la que se muestra la distribución de los lugares de estudio (círculos) y los cultivos de olivo (zonas sombreadas) en la provincia de Córdoba.
Study sites
N
Spain
0 5 10 20 30 km

196 Castro et al.
effects of weather on captures. The arthropods were transferred to 5 ml vials for transportation. As in the case of the pan traps transects, the arthropods captured in the same transect on three different days were pooled for comparison with the pan trap and bait trap transects (n = 26 sweep net transects data). A total of 39 hours were spent on sweep net sampling.
Bait trapsBait traps were set in the same way as pan traps (two transects on each site with 10 bait traps spaced every 10 meters for three consecutive days; fig. 2). The traps were made from 1.5 L plastic bottles (Allemand & Aberlenc, 1991). The top of the plastics bottles were cut off to increase the entrance opening (98 mm in diameter approximately) and were placed upside down (as funnels) to avoid arthropod escapes. The plastic bottles were filled with natural flowers from the surrounding area and 100 ml of soapy water per bottle. Many substances can be used as bait depending on the target arthropod group, but to compare this method with the pan trap and sweep netting sampling methods (non–specific sampling method), natural flowers from the surrounding area were used as bait (mainly species belonging to asteraceae, brassicaceae and fabaceae families). According to Basset et al. (1997), this method is the most appropriate for the sampling of arthropods in tree canopies. The traps were collected each day and the bait (flowers) was replaced daily. A total of 260 bait traps per day (780 in total) were used. As with pan traps and sweep netting, we pooled the numbers of arthropods captured by bait traps on the different days in the same transect (n = 26 transect data) to allow comparison with arthropods captured by sweep netting.
Plant and landscape diversity
The study sites presented different levels of plant bio�diversity. To take this difference into consideration we laid out an additional two transects in two separate rows of olive trees on each site. The transects were 90 m in length, and 10 hoops (0.5 m2) spaced 10 m apart were used as sampling points for herbaceous plants (fig. 2) (Guerrero–Casado et al., 2015). All the weed species at these sampling points were identified. The mean values of the Shannon diversity index (Shannon & Weaver, 1963) for the weed community were calcu�lated at the site (n = 13). The transects for plant and arthropod surveys were sampled simultaneously on each site. The effect of the surrounding landscape was estimated by recording two environmental variables at the site level (Schweiger et al., 2005): the Shannon index of the landscape (SHDI) and the edge density of the landscape (ED). The SHDI quantified the diversity of the countryside on the basis of richness (the number of different patch types) and evenness (the proportional area distribution among patch types).
The SHDI is calculated according to the formula:
SHDI = (Pi * ln Pi)
where m is the number of patch types and Pi is the pro�portion of area covered by patch type (land cover class).
The ED is a measurement of the complexity of the shapes of patches and an expression of the spatial heterogeneity of a landscape mosaic. The index is calculated as:
eik ED = (10,000) A
where eik is the total length (in m) of edge in a landscape involving patch type (class) i, and includes the landscape boundary and background segments involving patch type i, whereas A is the total lands�cape area in m2.
Both landscape indices were obtained using FRAGSTATS 4.1 software (McGarigal et al., 2002). The landscape diversity index and edge density were recorded in a buffer of approximately 500–m radius around the centre of the sampling site. In each buffer, different land cover classes present were recorded (urban land uses, rivers and natural streams, arable crops, olive groves, vineyard, irrigated crops, citrus and dense scrub). Information concerning land cover classes was obtained from aerial photographs (Orto�fotografía digital de Andalucía).
Arthropod identification
The arthropods captured were identified at family level. Classification at species level was unnecessary because the purpose of this study was to assess the effectiveness of each sampling method as regards capturing specific arthropod families. A binocular microscope (Nikon SMZ–U) and several guides were used to identify the arthropods (Barrientos, 1988; Dindal, 1990; Chinery, 2005), but keys were used for Hymenoptera families (Goulet & Huber, 1993).
The PRIMER package, version 6 (Clarke & Gorley, 2006), was used to calculate the number of families (NF) and Pielou´s evenness index (J´) for each sam�pling method.
Data analysis
The sampling unit used for statistical analysis was 'transect' because sweep netting has no 'trap' unit to compare with bait and pan traps. Relative abundan�ce and total abundance of arthropod families were calculated for each sampling method. The estimation of diversity can be strongly dependent on differences in inventory completeness (Chao & Jost, 2012). We estimated the inventory completeness for each method using the sample coverage estimator recommended by Chao & Jost (2012) using the iNEXT online software (Chao et al., 2016).
Comparison of family composition obtained usingeach sampling method
Comparison analyses of the arthropod community were performed using the Bray–Curtis similarity index (Bray & Curtis, 1957) following square root transformation
3m
K = 1
3m
i = 1

Animal Biodiversity and Conservation 40.2 (2017) 197
of transect data. Dummy values (= 1 specimen) were added to avoid a collapse in subsequent multidimensio�nal scaling (MDS) representation resulting from empty samples. The differences in the sampling methods used in terms of arthropod composition were assessed using MDS. A permutational multivariate ANOVA (PERMANO�VA) was then used to check for significant differences between the arthropod assemblages sampled using each method. The MDS and PERMANOVA were per�formed on the basis of the Bray–Curtis similarity index matrix. PERMANOVA constructs an F–ratio from the sums of squared distances within and between groups that are analogous to Fisher´s F–ratio (Anderson, 2001). Pair–wise comparisons of the sampling methods were subsequently performed to determine which arthropoda communities differed. The PERMANOVA test was performed with 9999 permutations with the objective of increasing the power and precision of the analysis (Hope, 1968; Anderson et al., 2008). A Simi�larity Percentage (SIMPER, Clarke, 1993) was used to identify the arthropod families principally responsible for the dissimilarity among the sampling methods. PRIMER package, version 6 (Clarke & Gorley, 2006) was used to perform the MDS plot, PERMANOVA and SIMPER procedure.
Predictive factors of NF and arthropod abundance
We tested the relationships between each type of sampling method, NF and abundance using two univariate analysis of varianza (UNIANOVA). In the first UNIANOVA, the number of arthropods is consi�dered as a response variable, while in the second
UNIANOVA, NF was used as the response variable. In both models, the method (three levels: pan trap, sweep netting, and bait trap) was used as a factor, whereas the Shannon index of vegetation, the SHDI and the ED of the landscape were included as expla�natory variables (co–variates). For these analyses, we used the sum of squares type III. UNIANOVA were performed using IBM SSPS Statistics 20 software.
Results
Descriptive results
We captured a total of 19,990 arthropods belonging to 25 orders and 234 families. The pan traps captured 14,476 individuals, 22 orders and 179 families. Sweep netting captured 3,571 specimens, 15 orders and 141 families, and the bait traps captured 1,943 spe�cimens, 20 orders and 105 families (table 1). The effectiveness of pan traps was particularly evident in the case of Diptera, Hymenoptera, Homoptera, Collembola and Thysanoptera, for which the number of individuals was greater than 1,000 (table 1). The greatest numbers of Coleoptera, Heteroptera, and Lepidoptera (with 996, 773 and 154 individuals, respectively) were collected using sweep netting (table 1). The lowest abundance values were recorded for bait traps. Some orders were present only in bait traps (e.g., Scutigeromorpha and some Hymenoptera families, see supplementary material) but in low abundance. The order with the largest number of specimens captured by bait trap was Homoptera, with 590 individuals.
Fig. 2. Sample design and arthropod and vegetation sampling methods used at each sampling site. A total of 13 olive orchards were sampled. The distance between olive trees was less than 10 m. The vegetation hoops indicate the surface used for plant sampling.
Fig. 2. Diseño de muestreo y métodos de muestreo de artrópodos y vegetación empleados en cada lugar del estudio. En total se muestrearon 13 cultivos. La distancia entre los olivos fue inferior a 10 m. Los aros de vegetación indican la superficie empleada para el muestreo de plantas.
0.5 m2
Transect Pan traps Bait traps Sweep net Vegetation hoop
0.5 m2
90 mtransect
10 m
10 m30 m
30 m> 30 m

198 Castro et al.
The results show that 54 arthropods families (23.07%) were collected exclusively by pan traps, 37 families (15.8%) solely by sweep netting, and 12 families (5.12%) only in bait traps. In other cases, arthropod families were collected by two of the three sampling methods (fig. 3; appendix 1).
The inventory completeness analysis indicated that all three sampling methods had high and similar values of inventory completeness (0.99, 0.98 and 0.97 for pan traps, sweep netting and bait traps, respectively). The similar values of these coverage estimators indicate that the three methods are sufficiently and similarly exhaustive to be compared.
Comparison of abundance, number of families andevenness between sampling methods
The highest arthropod abundance (mean ± SE; 595.5 ± 247.7) was recorded for the pan traps, followed by the sweep net (mean ± SE; 134.9 ± 17.2). The bait trap, meanwhile, was the method with which least arthropods were captured (mean ± SE; 76.6 0 ± 11.8). With regard to the NF, the highest mean value was also recorded for pan traps (mean ± SE; 30.7 ± 3.9), followed by sweep nets (mean ± SE; 23.1 ± 2.5) and bait traps (mean ± SE; 12.9 ± 1.2). Finally, in the case of the J index, the mean values for the sweep nets and bait traps were similar (mean ± SE; 0.80 ± 0.02 and 0.79 ± 0.02 respectively), while the value of this evenness index (mean ± SE; 0.7 ± 0.02) was lowest for pan traps.
Comparison of family composition between samplingmethods
The PERMANOVA indicated that the family com�position of arthropods captured using was different for the three sampling methods (Pseudo F = 6.52; p < 0.001). Sweep netting was significantly different from pan traps (Pseudo F = 2.67; p < 0.001) and bait traps (Pseudo F = 3.04; p < 0.001) in the case of arthropod family composition. The PERMANOVA also showed differences in composition of families as regards the pan traps and bait traps (Pseudo F = 1.84; p < 0.001).
The differences in arthropod family composition obtained using the different sampling methods are shown by means of an MDS ordination plot (fig. 4). The MDS plot supports the PERMANOVA results. The figure shows a differentiation between the fauna collected using the sweep nets with regard to the other two sampling methods (fig. 4), while there was no clear difference between the pan traps and bait traps in the MDS plot, although they can be grouped into subgroups (fig. 4: groups B, C, D, and E). In the case of the sweep net, most transects (less than one of them) can be grouped into a 16% similarity–level group (fig. 4: group A). There are another two subgroups in this group with a higher similarity level: 40% and 29% (fig. 4: groups A.1 and A.2).
The MDS plot did not show any distinctive grou�ping for pan traps and bait traps (no more than five transects, fig. 4). The pan trap transects are grouped into two groups, located at different points in the MDS
plot. These sets include transects with a similarity of 25% (one net transect is also included) and 33%, respectively (fig. 4: groups B and C). Most bait trap transects, however, are grouped in another two simi�larity groups (closer to each other than the pan trap groups) with a similarity of 40% and 16%, respectively (fig. 4: groups D and E).
In the SIMPER procedure, in the case of similarity between methods, families that contributed to 70% of cumulative similarity are shown, whereas in the case of dissimilarity between sampling methods, only families which contributed to more than 2% are shown owing to the high number of families needed to achieve 70% of cumulative dissimilarity. The SIM�PER procedure showed that the pan trap transects had a similarity of 23.78%, the lowest similarity value. The highest contributions to similarity in the pan trap transects were made by Thripidae, Adelgidae, For�micidae and Aeolotrhipidae, while the sweep netting transects proved to be more similar than the pan traps and bait traps (31.53%). The most important families responsible for similarity in the sweep–netting sample family composition were Nabidae, Apidae, Pyr�rhocoridae, Thripidae, Cantharidae and Mesovelidae. The similarity for bait trap transects was 27.23%, and only five families contributed to more than 5% of similarity in the case of this sampling method: Thripidae, Adelgidae, Formicidae, Aeolothripidae and Cantharidae (appendix 2).
The dissimilarity between the three methods was, in contrast, high (no less than 77%). The SIMPER indicated that Thripidae, Apidae, Formicidae, and Nabidae were the most important families as regards the dissimilarity between pan trap and sweep netting sampling (overall dissimilarity = 81.12%). Furthermore, pan traps and bait traps had a lower dissimilarity value (overall dissimilarity = 77.88%), and five families of dipterans (Mycetophilidae, Muscidae, Phoridae, Sciari� Sciari�Sciari�dae and Chyronomidae) contributed to more than 2% of dissimilarity (appendix 3). The highest dissimilarity value was between sweep netting and bait traps (overall dissimilarity = 82.12%), and in this case, 11 families contributed to more than 2% (appendix 3), with the most numerous taxa being Apidae and Nabidae.
Predictive factors of arthropod richness and abundance
With regard to first UNIANOVA analysis (abundance as the response variable, table 2), only the sampling method and the Shannon diversity of vegetation were significantly related to abundance. The Shannon index for vegetation was positively associated with the num�ber of arthropods, whereas the sampling method had a significant effect on the abundance of arthropods, since pan traps and sweep netting captured more arthropods than bait traps.
However, in the second UNIANOVA (NF as the response variable, table 3), only the sampling method and the SHDI were significantly related to NF. The SHDI was positively associated with arthropod rich�ness, whereas the sampling method had a significant effect on the NF value, and pan traps and the sweep captured more families than bait traps.

Animal Biodiversity and Conservation 40.2 (2017) 199
Discussion
In this study, climatic conditions (humidity, temperature and rainfall) and management practices (such as tillage or fertilizer) during the sampling period were similar in all study plots. These factors were consi�dered to avoid introducing noise into the models or influencing captures rates.
Our results show that the three methods are strongly biased towards certain taxa, highlighting the importance of combining various sampling methods if the aim of the study is to monitor the biodiversity
Table 1. Abundance (N) and number of families (NF) of arthropods sampled using pan traps, sweep net and bait traps. Percentages are shown in brackets.
Tabla 1. Abundancia (N) y número de familias (NF) de los artrópodos muestreados usando trampas de bandeja, red de barrido y trampas de cebo. Los porcentajes se indican entre paréntesis.
Pan traps Sweep nets Bait traps Total
N NF N NF N NF N NF
Actinedida 0 (0) 0 (0) 0 (0) 0 (0) 1 (< 1) 1 (< 1) 1 (<1) 1 (< 1)
Araneae 125 (< 1) 14 (7.8) 122 (3.4) 18 (12.7) 23 (1.2) 11 (10.4) 270 (1.4) 22 (9.4)
Coleoptera 396 (2.7) 32 (17.8) 996 (27.9) 24 (17) 130 (6.7) 18 (17.1) 1,522 (7.6) 37 (15.8)
Collembola 5,272 (36.4) 5 (2.7) 2 (< 1) 1 (< 1) 97 (5) 3 (2.8) 5,371 (26.9) 5 (2.1)
Dermaptera 5 (< 1) 1 (< 1) 2 (< 1) 1 (< 1) 2 (< 1) 1 (< 1) 9 (< 1) 2 (< 1)
Diptera 2,902 (20) 42 (23.4) 238 (6.7) 31 (21.9) 319 (16.4) 20 (19) 3,459 (17.3) 50 (21.3)
Dyctioptera 1 (< 1) 1 (< 1) 0 (0) 0 (0) 1 (< 1) 1 (< 1) 2 (< 1) 1 (< 1)
Embioptera 5 (< 1) 2 (1.1) 0 (0) 0 (0) 2 (< 1) 2 (1.9) 7 (< 1) 2 (1.2)
Ephemeroptera 0 (0) 0 (0) 1 (< 1) 1 (< 1) 0 (0) 0 (0) 1 (< 1) 1 (< 1)
Heteroptera 58 (< 1) 6 (3.3) 763 (22.1) 15 (10.6) 16 (< 1) 5 (4.7) 847 (4.2) 17 (7.2)
Homoptera 2,571 (17.8) 13 (7.2) 167 (4.7) 7 (4.9) 590 (30.4) 9 (8.5) 3,328 (16.6) 13 (5.5)
Hymenoptera 1,225 (8.5) 35 (19.5) 834 (23.4) 15 (10.6) 311 (16) 19 (18) 2,370 (11.9) 38 (16.2)
Isopoda 3 (< 1) 2 (1.1) 0 (0) 0 (0) 0 (0) 0 (0) 3 (< 1) 2 (< 1)
Ixodida 1 (< 1) 1 (< 1) 2 (< 1) 2 (1.4) 1 (< 1) 1 (< 1) 4 (< 1) 2 (< 1)
Lepidoptera 47 (< 1) 11 (6.1) 154 (4.3) 17 (12.7) 8 (< 1) 6 (5.7) 209 (1) 21 (8.9)
Mesostigmata 13 (< 1) 1 (< 1) 0 (0) 0 (0) 1 (< 1) 1 (< 1) 14 (< 1) 1 (< 1)
Neuroptera 1 (< 1) 1 (< 1) 5 (< 1) 2 (1.4) 1 (< 1) 1 (< 1) 7 (< 1) 3 (1.2)
Orthoptera 10 (< 1) 2 (1.1) 21 (< 1) 3 (2.1) 1 (< 1) 1 (< 1) 32 (< 1) 3 (< 1)
Pseudoescorpionida 3 (< 1) 2 (1.1) 0 (0) 0 (0) 1 (< 1) 1 (< 1) 4 (< 1) 2 (< 1)
Psocoptera 4 (< 1) 3 (1.6) 0 (0) 0 (0) 3 (< 1) 1 (< 1) 7 (< 1) 4 (1.7)
Raphidioptera 8 (< 1) 1 (< 1) 6 (< 1) 1 (< 1) 0 (0) 0 (0) 14 (< 1) 1 (< 1)
Sarcoptiformes 5 (< 1) 1 (< 1) 0 (0) 0 (0) 0 (0) 0 (0) 5 (<1) 1 (< 1)
Scutigeromorpha 0 (0) 0 (0) 0 (0) 0 (0) 1 (< 1) 1 (< 1) 1 (< 1) 1 (< 1)
Thysanoptera 1,820 (12.6) 2 (1.1) 248 (6.9) 3 (2.1) 434 (22.6) 3 (2.8) 2,502 (12.5) 3 (1.2)
Zygentoma 1(< 1) 1 (< 1) 0 (0) 0 (0) 0 (0) 0 (0) 1 (< 1) 1 (< 1)
Total 14,476 179 3571 141 1,943 105 19,990 234
or complete community of superior arthropod taxa. We found that pan traps were more effective than bait traps and sweep netting as regards detecting arthropods (for abundance and NF), although this may depend on the taxon.
Other studies have also found that pan traps are highly effective when sampling arthropod species rich�ness (Nielsen et al., 2011; Spafford & Lortie, 2013) and that they are an unbiased method (Westphal et al., 2008). However, although passive sampling methods such as pan traps and bait traps avoid collector bias (present in the sweep net), they are

200 Castro et al.
associated with other biases, as they capture species with an unequal probability owing to specific visual or olfactory attractors (Cane et al., 2000; Roulston et al., 2007). Nevertheless, our findings contrast with those of other studies in which sweep netting has been found to capture a greater species richness and abundance of arthropods (Popic et al., 2013), although this observation depended on the taxonomic group. For example, we found that pan traps sampled a greater abundance of Diptera, Hymenoptera, Col�lembola, Homoptera or Thysanoptera, while sweep netting collected a higher abundance of Coleoptera, Heteroptera or Lepidoptera, and bait traps captured a mixture of both, with a greater abundance of Homop�tera and Thysanoptera. The richness of the families captured using each sampling method shows that the group from which the most families were captured was Diptera, followed by Hymenoptera (in pan traps and bait traps) and Coleoptera (in sweep nets). The poor abundance of flowers and vegetation in olive groves may contribute to the superiority of pan traps when compared to the other two methods (Roulston et al., 2007).
Although pan traps captured the highest number of families –followed by sweep netting and bait traps– the combination of pan traps and the sweep netting proved to be more effective, capturing 95% of total families. This further emphasizes the importance of including more than one method when conducting arthropod species richness inventories. The various methods have advantages and disadvantages. Pan traps and bait traps (static methods) may not reveal the spatial variation in arthropod assemblages be�tween sites and communities (Nielsen et al., 2011).
Furthermore, in the case of pan traps, different colours may significantly affect the capture rate for different arthropod taxa (Yi et al., 2012). For example, yel�low pans are used in studies of diverse groups of pollinators (Kitching et al., 2001; Popic et al., 2013), while blue pan traps are more effective as regards catching Stephanidae (Aguiar & Sharkov, 1997) and red pans are attractive to Amphicoma beetles (Dafni et al., 1990). This should be taken into consideration during general surveys. It should also be kept in mind that a large number of families were not collected by bait traps. These traps are effective sampling methods for live catches of arthropods. However, the selection of the food source is vitally important, and a basic knowledge of the feeding habits is therefore a prerequisite when using this method (Yi et al., 2012). Sweep netting offers several advantages.It is not only a highly cost–effective and fairly non–intrusive method (Yi et al., 2012), but is also particularly useful when comparing relative species abundance and richness of arthropods in different areas with similar vegeta�tion types (Siemann et al., 1997), as is the case of olive groves. However, the capture rate of sweep netting, depends to a great extent on the collector’s skills and the method is relatively time–consuming. Furthermore, it is mainly suitable for open habitat types such as grassland or agriculture land and not easy to standardise in forest environments with a high vegetation density (Yi et al., 2012).
The different assemblages captured by the sur�vey methods suggest the need for complementary sampling methods if the objective is to describe the invertebrate community (Spafford & Lortie, 2013). Our findings suggest a combination of sweep netting
Fig. 3. Venn diagram representing the number and percentage (in brackets), of families captured using the sampling methods.
Fig. 3. Diagrama de Venn que representa el número y el porcentaje (entre paréntesis), de las familias capturadas por los métodos de muestreo.
Pan traps54 families (23.07%)
Sweep nets37 families (15.8%)
Bait traps12 families (5.12%)
38 families (16.23%)
28 families (12.82%)
62 families (24.5%)
6 families (2.5%)

Animal Biodiversity and Conservation 40.2 (2017) 201
Fig. 4. MDS plot for arthropod community captured in the pan trap, sweep net and bait trap transects. Arthropod abundance data for the same study site and captured by using the sampling method were pooled. Groups are delineated according to the results of the cluster analysis.
Fig. 4. Gráfico MDS para la comunidad de artrópodos capturados en las trampas de bandeja, la red de barrido y las trampas de cebo. Se agrupan los datos relativos a la abundancia de los artrópodos cap-turados con el mismo lugar del estudio y con el mismo método de muestreo. Los grupos se definieron según los resultados del análisis de conglomerados.
Table 2. UNIANOVA results considering the abundance of arthropods as a response variable and showing the degree of freedom (df), type III sum of square (SS), mean square (MS), Fisher statistic (F) and p–values: a R2 = 0.136 (adjusted R2 = 0.076).
Tabla 2. Resultados de UNIANOVA que considera la abundancia de los artrópodos como variable de respuesta y de los valores de los grados de libertad (df), la suma de cuadrados tipo III (SS), el cuadrado medio (MS), el parámero de Fisher (F) y los valores de p: a R2 = 0,136 (R2 ajustado = 0,076).
df SS MS F p
Corrected model 5 5,186,594.5a 1,037,318.91 2.26 0.057
Intercept 1 797,265.1 797,265.10 1.74 0.192
SHDI 1 127,849.4 127,849.39 0.28 0.599
ED 1 823,540.3 823,540.27 1.79 0.185
Vegetation Shannon index 1 1,285,260.2 1,285,260.20 1.93 0.049
Sampling method 2 3,564,859.5 1,782,429.78 3.88 0.025
Error 72 33,049,909.3 459,026.52
Total 78 43,240,344
Corrected total 77 38,236,503.8
Method Pan traps Bait traps Sweep net
Similarity 16% 25% 29% 33% 40%
D
BE
A
C
A.1 A.2
Transform Square rootResemblance S17 Bray Curtis similarity (+d)
and pan traps could be an appropriate approach to determine arthropod diversity. The low similarity in family composition within the pan trap transect is
evidence of the effectiveness of this method when used to sample diverse arthropod taxa. A single sampling method should be selected to sample a
Stress = 0.19

202 Castro et al.
specific arthropod group. Some examples of this might be pan traps for Hymenoptera (Westphal et al., 2008), pit fall traps for ants (Wang et al., 2001), baiting techniques for wireworms (Coleoptera, Elat�eridae, Parker, 1996) or live–bait traps for Rhodnius (Hemiptera, Reduviidae) (Abad–Franch et al., 2000). The table of supplementary material presented in this study can be considered as a guide when choosing an effective sampling method for specific families.
The UNIANOVA results indicate the importance of vegetation and landscape diversity as regards abun�dance and number of families, respectively. However, the sampling method had a great influence for arthro�pod abundance and the number of families. This result highlights the importance of appropriately selecting sampling methods to describe arthropod communities, and the scope of any research could be limited by the sampling method chosen (Marshall et al., 1994).
Conclusion
Our results showed that the pan traps were the most effective method for sampling a large abundance of arthropod families in olive groves. However, the high number of families not found in pan traps suggests
that a combination of methods is recommended. As sweep netting caught different family compositions to those obtained in bait traps and pan traps, a combination of sweep netting and pan traps may be a more effective approach for arthropod community monitoring in olive orchards. However, the selection of the sampling method depends greatly on the tar�get taxa. The limitation of the sampling period made this research a first approximation to survey method effectiveness. Our conclusions should be evaluated in olive orchards with other management systems and climatic and seasonal variations should be considered. Further research including environmental variations is clearly needed.
Acknowledgements
We would like to thank Laura Martín, Mercedes Cabrera and Yolanda Escobedo for their help in the field. We are also grateful to Sally Newton for reviewing the English, and the two anonymous re�viewers who contributed to the improvement of the manuscript. This work was supported by the project AGL2012–40128–C03–01 and EU–FEDER funds from the Spanish government.
References
Abad–Franch, F., Noireau, F., Paucar, C. A., Aguilar, V. H. M., Carpio, C. C. & Racines V. J., 2000. The use of live–bait traps for the study of sylvatic Rhodnius populations (Hemiptera: Reduviidae) in palm trees. Transactions of The Royal Society of Tropical Medicine and Hygiene, 94: 629–630.
Aguiar, A. P. & Sharkov, A., 1997. Blue pan traps as a potential method for collecting Stephanidae (Hymenoptera). Journal of Hymenoptera Research, 6: 422–423.
Allemand, R. & Aberlenc, H. P., 1991. Une méthode efficace d´échantillonage de l´entomofaune des frondaisons: le piège attractif aérien. Bulletin de la Société Entomologique Suisse, 64: 293–305.
Allen, H. D., Randall, R. E., Amable, G. S. & Devereux, B. J., 2006. The impact of changing olive cultiva�The impact of changing olive cultiva�tion practices on the ground flora of olive groves in the Messara and Psiloritis regions, Crete, Greece. Land Degradation & Development, 17: 249–273.
Anderson, M. J., 2001. A new method for non–pa�rametric multivariate analysis of variance. Austral Ecology, 26: 32–46.
Anderson, M. J., Gorley, R. N. & Clarke, K. R., 2008. PERMANOVA+ for PRIMER. Guide to Software and Statistical Methods. PRIMER–E, Plymouth.
Bardgett, R. D., 2002. Causes and consequences of biological diversity in soil. Zoology, 105: 367–374.
Barrientos, J. A., 1988. Basis For A Practical Entomo-logy Course. Asociación Española de Entomología, Barcelona.
Basset, Y., Springate, N. D., Aberlenc, H. P. & Del�vare, G., 1997. A review of methods for sampling arthropods in tree canopies. In: Canopy arthropods:
Table 3. UNIANOVA results considering the number of families (NF) as a response variable and showing the degree of freedom (df), type III sum of square (SS), mean square (MS), Fisher statistic (F) and p–values: a R2 = 0.348 (adjusted R2 = 0.303).
Tabla 3. Resultados de UNIANOVA que considera el número de familias (NF) como variable de respuesta y los grados de libertad (df), la suma de cuadrados tipo III (SS), el cuadrado medio (MS), el parámero de Fisher (F) y los valores de p: a R2 = 0,348 (R2 ajustado = 0,303).
df SS MS
Corrected model 5 6,142.9a 1,228.59
Intercept 1 18,543.5 18,543.59
SHDI 1 837.9 837.99
ED 1 134.1 134.19
Vegetation
Shannon index 1 166.8 166.82
Sampling method 2 3,853.4 1,926.70
Error 72 11,505.4 159.80
Total 78 54,569.0
Corrected total 77 17,648.4
Animal Biodiversity and Conservation 40.2 (2017) 203
27–52 (N. E. Stork, J. Adis & R. K. Didham, Eds.). Chapman & Hall, New York.
Baum, K. A. & Wallen, K. E., 2011. Potential bias in pan trapping as a function of floral abundance. Journal of the Kansas Entomological Society, 84: 155–159.
Beaufoy, G., 2000. The environmental impact of olive oil production in the European Union: practical options for improving the environmental impact: final report. Environmental Directorate–General of the European Commission, Brussels.
Bray, J. R. & Curtis, J. T., 1957. An ordination of the upland forest communities of southern Wisconsin. Ecological Monographs, 27: 325–349.
Cane, J. H., Minckley, R. L. & Kervin, L. J., 2000. Sampling bees (Hymenoptera: Apiformes) for pol�Apiformes) for pol�linator community studies: pitfalls of pan–trapping. Journal of the Kansas Entomological Society, 73: 225–231.
Castro–Caro, J. C., Barrio, I. C. & Tortosa, F. S., 2014. Is the effect of farming practices on song�bird communities landscape dependent? A case study of olive groves in southern Spain. Journal of Ornithology, 155: 357–365.
Chao, A. & Jost, L., 2012. Coverage–based rarefac�–based rarefac�based rarefac�tion and extrapolation: standardizing samples by completeness rather than size. Ecology, 93(12), 2533–2547.
Chao, A., Ma, K. H. & Hsieh, T. C., 2016. iNEXT (iN�terpolation and EXTrapolation) Online: Software for Interpolation and Extrapolation of Species Diversity. Program and User’s Guide published at http://chao.stat.nthu.edu.tw/wordpress/software_download/
Chinery, M., 2005. Field Guide of Insects of Spain And Europe. Ediciones Omega, Barcelona.
Clarke, K. R., 1993. Non–parametric multivariate analysis of changes in community structure. Aus-tralian Journal of Ecology, 18: 117–143.
Clarke, K. R. & Gorley, R. N., 2006. PRIMER v6: User Manual/Tutorial. PRIMER–E, Plymouth.
Dafni, A., Bernhardt, P., Shmida, A., Ivri, B. Y., Gre�enbaum, S., O´Toole, Ch. & Losito, L., 1990. Red bowlshaped flowers: convergence for beetle pol�lination in the Mediterranean region. Israel Journal of Botany, 9: 81–92.
Dindal, D. L., 1990. Soil Biology Guide. Wiley and Sons Inc, New York.
Giourga, C., Loumou, A., Margaris, N. S., Theodor�akakis, M. & Koukoulas, S., 1994. The olive groves in the Aegean. In: Sciences and Environment at the End of the Century: Problems – Perspectives: 334–344 (D. Rokos, Ed.). N.T.U.A. and Alternative Editions, Athens.
Gkisakis, V. D., Kollaros, D., Bàrberi, P., Livieratos, I. C. & Kabourakis, E. M., 2015. Soil arthropod diversity in organic, integrated, and conventional olive orchards and different agroecological zones in Crete, Greece. Agroecology and Sustainable Food Systems, 39: 276–294.
Gkisakis, V. D., Volakakis, N., Kollaros, D., Bàrberi, P. & Kabourakis, E. M., 2016. Soil arthropod community in the olive agroecosystem: Deter�mined by environment and farming practices in
different management systems and agroeco�logical zones. Agriculture, Ecosystems & Environ-ment, 218: 178–189.
Gollan, J. R., Ashcroft, M. B. & Batley, M., 2011. Comparison of yellow and white pan traps sur�veys of bee fauna in New South Wales, Australia (Hymenoptera: Apoidea: Anthophila). Australian Journal of Entomology, 50: 174–178.
Gonçalves, M. F. & Pereira, J. A., 2012. Abundance and diversity of soil arthropods in the olive grove ecosystem. Journal of Insect Science, 12(1): 20.
Goulet, H. & Huber, J. T., 1993. Hymenoptera Of The World: An Identification Guide To Families. Agriculture Canada, Ottawa.
Guerrero–Casado, J., Carpio, A. J., Prada, L. M. & Tortosa, F. S., 2015. Short communication. The role of rabbit density and the diversity of weeds in the development of cover crops in olive groves. Spanish Journal of Agricultural Research, 13(3): e03SC01. Http://dx.doi.org/10.5424/sjar/2015133–7022.
Hope, A. C. A., 1968. A simplified Monte Carlo sig�nificance test procedure. Journal of the Royal Statistical Society, series B, 30: 582–598.
Hutchens, S. J. & DePerno, C. S., 2009. Efficacy of sampling techniques for determining species rich�ness estimates of reptiles and amphibians. Wildlife Biology, 15: 113–122.
Jeanneret, P., Schüpbach, B. & Luka, H., 2003. Quan�tifying the impact of landscape and habitat features on biodiversity in cultivated landscapes. Agriculture, Ecosystems & Environment, 98: 311–320.
Jerez–Valle, C., García, P. A., Campos, M. & Pascual, F., 2014. A simple bioindication method to discrimi�nate olive orchard management types using the soil arthropod fauna. Applied Soil Ecology, 76: 42–51.
Joshi, N. K., Leslie, T., Rajotte, E. G., Kammerer, M. A., Otieno, M. & Biddinger, D. J., 2015. Comparative trapping efficiency to characterize bee abundance, diversity, and community composition in apple orchards. Annals of the Entomological Society of America, 108(5): 785–799.
Kitching, R. L., Li, D. & Stork, N. E., 2001. Assessing biodiversity sampling packages: how similar are arthropod assemblages in different tropical rain�forest? Biodiversity & Conservation, 10: 793–813.
Larsen, N. J., Minor, M. A., Cruickshank, R. H. & Robertson, A. W., 2014. Optimising methods for collecting Hymenoptera, including parasitoids and Halictidae bees, in New Zealand apple orchards. Journal of Asia–Pacific Entomology, 17: 375–381.
Loumou, A. & Giourga, C., 2003. Olive groves: 'The life and identity of the Mediterranean'. Agriculture and Human Values, 20: 87–95.
MAGRAMA, 2016. Ministerio de Agricultura, Alimenta�ción y Medio Ambiente. Url: http://www.magrama.gob.es/es/ [Accessed on 22 June 2016].
Margaris, N. S., 1980. Structure and dynamics of Mediterranean type vegetation. Portugaliae Acta Biologica, 16: 45–58.
Marshall, S. A., Anderson, R.S., Roughly, R. E., Be�han–Pelletier, V. & Danks, H. V., 1994. Terrestrial Arthropod biodiversity: planning study ad recom�mended sampling techniques. Biological Survey

204 Castro et al.
of Canada: 1–33.Matson, P. A., Parton, W. J., Power, A. G. & Swift, M.
J., 1997. Agricultural intensification and ecosystem properties. Science, 277: 504–509.
McGarigal, K., Cushman, S. A., Neel, M. C. & Ene, E., 2002. FRAGSTATS: Spatial Pattern Analysis Program for Categorical Maps. University of Mas�sachusetts, Amherst.
Nemesio, A. & Morato, E. F., 2005. The orchid–bee fauna (Hymenoptera: Apidae) of Acre state (north�western Brazil) and a re–evaluation of euglossine bait–trapping. Lundiana, 7(1): 59–64.
Nentwig, W., 2003. Management of biodiversity in agroe�cosystems. Basic and Applied Ecology, 4: 105–106.
Niedobová, J. & Fric, Z. F., 2014, The Adequacy of some collecting techniques for obtaining rep�resentative arthropod sample in dry grasslands. Acta Universitatis Agriculturae et Silviculturae Mendelianae Brunensis, 62(1): 167–174.
Nielsen, A., Steffan–Dewenter, I., Westphal, C., Messinger, O., Potts, S., Roberts, S.M., Settele, J., Szentgyörgyi, H., Vaissière, B., Vaitis, M., Woycie�chowski, M., Bazos, I., Biesmeijer, J., Bommarco, R., Kunin, W., Tscheulin, T., Lamborn, E. & Petanidou, T., 2011. Assessing bee species richness in two Mediterranean communities: importance of habitat type and sampling techniques. Ecological Research, 26: 969–983.
Parker, W. E., 1996. The development of baiting techniques to detect wireworms (Agriotes spp., Coleoptera: Elateridae) in the field, and the rela�tionship between bait–tra catches and wireworm damage to potato. Crop Protection, 15(6): 521–527.
Pedigo, L. P. & Buntin, G. D., 1993. Handbook of Sampling Methods for Arthropods in Agriculture. CRC Press, Boca Raton.
Pfiffner, L. & Luka, H., 2003. Effects of low–input farm�ing systems on carabids and epigeal spiders – a paired farm approach. Basic and Applied Ecology, 4(2): 117–127.
Ponce, C., Bravo, C., de León, D. G., Magana, M. & Alonso, J. C., 2011. Effects of organic farming on plant and arthropod communities: A case study in Mediterranean dryland cereal. Agriculture, Ecosys-tems & Environment, 141(1): 193–201.
Popic, T. J., Davila, Y. C. & Wardle, G. M., 2013. Evalu�ation of common methods for sampling invertebrate pollinator assemblages: net sampling out–perform pan traps. PloS ONE, 8(6): e66665, 1–9.
Rey, P. J., 2011. Preserving frugivorous birds in agro–ecosystems: lessons from Spanish olive orchards. Journal of Applied Ecology, 48: 228–237.
Roulston, T. H., Smith, S. A. & Brewster, A. L., 2007. A comparison of pan trap and intensive net sampling techniques for documenting a bee (Hymenoptera: Apiformes) fauna. Journal of the Kansas Entomolo-gical Society, 80: 179–181.
Ruano, F., Lozano, C., García, P., Peña, A., Tinaut, A., Pascual, F. & Campos, M., 2004. Use of arthropods for the evaluation of the olive–orchard management regimes. Agricultural and Forest Entomology, 6:
111–120.Rubene, D., Schroeder, M. & Ranius, T., 2015. Es�
timating bee and wasp (Hymenoptera: Aculeata) diversity on clear–cuts in forest landscapes – an evaluation of sampling methods. Insect Conserva-tion and Diversity, 8: 261–271.
Santos, S. A. P., Cabanas, J. E. & Pereira, J. A., 2007. Abundance and diversity of soil arthropods in olive grove ecosystem (Portugal): effect of pitfall trap type. European Journal of Soil Biology, 43: 77–83.
Schweiger, O., Maelfait, J. P., Wingerden, V. W., Hen�drickx, F., Billeter, R., Speelmans, M., Augenstein, I., Aukema, B., Aviron, S., Bailey, D., Bukacek, R., Burel, F., Diekötter, T., Dirksen, J., Frenzel, M., Her�zog, F., Liira, J., Roubalova, M. & Bugter, R., 2005. Quantifying the impact of environmental factors on arthropod communities in agricultural landscapes across organizational levels and spatial scales. Jour-nal of Applied Ecology, 42(6): 1129–1139.
Shannon, C. E. & Weaver, W., 1963. The mathemati-cal theory of communication. University of Illinois Press, Urbana.
Shapiro, L., Tepedino, V. J. & Minckley, R., 2014. Bowl�ing for bees: optimal sample number for 'bee bowl' sampling transects. Journal of Insect Conservation, 18: 1105–1113.
Siemann, E., Haarstad, J. & Tilman, D., 1997. Short–term and long–term effects of burning on oak savanna arthropods. American Midland Naturalist, 137: 349–361.
Sokos, C. K., Mamolosa, A. P., Kalburtji, K. L. & BirtsascM, P. K., 2013. Farming and wildlife in Mediterranean agroecosystems. Journal for Nature Conservation, 21: 81–92.
Spafford, R. D. & Lortie, C. J., 2013. Sweeping beauty: is grassland arthropod community composition effectively estimated by sweep netting? Ecology and Evolution, 3(10): 3347–3358.
Tilman, D., Fargione, J., Wolff, B., D’Antonio, C., Dob�son, A., Howarth, R., Schindler, D., Schlesinger, W. H., Simberloff, D. & Swackhamer, D., 2001. Fore�casting agriculturally driven global environmental change. Science, 292: 281–284.
Wang, C., Strazanac, J. & Butler, L., 2001. A com�parison of pitfall traps with bait traps for studying leaf litter ant communities. Journal of Economic Entomology, 94(3): 761–765.
Westphal, C., Bommarco, R., Carré, G., Lamborn, E., Morison, N., Petanidou, T., Potts, S. G., Roberts, S. P., Szentgyögyi, H., Tscheulin, T., Vaissière, B., Woyciechowski, M., Biesmeijer, J. C., Kunin, W. E., Settele, J. & Steffan–Dewenter, I., 2008. Measuring bee diversity in different European habitats and biogeographical regions. Ecological Monographs, 78(4): 653–671.
Yahner, R. H., 1988. Changes in wildlife communities near edges. Conservation Biology, 2(4): 333–339.
Yi, Z., Jinchao, F., Dayuan, X., Weiguo, S. & Axmacher, J. C., 2012. A comparison of terrestrial arthropod sampling methods. Journal of Resources and Ecology, 3(2): 174–182.
Animal Biodiversity and Conservation 40.2 (2017) 205
ActinedidaStigmaeidae BT
AraneaeAgelenidae PT, SNAraneidae PT, SNAtypidae SNClubionidae SNCtenizidae PT, SNGnaphosidae PT, BTLinyphiidae PT, SN, BTLycosidae PT, SNLyniohiidae SNMimetidae SN, BTMiturgidae PT, SN, BTOecobiidae PT, BTOxyopidae SN, BTPisauridae PT, SN, BTSalticidae PT, SN, BTSelenopidae BTTheraphosidae SNTheridiidae PT, SN, BTThomisidae PT, SN, BTThretagnatidae SNZodaridae PT, SN
ColeopteraAegialiidae PTAesalidae PT, BTAnaspididae PTAnobiidae SNAnthicidae PT, SN, BTAnthribidae SNAttelabidae PT, SN, BTBostrychidae PTBruchidae PTBuprestidae PT, SN, BTByrrhidae SNCantharidae PT, SN, BTCarabidae PT, SN, BTCerambycidae PT, SNChrysomelidae PT, SN, BT
Cleridae PTCoccinelidae PT, SN, BTCurculionidae PT, SN, BTDascillidae PTDasytidae PT, SN, BTDermestidae PT, SNElateridae PT, SNStaphylinidae PT, SN, BTHisteridae PT, BTHydrophilidae PTLycidae PTMalachiidae PTMeloidae PT, SN, BTMelyridae PT, SN, BTMordellidae PT, SN, BTNitidulidae SN, BTOedemeridae PT, SN, BTPselaphidae PTPtiliidae PT, SN
Scarabaeidae PT, SN, BTScolytidae SNSilvanidae PT
CollembolaEntomobryidae PT, SN, BTIsotomidae PT, BTOnychiuridae PTPoduridae PTTomoceridae PT, BT
DermapteraForficulidae SNLabiidae PT, BT
DipteraAgromyzidae PT, SN, BTAnisopodidae PT, SN, BTAnthomyiidae PTAsilidae PTBombyliidae PT, SNCalliphoridae PT, SN, BTCamillidae PTCecidomyiidae PT, SN, BT
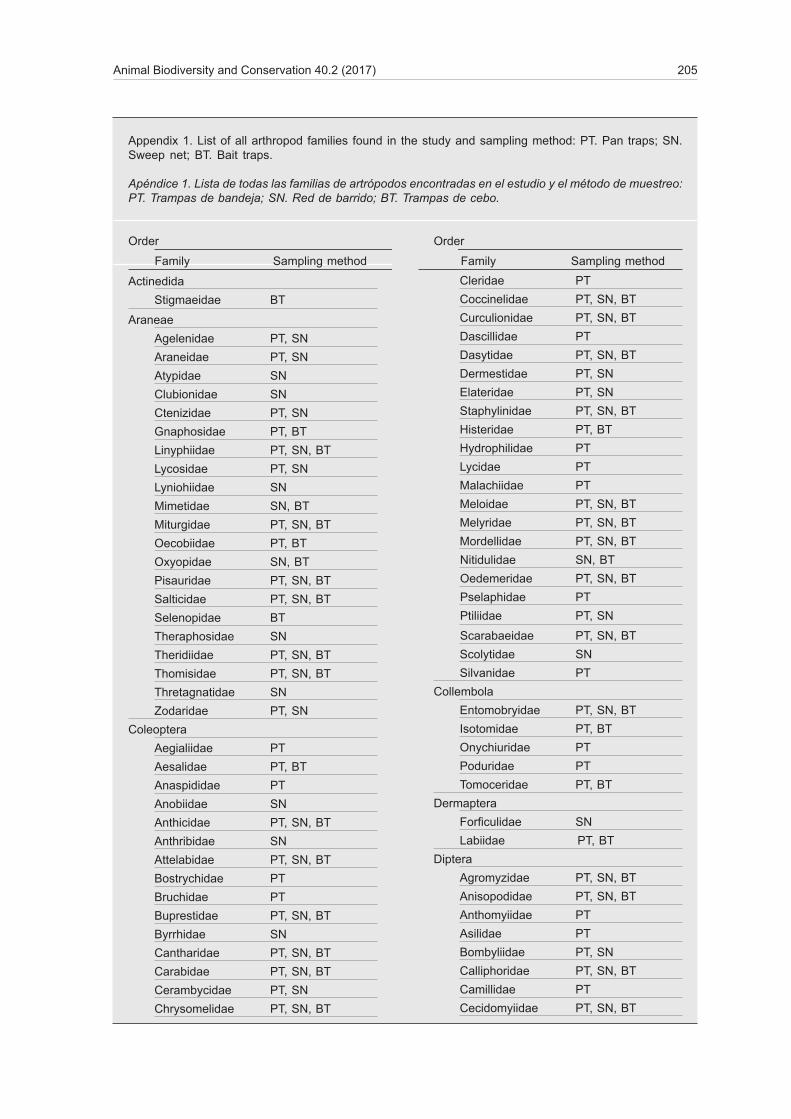
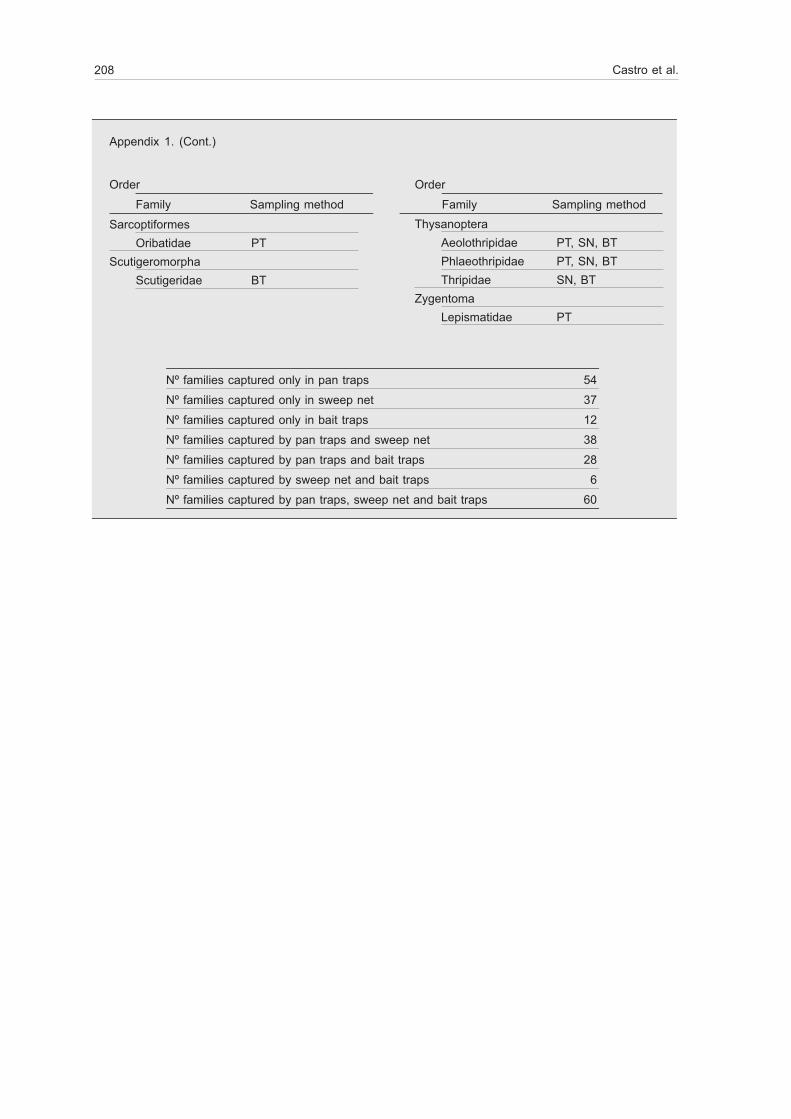
Appendix 1. List of all arthropod families found in the study and sampling method: PT. Pan traps; SN. Sweep net; BT. Bait traps.
Apéndice 1. Lista de todas las familias de artrópodos encontradas en el estudio y el método de muestreo: PT. Trampas de bandeja; SN. Red de barrido; BT. Trampas de cebo.
Order Order
Family Sampling method Family Sampling method
206 Castro et al.
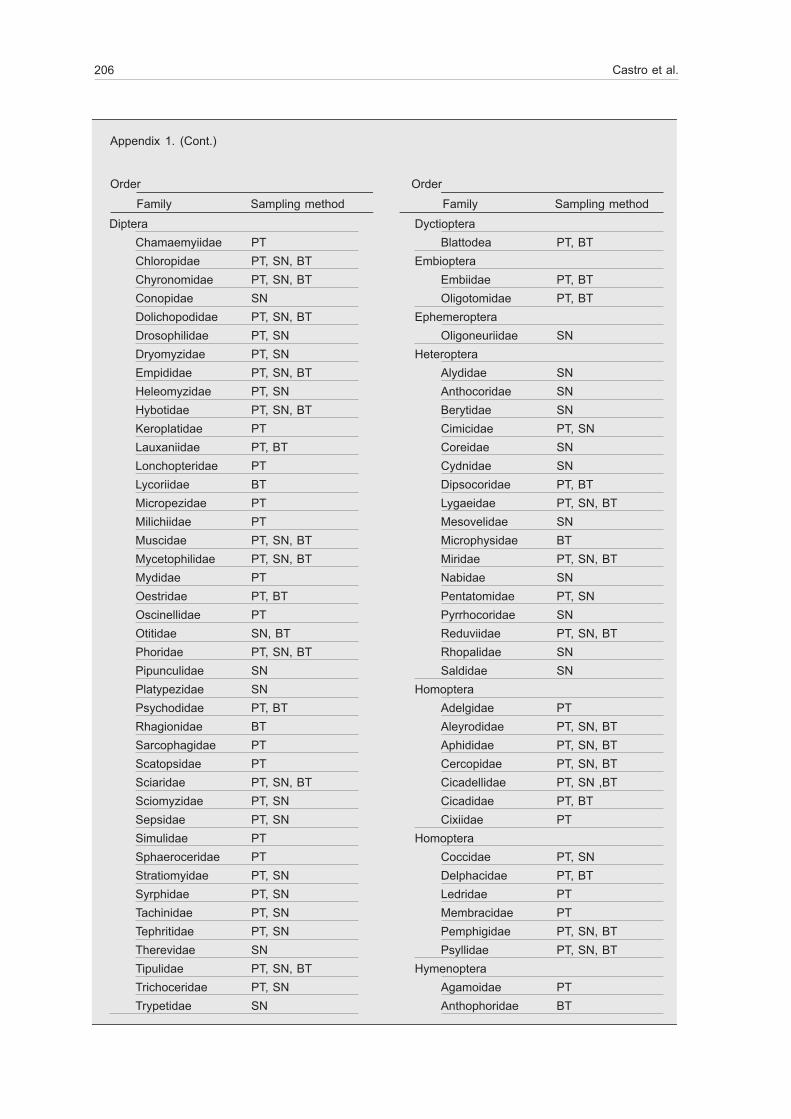
Appendix 1. (Cont.)
Order Order
Family Sampling method Family Sampling methodDiptera
Chamaemyiidae PTChloropidae PT, SN, BTChyronomidae PT, SN, BTConopidae SNDolichopodidae PT, SN, BTDrosophilidae PT, SNDryomyzidae PT, SNEmpididae PT, SN, BTHeleomyzidae PT, SNHybotidae PT, SN, BTKeroplatidae PTLauxaniidae PT, BTLonchopteridae PTLycoriidae BTMicropezidae PTMilichiidae PTMuscidae PT, SN, BTMycetophilidae PT, SN, BTMydidae PTOestridae PT, BTOscinellidae PTOtitidae SN, BTPhoridae PT, SN, BTPipunculidae SNPlatypezidae SNPsychodidae PT, BTRhagionidae BTSarcophagidae PTScatopsidae PTSciaridae PT, SN, BTSciomyzidae PT, SNSepsidae PT, SNSimulidae PTSphaeroceridae PTStratiomyidae PT, SNSyrphidae PT, SNTachinidae PT, SNTephritidae PT, SNTherevidae SNTipulidae PT, SN, BTTrichoceridae PT, SNTrypetidae SN
DyctiopteraBlattodea PT, BT
EmbiopteraEmbiidae PT, BTOligotomidae PT, BT
EphemeropteraOligoneuriidae SN
HeteropteraAlydidae SNAnthocoridae SNBerytidae SNCimicidae PT, SNCoreidae SNCydnidae SNDipsocoridae PT, BTLygaeidae PT, SN, BTMesovelidae SNMicrophysidae BTMiridae PT, SN, BTNabidae SNPentatomidae PT, SNPyrrhocoridae SNReduviidae PT, SN, BTRhopalidae SNSaldidae SN
HomopteraAdelgidae PTAleyrodidae PT, SN, BTAphididae PT, SN, BTCercopidae PT, SN, BTCicadellidae PT, SN ,BTCicadidae PT, BTCixiidae PT
HomopteraCoccidae PT, SNDelphacidae PT, BTLedridae PTMembracidae PTPemphigidae PT, SN, BTPsyllidae PT, SN, BT
HymenopteraAgamoidae PTAnthophoridae BT

Animal Biodiversity and Conservation 40.2 (2017) 207
HymenopteraApidae PT, SN, BTBethylidae PT, SN, BTBraconidae PT, BTCephidae PT, SNCeraphronidae PT, BTChalcididae PT, SNChrysididae PT, SNCleptidae PTCynipidae PT, SN, BTDryinidae PTEncyrtidae PTEulophidae PTEurytomidae PTEvaniidae BTFormicidae PT, SN, BTGasteruptiidae PTHalictidae PT, SN, BTIcneumonidae PT, SN, BTLeucospidae PTMegaspilidae PTMelittidae PTMutillidae PTMymaridae PT, BTOrussidae PT, BTPlatygasteridae PT, BTProctotrupidae PTPteromalidae PT, BTScelionidae BTScoliidae PT, SN, BTSphecidae PT, SN, BTStephanidae PT, BTThenthredinidae PT, SNTorymidae PT, SNTrichogrammatidae PT, SNTrigonalidae PT, BTVespidae PT, SN
IsopodaAnthuridea PTArmadillidae PT
IxodidaArgasidae PT, SNIxodidae SN, BT
LepidopteraArctiidae BTEriocraniidae PT, BTGelechiidae PT, SNGeometridae PT, SN, BTHesperidae SNIncurvariidae SNMicropterigidae PTNepticulidae PT, SN, BTNoctuidae PT, SNNotodontidae PT, SNNymphalidae SNPapilionidae PT, SNPieridae PT, SN, BTPterophoridae PTPyralidae SNRiodinidae SNSatyrinae SNSesiidae PTTineidae PT, SN, BTTortricidae SNZygenoidea SN
MesostigmataPhytoseiidae PT, BT
NeuropteraChrysopidae PT, SNSialidae BTSisyridae SN
OrthopteraAcrididae PT, SNPyrgomorphidae SNTettigoniidae PT, SN, BT
PseudoescorpionidaGarypidae PTNeobisidae PT, BT
PsocopteraEpipsocidae PTLachesillidae BTPsyllipsocidae PTTrogiidae PT
RaphidiopteraRaphidiidae PT, SN
Appendix 1. (Cont.)
Order Order
Family Sampling method Family Sampling method
208 Castro et al.
Sarcoptiformes Oribatidae PT
ScutigeromorphaScutigeridae BT
ThysanopteraAeolothripidae PT, SN, BTPhlaeothripidae PT, SN, BTThripidae SN, BT
ZygentomaLepismatidae PT
Nº families captured only in pan traps 54
Nº families captured only in sweep net 37
Nº families captured only in bait traps 12
Nº families captured by pan traps and sweep net 38
Nº families captured by pan traps and bait traps 28
Nº families captured by sweep net and bait traps 6
Nº families captured by pan traps, sweep net and bait traps 60
Appendix 1. (Cont.)
Order Order
Family Sampling method Family Sampling method

Animal Biodiversity and Conservation 40.2 (2017) 209
Appendix 2. Arthropod families that contributed to 70% of the cumulative similarity within the three sampling methods (pan traps, sweep net and bait traps): C. Contribution (%)
Apéndice 2. Familias de artrópodos que contribuyeron al 70% de la similitud acumulada entre los tres métodos de muestreo (trampas de bandeja, red de barrido y trampas de cebo): C. Contribución (%).
Order Family C(%) Order Family C(%)
Pan traps similarity: 23.78%
Thysanoptera Thripidae 11.81
Homoptera Adelgidae 9.68
Hymenoptera Formicidae 8.20
Thysanoptera Aeolothripidae 7.66
Hymenoptera Apidae 4.52
Diptera Phoridae 4.07
Diptera Mycetophilidae 3.95
Diptera Muscidae 3.89
Diptera Chyronomidae 3.02
Hymenoptera Icneumonidae 2.87
Hymenoptera Halictidae 2.87
Coleoptera Cantharidae 2.37
Coleoptera Curculionidae 2.22
Diptera Dolichopodidae 2.13
Diptera Sciaridae 1.77
Sweep net similarity: 31.53%
Heteroptera Nabidae 11.75
Hymenoptera Apidae 8.99
Heteroptera Pyrrhocoridae 7.12
Thysanoptera Thripidae 7.11
Coleoptera Cantharidae 6.30
Heteroptera Mesovelidae 5.36
Coleoptera Curculionidae 5.01
Coleoptera Melyridae 4.43
Lepidoptera Pterophoridae 4.19
Coleoptera Chrysomelidae 4.07
Coleoptera Coccinelidae 3.72
Homoptera Adelgidae 2.71
Bait traps similarity: 27.23%
Thysanoptera Thripidae 19.05
Homoptera Adelgidae 16.25
Hymenoptera Formicidae 15.38
Thysanoptera Aeolothripidae 13.51
Coleoptera Cantharidae 5.85

210 Castro et al.
Appendix 3. Arthropod families that contributed (C in %) to more than 2% of dissimilarity between the three sampling methods: PT. Pan traps; SN. Sweep net; and BT. Bait traps.
Apéndice 3. Familias de artrópodos que contribuyeron (C en %) con más de un 2% a la diferencia existente entre los tres métodos de muestreo: PT. Trampas de bandeja; SN. Red de barrido; BT. Trampas de cebo.
Order Family Average of abundance Pan traps vs. sweep net dissimilarity: 81.12% PT SN C(%) Thysanoptera Thripidae 6.66 2.97 4.43
Hymenoptera Apidae 2.18 3.58 3.23Hymenoptera Formicidae 4.93 0.90 3.08Heteroptera Nabidae 0.47 4.43 3.03Homoptera Adelgidae 5.17 1.71 2.85Collembola Isotomidae 6.41 0.15 2.67Hymenoptera Halictidae 2.68 3.07 2.45Thysanoptera Aeolothripidae 3.22 1.50 2.38Heteroptera Pyrrhocoridae 0.66 2.99 2.29Diptera Mycetophilidae 4.14 0.25 2.28Coleoptera Melyridae 0.35 2.24 2.03
Sweep net vs. bait traps dissimilarity: 82.12% SN BT C(%)Hymenoptera Apidae 3.58 0.15 5.01Heteroptera Nabidae 4.43 0.15 4.72Heteroptera Pyrrhocoridae 2.99 0.00 3.59Thysanoptera Thripidae 2.97 3.43 3.54Hymenoptera Formicidae 0.90 3.51 3.39Coleoptera Melyridae 2.24 0.19 3.17Homoptera Adelgidae 1.71 3.18 3.16Thysanoptera Aeolothripidae 1.50 2.71 2.98Hymenoptera Halictidae 3.07 0.45 2.77Heteroptera Mesovelidae 2.01 0.29 2.13Homoptera Aphididae 0.00 1.85 2.01
Pan traps vs. bait traps dissimilarity: 77.88% PT BT C(%)Thysanoptera Thripidae 6.66 3.43 5.97Hymenoptera Formicidae 4.93 3.51 4.08Homoptera Aphididae 3.04 1.85 3.63Collembola Isotomidae 6.41 0.90 3.61Hymenoptera Apidae 2.18 0.15 3.47Homoptera Adelgidae 5.17 3.18 3.43Thysanoptera Aeolothripidae 3.22 2.71 3.26Diptera Mycetophilidae 4.14 1.88 3.26Diptera Muscidae 3.22 0.71 2.59Diptera Phoridae 3.68 1.12 2.56Diptera Sciaridae 2.43 0.67 2.08Diptera Chyronomidae 1.82 0.83 2.01