spring 2013. valuation of transportation safety value of life human capital direct costs output...
Post on 19-Dec-2015
214 views
TRANSCRIPT
Value of Life andTraffic Injury Costs
Spring 2013

Valuation of Transportation Safety
Value of Life
Human Capital
Direct Costs
Output Losses
Net Consumption
Gross Output
Willingness to Pay
Collective Decision
Changes in Individual Risk
Court Awards
Government Decisions
Wage Differentials
Consumer Behavior
Hypothetical Risk Reduction
Pain & Suffering
+

Medical Costs Emergency Services Property Damage Administrative expanses Issues:
◦ Large uncertainty◦ Some costs would have been used even if
collision has not happened
Human Capital

Net of Consumption◦ Excess of expected output over their expected
consumption during the remaining lifetime◦ In other words, it is to the benefits passed to
future generations Gross Output
◦ The victim’s total output (victim’s own loss) Issues:
◦ Negative excess output◦ Children and older people are less valued◦ Uncertainty about future earnings and discount
rate
Human Capital

Emotional losses caused by motor vehicle crashes (mental & physical)
So far, only measured by courts Issues:
◦ Difficult to measure◦ When death occurs, the burden of the
emotional loss is beard by the family◦ Court awards in the US include a punishment in
addition to pain & suffering
Pain & Suffering
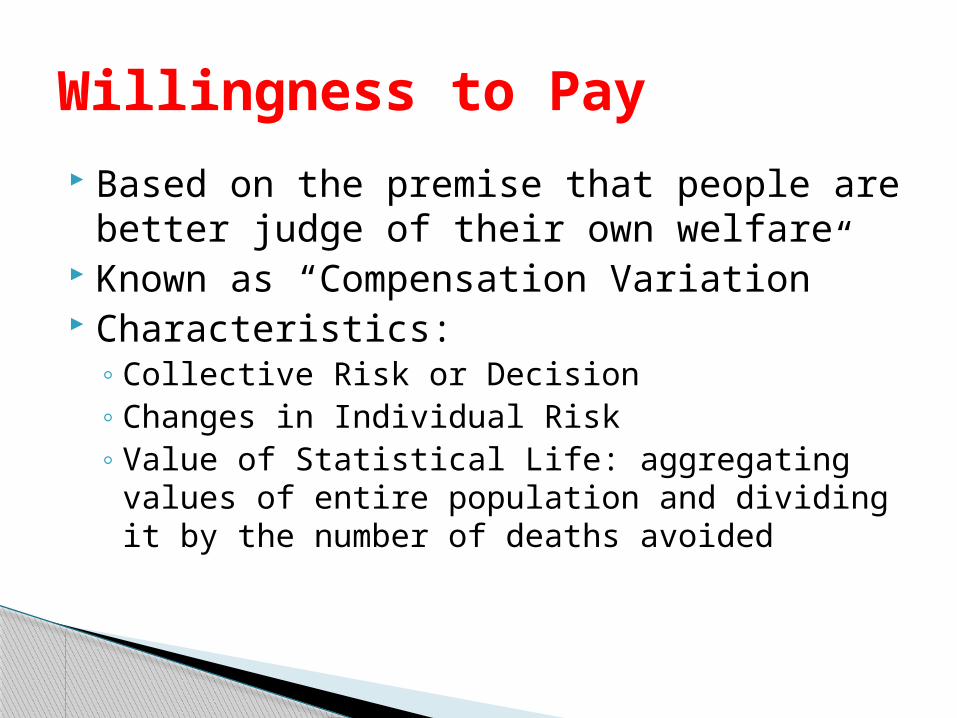
Based on the premise that people are better judge of their own welfare
Known as “Compensation Variation” Characteristics:
◦ Collective Risk or Decision◦ Changes in Individual Risk◦ Value of Statistical Life: aggregating values of
entire population and dividing it by the number of deaths avoided
Willingness to Pay

Court Awards Compensation◦ No consistency among decisions for same type
of injury◦ More lawsuits are filed for different types of
injury (negligence easier to prove) Government Decisions
◦ Governments continually make decision on acceptability of risk (policy)
◦ Decisions are different for different probability of death
◦ Rejection of proposals for reducing fatalities (building versus still birth)
Collective Risk

Wage Differentials◦ Pay versus risk of fatal and non-fatal injury◦ Differences in definition and measurements of risk◦ Work related risk versus all risk◦ Characteristics different: Union jobs versus non
union job◦ Workers don’t have all the information about risk◦ Perception of risk among same work force is
different
Individual Risk
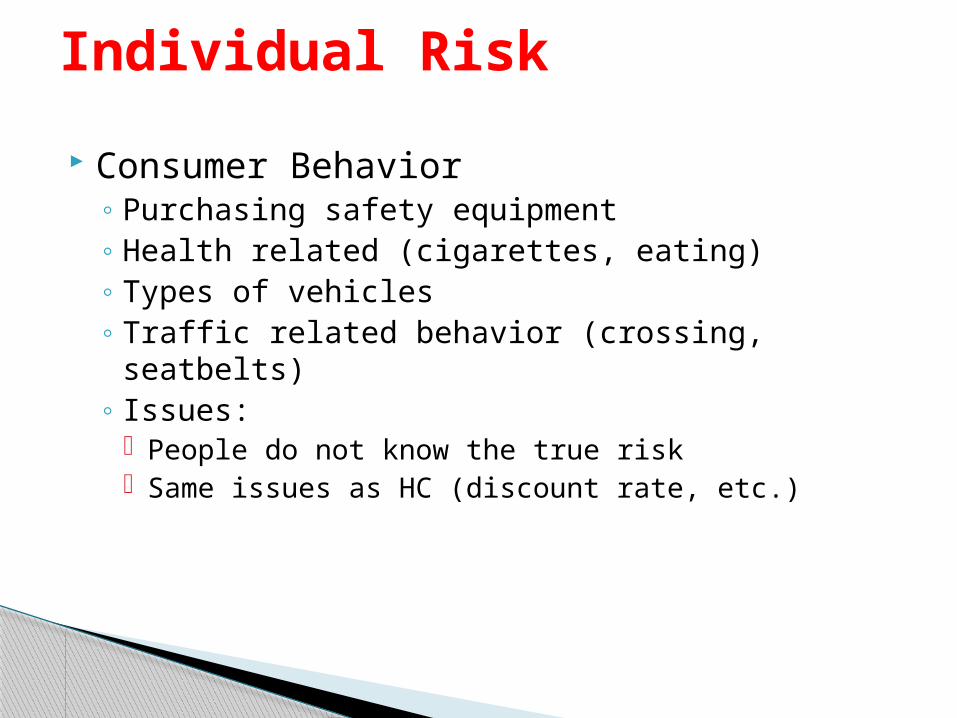
Consumer Behavior◦ Purchasing safety equipment◦ Health related (cigarettes, eating)◦ Types of vehicles◦ Traffic related behavior (crossing, seatbelts)◦ Issues:
People do not know the true risk Same issues as HC (discount rate, etc.)
Individual Risk

Hypothetical Risk Reduction◦ Subjects are surveyed about their risk and safety
habits◦ Issues:
Subjective versus perceived risk Wording of questions Accidental deaths versus medical deaths A wide variety of possible values
Individual Risk
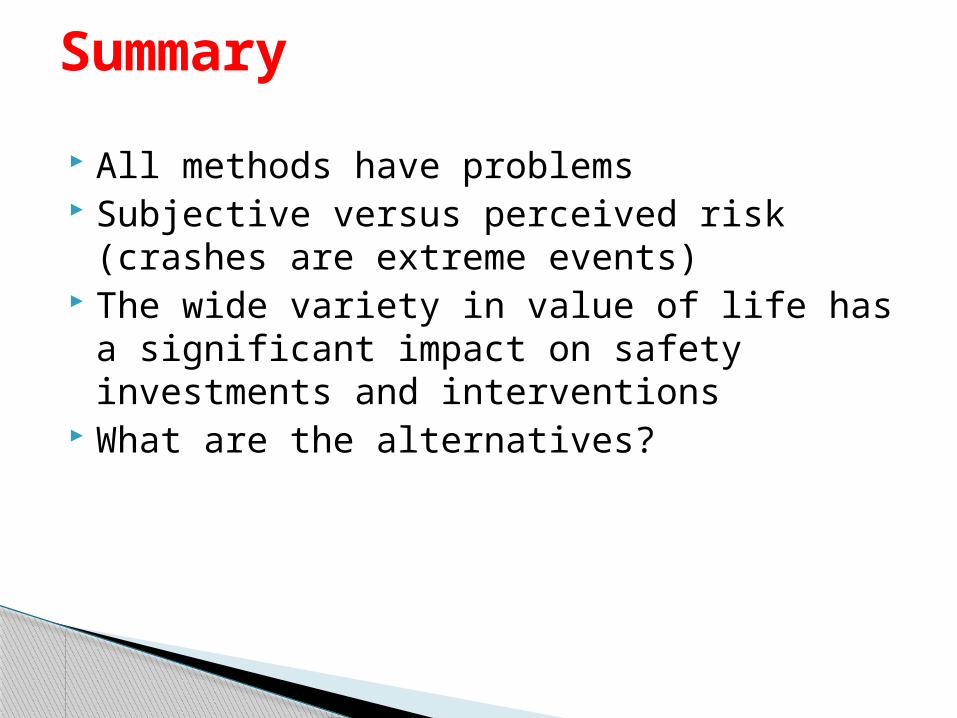
All methods have problems Subjective versus perceived risk (crashes
are extreme events) The wide variety in value of life has a
significant impact on safety investments and interventions
What are the alternatives?
Summary

Comprehensive Crash Costs (per person)
Type Cost (Y2010)
Death $4,360,000
Injury A $220,300
Injury B $56,200
Injury C $27,700
No injury $2,400
http://www.nsc.org/news_resources/injury_and_death_statistics/Pages/EstimatingtheCostsofUnintentionalInjuries.aspx
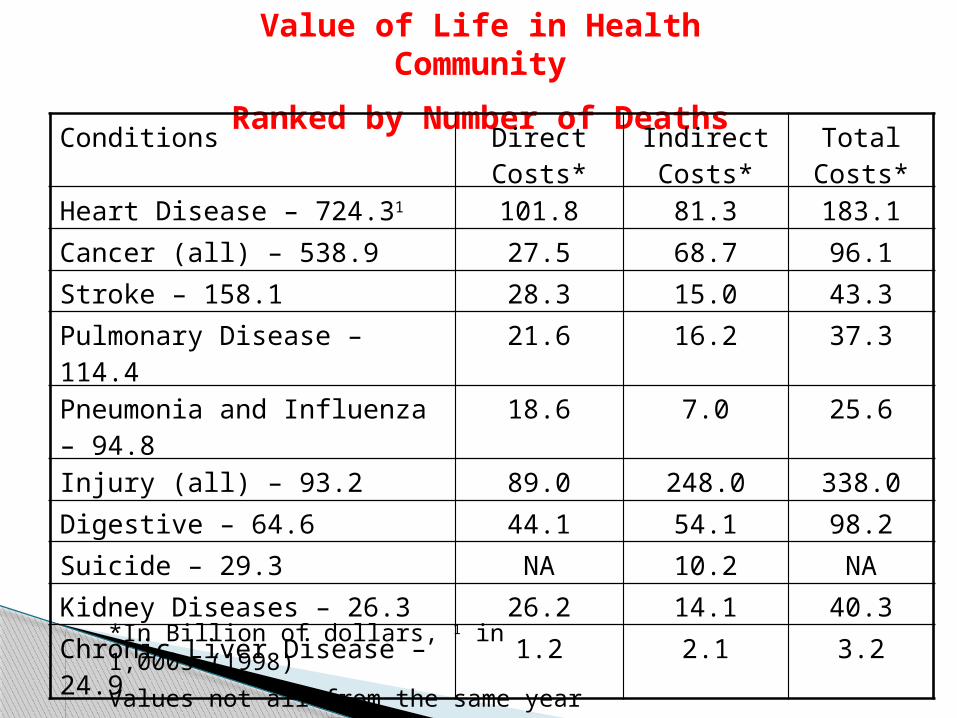
Value of Life in Health Community
Ranked by Number of DeathsConditions Direct Costs*
Indirect Costs*
Total Costs*
Heart Disease – 724.31 101.8 81.3 183.1
Cancer (all) – 538.9 27.5 68.7 96.1
Stroke – 158.1 28.3 15.0 43.3
Pulmonary Disease – 114.4 21.6 16.2 37.3
Pneumonia and Influenza – 94.8 18.6 7.0 25.6
Injury (all) – 93.2 89.0 248.0 338.0
Digestive – 64.6 44.1 54.1 98.2
Suicide – 29.3 NA 10.2 NA
Kidney Diseases – 26.3 26.2 14.1 40.3
Chronic Liver Disease – 24.9 1.2 2.1 3.2
*In Billion of dollars, 1 in 1,000s (1998)
Values not all from the same year
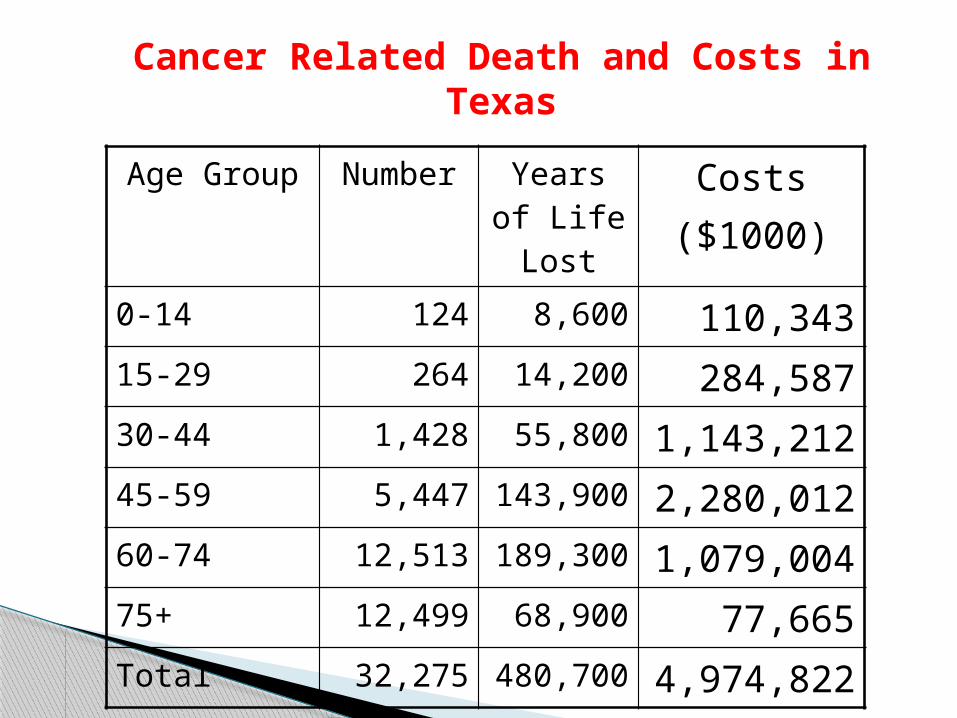
Age Group Number Years of Life Lost
Costs($1000)
0-14 124 8,600 110,34315-29 264 14,200 284,58730-44 1,428 55,800 1,143,21245-59 5,447 143,900 2,280,01260-74 12,513 189,300 1,079,00475+ 12,499 68,900 77,665Total 32,275 480,700 4,974,822
Cancer Related Death and Costs in Texas

Crash Costs and National Economy
5.7
Elvik (2000) AA&P Vol. 32, pp. 849-851
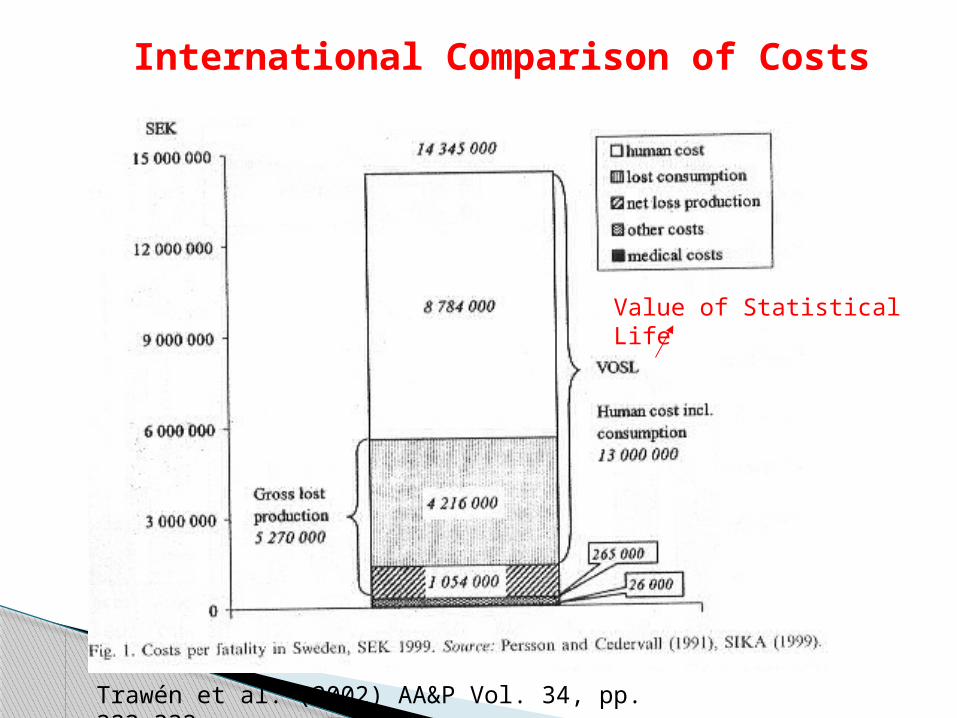
International Comparison of Costs
Trawén et al. (2002) AA&P Vol. 34, pp. 323-332
Value of Statistical Life

International Comparison of Costs
Austria Switzerland
Netherlands
Costs per Fatality
GE (Germany)

International Comparison of CostsVOSL/Human Costs Only
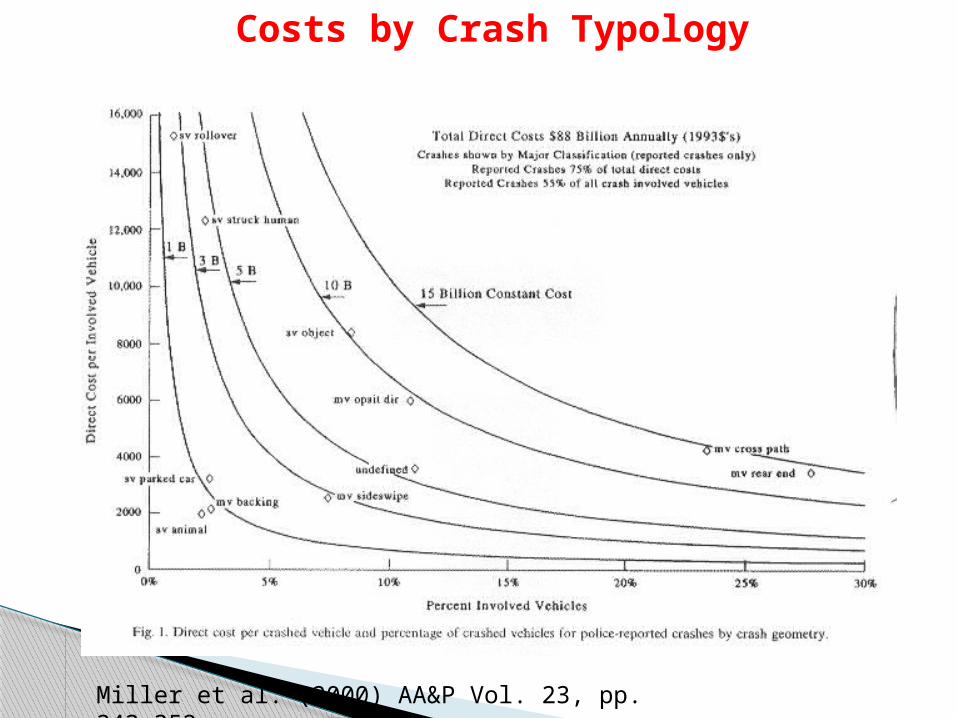
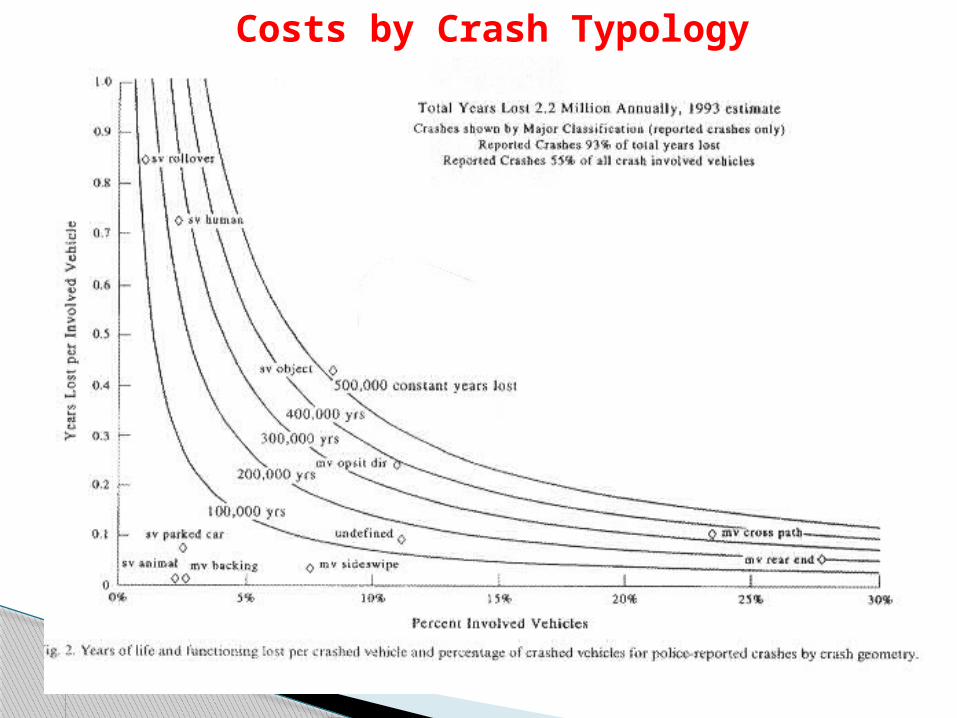
Costs by Crash Typology
Miller et al. (2000) AA&P Vol. 23, pp. 343-352
Costs by Crash Typology
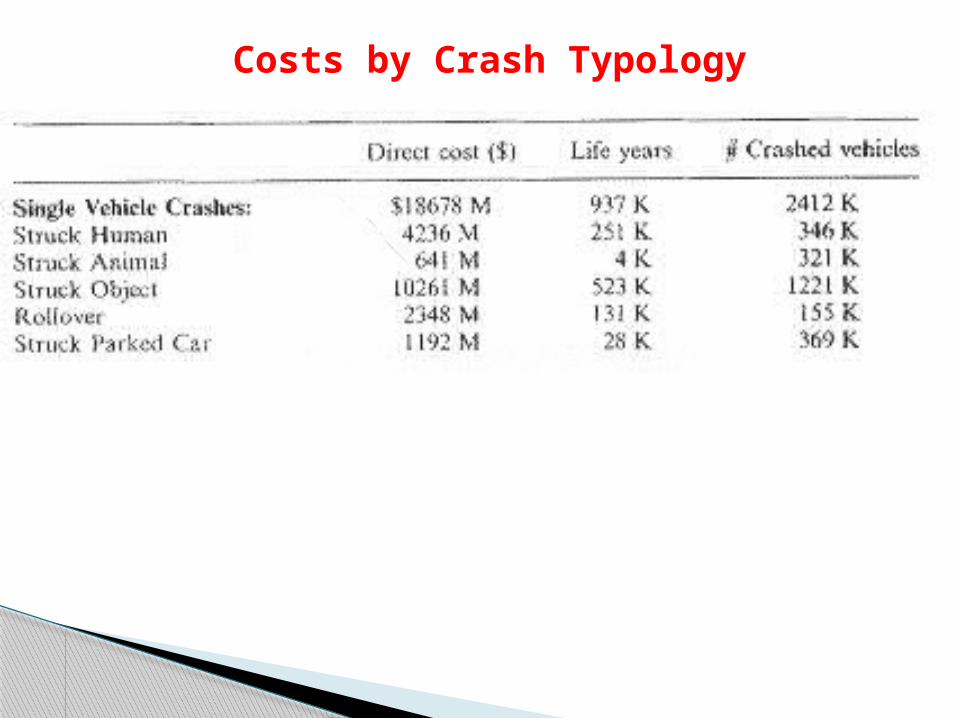
Costs by Crash Typology
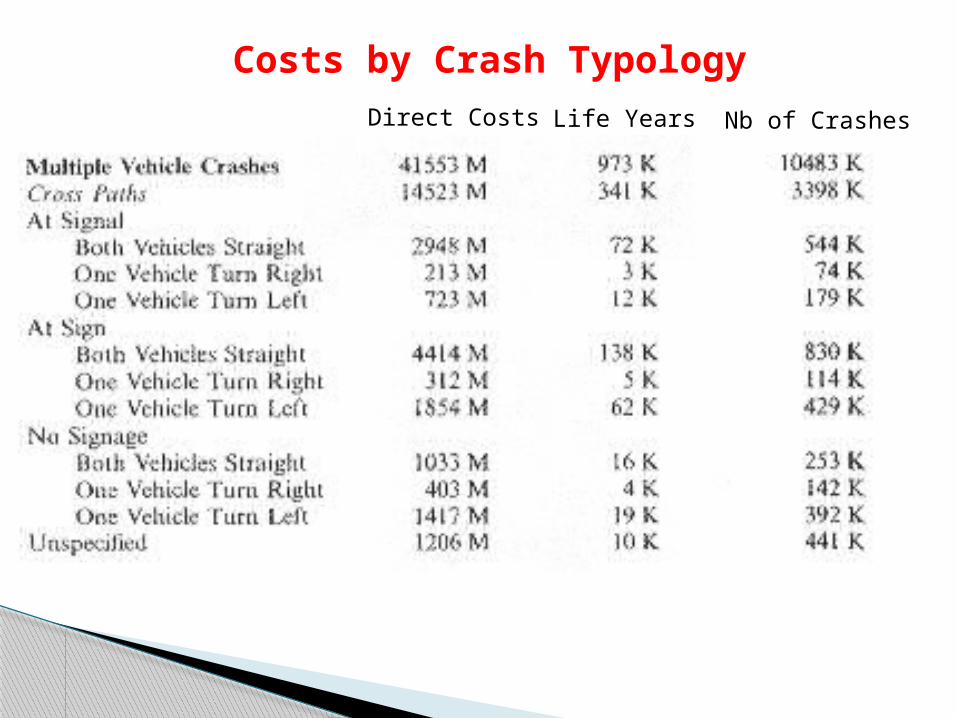
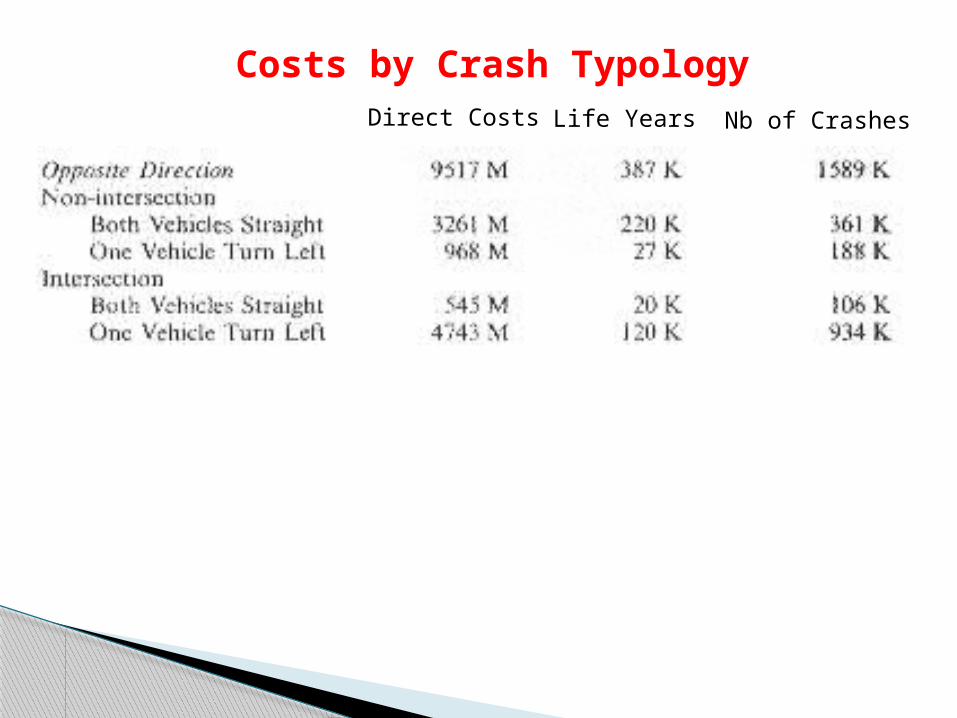
Costs by Crash TypologyDirect Costs Life Years Nb of Crashes
Costs by Crash TypologyDirect Costs Life Years Nb of Crashes
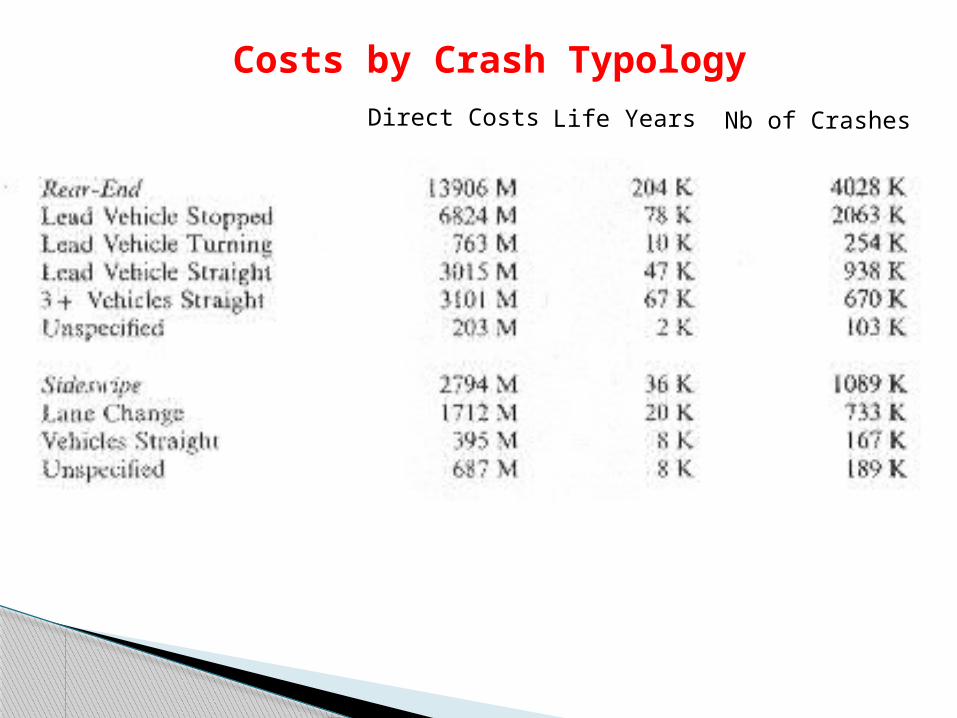
Costs by Crash TypologyDirect Costs Life Years Nb of Crashes
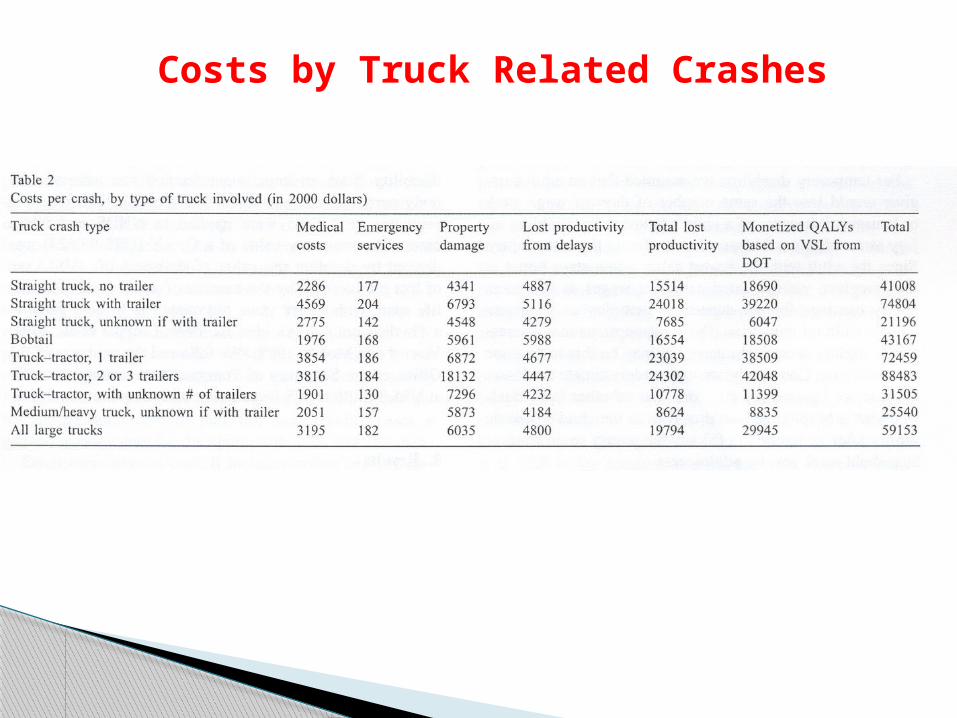
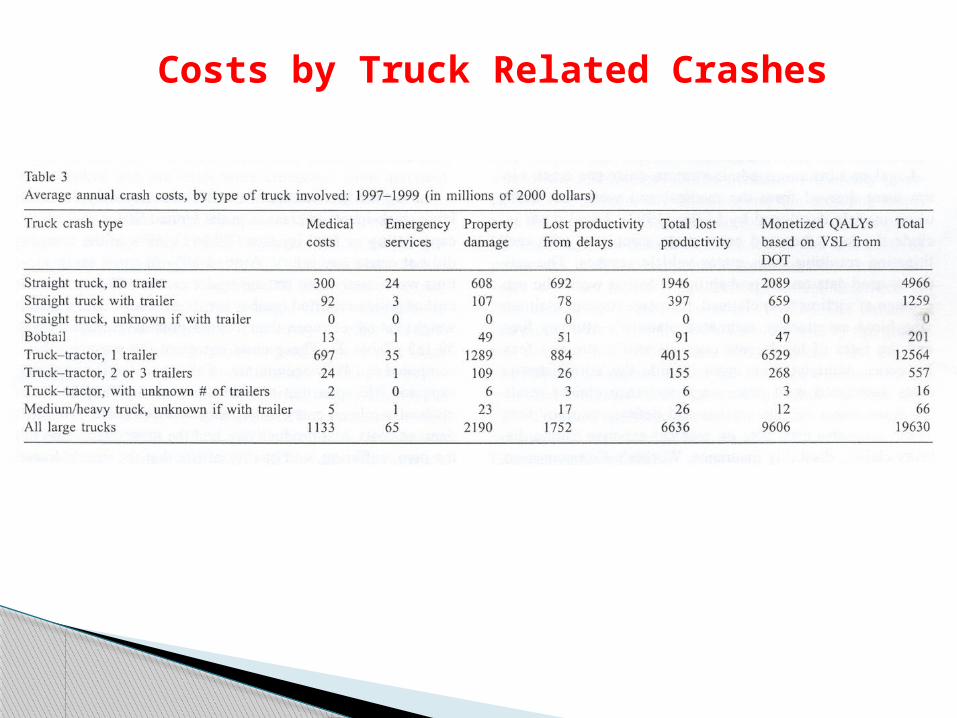
Costs by Truck Related Crashes
Costs by Truck Related Crashes

See Zaloshnja et al. (2004) Crash Costs by Body Part Injured, fracture Involvement and Threat-to-Life Severity, United States, 2000. Accident Analysis & Prevention, Vol. 36 pp. 415-427
See Zaloshnja et al. (2006) Crash costs in the United States by crash geometry. Accident Analysis & Prevention, Vol. 36, in press.
Economic effects of Red-Light Camera Programs
Council et al. (2005) TRB Right-angle and rear-end collisions Modest economic benefits ($28,000 to
$50,000 per site) Higher economic effects with higher
entering flows
Application #1

Economic Effects of Red-Light Running Programs

Economic Effects of Red-Light Running Programs