spotlight on energy on income and profit from energy companies / oil prices 2007 2008 2009 2010 2011...
TRANSCRIPT

Spotlight on Energy Our Oil. Our Gas. Our Future.
Presented by: Vishnu Dhanpaul
Permanent Secretary Ministry of Finance
March 14, 2018
1

40.4%
45.1%
30.3% 31.5%
33.7%
32.1%
28.0%
29.1%
18.4%
2.3%
1.2% 0.0%
5.0%
10.0%
15.0%
20.0%
25.0%
30.0%
35.0%
40.0%
45.0%
50.0%
2007 2008 2009 2010 2011 2012 2013 2014 2015 2016 2017
Per
cen
t (%
) Oil Revenue as a share of Total Revenue (%)
2007 - 2017
2
40.4%
45.1%
30.3% 31.5%
33.7%
32.1%
28.0%
29.1%
18.4%
2.3%
1.2% 0.0%
5.0%
10.0%
15.0%
20.0%
25.0%
30.0%
35.0%
40.0%
45.0%
50.0%
2007 2008 2009 2010 2011 2012 2013 2014 2015 2016 2017
Oil Revenue as a % of Total Revenue 2007 - 2017

Oil Revenue as % of Total Revenue vs. Total Expenditure 2007-2017
2007 2008 2009 2010 2011 2012 2013 2014 2015 2016 2017
Oil Revenue as a % of Total Revenue 40.4 45.1 30.3 31.5 33.7 32.1 28.0 29.1 18.4 2.3 1.2
Expenditure 39,835 53,897 45,853 46,731 51,528 52,839 57,962 61,939 59,971 52,945 50,479
0
10,000
20,000
30,000
40,000
50,000
60,000
70,000
0
5
10
15
20
25
30
35
40
45
50
TT$
Mn
Per
cen
tage
%
3

Taxes on Income and Profit from Energy Companies / Oil Prices
2007 2008 2009 2010 2011 2012 2013 2014 2015 2016 2017 2018
Taxes on Incomes and Profits 16,206 25,658 11,881 13,834 16,023 15,827 14,772 16,970 10,513 1,036 472 2,102
WTI Oil Prices ($ Per Barrel) 72.3 99.6 61.7 79.4 94.9 94.1 97.9 93.3 48.7 43.1 49.3 52.0
0
10
20
30
40
50
60
70
80
90
100
0
5,000
10,000
15,000
20,000
25,000
30,000
WTI
Oil
Pri
ces
($)
(TT
$M
n)

7.0 8.9
4.0 4.4 4.0 2.8 3.7 4.4 2.6 2.5 3.0
72.3
99.6
61.7
79.4
94.9 94.1 97.9
93.3
48.7
43.1
49.3
0.0
20.0
40.0
60.0
80.0
100.0
120.0
2007 2008 2009 2010 2011 2012 2013 2014 2015 2016 2017
US$
pe
r b
arre
l an
d p
er
mm
btu
Oil and Gas Prices 2007 – 2017 (Annual Average)
HENRY HUB GAS PRICE ($ PER MMBTU) WTI OIL PRICE ($ PER BARREL) 5
7.0 8.9 4.0 4.4 4.0 2.8 3.7 4.4 2.6 2.5 3.0 2.75
72.3
99.6
61.7
79.4
94.9 94.1 97.9
93.3
48.7
43.1
49.3 52.0
0.0
20.0
40.0
60.0
80.0
100.0
120.0
2007 2008 2009 2010 2011 2012 2013 2014 2015 2016 2017 2018
US$
pe
r b
arre
l an
d p
er
mm
btu
Oil and Gas Prices 2007 – 2018
HENRY HUB GAS PRICE ($ PER MMBTU) WTI OIL PRICE ($ PER BARREL)
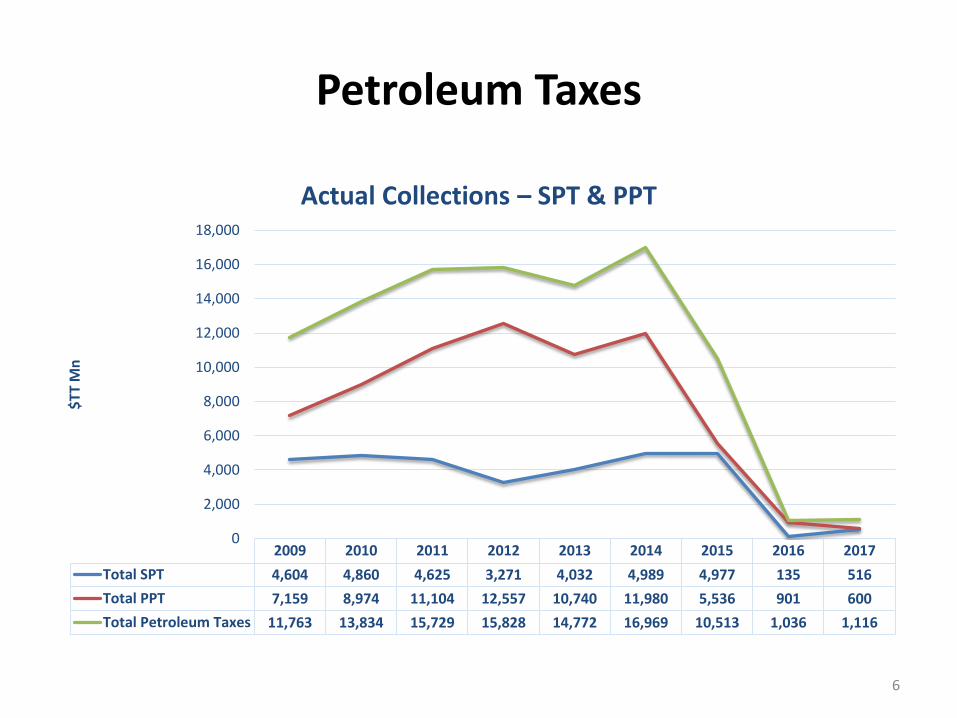
Petroleum Taxes
6
2009 2010 2011 2012 2013 2014 2015 2016 2017
Total SPT 4,604 4,860 4,625 3,271 4,032 4,989 4,977 135 516
Total PPT 7,159 8,974 11,104 12,557 10,740 11,980 5,536 901 600
Total Petroleum Taxes 11,763 13,834 15,729 15,828 14,772 16,969 10,513 1,036 1,116
0
2,000
4,000
6,000
8,000
10,000
12,000
14,000
16,000
18,000
$T
T M
n
Actual Collections – SPT & PPT

Royalty Payments
2009 2010 2011 2012 2013 2014 2015 2016 2017
Royalty Payments 822 1,820 2,423 2,449 2,380 2,405 1,101 520 939
0
500
1,000
1,500
2,000
2,500
3,000
(TT$
Mn
)

Petroleum Taxes & Royalties
8
2009 2010 2011 2012 2013 2014 2015 2016 2017
Total SPT 4,604 4,860 4,625 3,271 4,032 4,989 4,977 135 516
Total PPT 7,159 8,974 11,104 12,557 10,740 11,980 5,536 901 600
Total Petroleum Taxes 11,763 13,834 15,729 15,828 14,772 16,969 10,513 1,036 1,116
Royalties 822 1,820 2,423 2,449 2,380 2,405 1,101 520 939
0
2,000
4,000
6,000
8,000
10,000
12,000
14,000
16,000
18,000
$T
T M
n
Actual Collection – SPT, PPT & Royalties

The Downstream Sub-Sector
2009 2010 2011 2012 2013 2014 2015 2016 2017
Ammonia 842 1,035 2,227 2,391 1,945 1,309 1,635 857 691
Methanol 160 106 279 703 775 742 635 590 424
-
0
0
0
0
0
0
TT
$M
n
Petrochemicals Revenue: Ammonia and Methanol
Ammonia Methanol
9

(10.0)
(5.0)
0.0
5.0
10.0
15.0
20.0
2007 2008 2009 2010 2011 2012 2013 2014 2015 2016 2017
Per
cen
t (%
) GDP, Inflation and Unemployment
2007 - 2017
GDP REAL GROWTH RATE INFLATION (Y-O-Y) UNEMPLOYMENT RATE
10
(10.0)
(5.0)
0.0
5.0
10.0
15.0
20.0
2007 2008 2009 2010 2011 2012 2013 2014 2015 2016 2017 2018
Per
cen
t (%
)
Economic Growth, Inflation and Unemployment 2007 - 2018
GDP REAL GROWTH RATE INFLATION (Y-O-Y) UNEMPLOYMENT RATE

-20000
-15000
-10000
-5000
0
5000
10000
15000
2007 2008 2009 2010 2011 2012 2013 2014 2015 2016 2017
Overall and Current Account Balance Budget ($ Mn.) 2007 - 2017
Current Account Balance Overall Balance, surplus/(decifit)
11
2007 2008 2009 2010 2011 2012 2013 2014 2015 2016 2017 2018
Current Account Balance 5,047 12,569 1,765 3,288 2,550 3,447 2,780 3,577 -51 -7,387 -9,674 -6,057
Overall Balance, surplus/(decifit) 268 2,974 -6,686 -2,839 -3,992 -3,529 -5,180 -3,542 -2,710 -7,972 -14,821 -4,760
-20,000
-15,000
-10,000
-5,000
0
5,000
10,000
15,000
TT$
MN
Fiscal Account
Current Account and Overall Balance ($Mn.)
2007 - 2018

1,049.6 905
1,178
1,499
4,456.9
7,002.8
4,586.0
915.1 801.7 950.0
0.0
1,000.0
2,000.0
3,000.0
4,000.0
5,000.0
6,000.0
7,000.0
8,000.0
2008 2009 2010 2011 2012 2013 2014 2015 2016 2017 2018
Subsidy on Petroleum Products ($Mn.)
2007 – 2018
12

13
663.3 406.2 1,264.1 960.1 998.8 1,347.3
1,978.2
5,895.7
10,588.4
7,688.2
4,622.5
7,920.0
0.0
2,000.0
4,000.0
6,000.0
8,000.0
10,000.0
12,000.0
2007 2008 2009 2010 2011 2012 2013 2014 2015 2016 2017 2018
Profits from State Enterprises and Capital Revenue ($Mn)

Net Public Sector Debt (% of GDP)
2007-2017
14
28.4
24
37.5
32.1 29.7
38.9 38.1 40.3
49.2
58.8
62.5
0
10
20
30
40
50
60
70
2007 2008 2009 2010 2011 2012 2013 2014 2015 2016 2017
Net Public Sector Debt

International Reserves/Import Cover
15
Source: Central Bank of Trinidad and Tobago.
0
2
4
6
8
10
12
14
16
0
2
4
6
8
10
12
14
Dec-07 Dec-08 Dec-09 Dec-10 Dec-11 Dec-12 Dec-13 Dec-14 Dec-15 Dec-16 Dec-17 Feb-18 Mar-18
MO
NTH
S
US$
BN
Gross Official Reserves Import Cover
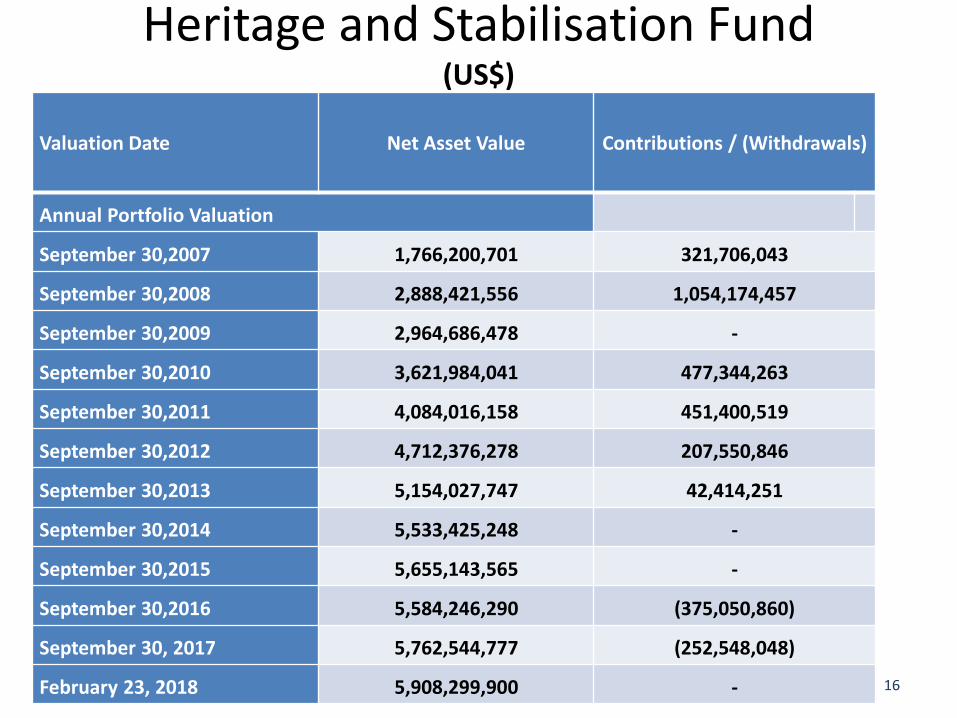
Heritage and Stabilisation Fund (US$)
Valuation Date Net Asset Value Contributions / (Withdrawals)
Annual Portfolio Valuation
September 30,2007 1,766,200,701 321,706,043
September 30,2008 2,888,421,556 1,054,174,457
September 30,2009 2,964,686,478 -
September 30,2010 3,621,984,041 477,344,263
September 30,2011 4,084,016,158 451,400,519
September 30,2012 4,712,376,278 207,550,846
September 30,2013 5,154,027,747 42,414,251
September 30,2014 5,533,425,248 -
September 30,2015 5,655,143,565 -
September 30,2016 5,584,246,290 (375,050,860)
September 30, 2017 5,762,544,777 (252,548,048)
February 23, 2018 5,908,299,900 - 16

THANK YOU finance.gov.tt
17