spotlight on africa's transfer pricing landscape - pwc
TRANSCRIPT

2007 NAIP Survey: Summary Report
USDA Farm Service Agency
Aerial Photography Field Office Salt Lake City, UT 84119
June 2008

Table of Contents Page No. Section 1 – Executive Summary 3 Section 2 – Overview 4-5 Section 3 – Summary of Survey Results 6-19 Section 4 – Comparing 2007 with 2005 and 2006 Survey Results 20-24 Section 5 – Recommendations for NAIP Based on Survey Results 25 Section 6 – Recommendations for Changes to Survey for 2008 26 Appendix A – Alternative Uses of NAIP 27 Appendix B – Recommendations to Improve NAIP 28 Maps, Charts, and Tables Map 1 – Completed Surveys 5 Map 2 – Compliance Usage of NAIP Imagery 7 Map 3 – Overall Quality of Imagery for Acreage Compliance Work 9 Map 4 – Month Imagery was Received by Counties 10 Map 5 – Overall Satisfaction of Imagery Acquisition and Delivery 14 Map 6 – Typical Growing Season 16 Chart 1 – Question 4 6 Chart 2 – Question 7 7 Chart 3 – Question 8 8 Chart 4 – Question 9 8 Chart 5 – Question 10 9 Chart 6 – Question 11 10 Chart 7 – Question 12 11 Chart 8 – Question 13 12 Chart 9 – Question 14 12 Chart 10 – Question 15 13 Chart 11 – Question 16 13 Chart 12 – Question 17 14 Chart 13 – Question 18 15 Chart 14 – Question 19 15 Chart 15 – Question 22 16 Chart 16 – Question 23 17 Chart 17 – Question 24 17 Chart 18 – Question 25 18 Chart 19 – Question 26 18 Chart 20 – Question 27 19 Chart 21 – Question 28 19 Chart 22 – Comparison of Question 8 Over 3 Years 21 Chart 23 – Comparison of Question 9 Over 3 Years 21 Chart 24 – Comparison of Question 17 Over 3 Years 22 Chart 25 – Comparison of Question 24 Over 2 Years 23 Chart 26 – Comparison of Question 25 Over 2 Years 23 Chart 27 – Comparison of Question 26 Over 2 Years 24 Chart 28 – Comparison of Question 27 Over 2 Years 24 Table 1 – Survey Results Comparison 20
2

Section 1 – Executive Summary The 2007 National Agriculture Imagery Program (NAIP) Survey was initiated as a means to assess NAIP based on feedback from the Farm Service Agency’s (FSA) primary customers, the FSA State and County Offices. Per Notice AP-7, the 2007 NAIP Survey was distributed through a web based medium to each FSA County Service Center via the State Geographic Information System (GIS) Specialists/Coordinators. Each State and County Office receiving 2007 NAIP imagery was directed to complete the survey. The survey: • establishes a standardized feedback mechanism for NAIP acquisition and delivery • allows for adjustment of program strategy as necessary based on survey analysis • will allow for analysis of previous, current, and future year feedback to ensure continued program improvement and development. The following is a brief summary of survey responses: Total Survey Responses = 1049
• 86% of respondents were either very satisfied or satisfied with 2007 NAIP overall acquisition and delivery.
• 83% of respondents were either very satisfied or satisfied with the timeliness of receipt of the imagery (to use for acreage compliance work).
• 88% of respondents were either very satisfied or satisfied with the dates the imagery was flown (based on what is visible on the imagery) for acreage compliance work.
• 87% of respondents were either very satisfied or satisfied with the quality of the imagery (for compliance work).
• Approximately 32% of offices receive 6-20 customer requests for NAIP per month; 18% of offices receive >20 requests per month. Requests for NAIP hard or soft copy increased in each category for 2007.
The following general conclusions may be drawn:
1. There was a marked improvement in the overall satisfaction of 2007 NAIP; however, there is some room for program improvement.
2. As was the case last year, improvement on the speed of delivery to the FSA State and County Offices from the time of acquisition may yield the greatest overall improvement to the program.
3. Users are becoming slightly more familiar with the Web Mapping Services from the Geospatial Data Warehouse and the data that is available for download on the Geospatial Data Gateway. There could be significant improvements in this area, such as training in the use of web services.
4. According to the responses, customer satisfaction with the quality of the imagery showed some improvements. This might be due to the new quantitative standards for tracking image quality that were implemented last year into the 2007 NAIP contract and inspection process, but would require additional research to verify.
3

Section 2 - Overview In 2007, FSA completed the 5th year of acquisition under NAIP. The USDA-FSA Aerial Photography Field Office (APFO) is responsible for the acquisition, quality assessment, data delivery, and archiving of the NAIP imagery. FSA continues to adjust and modify NAIP processes to keep pace with technological advances in geospatial data acquisition and delivery as well as to meet the needs of FSA Service Centers and State Offices, their primary NAIP customers. Feedback from NAIP users is vital for program improvement. To facilitate this, APFO prepared a survey for FSA State and County Office response. This is the third year for the NAIP Survey, which differs only slightly from the 2006 NAIP Survey. The 2005 NAIP Survey was administered using email and spreadsheets, whereas the 2006 and 2007 NAIP surveys were completed utilizing a web survey engine. This helped alleviate human error in survey scoring and analysis. Per AP-7, FSA State Offices were to take one survey per State Office, and County Service Centers were to take one survey per county administered. This instruction was not always adhered to; however, based on analysis of the data, multiple responses from the same County did not skew the survey results significantly (approximately 1/2-1% in any given rating category). Surveys were taken over a 31 day period, between January 30 and February 29, 2008. This timeframe was similar to the 2006 survey, except that in 2007, only one month was scheduled for the14 states receiving NAIP because the survey engine’s limit was no longer restricted to 1000 survey returns per month. The format of the survey varied to include the following types of questions: multiple choice, open ended, select all that apply, and numerically rated. Upon close of the survey, responses were downloaded from the survey website in a variety of formats, including a survey summary, raw answers, and parsed answers as needed. While analysis of survey returns could be performed endlessly, it is understood that the results herein really only scratch the surface of potential analysis. APFO hopes to keep the current survey format stable for future years, streamlining questions and tightening user inputs as necessary. This will allow for a quality comparison of past and future survey results, enhancing feedback for program improvement.
4

Map 1 – Completed Surveys
Map 1 depicts the 2007 NAIP Surveys that were completed via the web survey engine as of the closing date of the survey. Identification of counties that completed the survey was based on answers to question #5: “What is your 5-digit state and county FIPS code?”. Answers to this question were joined to the CONUS counties database via the STATECTY field and all non-null values were mapped. There were six states that had one response for every county (100% completion): Illinois, Maine, Maryland, Mississippi, Nebraska, and West Virginia. Most of the other states were very close to 100% completion.
5

Section 3 – Summary of Survey Results
The following section is a statistical breakdown of the survey on a question by question basis. At the end of this section there are a few examples of additional analysis, performed by comparing responses to multiple questions. Questions with numerically rated answers had a range of 1-5, where 1 = Very Unsatisfied/Unusable, 2 = Unsatisfied/Poor, 3 = Neither/Fair(neutral), 4 = Satisfied/Good, 5 = Very Satisfied/Excellent. NA/Unsure answers were also accepted. Question 1. Name: Responses varied. Question 2. Position: Responses varied. Question 3. Today's Date: Responses ranged between Jan 30th and Feb 29th, 2008. Question 4.
Where do you work?
99%
1%
County Service Center
State Office
Chart 1 – Question 4
Question 5. What is your 5-digit State and County FIPS Code? Responses varied. Question 6. What is your 2-digit State FIPS Code? Responses varied. Responses to questions 5 and 6 had several inconsistencies, where the state code did not match the county FIPS code. In each case, the state GIS specialist or coordinator was contacted to help with deciphering mistakes, and if there was sufficient information to make a correction, the information was left in the survey. If no conclusion could be made, the response was thrown out.
6

Question 7.
Did you use 2007 NAIP imagery for compliance purposes?
58%27%
15%Yes
No
Did not receive imagery intime to use it
Chart 2 – Question 7
Map 2 – Compliance Usage of NAIP Imagery
Map 2 graphically depicts the 2007 NAIP Survey answers to the question: “Did you use 2007 NAIP imagery for compliance purposes?” This graphic shows that most of the counties in several of the Midwest states did use NAIP imagery for compliance purposes, while the majority of counties in the other states did not use it or it was not available in time to use it. It should be noted that due to changes in policy regarding compliance
7

checks, using imagery was not required in 2007, according to Notice CP-617. However, the policy does not say that imagery could not be used where applicable. In fact, it states…”accuracy of the information on all FSA-578’s associated with the producer will be determined by measuring the acreage (unless imagery is available) on all farms”, which infers that imagery is still valid for compliance activities. Questions 8, 9, and 10 were only available to answer if the individual taking the survey selected “yes” to Question 7, “Did you use 2007 NAIP imagery for compliance purposes?” If they selected “no” or “did not receive imagery in time to use it”, skip logic was used in the survey engine to jump to Question 11. Question 8. 2007 Mean Score = 3.91, 2006 Mean Score = 3.24
How satisfied are you with the delivery time of the 2007 NAIP imagery to be useful for acreage compliance work?
16%
67%
7%
7%
1%
2% Very SatisfiedSatisfiedNeitherUnsatisfiedVery UnsatisfiedN/A or Not Sure
Chart 3 – Question 8
Question 9. 2007 Mean Score = 4.02, 2006 Mean Score = 3.53
How satisfied are you with the dates the imagery was flown for acreage compliance work, based on what is visible on the
imagery?18%
70%
5%
4%
1%
2% Very SatisfiedSatisfiedNeitherUnsatisfiedVery UnsatisfiedN/A or Not Sure
Chart 4 – Question 9
8

Question 10. 2007 Mean Score = 4.00, 2006 Mean Score = 3.69
How satisfied are you with the overall quality of the imagery for acreage compliance work?
21%
66%6%
5%
1%
1%Very SatisfiedSatisfiedNeitherUnsatisfiedVery UnsatisfiedN/A or Not Sure
Chart 5 – Question 10
Map 3 – Overall Quality of Imagery for Acreage Compliance Work
9

Question 11.
On what date did you receive your 2007 NAIP imagery?
08/01/07
09/01/07 01/10/0810/01/07
11/01/07
0
5
10
15
20
25
6/1/07
6/15/0
7
6/29/0
7
7/13/0
7
7/27/0
7
8/10/0
7
8/24/0
79/7
/07
9/21/0
7
10/5/
07
10/19
/07
11/2/
07
11/16
/07
11/30
/07
12/14
/07
12/28
/07
1/11/0
8
1/25/0
82/8
/08
2/22/0
8
Num
ber o
f res
pons
es
Chart 6 – Question 11
Map 4 – Month Imagery was Received by Counites
10

Question 12. If 2007 NAIP imagery for your entire area could have been collected on a single day, what day would have been ideal? The first or middle day of the month was selected by respondents more often than other dates, but the chart does depict, in general, July-August as the crucial time frame for acquisition.
If 2007 NAIP imagery for your entire area could have been collected on a single day, what day would have been ideal?
09/01/07
08/15/07
08/01/07
07/01/07
07/15/07
0
10
20
30
40
50
60
70
80
90
4/1/20
07
4/15/2
007
4/29/2
007
5/13/2
007
5/27/2
007
6/10/2
007
6/24/2
007
7/8/20
07
7/22/2
007
8/5/20
07
8/19/2
007
9/2/20
07
9/16/2
007
9/30/2
007
10/14
/2007
10/28
/2007
Num
ber o
f Res
pons
es
Chart 7 – Question 12
11

Question 13. Given that a single date is not possible, what flying season do you feel would have been acceptable to meet your compliance needs? The chart below depicts the answers to this question graphically by identifying the ideal flying season start and end date responses. Spikes may be attributed to the selection of first, last, and middle days of the month more often than other dates.
What flying season would have been acceptable to meet your farm program needs?
0
10
20
30
40
50
60
70
80
90
4/1/20
07
5/1/20
07
6/1/20
07
7/1/20
07
8/1/20
07
9/1/20
07
10/1/
2007
11/1/
2007
12/1/
2007
Num
ber o
f res
pons
es
Start DateEnd Date
Chart 8 – Question 13
Question 14. 2007 Mean Score = 3.90, 2006 Mean Score = 3.60
Rate the image quality in terms of darkness / lightness:
16%
63%17%
4%
0%
0%ExcellentGoodFair (neutral)PoorUnusableN/A or Not Sure
Chart 9 – Question 14
12

Question 15. 2007 Mean Score = 3.87, 2006 Mean Score = 3.56
Rate the image quality in terms of contrast:
16%
61%19%
4%
0%
0%
ExcellentGoodFair (neutral)PoorUnusableN/A or Not Sure
Chart 10 – Question 15
Question 16. 2007 Mean Score = 3.86, 2006 Mean Score = 3.58
Rate the image quality in terms of color:
16%
60%19%
5%
0%
0%ExcellentGoodFair (neutral)PoorUnusableN/A or Not Sure
Chart 11 – Question 16
13

Question 17. 2007 Mean Score = 3.97, 2006 Mean Score = 3.41
Overall, how satisfied are you with with 2007 NAIP acquisition and delivery in your County / State?
15%
71%
9%
4%
1%
0%Very SatisfiedSatisfiedNeitherUnsatisfiedVery UnsatisfiedN/A or Not Sure
Chart 12 – Question 17
Map5 – Overall Satisfaction of Imagery Acquisition and Delivery
14
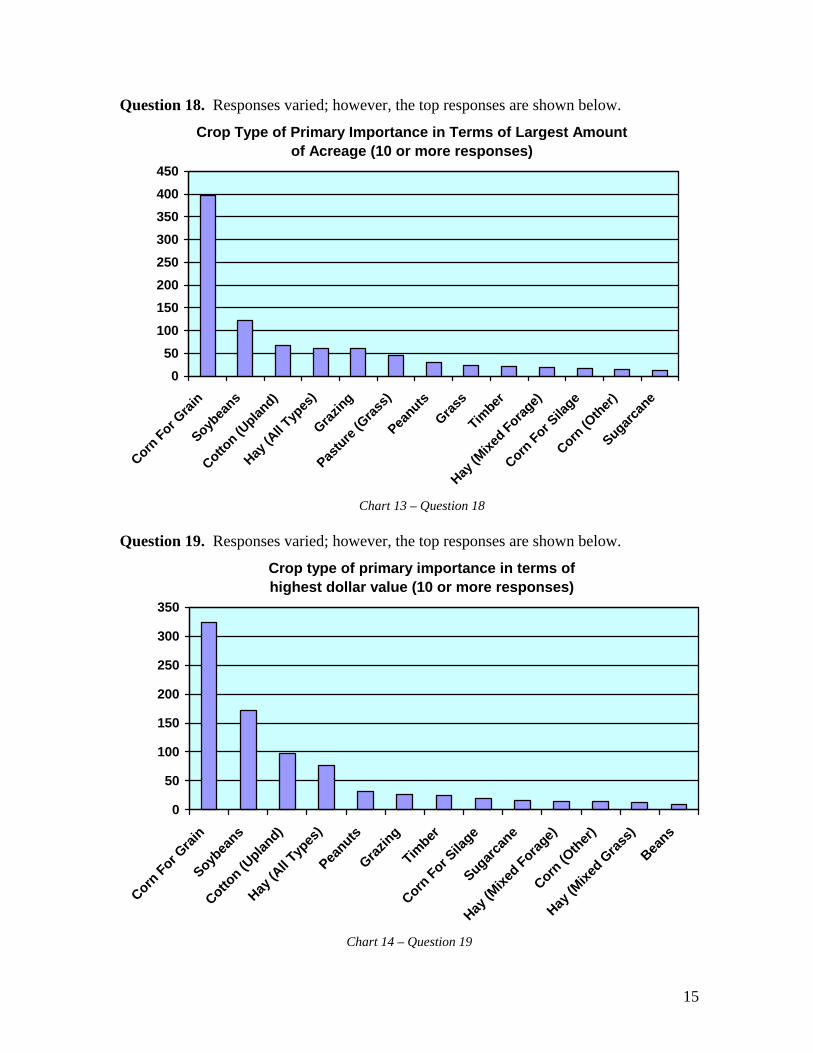
Question 18. Responses varied; however, the top responses are shown below.
Crop Type of Primary Importance in Terms of Largest Amount of Acreage (10 or more responses)
050
100150200250300350400450
Corn For G
rain
Soybea
ns
Cotton (U
pland)
Hay (A
ll Typ
es)
Grazing
Pasture
(Gras
s)
Peanuts
Grass
Timber
Hay (M
ixed Forag
e)
Corn For S
ilage
Corn (O
ther)
Sugarcan
e
Chart 13 – Question 18
Question 19. Responses varied; however, the top responses are shown below.
Crop type of primary importance in terms of highest dollar value (10 or more responses)
0
50
100
150
200
250
300
350
Corn For G
rain
Soybea
ns
Cotton (U
pland)
Hay (A
ll Typ
es)
Peanuts
Grazing
Timber
Corn For S
ilage
Sugarcan
e
Hay (M
ixed Forag
e)
Corn (O
ther)
Hay (M
ixed G
rass)
Beans
Chart 14 – Question 19
15

Questions 20 & 21. The crop type of secondary importance in your area in terms of acreage and in terms of dollar value is: Responses varied for each question. Question 22.
Was 2007 a typical growing season?
64%
21%
15%Crops Were Harvested atAbout the Normal Time
Crops Were Harvested EarlierThan Normal
Crops Were Harvested LaterThan Normal
Chart 15 – Question 22
Map 6 – Typical Growing Season
16

Question 23. Mark the following activities that the 2007 NAIP imagery is useful for. This question allowed for a select all that apply response, including a category for other, allowing for open ended responses. A summary of open ended responses to this question can be found in Appendix A.
Useful Activities for 2007 NAIP Imagery
0 200 400 600 800 1000
Disaster preparedness or response
General planning activities
Government coordination and communicationswith other Federal, State, or local agencies
Historical purposes (prior year crop disastermeasurements, change detection, etc.)
Measurement services (area/distance)
Other (please specify)
Chart 16 – Question 23
Question 24.
A Web Mapping Service using Geospatial Data Warehouse data is available to you by adding the Image Web Service to your
ArcMap session. Do you use this service?
27%
2%64%
7%
Yes
No
I would, but imagery formy area is not loadedI am not familiar with thisservice
Chart 17 – Question 24
17

Question 25.
If you do use the WMS associated with the GDW, how useful is it?
33%14%
8%
45%
Very UsefulFairly UsefulNot Very UsefulTotally Useless
Chart 18 – Question 25
Question 26.
Do you use the USDA Resource Data Gateway?
14%
21%
65%
Yes
No
I am not familiar with theResource Data Gateway
Chart 19 – Question 26
18

Question 27.
If you do use the USDA Resource Data Gateway, how useful is it?
52%
36%
2%10%
Very UsefulFairly UsefulNot Very UsefulTotally Useless
Chart 20 – Question 27
Question 28.
How many requests for copies of the NAIP imagery, either hard or soft copy, does your office receive?
7%
12%
18%
29%
21%
13%
>20 Per Month16-20 Per Month11-15 Per Month6-10 Per Month1-5 Per MonthNo requests
Chart 21 – Question 28
Question 29. Do you have any recommendations to improve the NAIP program? This question allowed for open ended responses. A summary of these responses can be found in Appendix B.
19
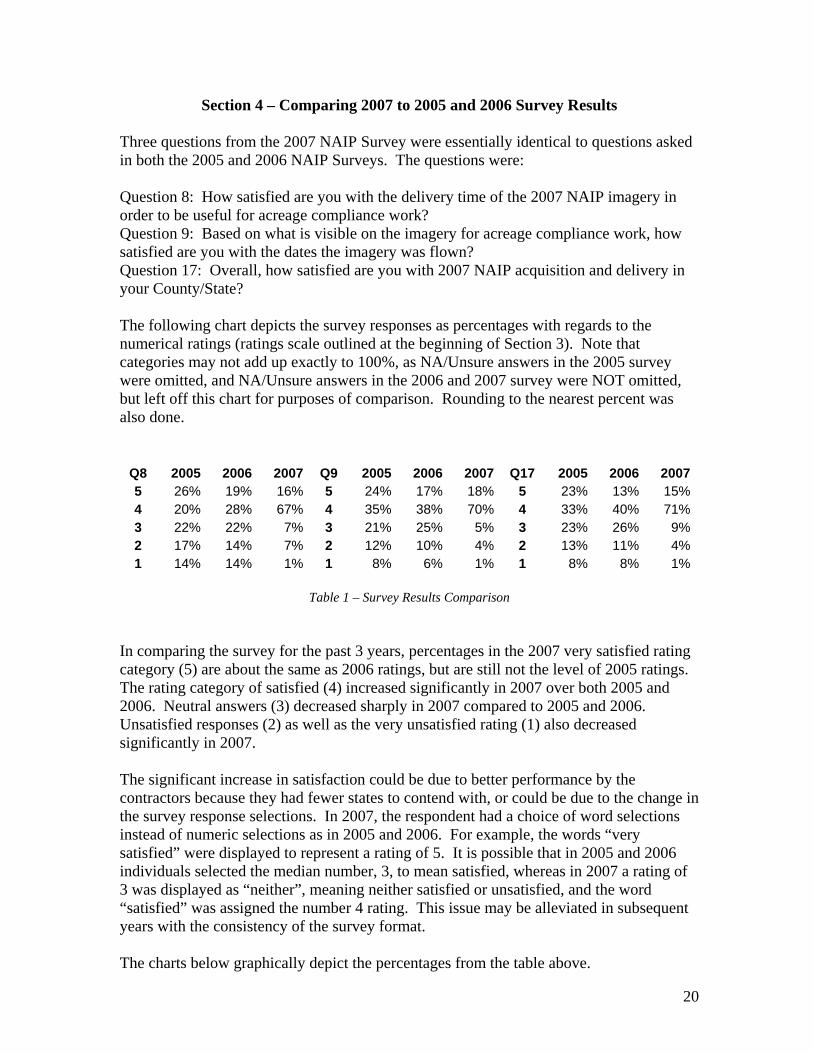
Section 4 – Comparing 2007 to 2005 and 2006 Survey Results Three questions from the 2007 NAIP Survey were essentially identical to questions asked in both the 2005 and 2006 NAIP Surveys. The questions were: Question 8: How satisfied are you with the delivery time of the 2007 NAIP imagery in order to be useful for acreage compliance work? Question 9: Based on what is visible on the imagery for acreage compliance work, how satisfied are you with the dates the imagery was flown? Question 17: Overall, how satisfied are you with 2007 NAIP acquisition and delivery in your County/State? The following chart depicts the survey responses as percentages with regards to the numerical ratings (ratings scale outlined at the beginning of Section 3). Note that categories may not add up exactly to 100%, as NA/Unsure answers in the 2005 survey were omitted, and NA/Unsure answers in the 2006 and 2007 survey were NOT omitted, but left off this chart for purposes of comparison. Rounding to the nearest percent was also done.
Q8 2005 2006 2007 Q9 2005 2006 2007 Q17 2005 2006 20075 26% 19% 16% 5 24% 17% 18% 5 23% 13% 15%4 20% 28% 67% 4 35% 38% 70% 4 33% 40% 71%3 22% 22% 7% 3 21% 25% 5% 3 23% 26% 9%2 17% 14% 7% 2 12% 10% 4% 2 13% 11% 4%1 14% 14% 1% 1 8% 6% 1% 1 8% 8% 1%
Table 1 – Survey Results Comparison
In comparing the survey for the past 3 years, percentages in the 2007 very satisfied rating category (5) are about the same as 2006 ratings, but are still not the level of 2005 ratings. The rating category of satisfied (4) increased significantly in 2007 over both 2005 and 2006. Neutral answers (3) decreased sharply in 2007 compared to 2005 and 2006. Unsatisfied responses (2) as well as the very unsatisfied rating (1) also decreased significantly in 2007. The significant increase in satisfaction could be due to better performance by the contractors because they had fewer states to contend with, or could be due to the change in the survey response selections. In 2007, the respondent had a choice of word selections instead of numeric selections as in 2005 and 2006. For example, the words “very satisfied” were displayed to represent a rating of 5. It is possible that in 2005 and 2006 individuals selected the median number, 3, to mean satisfied, whereas in 2007 a rating of 3 was displayed as “neither”, meaning neither satisfied or unsatisfied, and the word “satisfied” was assigned the number 4 rating. This issue may be alleviated in subsequent years with the consistency of the survey format. The charts below graphically depict the percentages from the table above.
20

Question 8 Comparison:
Satisfaction of Delivery Time for Acreage Compliance Work (Q8)
0%
10%
20%
30%
40%
50%
60%
70%
80%
1 2 3 4 5
Satisfaction Rating
2005
20062007
Chart 22 – Comparison of Question 8 Over 3 Years
Question 9 Comparison:
Satisfaction of Dates Flown for Acreage Compliance Work (Q9)
0%
10%
20%
30%
40%
50%
60%
70%
80%
1 2 3 4 5
Satisfaction Rating
200520062007
Chart 23 – Comparison of Question 9Over 3 Years
21

Question 17 Comparison:
Satisfaction of Overall Acquisition and Delivery (Q17)
0%
10%
20%
30%
40%
50%
60%
70%
80%
1 2 3 4 5
Satisfaction Rating
200520062007
Chart 24 – Comparison of Question 17 Over 3 Years
Comparing 2007 to 2006 Survey Results In 2007, respondents were asked if they used the Geospatial Data Gateway or the Image Web Service available from the Geospatial Data Warehouse, and if so, how useful were these services. The same four questions were included in the 2006 survey. The following charts show the trends in the use of the Web Mapping Service and the Geospatial Data Gateway. There was a slight increase in both “yes” and “no” answers to the use of the Web Mapping Service and a decrease in the unfamiliarity of the service, which suggests that more people are at least aware of it, if not using it. The majority of those that did use it found it “fairly useful”. There were similar results in the use of the Geospatial Data Gateway, except the majority of those that used it found it “very useful”. This is encouraging; however, a great deal of improvement could be made through some type of training to increase awareness.
22

Question 24 Comparison:
Do you use the Web Mapping Service from the Geospatial Data Warehouse that is available by adding an ArcIMS Service to ArcMap?
21.3%
1.1%
73.1%
7.0%
26.6%
64.3%
4.6%2.1%
0.0%
10.0%
20.0%
30.0%
40.0%
50.0%
60.0%
70.0%
80.0%
Yes No I would but imagery formy area is not loaded
I am not familiar with thisservice
2006
2007
Chart 25 – Comparison of Question 24 Over 2 Years
Question 25 Comparison:
How useful is the Web Mapping Service associated with the Geospatial Data Warehouse?
33.2% 33.6%
20.5%
33.0%
45.0%
13.8%
8.3%
12.7%
0.0%
10.0%
20.0%
30.0%
40.0%
50.0%
Very Useful Fairly Useful Not Very Useful Totally Useless
2006
2007
Chart 26 – Comparison of Question 25 Over 2 Years
23

Question 26 Comparison:
Do you use the USDA Resource Data Gateway?
12.8%16.8%
70.3%
14.2%
20.6%
65.2%
0.0%
10.0%
20.0%
30.0%
40.0%
50.0%
60.0%
70.0%
80.0%
Yes No I am not familiar with theResource Data Gateway
2006
2007
Chart 27 – Comparison of question 26 over 2 years
Question 27 Comparison:
How useful is the Resource Data Gateway?
40.8%38.6%
12.4%
8.3%
51.6%
35.9%
9.5%
2.0%0.0%
10.0%
20.0%
30.0%
40.0%
50.0%
60.0%
Very Useful Fairly Useful Not Very Useful Totally Useless
2006
2007
Chart 28 – Comparison of question 27 over 2 years
24

Section 5 – Recommendations for NAIP Based on Survey Results
The purpose of the NAIP survey is to help assess and improve the program from year to year. Many conclusions may be drawn from the results of the 2007 NAIP Survey. As discussed in last year’s survey results, improvements to NAIP could be calculated in a purely statistical manner, where customer satisfaction is assessed each year, with a goal of 100% satisfaction. However, due to factors out of our control, such as weather, early and late crop harvest dates, fires, crop types, processing and equipment issues, the technology curve, and so forth, 100% satisfaction is by no means a realistic goal for NAIP. A more realistic measurement of success is in looking at the trends from year to year. Program improvement should be based on an increase in satisfaction of the primary customer (FSA State and County Offices). NAIP is one method by which FSA compliance activities may take place, and is currently accepted as a means to update a State’s official FSA ortho base for GIS. This year showed a marked improvement in the overall satisfaction of imagery received by the County and State Offices. This could be due to the fact that fewer states were flown in 2007 than in previous years, which might have an influence on the ability of the contractors to complete flying on time. Specifically, suggestions to improve NAIP based on survey results include:
1. Based on a recommendation from the 2006 survey, notify the states as early as possible regarding counties or areas that could not be flown. This is extremely important in order to complete compliance activities in a timely manner; however, this is also based on compliance activity policy. In 2007, a pilot Web Mapping Service, which identifies what areas have been acquired in “real time”, was developed. This service should be continued for the 2008 NAIP flying season and available to all FSA State GIS Specialists/Coordinators.
2. Again this year, based on comments from respondents, improving the speed of delivery from the time of acquisition to the FSA State and County Offices could yield significant improvement to the program. Tracking data from the vendor to the FSA County Office would help APFO assess all aspects of delivery time.
3. Compare the results of the survey from a single state that has had several years of imagery flown at the same resolution, such as Tennessee. NAIP 2008 will be the third year of 1 meter imagery for that state and the results from three surveys could be compared to see if the trend in improvement parallels the results as a whole.
4. The results of the survey showed a slight increase in the use of the Geospatial Data Gateway as well as the Web Mapping Service from the Geospatial Data Warehouse, and a slight decrease in the unfamiliarity with these services. However, there could be improvement in awareness by providing training to the State GIS Specialists/Coordinators that could be passed on to the County Service Centers.
25

Section 6 – Recommendations for Changes to Survey for 2008 The subscription service for the web survey engine was renewed last year, and most likely will be renewed each year as long as APFO continues to conduct the survey. A 2008 NAIP Survey can be issued some time near the beginning of 2009, with an approved Notice from FSA. Using the same survey medium would allow for comparative analysis of multi-year survey data, as the method and many of the questions would remain consistent. Several minor changes to the survey, based on errors or oversights discovered in the 2007 NAIP Survey, are outlined below:
1. The AP-7 Notice requested that only one survey be submitted per County; however, this rule was violated frequently because one County Office may administer several counties. Therefore, setting the survey to allow only one response per IP address is not a viable option. Duplicate rows were deleted using the latest date taking the survey, in most cases. Another method that may be used to acquire only one survey for each county might be to make the “respondent name” a required field. However, doing so has drawbacks; reduction in candidness in responding to survey questions could be one such negative effect.
2. To alleviate some inconsistent answers to questions 5 and 6, regarding State and County FIPS codes, a listing of County FIPS codes for selection by respondents could be generated from the input of the State FIPS code, also selected from a drop down list.
3. Additional questions about enhancements to NAIP, such as absolute horizontal accuracy, seamline polygons indexes, various compression formats, and 4-band imagery could also be included.
4. As suggested in the 2006 survey, consider opening the NAIP Survey to other Federal (or USDA), State, and Local Government users, as well as private users, such as farmers, real estate agents, assessors, etc. This would help to better quantify NAIP’s true Return on Investment (ROI) for the Government.
5. Consider a separate survey or separate questions in the survey for those states that did not receive imagery to see how those states are affected.
6. Modify question 2 to include a drop down list of the common County and State positions to standardize the responses, with an opportunity for “other” responses.
7. Consider asking a question to rate the importance of the quality of imagery versus the timeliness of acquisition.
8. Consider asking what type of imagery, such as natural color, CIR, or both, would be best for most farm program purposes.
26

Appendix A – Alternative Uses of NAIP
Question 23 of the 2007 NAIP Survey asked the respondents to list the activities for which FSA County and State Offices use NAIP. This question was a ‘select all that apply’ type of question, and was accompanied by the additional option for an open ended response. Of the ‘select all that apply’ categories, the following is a list of the standard responses (shown in Section 3) with percentages of the total number of customers responding. These percentages were almost identical to the responses from 2006.
• 92% of respondents find NAIP useful for measurement services • 69% of respondents find NAIP useful for historical purposes • 56% of respondents find NAIP useful for general planning activities • 49% of respondents find NAIP useful for disaster preparation • 42% of respondents find NAIP useful for government coordination
From the open ended response portion of this question, many additional FSA uses of NAIP were identified by the state and county users. In general, alternative uses included but were by no means limited to:
• Acreage reporting and map changes • Support federal farm programs • Conservation practices • Education • Irrigation determinations • Land classification • General monitoring • Agricultural certification • Program eligibility • Real estate/land sales • Construction and development • General mapping activities • Providing customers maps • Environmental issues • Drought determinations • Flooded area determinations • Public health and safety • Water rights • Rangeland assessment • Forest management plans • Appeals • Activities involving Conservation Reserve Program (CRP) • Activities involving Common Land Unit (CLU)
27

Appendix B – Recommendations to Improve NAIP Question 29 of the 2007 NAIP Survey asked what recommendations customers may have to improve the NAIP program? Open ended responses varied greatly, but general trends noted the following:
• Deliver the imagery in a more timely manner • Fly the imagery in a more timely manner • Fly more often • Fly twice a year • Fly complete county and state coverage every year • Improve quality • Increase resolution • Overcome infrastructure, hardware, and software issues • Increase training
Some responses had little to directly do with NAIP, but speak to the usability of the end product as related to the environment in which it is used.
28