sports nutrition for figure skaters rfts nutrition presentation.pdf · sports nutrition for figure...
TRANSCRIPT
1
SPORTS NUTRITION FOR FIGURE SKATERS
Dan Benardot, PhD, DHC, RD, LD, FACSMLaboratory for Elite Athlete Performance
Georgia State University
2008 U.S. Junior Figure Skating Championships
November 29-December 1, 2007, Salt Lake City, Utah
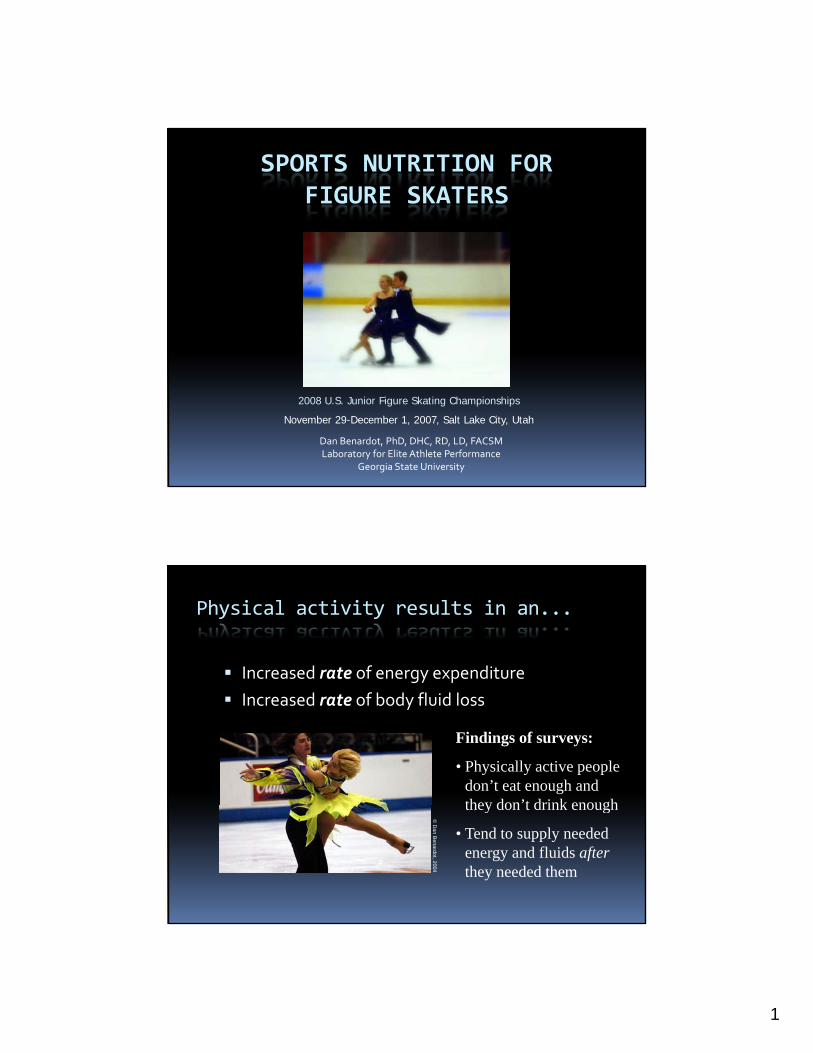
Physical activity results in an...
Increased rate of energy expenditureIncreased rate of body fluid loss
Findings of surveys:
• Physically active people don’t eat enough and they don’t drink enoughthey don t drink enough
• Tend to supply needed energy and fluids afterthey needed them
© D
an Benardot, 2004

2
Ultimate Question: How can a figure skater stay on the right side of the fence?
Think about this…
If I were to ask you which of the following has a ‘good’ connotation and which has a ‘bad’ connotation…
Carbohydrate (good or not so good?)Protein (good or not so good?)Protein (good or not so good?)Fat (good or not so good?)

3
Effect of Diet on Performance
102 Minutes
35 Mi t
65 Minutes
102 Minutes
21% carbohydrate diet after 7 wks. training
65% carbohydrate diet after 7 wks. training
© D
a
0 20 40 60 80 100 120Minutes of Exercise to Exhaustion
35 MinutesBoth groups before training
an Benardot, 2004
Adapted from Costil, et al 1995
Exercise Intensity and Fuel Usage
Fuel Used by Muscle (Percent of Carbohydrate)
50%
40%
0% 50% 100%
Jogging
Walking
se In
tens
ity
(Percent of Carbohydrate)
95%
80%
Sprinting
Running
Exer
cis
Adapted from Costil et al., 1985

4
Carbohydrate Delays Fatigue During Intermittent SprintingAdapted from: Davis, et al. Int. J. Sports Nutr. 7: 261-273, 1997.
87 Minutes — 22, one-minute sprints completed
High-carbohydrate diet
60 Minutes — 15, one-minutesprints completed
0 20 40 60 80 100Time of Exercise to Fatigue
sprints completedNon-caloric Placebo
Carbohydrate Concentration Important for Optimal Fluid Absorption
FAST
FluidAbsorption(mL/cm/hr) 0% 6%
8%Water
Ryan, AJ. et al J. Appl. Physiol. 84: 1581-1588, 1998
SLOW8%
9%
5
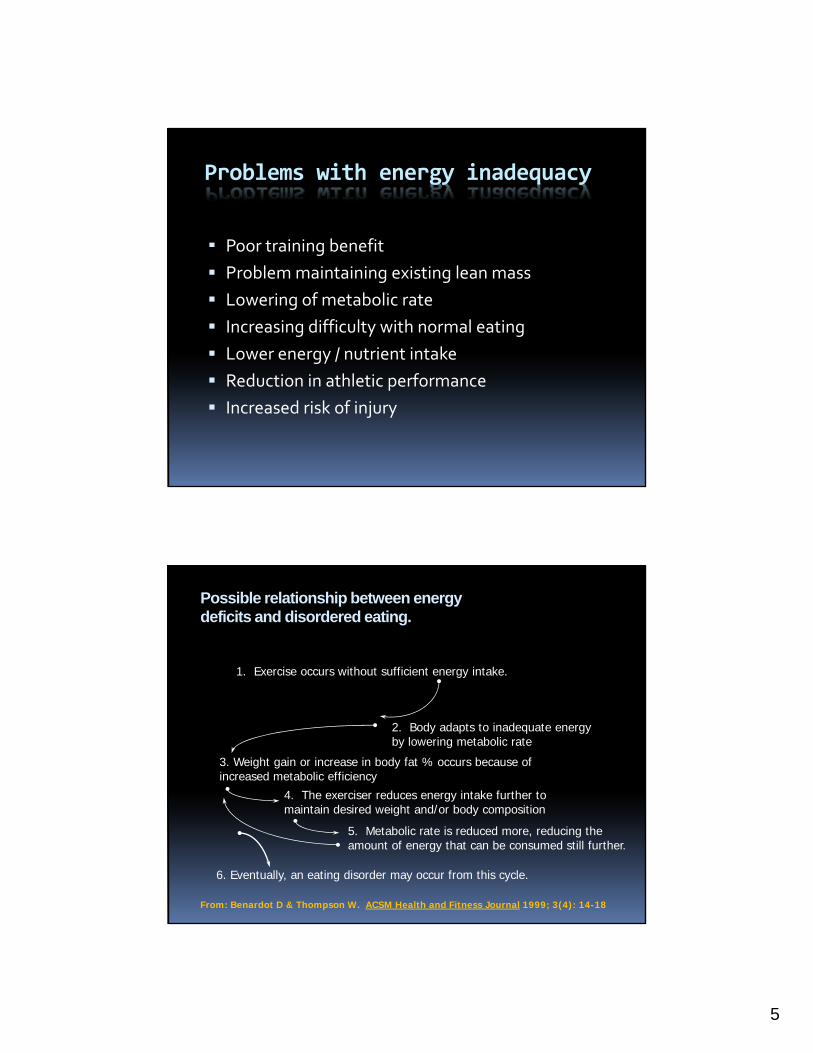
Problems with energy inadequacy
Poor training benefitPoor training benefitProblem maintaining existing lean massLowering of metabolic rateIncreasing difficulty with normal eatingLower energy / nutrient intakeReduction in athletic performanceIncreased risk of injury
1. Exercise occurs without sufficient energy intake.
Possible relationship between energy deficits and disordered eating.
2. Body adapts to inadequate energy by lowering metabolic rate
3. Weight gain or increase in body fat % occurs because of increased metabolic efficiency
4. The exerciser reduces energy intake further to i i d i d i h d/ b d i imaintain desired weight and/or body composition
5. Metabolic rate is reduced more, reducing the amount of energy that can be consumed still further.
6. Eventually, an eating disorder may occur from this cycle.
From: Benardot D & Thompson W. ACSM Health and Fitness Journal 1999; 3(4): 14-18

6
Traditional View of Energy Balance
24 hour Energy Intake24 h E B d = Energy Balance24 hour Energy Burned Energy Balance
Examples:3000 kcal intake over 24 hours3000 kcal burned over 24 hours
3000 kcal intake over 24 hours
= Perfect Energy Balance(weight stays the same)
= Positive Energy Balance2500 kcal burned over 24 hours
3000 kcal intake over 24 hours3500 kcal burned over 24 hours
Positive Energy Balance(weight goes up)
= Negative Energy Balance(weight goes down)
New view of energy balance
Energy Surplus
Time in SurplusMagnitude of surplus
24 hours
Traditional view only
Perfect Energy Balance
Energy Deficit
Magnitude ofdeficit
Traditional view onlyassesses this end-point
Deviations in within-day energy surpluses and deficits are as important factors in outcome variables (body fat, performance, concentration ability, etc.) as the 24-hour energy balance end-point.
Time in deficit
7
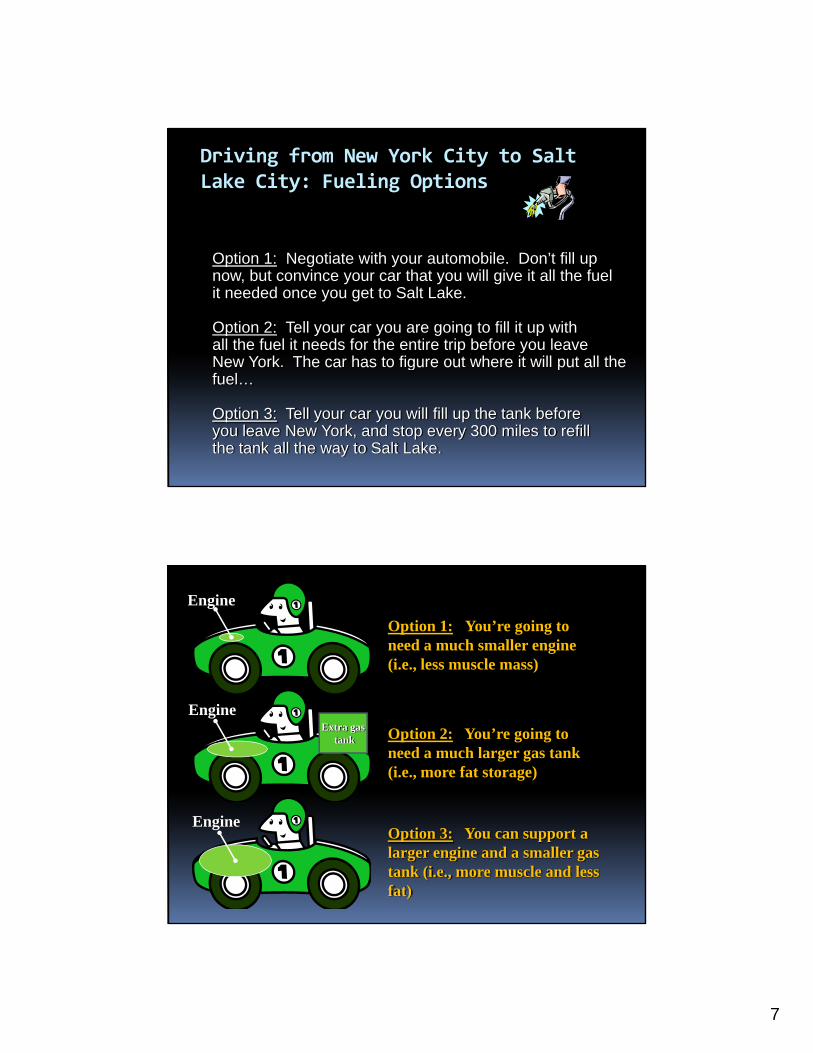
Driving from New York City to Salt Lake City: Fueling Options
Option 1: Negotiate with your automobile. Don’t fill up now, but convince your car that you will give it all the fuel it needed once you get to Salt Lake.
Option 2: Tell your car you are going to fill it up withall the fuel it needs for the entire trip before you leave New York. The car has to figure out where it will put all the e o e ca as o gu e ou e e pu a efuel…
Option 3: Tell your car you will fill up the tank before you leave New York, and stop every 300 miles to refillthe tank all the way to Salt Lake.
Option 1: You’re going to need a much smaller engine (i.e., less muscle mass)
Engine
Option 2: You’re going to need a much larger gas tank (i.e., more fat storage)
Extra gastank
Engine
Option 3: You can support a larger engine and a smaller gas tank (i.e., more muscle and less fat)
Engine
8
+800
+600
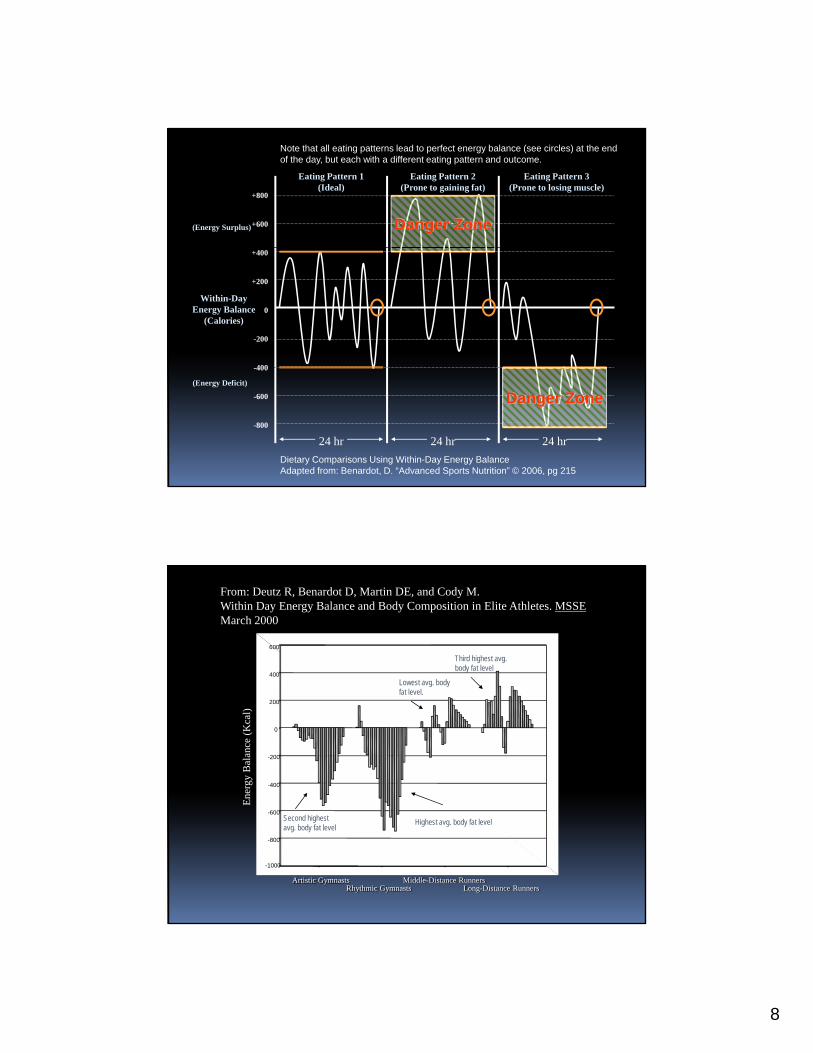
Eating Pattern 1(Ideal)
Eating Pattern 2(Prone to gaining fat)
Eating Pattern 3(Prone to losing muscle)
(Energy Surplus) Danger Zone
Note that all eating patterns lead to perfect energy balance (see circles) at the end of the day, but each with a different eating pattern and outcome.
+400
+200
0
-200
400
Within-DayEnergy Balance
(Calories)
-400
-600
-800
24 hr 24 hr 24 hr
(Energy Deficit)
Danger Zone
Dietary Comparisons Using Within-Day Energy BalanceAdapted from: Benardot, D. “Advanced Sports Nutrition” © 2006, pg 215
600
400
From: Deutz R, Benardot D, Martin DE, and Cody M. Within Day Energy Balance and Body Composition in Elite Athletes. MSSEMarch 2000
Third highest avg.body fat level
Lowest avg. body
200
0
-200
-400
Ener
gy B
alan
ce (K
cal)
Lowest avg. bodyfat level.
-600
-800
-1000
Artistic GymnastsRhythmic Gymnasts
Middle-Distance RunnersLong-Distance Runners
E
Highest avg. body fat levelSecond highestavg. body fat level

9
Supporting studies: advantages to eating frequently
• Maintenance of metabolic rateL b d f t & l i ht hi h l i i t k• Lower body fat & lower weight on higher caloric intakes
• Lower serum lipids• Improved glucose tolerance and lower insulin response• Lower stress hormone productionZvolankova K. Lancet 1964; 614‐615.Metzner HL et al. Am J Clin Nutr 1977; 30:712‐715.
Steen SN et al. JAMA 1988; 260(1):47‐50.
Jenkins et al. New England J Med 1989; 321:929‐34.
Heshka S et al. Am J Clin Nutr 1990; 52:981‐986.99 ; 5 9 9
Tuschl RJ, et al. Am J Clin Nutr 1990; 52:81‐86.
Luke A & Schoeller D. Metabolism 1992; 41(4):450‐456
LeBlanc J et al. Canadian J Physiol. Pharmacol. 1993; 71:879‐883.
Iwao S, Mori K, and Sato Y. Scand J Med Sci Sports 1996; 6(5):265‐272.
Hawley JA and Burke LM. Br J Nutr 1997; 77:S91‐103
Common Error
Blood glucose fluxes every 3 hoursThe sensation of ‘hunger’ occurs at the same The sensation of hunger occurs at the same time intervalPeople try to mask hunger by providing a calorie‐free CNS stimulant (i.e., diet cola with caffeine)By the time food is provided (2 or 3 hours later), physiological hunger is severephysiological hunger is severeFood intake at a single ‘sitting’ is too high
Sources:•Fabry P & Tepperman J. Meal Frequency – A possible factor in human pathology. Am J Clin Nutr 1970; 23(8): 1059-1068•Cohn C, Berger S, & Norton M. Relationship between meal size and frequency and plasma insulin response in man. Diabetes 1968: 17(2): 72-5.
10
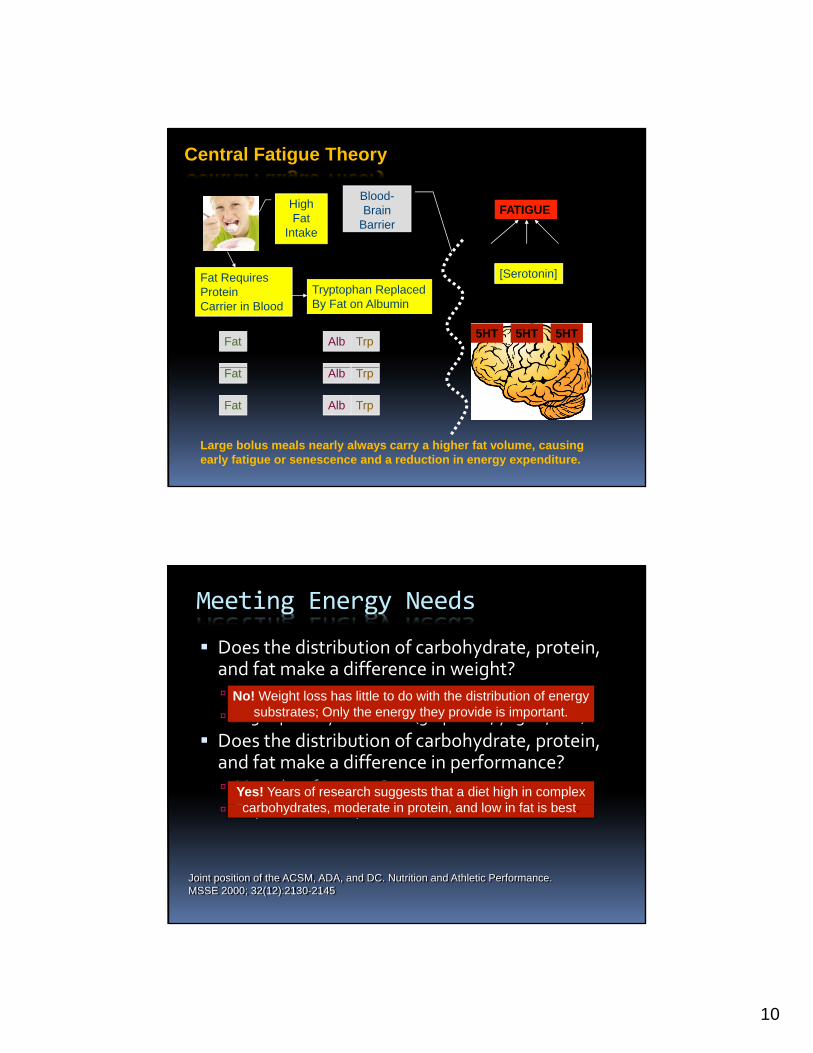
Blood-Brain
Barrier
Central Fatigue Theory
High Fat
Intake
FATIGUE
Fat Requires ProteinCarrier in Blood
TrpAlbFat5HT 5HT 5HT
Tryptophan ReplacedBy Fat on Albumin
[Serotonin]
Fat
Fat
Alb
Alb
Trp
Trp
Large bolus meals nearly always carry a higher fat volume, causing early fatigue or senescence and a reduction in energy expenditure.
Meeting Energy Needs
Does the distribution of carbohydrate, protein, and fat make a difference in weight?
High fat, high protein diets (Adkins, Zone, etc.)?High specialty food diets (grapefruit, yogurt, etc.)?
Does the distribution of carbohydrate, protein, and fat make a difference in performance?
Mental performance?Ph i l/ thl ti f ?
No! Weight loss has little to do with the distribution of energy substrates; Only the energy they provide is important.
Yes! Years of research suggests that a diet high in complex b h d t d t i t i d l i f t i b tPhysical/athletic performance?carbohydrates, moderate in protein, and low in fat is best.
Joint position of the ACSM, ADA, and DC. Nutrition and Athletic Performance. MSSE 2000; 32(12):2130-2145
11
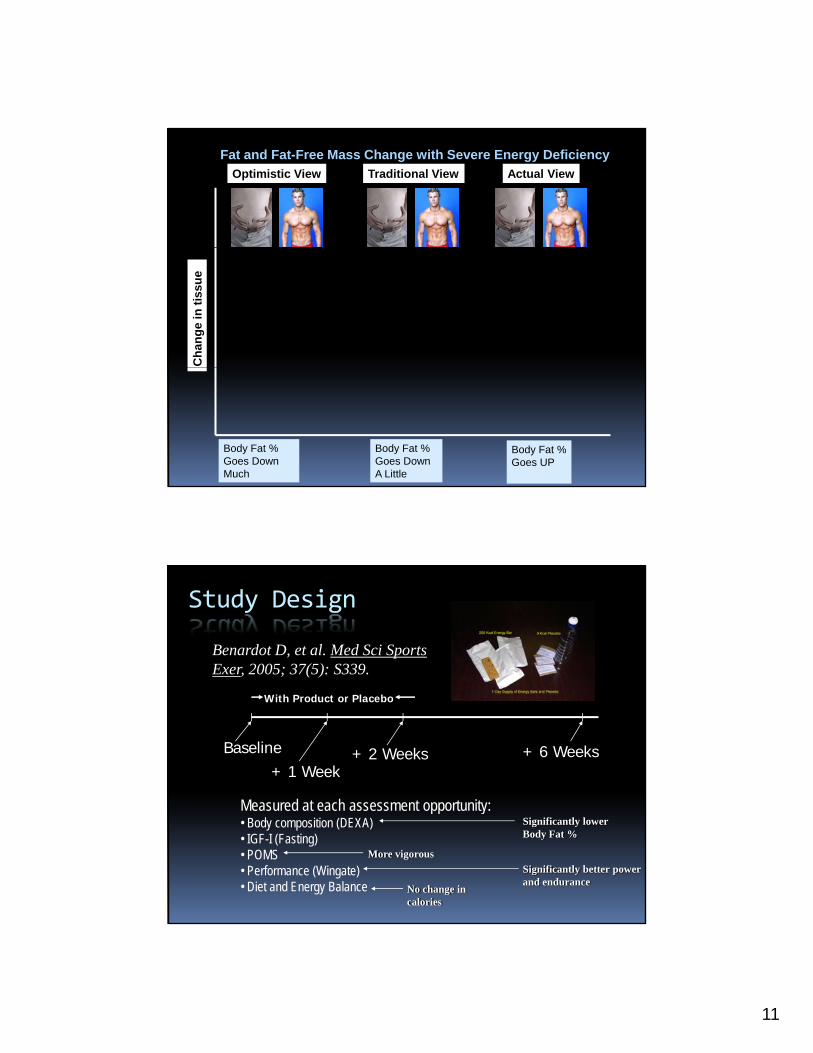
Optimistic View Traditional View Actual ViewFat and Fat-Free Mass Change with Severe Energy Deficiency
Cha
nge
in ti
ssue
Body Fat %Goes DownMuch
Body Fat %Goes DownA Little
Body Fat %Goes UP
Study Design
Benardot D, et al. Med Sci Sports Exer, 2005; 37(5): S339.
Baseline+ 1 Week
+ 2 Weeks + 6 Weeks
With Product or Placebo
Measured at each assessment opportunity:Measured at each assessment opportunity:• Body composition (DEXA)• IGF-I (Fasting)• POMS• Performance (Wingate)• Diet and Energy Balance
Significantly lowerBody Fat %
Significantly better power and endurance
No change in calories
More vigorous

12
JUMP HEIGHT STUDY COMPARING CARBOHYDRATE AND CREATINE SUPPLEMENTSSource: Koenig C, Benardot D, Cody M, and Thompson W. The influence of creatine monohydrate and carbohydrate
supplements on repeated jump height. Medicine & Science in Sports & Exercise. 2004; 36(5):S347[Accepted for publication: Strength and Conditioning Research Journal, September 2007]
No difference in first 6 of 10 jumpsJump 7, 250 kcal supplement significantly better than all other supplementsJump 8 & 9, 250 kcal and Creatine supplements better than other supplementsJump 10, all supplements better than placeboIn no case did creatine monohydrate outperform 250 kcal from carbohydrateCreatine monohydrate group gained 1.5 kg after 6 days; 250 kcal group gained 0.0kg after 6 days.
© Dan Benardot, 2007
Blood Glucose Maintenance…
Blood sugar peaks ~ 1 hour after a meal, and returns to pre‐meal levels ~2 hours after that.Delayed eating hypoglycemia:y g yp g y
HeadachePoor concentrationFatigueGluconeogenesis
LactateAlanineGlycerolPyruvate
> Come mainly from working muscles
This means your muscle mass is
being broken down to supply the
needed energy. NOT GOOD!
y
After only 40 minutes of strenuous activity, free alanine can increase by 60 to 96%; even more if work occurs with low blood sugar.
Source: Felig P & Wahren J. Amino acid metabolism in exercising man. J ClinInvest. 1971; 50:2703-2714

13
HOW TO AVOID FUNCTIONAL DEPLETION OF
INTERMUSCULAR GLYCOGEN AND BLOOD GLUCOSE?
Start the race with a higher level of muscle glycogenStart the race with liver glycogen full, and blood glucose normalHave a strategy for keeping blood sugar ‘normal’ (sip ‘n carry)Have a strategy for keeping blood sugar normal (sip n carry)Keeping blood glucose normal…
Prevents hypoglycemiaPrevents neuroglucopeniaLowers risk for CNS fatigue
Large catecholamine responsePale skinIrritabilityConfusionLethargyMuscle fatigue
Think about caffeine, but be careful!
© Dan Benardot, 2007
Mistakes are made even in trying to resolve the higher body fat
Remember: The body’s adaptation to an inadequate
to resolve the higher body fat level that results from ‘dieting’
y p qcaloric intake is to lower the mass that requires energy (muscle and organ mass).

14
Weight Stability
Excellent sign that energy intake matches demand.Energy deficiency leads to loss of lean mass (tissue compensation).A rise in body fat percent results in an heightened desire to reduce energy intake further. (Makes things worse.)Athletes focus on doing more low‐intensity (‘aerobic’) exercise to lose the excess fat. (Makes things worse.)
Sources:•Saltzman E and Roberts SB. Nutrition Reviews 1995; 53(8): 209-220•Dulloo AG and Girardier C. Am J Clin Nutr 1990; 52:415-420
Fuel burned at different exercise intensities
While the proportion of fat burned to satisfy total caloric requirement is lower at higher exercise A greater proportion of fat
i b d 2 % VO2 intensities (65 and 85 % of VO2max), the total mass of fat burned is greater than at lower intensities (25% VO2max).
is burned at 25% VO2max than at higher intensities, but the total calories burned from fat is less than at higher intensities
Note: Notice that at higher intensities of exercise, there is an increasingly greater reliance on muscle
Source: Romijn JA, Coyle EF, Sideossis LS, Gastaldelli A, Horowitz JF, Endert E, and Wolfe RR. Regulation of endogenous fat and carbohydrate metabolism in relation to exercise intensity and duration. 1993; Am J Physiol. 265; E380-E391.
greater reliance on muscle glycogen to supply the needed fuel.

15
Two carbohydrate energy storage systems to consider
Liver
Liver Glycogen: About 400 kcal
Supplies glucose to blood, brain, and muscles
When glucose flow to brain gets low, mental fatigue results in
Muscle Glycogen: About 2,000 kcal
max
muscle fatigue.(Must keep filling me up)
Muscle broken down to supply alanine for conversion to glucose to keep blood glucose up if liver glycogen is empty.
Muscle
max
Muscle glycogen used almost entirely for muscle function
(Fill me up days before)
Insulin plays a role in body composition
Ways to increase insulin productionLarge volume of simple carbohydrateLarge bolus meals (regardless of composition)Eating following hunger (low blood sugar)High body fat levelLow level of physical activity
> Inadequate sleep?Psychological stress?Physiological stress?
> Inadequate sleep?

16
Vitamins and Minerals
ConcernsConcernsCalciumIronFolateB‐12 (Vegetarian concern) ©
200
7
concern)Vitamin D (Indoor activity concern) D
an B
enar
dot
©
Healthy and Unhealthy Bone
Abnormal Architecture
Normal Architecture

17
↑ Bl d idit
Hemolysis in Athletes: Iron Status Is Critical
• ↑ Blood acidity • ↑ RBC transit velocity• Extravascular compres-
sion of major working muscles ↑ Pl t f• ↑ Plantar surface compression at footstrike
• Mean life of RBC in runners = 80 days (versus 120 days in sedentaries)D
an B
enar
dot
© 2
007
Recovery Nutrition
Immediately (within 30‐60 minutes) after Immediately (within 30 60 minutes) after workouts
Especially when doing > 1 workout per dayConditions within the body post‐workout are optimal for recovery if the proper nutrients are providedConsuming carbohydrate & protein right after Consuming carbohydrate & protein right after workout will:
Restore fuel stores in muscle (glycogen)Increase synthesis of muscle protein

18
Dan
Ben
ardo
t ©
200
4
FLUID BASICS
The Good, The Bad, & The Ugly
The Good:Consumption of the right amount of the right fluid at the right timeThe Bad:Consumption of some fluids of questionable value at any timeThe Ugly: “Forget the fluids I’m just going to The Ugly: Forget the fluids, I m just going to skate”

19
Reducing Voluntary Dehydration
(Even in the presence of fluids, athletes tend to drink less than they need.)
Common Risks for Dehydration
Vomitingo t gDiarrheaInadequate fluid replacementInduced high sweat rates (as in saunas)LaxativesDiuretics (and substances with a diuretic ff t h hi h i t k f ff i )effect, such as high intakes of caffeine)
DietingFebrile illness

20
Why Water Leaves You Empty
Ingredients Beverages
Sports Drink Water
Flavor Light flavoring that encourages people to drink more
Lack of flavor keeps you from drinking enough to fully rehydrate
Carbohydrate Contains 14 g CHO / 8 oz to provide energy for working muscles. Absorbed quickly.
Provides no energy to enhance performance
Electrolytes: Sodium Contains small amount of Na+ Contains no sodiumElectrolytes: Sodium and Potassium
Contains small amount of Na+ (110mg/8oz) that encourages drinking and maintains blood volume
Contains no sodium, encouraging urination.
Replaces electrolytes lost in sweat
Does not replace electrolytes
Fluid Intake Recommendations
Drink as much as needed to offset sweat lossesHumans have no idea of rate of fluid loss during Humans have no idea of rate of fluid loss during exercise (‘thirst’ doesn’t work)It is difficult to consume and absorb sufficient fluid (1‐2 Liters/hour)Ingestion of large volumes of fluid increases risk of GI distress and/or impairs performance Ingestion of large volumes of relatively dilute, low sodium fluid may increase the risk of hyponatremiaVoluntary fluid intake commonly results in dehydration

21
Fluid Guidelines from ADA, ACSM and Dietitians of Canada:
BeforeDrink 12 to 20 oz (400‐600 ml) 2‐3 hours before
DuringDrink 6 to 12 oz (150‐350 ml) every 15‐20 minutes
AfterReplace 150% of sweat lossesReplace 150% of sweat lossesDrink 3 cups (24 oz) for every 1 lb weight lost through sweat
ADA Position Paper. JADA. 100(12):1543-1556, ‘00
The Bottom Line
N G t HNever Get HungryNever Get Thirsty

22
APPLICATIONAPPLICATION
The primary nutritional goals are:
Maintain a good state of hydration. Maintain blood sugar. Low blood sugar results in mental fatigue, and to muscle fatigue, even if the muscles have plenty of glycogen fuel remaining. Reduce the depletion of muscle glycogen Reduce the depletion of muscle glycogen stores by providing carbohydrate.

23
Beware!
A lot of nutrition misinformation is targeted to athletes and non‐
athletes of all ages.
Take home message
Rely on food for proper nutrition and not “nutritional supplement.”
Get enough energy by eating 3 meals a day and plan 3 4 snacks per dayand plan 3‐4 snacks per day.

24
Normal Growth
Until you reach your adult height, normal growth and development only occur with
adequate energy intake (calories.)
Adequate calories needed for bothperformance and growth!performance and growth!
Planning snacksCarbohydrates are the best fuel for athletic performance. Athletes should take advantage of all natural breaks in competition to consume as much carbohydrate and fluid as can be tolerated.Avoid getting hungry by having something to eat (even if it is a 150 to 250 between‐meal
k) h snack) every 3 hours.

25
QUESTIONS?
© D
an B
enar
dot,
200
4