sporting goods manufacturers...
TRANSCRIPT

2012 Sports, Fitness and Leisure Activities Topline Participation Report
Sporting Goods Manufacturers Association


Methodology . . . . . . . . . . . . . . . . . . . . . . . . . . . . . . . . . . 1
Introduction . . . . . . . . . . . . . . . . . . . . . . . . . . . . . . . . . . . 2
Participation Trends . . . . . . . . . . . . . . . . . . . . . . . . . . . . 4
Activity Levels . . . . . . . . . . . . . . . . . . . . . . . . . . . . . . . . . 6
Spending Trends . . . . . . . . . . . . . . . . . . . . . . . . . . . . . . 10
The PE Pathway . . . . . . . . . . . . . . . . . . . . . . . . . . . . . . 15
Participation by Age . . . . . . . . . . . . . . . . . . . . . . . . . . . 19
Non-Participant Interests . . . . . . . . . . . . . . . . . . . . . . . . 21
Election Plans . . . . . . . . . . . . . . . . . . . . . . . . . . . . . . . . 22
Sports Participation Data . . . . . . . . . . . . . . . . . . . . . . . 23
Table of ContentsTable of ContentsYour guide through the Topline Report
Table of ContentsMethodologyHow the 2012 report research was conducted
2012 SGMA PARTiciPATion ToPline RePoRT 1
This Overview Report from the Sporting Goods Manufacturers Association (SGMA), is produced by a partnership of six of the major trade associations in US sports, fitness and leisure industries. This report includes a high level of detail when it comes to sports, fit-ness and leisure activity participation as well as topline information from the Physical Activity Council (PAC) Report. The overall aim of this report is to establish levels of activity and identify key trends in sports, fitness and recreation participation in the US. For more detailed information about each sport, please contact [email protected]
During January and February of 2012, a total of 38,172 online interviews were carried out with a nationwide sample of individuals and households from the US Online Panel of over one million people operated by Synovate. A total of 15,113 individual and 23,059 household surveys were completed. The total panel is maintained to be representative of the US population for people ages 6 and older. Over sampling of ethnic groups took place to boost response from typically under responding groups.
The 2011 participation survey sample size of 38,172 completed interviews provides a high degree of statistical accuracy. All surveys are subject to some level of standard error — that is, the degree to which the results might differ from those obtained by a complete census of every person in the US. A sport with a participation rate of five percent has a confidence interval of plus or minus 0.21 per-centage points at the 95 percent confidence level. This translates to plus or minus four percent of participants.
A weighting technique was used to balance the data to reflect the total US population ages six and above. The following variables were used: gender, age, income, household size, region and population density. The total population figure used was 285,753,000 people ages six and older.
In this year’s report we have adopted a slightly revised projection methodology that provides an even higher degree of accuracy. The technique of using a “two-year rolling average” measurement is commonly used in research as a way to effectively double the sample size to provide a stable base for all projections that derive from the data. This is particularly beneficial for the sports with participa-tion rates of less than one percent. Consequently, with this change, we have gone back and re-projected all participation totals begin-ning with the 2008 participation collection to reflect this change.
If you have specific questions regarding this change in methodology, please get in touch with Sports Marketing Surveys USA at [email protected] or (561) 427-0647.
Method for the Participation Topline Report
Table of ContentsIntroductionAn overview of the research and insights into the numbers
2012 SGMA PARTiciPATion ToPline RePoRT 2
Welcome to the 2012 edition of the Sports, Fitness and Leisure Activity Topline Participation Report from the Sporting Goods Manufacturers Association (SGMA). Since 1906, the SGMA has been dedicated to promoting the growth and vitality of the sporting goods industry. We are particularly proud of our long history of publishing the most comprehensive view available of American sports and fitness activities.
The enclosed report, a broad overview of all physical activity trends, signals the start of a very active report season for our organization. Over the next several weeks, we will release several cutting-edge reports featuring detailed insights to analyze the sports and fitness landscape in this country. The SGMA’s Annual State of the Industry, US Trends in Team Sports, Tracking the Fitness Movement and Manufacturers Sales By Category reports are in development and will be available free to our member companies and for
purchase by non-members. We’re also working on dozens of in-depth single sports reports, from running to basketball to aquatic exercise to cardio kick boxing. Developing data-driven insights, relevant and useful to our members’ decision-making processes, is a primary benefit SGMA provides. We encourage you to take advantage of our research services.
This year’s Topline Report tells a familiar story, both good and bad. On the positive side, in 2011, more than 217 million Americans took part in one of the 119 sports, fitness and leisure activities that we measure. Starting on page 23, you can get an in-depth look at which sports are growing and which ones are not. Remember that this data reflects all venues of play including recreational sports as well as those played in schools and even on the playgrounds. We break down casual participation versus regular and frequent play, offering an understanding of opportunities for growth and well as best targets for differentiated new products. This year’s report also includes relatively new activities such as boot- camp style cross training. Further, we break out swimming as both a fitness and team activity, and mixed martial arts for fitness and competition, which makes complicated year-to-year comparisons but is essential to reflect key trends.
While this report focuses a great deal on what activities and sports are growing, we are also saddened to report that 68.2 million Americans are totally inactive. The term “inactive” means, by our definition, individuals who self-report they did not engage in any of the sports and activities tracked in this report at least once during the course of the year. This figure is up from 67.1 million in the previous year or an increase of 1.6 percent. It’s a shockingly large number, and certainly a clarion call for our country to get off the couch. While we recognize our nation’s obesity crisis is a challenge requiring a multidisciplinary solution, more and more science indicates increasing physical activity may be one of the most effective and accessible responses available. The sporting goods industry can play a positive role in getting people physically active, and maintaining an active lifestyle for years. As such, inactivity trends and data points are explored in these pages. Please feel free to contact us at SGMA if you want to learn more about what we’re doing to combat the alarming inactivity situation.
Finally, remember this is a look at the very topline. There is a great deal of data behind these numbers that can tell a more detailed story. I urge you to contact us should you have any questions and we can get you the story behind the numbers in this report.
In sport and fitness,
Tom CovePresident & CEO Sporting Goods Manufacturers Association
A Message from Tom Cove, President & CEO of SGMA
2012 SGMA PARTiciPATion ToPline RePoRT 3
Welcome to the 2012 Sports, Fitness and Leisure Activity Topline Participation Report. We are dedicated to providing the mostcomprehensive look at physical activity in the USA. This report includes information on 119 sports and activities that are measured each year.
You may be unfamiliar with some of the terms used throughout the report. “Inactives” refers to those people who do not participate in any of the 119 sports and activities tracked. The term “core participant” refers to those people who participate on a regular basis.
68.1 Million Americans are Totally InactiveIn 2011, the number of inactive Americans ages six and older increased to more than 68 million, and the inactivity rate rose to almost 24 percent. Inactivity rates among children ages six to 12 fell slightly from 4.6 million people in 2010 to 4.5 million people in 2011. Activity rates among adolescents ages 13 to 17 remained fairly flat. Unfortunately, inactivity among adults continued to rise. Among adults ages 18 and older, inactivity increased from 58.7 million in 2010 to 60 million in 2011.
Over the past three years, the rate of inactivity has increased by just over eight percent, outpacing growth of the US population ages six and older. Although the growth in inactivity from 2010 to 2011 is modest when compared to past years, it is clear that we must keep working to inspire Americans to become more physically active.
217 Million Active AmericansWhile we spend a great deal of time talking about inactives in this report, there are currently 217 million active Americans ages six and older who take part in at least one sport or activity measured. To learn more about active Americans, contact the individual members of the PAC for data about their respective sports and activities.
Active Americans More Likely to VoteFor the first time in this survey, Americans were asked about their intentions to vote in the upcoming presidential election. There is a direct correlation between peoples’ plans to vote and their activity level. Those who are physically active are clearly more inclined to vote. See page 22 for more information.
The following are highlights from the 2012 Participation Topline Report:
• Participation in outdoor sports, like camping and hiking, saw the only increase in overall participation, regaining the two per-centage points it lost in 2010.
• Fitness sports remained the most popular physical activity. The participation rate held steady at 60 percent — for the fourth year in a row. Fitness activities, like yoga, boot camp-style training and other classes, continue to drive this set of activities.
• Core participation in racquet sports gained one percentage point. • Human-powered snowsports are up in the low single digits despite a decline in motorized snow and winter activities. • Most states have an inactivity rate of over 18.8 percent. Inactivity tends to be higher in the southern U.S., while more active
populations are usually located in northern and western states.• The economy is still having a slight impact on sports and recreation spending. While many active Americans are still not spend-
ing money on sports and recreation, more people spent the same amount or increased spending, rather than spending less. It is encouraging that people plan to increase spending in 2012, rather than decrease spending.
• There are significant opportunities to engage inactive populations in swimming, working out with weights and working out using machines. Swimming ranks as a popular “aspirational sport” for inactives ages six to 12 and ages 45 and up. Working out with weights and working out using machines are the top “aspirational sports” for inactives ages 13 to 44.
Physical Activity: Slight Progress for Some but More Work to be Done
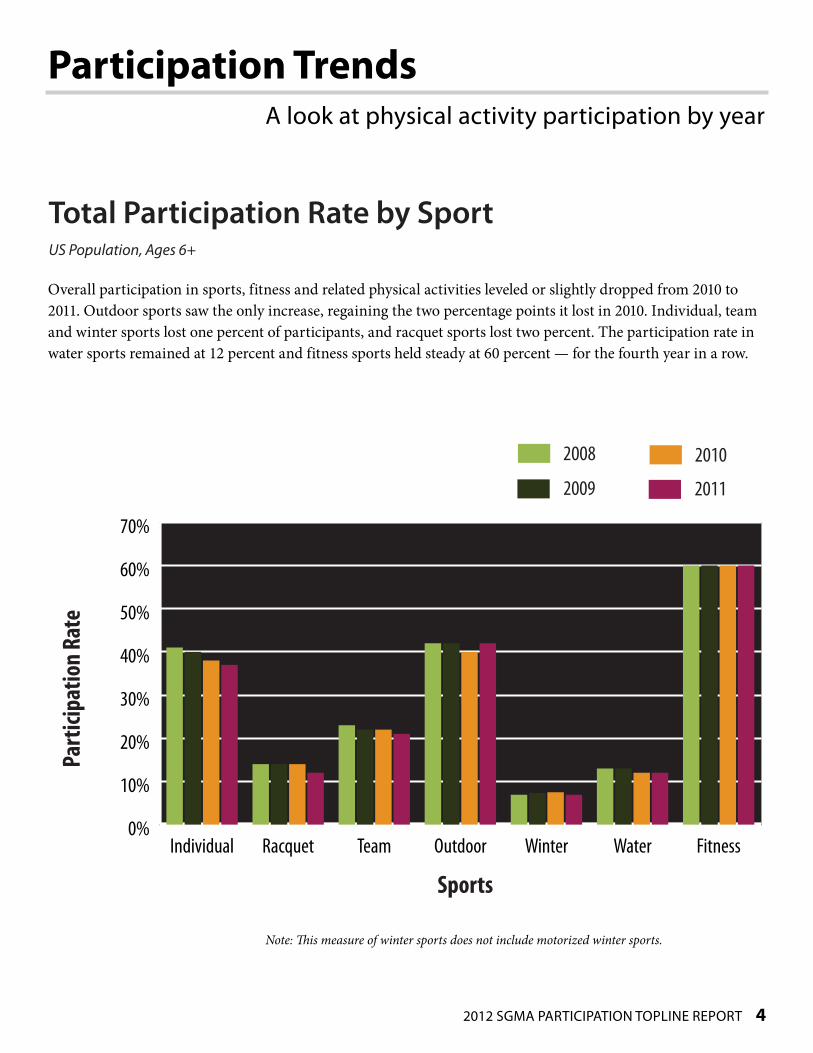
Table of ContentsParticipation TrendsA look at physical activity participation by year
2012 SGMA PARTiciPATion ToPline RePoRT 4
Total Participation Rate by Sport US Population, Ages 6+
Overall participation in sports, fitness and related physical activities leveled or slightly dropped from 2010 to 2011. Outdoor sports saw the only increase, regaining the two percentage points it lost in 2010. Individual, team and winter sports lost one percent of participants, and racquet sports lost two percent. The participation rate in water sports remained at 12 percent and fitness sports held steady at 60 percent — for the fourth year in a row.
0%
10%
20%
30%
40%
50%
60%
70%
FitnessWaterWinterOutdoorTeamRacquetIndividual
Part
icipa
tion
Rate
Sports
2009
2008
2011
2010
Note: This measure of winter sports does not include motorized winter sports.

2012 SGMA PARTiciPATion ToPline RePoRT 5
Core Participation Rate by SportUS Population, Ages 6+
Core participation, measuring those who participate on a regular or frequent basis, changed moderately from 2010 to 2011. The rate of core participation in individual, team, winter and water sports fell by one percentage point. Unlike overall participation, core participation in racquet sports gained a percentage point. Outdoor participation remained at 22 percent and fitness sports continued to be the most popular sport at 44 percent.
0%
10%
20%
30%
40%
50%
FitnessWaterWinterOutdoorTeamRacquetIndividual
Part
icipa
tion
Rate
Sports
2009
2008
2011
2010
Note: This measure of winter sports does not include motorized winter sports.
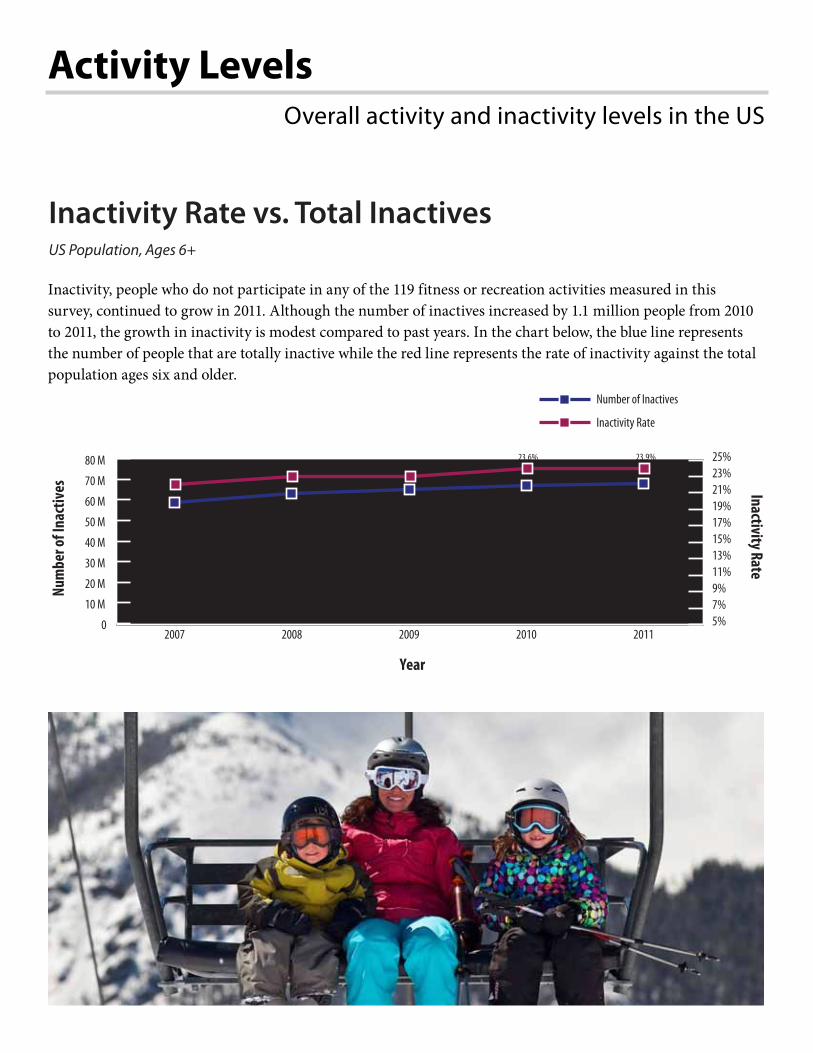
Table of ContentsActivity Levelsoverall activity and inactivity levels in the US
Inactivity Rate vs. Total Inactives US Population, Ages 6+
Inactivity, people who do not participate in any of the 119 fitness or recreation activities measured in this survey, continued to grow in 2011. Although the number of inactives increased by 1.1 million people from 2010 to 2011, the growth in inactivity is modest compared to past years. In the chart below, the blue line represents the number of people that are totally inactive while the red line represents the rate of inactivity against the total population ages six and older.
Year
Inactivity RateNu
mbe
r of I
nact
ives
5%7%9%11%13%15%17%19%21%23%25%
201120102009200820070
10 M
20 M
30 M
40 M
50 M
60 M
70 M
80 M
Number of Inactives
Inactivity Rate
21.5%22.6% 22.9%
23.6% 23.9%
63.1 M 64.6 M 67.1 M 68.2 M
59.4 M

2012 SGMA PARTiciPATion ToPline RePoRT 7
Age
Inactivity Rate
2009
2008
2011
2010
0% 5% 10% 15% 20% 25% 30% 35% 40%
55+
55-64
45-54
35-44
25-34
18-24
13-17
6-12
Inactivity Rate by AgeUS Population by Age
Inactivity rates among children ages six to 12 fell slightly from 16.6 percent in 2010 to 16 percent in 2011. This may be an early indication that efforts to get children off the couch and outside started to have an effect on their level of activity. Among adolescents age 13 to 17, inactivity fell from 16.7 percent to 16.4 percent. While these advances are modest, they are moving in the right direction. Conversely, inactivity increased among young adults aged 18 to 24 and adults aged 35 to 54.
2012 SGMA PARTiciPATion ToPline RePoRT 8
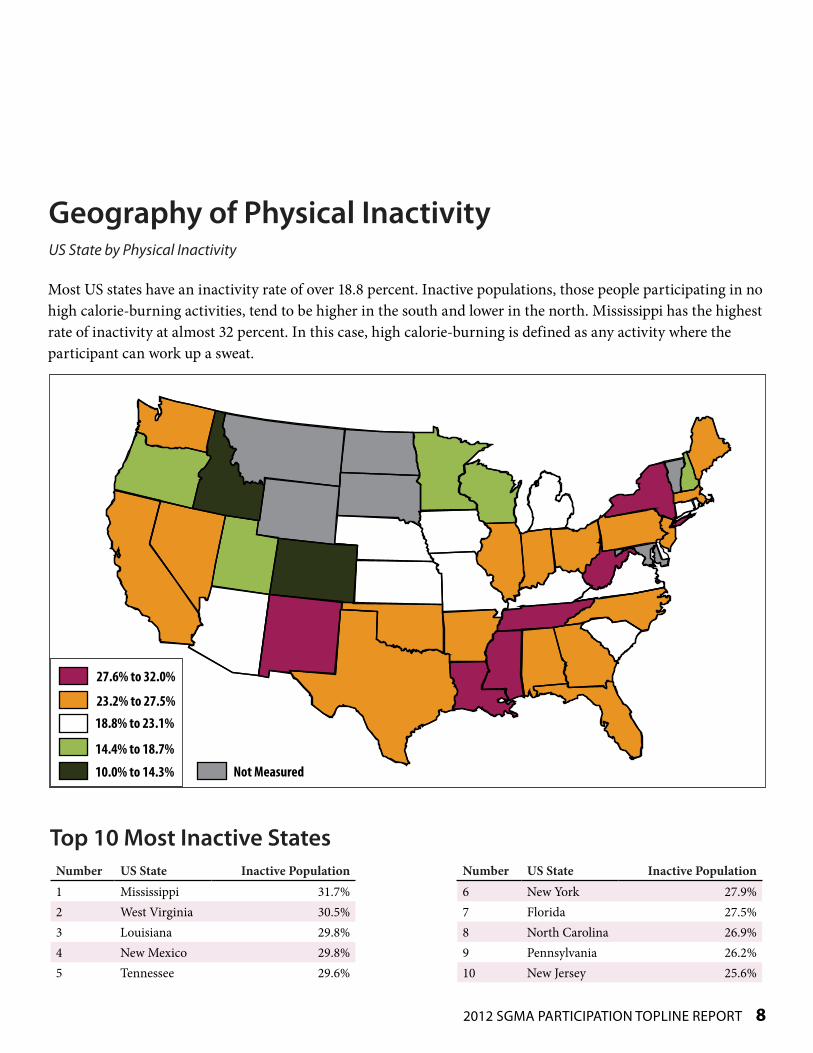
Geography of Physical Inactivity US State by Physical Inactivity
Top 10 Most Inactive States
Most US states have an inactivity rate of over 18.8 percent. Inactive populations, those people participating in no high calorie-burning activities, tend to be higher in the south and lower in the north. Mississippi has the highest rate of inactivity at almost 32 percent. In this case, high calorie-burning is defined as any activity where the participant can work up a sweat.
Number US State Inactive Population1 Mississippi 31.7%2 West Virginia 30.5%3 Louisiana 29.8%4 New Mexico 29.8%5 Tennessee 29.6%
Not Measured
27.6% to 32.0%
23.2% to 27.5%18.8% to 23.1%
14.4% to 18.7%
10.0% to 14.3%
Number US State Inactive Population6 New York 27.9%7 Florida 27.5%8 North Carolina 26.9%9 Pennsylvania 26.2%10 New Jersey 25.6%

2012 SGMA PARTiciPATion ToPline RePoRT 9
Geography of Physical ActivityUS State by Physical Activity
Utah has the highest rate of physical activity with almost 62 percent of the population participating in one or more high calorie-burning activities. Utah’s northern neighbor, Idaho, follows close behind. Other states with higher activity rates are scattered throughout the country but tend to be to located in the western and northern parts of the country.
Not Measured
57.2% to 62.0%
52.4% to 57.1%47.6% to 52.3%
42.8% to 47.5%
38.0% to 42.7%
Top 10 Most Active StatesNumber US State Active Population1 Utah 61.7%2 Idaho 61.3%3 New Hampshire 60.9%4 Colorado 60.1%5 Minnesota 57.4%
Number US State Active Population6 Virginia 56.6%7 Wisconsin 55.2%8 Nevada 55.2%9 Oregon 54.0%10 Illinois 53.6%

The Spending Trends
Spending in 2011 and spending plans for 2012
2012 SGMA PARTiciPATion ToPline RePoRT 10
While many active Americans are still not spending money on sports and recreation, the results to these questions confirm a general “flatness” to the sports economy in 2011 with generally equal numbers of consumers spending “more” and spending “less”.
Spending in 2011 Compared to 2010US Participants, Ages 6+
Spent More Spent Same Spent Less No SpendingTeam Sports at School 5.2% 14.1% 4.1% 76.6%Team Sports Outside of School 5.9% 17.6% 5.0% 71.4%Travel for Sports and Rec 6.3% 20.6% 6.5% 66.6%Lessons, Instruction and Camps 5.0% 11.6% 3.8% 79.6%Gym Membership/Fees 6.1% 17.8% 5.3% 70.7%Individual Sports Events 3.3% 11.0% 3.6% 82.1%Golf Membership/Fees 1.8% 9.2% 2.7% 86.3%Tennis Membership/Fees 0.8% 5.4% 1.4% 92.4%Winter Sports 2.0% 9.9% 4.4% 83.7%Outdoor Recreation 6.7% 32.3% 7.3% 53.8%Sports/Rec Clothing 9.0% 34.2% 8.5% 48.4%Sports/Rec Footwear 9.5% 36.8% 8.2% 45.6%Sports/Rec Equipment 7.7% 27.9% 8.4% 55.9%
The Spending Trends
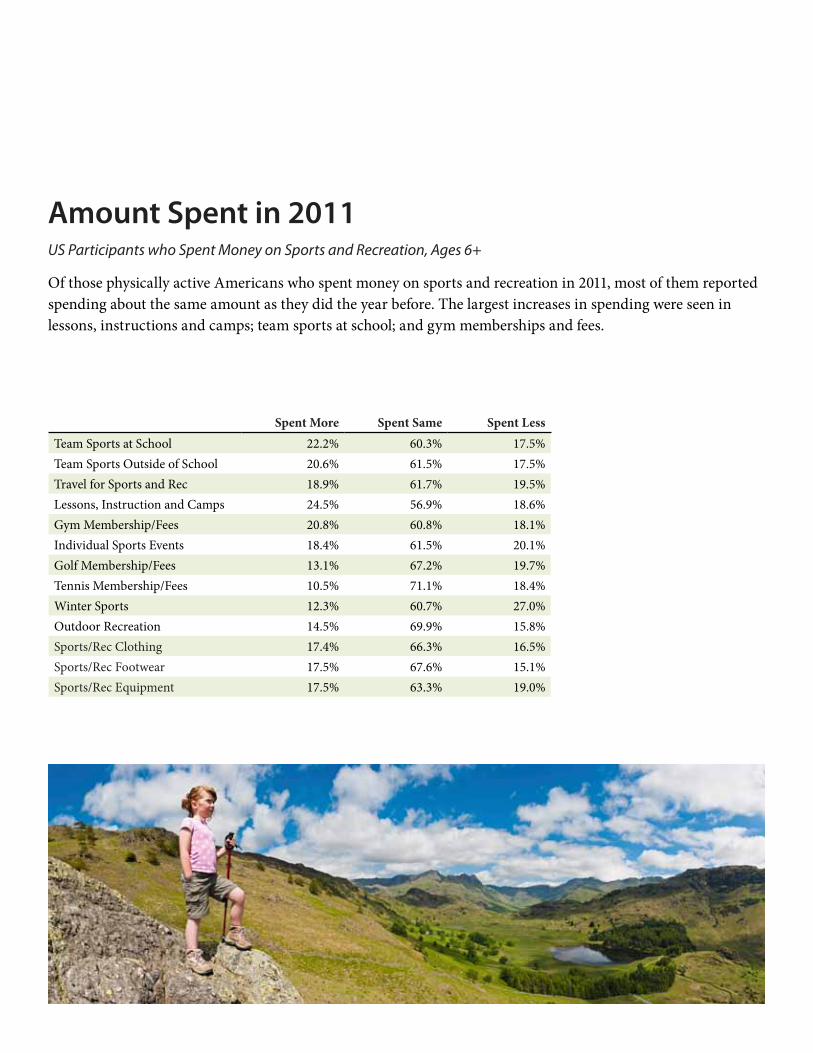
Amount Spent in 2011US Participants who Spent Money on Sports and Recreation, Ages 6+
Of those physically active Americans who spent money on sports and recreation in 2011, most of them reported spending about the same amount as they did the year before. The largest increases in spending were seen in lessons, instructions and camps; team sports at school; and gym memberships and fees.
Spent More Spent Same Spent LessTeam Sports at School 22.2% 60.3% 17.5%Team Sports Outside of School 20.6% 61.5% 17.5%Travel for Sports and Rec 18.9% 61.7% 19.5%Lessons, Instruction and Camps 24.5% 56.9% 18.6%Gym Membership/Fees 20.8% 60.8% 18.1%Individual Sports Events 18.4% 61.5% 20.1%Golf Membership/Fees 13.1% 67.2% 19.7%Tennis Membership/Fees 10.5% 71.1% 18.4%Winter Sports 12.3% 60.7% 27.0%Outdoor Recreation 14.5% 69.9% 15.8%Sports/Rec Clothing 17.4% 66.3% 16.5%Sports/Rec Footwear 17.5% 67.6% 15.1%Sports/Rec Equipment 17.5% 63.3% 19.0%
2012 SGMA PARTiciPATion ToPline RePoRT 12
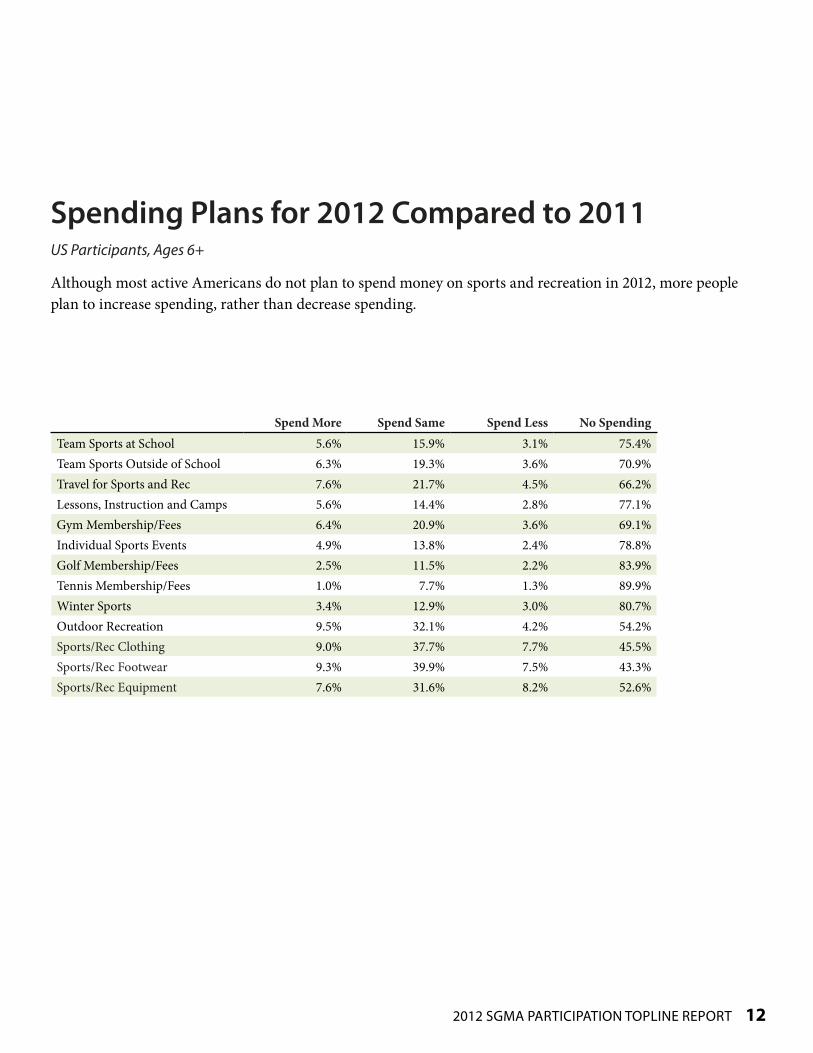
Spending Plans for 2012 Compared to 2011US Participants, Ages 6+
Although most active Americans do not plan to spend money on sports and recreation in 2012, more people plan to increase spending, rather than decrease spending.
Spend More Spend Same Spend Less No SpendingTeam Sports at School 5.6% 15.9% 3.1% 75.4%Team Sports Outside of School 6.3% 19.3% 3.6% 70.9%Travel for Sports and Rec 7.6% 21.7% 4.5% 66.2%Lessons, Instruction and Camps 5.6% 14.4% 2.8% 77.1%Gym Membership/Fees 6.4% 20.9% 3.6% 69.1%Individual Sports Events 4.9% 13.8% 2.4% 78.8%Golf Membership/Fees 2.5% 11.5% 2.2% 83.9%Tennis Membership/Fees 1.0% 7.7% 1.3% 89.9%Winter Sports 3.4% 12.9% 3.0% 80.7%Outdoor Recreation 9.5% 32.1% 4.2% 54.2%Sports/Rec Clothing 9.0% 37.7% 7.7% 45.5%Sports/Rec Footwear 9.3% 39.9% 7.5% 43.3%Sports/Rec Equipment 7.6% 31.6% 8.2% 52.6%

Amount Planning to Spend in 2012US Participants who Plan to Spend Money on Sports and Recreation, Ages 6+
Of those active Americans who plan to spend money on sports and recreation in 2012, more people overall will increase spending compared to 2011 rather than decrease spending. The majority will spend the same amount. Increased spending will likely be seen in lessons, instruction and camps (24.5 percent); individual sports events (23.1 percent); and team sports at school (22.8 percent).
Spend More Spend Same Spend LessTeam Sports at School 22.8% 64.6% 12.6%Team Sports Outside of School 21.6% 66.3% 12.4%Travel for Sports and Rec 22.5% 64.2% 13.3%Lessons, Instruction and Camps 24.5% 62.9% 12.2%Gym Membership/Fees 20.7% 67.6% 11.7%Individual Sports Events 23.1% 65.1% 11.3%Golf Membership/Fees 15.5% 71.4% 13.7%Tennis Membership/Fees 9.9% 76.2% 12.9%Winter Sports 17.6% 66.8% 15.5%Outdoor Recreation 20.7% 70.1% 9.2%Sports/Rec Clothing 16.5% 69.2% 14.1%Sports/Rec Footwear 16.4% 70.4% 13.2%Sports/Rec Equipment 16.0% 66.7% 17.3%

Table of ContentsThe PE PathwayHow youth are engaged in physical activities
2012 SGMA PARTiciPATion ToPline RePoRT 15
It appears that participating in Physical Education (PE) during childhood is the pathway to becoming a physically active adult. An adult who participated in PE at school is four times more likely to participate in a racquet sport and about three times more likely to participate in team, outdoor, winter and golf. All other sports measured show similar increases in activity among those who had PE.
Regu
lar A
ctiv
ities
Participation Rate
No PE at School
PE at School
0% 10% 20% 30% 40% 50% 60% 70% 80%
None of above
Fitness/Health Club
Golf
Racquet
Winter
Swimming
Watersports
Running/Jogging
Cycling
Outdoor
Team
The Effect of PE During School YearsUS Participants, Ages 18+ asked about PE during School
2012 SGMA PARTiciPATion ToPline RePoRT 16
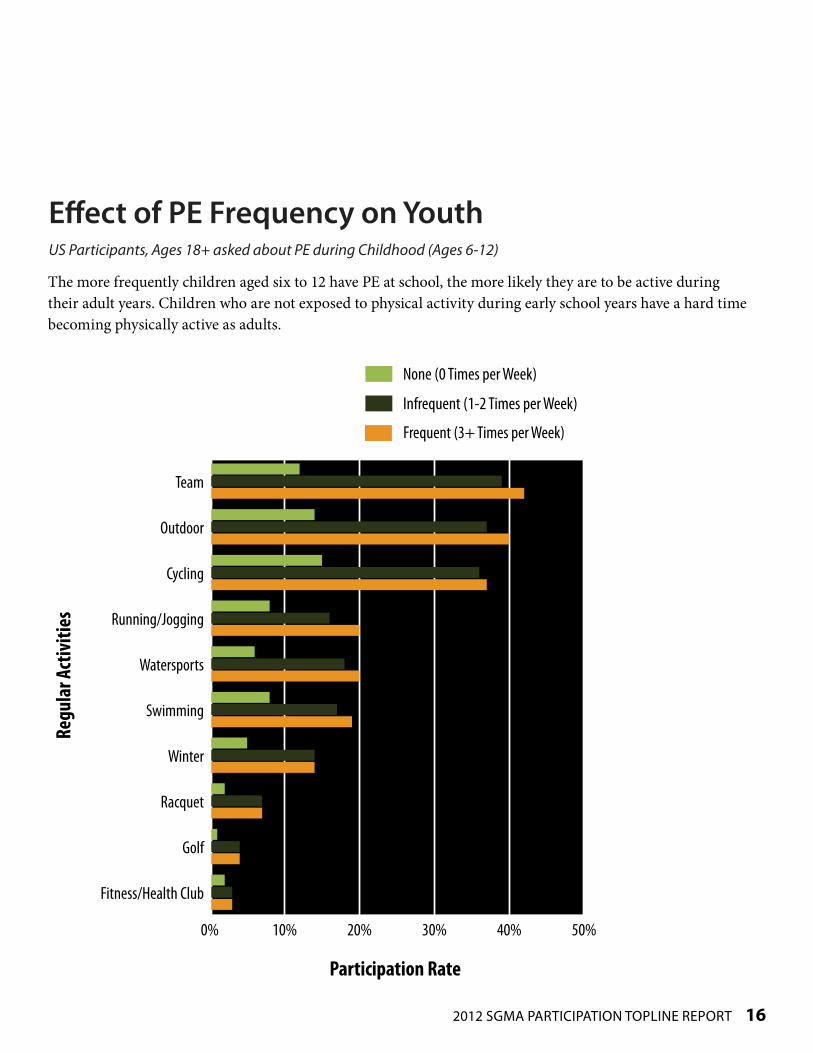
Effect of PE Frequency on Youth US Participants, Ages 18+ asked about PE during Childhood (Ages 6-12)
The more frequently children aged six to 12 have PE at school, the more likely they are to be active during their adult years. Children who are not exposed to physical activity during early school years have a hard time becoming physically active as adults.
Regu
lar A
ctiv
ities
Participation Rate
Frequent (3+ Times per Week)
Infrequent (1-2 Times per Week)
0% 10% 20% 30% 40% 50%
Fitness/Health Club
Golf
Racquet
Winter
Swimming
Watersports
Running/Jogging
Cycling
Outdoor
Team
None (0 Times per Week)

2012 SGMA PARTiciPATion ToPline RePoRT 17
Effect of PE Frequency on AdolescentsUS Participants, Ages 18+ asked about PE during Adolescence (Ages 13-17)
The effect of PE on adolescents again underscores the importance of engaging Americans in physical activity early and often. Almost half of adults who participate in team sports had PE three or more times per week when they were between the ages 13 and 17. Among outdoor participants, 44 percent also had PE on a frequent basis.
Frequent (3+ Times per Week)
Infrequent (1-2 Times per Week)
None (0 Times per Week)
Regu
lar A
ctiv
ities
Participation Rate
0% 10% 20% 30% 40% 50%
Fitness/Health Club
Golf
Racquet
Winter
Swimming
Watersports
Running/Jogging
Cycling
Outdoor
Team


Table of ContentsParticipation by AgeA breakdown of participation rates by generation
2012 SGMA PARTiciPATion ToPline RePoRT 19
0
10
20
30
40
50
60
FitnessWaterWinterOutdoorTeamRacquetIndividual
Part
icipa
nts (
in M
illio
ns)
Sports
Gen Y / Millenials (1980-1999)
Gen X (1965-1979)
Boomers (1945-1964)
The Millenial and Gen Y generations dominate all sports, but their participation is especially pronounced in team sports. More than 30 million Millenials and Gen Yers participate in team sports, while only 10.6 million Gen Xers and 5.4 million Boomers participate. Gen X comes in second in all sports, except outdoor sports, where Boomers outnumber them by almost three million, and fitness sports, where Boomers outnumber them by almost five million.
Participation by Age US Participants by Generation

2012 SGMA PARTiciPATion ToPline RePoRT 20
Part
icipa
tion
Rate
Age
0%
10%
20%
30%
40%
50%
60%
70%
80%
None
Fitness
Water
Winter
Outdoor
Team
Racquet
Individual
68666462605856545250484644424038363432302826242220181614121086
Looking at participation over a lifetime, from ages six to 68, it is clear age demographics play a significant role in which sports and activities people choose to participate in. Team sports peak during childhood and quickly drop after age 12. During this same period, fitness participation grows and does not peak until age 34. These fitness activities remain more constant throughout life compared to other physical activities. Participation in outdoor activities in general peak at age 38, while participation in snow sports peak much earlier — at age 16 — and thenmakes another upward run at age 30.
Participation over a LifetimeUS Participants by Ages 6-68
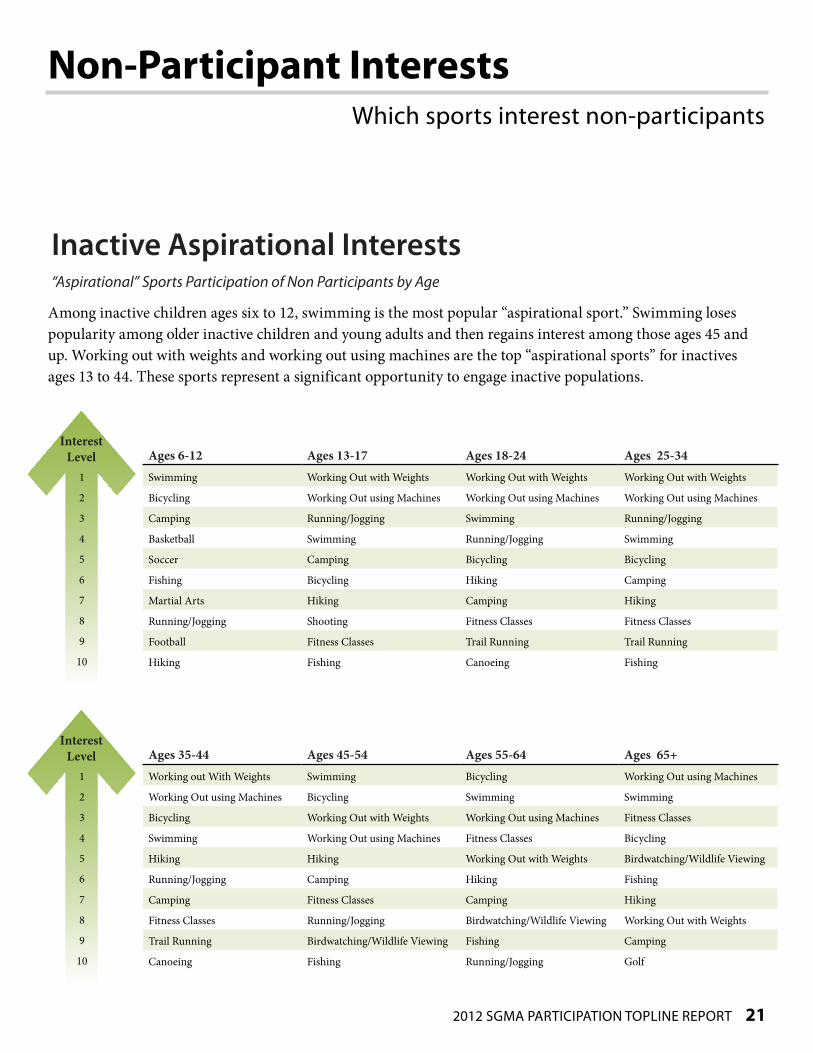
Table of ContentsNon-Participant Interests Which sports interest non-participants
2012 SGMA PARTiciPATion ToPline RePoRT 21
1
2
3
4
5
6
7
8
9
10
Interest Level
Among inactive children ages six to 12, swimming is the most popular “aspirational sport.” Swimming loses popularity among older inactive children and young adults and then regains interest among those ages 45 and up. Working out with weights and working out using machines are the top “aspirational sports” for inactives ages 13 to 44. These sports represent a significant opportunity to engage inactive populations.
Inactive Aspirational Interests“Aspirational” Sports Participation of Non Participants by Age
Ages 35-44 Ages 45-54 Ages 55-64 Ages 65+Working out With Weights Swimming Bicycling Working Out using Machines
Working Out using Machines Bicycling Swimming Swimming
Bicycling Working Out with Weights Working Out using Machines Fitness Classes
Swimming Working Out using Machines Fitness Classes Bicycling
Hiking Hiking Working Out with Weights Birdwatching/Wildlife Viewing
Running/Jogging Camping Hiking Fishing
Camping Fitness Classes Camping Hiking
Fitness Classes Running/Jogging Birdwatching/Wildlife Viewing Working Out with Weights
Trail Running Birdwatching/Wildlife Viewing Fishing Camping
Canoeing Fishing Running/Jogging Golf
Interest Level
Ages 6-12 Ages 13-17 Ages 18-24 Ages 25-34Swimming Working Out with Weights Working Out with Weights Working Out with Weights
Bicycling Working Out using Machines Working Out using Machines Working Out using Machines
Camping Running/Jogging Swimming Running/Jogging
Basketball Swimming Running/Jogging Swimming
Soccer Camping Bicycling Bicycling
Fishing Bicycling Hiking Camping
Martial Arts Hiking Camping Hiking
Running/Jogging Shooting Fitness Classes Fitness Classes
Football Fitness Classes Trail Running Trail Running
Hiking Fishing Canoeing Fishing
1
2
3
4
5
6
7
8
9
10

Table of ContentsElection Plansexpected participation in the presidential election
2012 SGMA PARTiciPATion ToPline RePoRT 22
Ages 35-44 Ages 45-54 Ages 55-64 Ages 65+Working out With Weights Swimming Bicycling Working Out using Machines
Working Out using Machines Bicycling Swimming Swimming
Bicycling Working Out with Weights Working Out using Machines Fitness Classes
Swimming Working Out using Machines Fitness Classes Bicycling
Hiking Hiking Working Out with Weights Birdwatching/Wildlife Viewing
Running/Jogging Camping Hiking Fishing
Camping Fitness Classes Camping Hiking
Fitness Classes Running/Jogging Birdwatching/Wildlife Viewing Working Out with Weights
Trail Running Birdwatching/Wildlife Viewing Fishing Camping
Canoeing Fishing Running/Jogging Golf
Plans for Voting in Presidential Election US Population, Ages 18+
As we are in the midst of a presidential election cycle, we felt that it might be interesting to see if those that are more active are also more likely to vote in the upcoming election. There is a direct correlation between peoples’ intentions to vote and their activity level, suggesting that those who are physically active are also more interested in politics and the direction of the country. Of those who are active, participants in fitness sports are the most likely to vote in the upcoming presidential election.
1 515%
4%
11% 9% 62%Not at All Likely
Very Likely
SportNot at All
Likely Somewhat
Unlikely UnsureSomewhat
Likely Very LikelyIndividual Sports 6.3% 2.6% 8.3% 9.3% 73.5%Racquet Sports 5.4% 1.8% 9.6% 8.4% 74.8%Team Sports 7.3% 3.2% 11.5% 10.5% 67.5%Outdoor Sports 6.3% 2.3% 7.7% 8.3% 75.4%Winter Sports 2.0% 4.3% 9.7% 8.7% 75.4%Water Sports 5.3% 1.1% 8.3% 11.0% 74.3%Fitness Sports 5.6% 2.3% 6.9% 7.6% 77.6%
Inactives
1 57%
3%
8% 8% 73%Not at All Likely
Very Likely
Actives
Actives by Sport

Table of ContentsSports Participation DataA breakdown of participation in all measured sports
2012 SGMA PARTiciPATion ToPline RePoRT 23
Aerobic Activities
Definition 2007 2008 2009 2010 20111 year change
2 year change
Aerobics (High impact)
Total participation 1+ times 11,287 11,780 12,771 14,567 15,755 8.2% 23.4%
Casual 1-49 times 5,004 5,385 5,850 6,699 7,282 8.7% 24.5%
Regular 50-99 times 2,156 2,228 2,479 2,937 3,281 11.7% 32.4%
Frequent 100+ times 4,127 4,168 4,442 4,931 5,192 5.3% 16.9%
CORE 50+ times 6,283 6,395 6,921 7,868 8,473 7.7% 22.4%
Aerobics (Low impact)
Total participation 1+ times 22,397 23,283 24,927 26,431 25,950 -1.8% 4.1%
Casual 1-49 times 9,341 10,181 11,028 11,725 11,826 0.9% 7.2%
Regular 50-99 times 4,523 4,794 5,189 5,663 5,448 -3.8% 5.0%
Frequent 100+ times 8,533 8,308 8,711 9,043 8,677 -4.1% -0.4%
CORE 50+ times 13,056 13,102 13,899 14,706 14,124 -4.0% 1.6%
Aerobics (Step)
Total participation 1+ times 8,528 9,423 10,551 11,034 10,273 -6.9% -2.6%
Casual 1-49 times 4,454 5,238 5,748 5,839 5,642 -3.4% -1.9%
Regular 50-99 times 1,647 1,769 2,116 2,316 2,007 -13.3% -5.1%
Frequent 100+ times 2,427 2,417 2,688 2,880 2,625 -8.8% -2.3%
CORE 50+ times 4,074 4,186 4,803 5,195 4,632 -10.8% -3.6%
Aquatic Exercise
Total participation 1+ times 9,757 9,512 8,965 8,947 9,042 1.1% 0.9%
Casual 1-49 times 5,993 5,894 5,411 5,345 5,598 4.7% 3.5%
Regular 50-99 times 1,789 1,799 1,831 1,767 1,627 -7.9% -11.1%
Frequent 100+ times 1,975 1,820 1,723 1,835 1,817 -1.0% 5.5%
CORE 50+ times 3,764 3,619 3,554 3,602 3,444 -4.4% -3.1%
Boot Camp Style Cross-Training
Total participation 1+ times 7,706
Casual 1-49 times 4,818
Regular 50-99 times 1,345
Frequent 100+ times 1,543
CORE 50+ times 2,888
Cardio Kickboxing
Total participation 1+ times 4,812 4,905 5,500 6,287 6,488 3.2% 18.0%
Casual 1-49 times 2,987 3,130 3,422 4,020 4,411 9.7% 28.9%
Regular 50-99 times 905 838 1,019 1,152 1,058 -8.2% 3.8%
Frequent 100+ times 920 937 1,059 1,115 1,020 -8.6% -3.7%
CORE 50+ times 1,825 1,775 2,078 2,267 2,077 -8.4% 0.0%
Cross-Country Ski Machine
Total participation 1+ times 3,696 3,593 3,294 3,091 2,913 -5.7% -11.6%
Casual 1-49 times 1,857 1,919 1,747 1,633 1,706 4.5% -2.3%
Regular 50-99 times 688 618 559 551 502 -9.0% -10.2%
Frequent 100+ times 1,151 1,056 989 907 706 -22.2% -28.6%
CORE 50+ times 1,839 1,674 1,547 1,458 1,208 -17.2% -21.9%
*All participation figures are in 000s for the US population ages 6+

Table of Contents
2012 SGMA PARTiciPATion ToPline RePoRT 24
Aerobic Activities (cont.)
Definition 2007 2008 2009 2010 20111 year change
2 year change
Elliptical Motion Trainer
Total participation 1+ times 23,586 24,435 25,903 27,319 29,734 8.8% 14.8%
Casual 1-49 times 10,972 11,350 11,907 12,724 13,999 10.0% 17.6%
Regular 50-99 times 4,968 5,216 5,407 5,611 6,300 12.3% 16.5%
Frequent 100+ times 7,646 7,869 8,590 8,985 9,436 5.0% 9.8%
CORE 50+ times 12,614 13,085 13,996 14,595 15,736 7.8% 12.4%
Other Exercise to Music
Total participation 1+ times 22,294 22,094 21,969 22,503 23,610 4.9% 7.5%
Casual 1-49 times 9,661 9,583 9,622 10,428 11,447 9.8% 19.0%
Regular 50-99 times 4,560 4,590 4,522 4,513 4,821 6.8% 6.6%
Frequent 100+ times 8,073 7,921 7,826 7,562 7,342 -2.9% -6.2%
CORE 50+ times 12,633 12,511 12,347 12,075 12,163 0.7% -1.5%
Running/Jogging
Total participation 1+ times 41,064 41,097 42,511 46,650 50,061 7.3% 17.8%
Casual 1-49 times 16,824 17,276 18,031 20,039 21,409 6.8% 18.7%
Regular 50-99 times 8,237 8,333 8,771 9,220 9,644 4.6% 10.0%
Frequent 100+ times 16,003 15,489 15,710 17,392 19,008 9.3% 21.0%
CORE 50+ times 24,240 23,821 24,481 26,612 28,651 7.7% 17.0%
Stair Climbing Machine
Total participation 1+ times 13,521 13,863 13,653 13,269 13,409 1.1% -1.8%
Casual 1-49 times 7,107 7,562 7,511 7,233 7,559 4.5% 0.6%
Regular 50-99 times 2,651 2,677 2,642 2,549 2,430 -4.7% -8.0%
Frequent 100+ times 3,763 3,624 3,501 3,487 3,421 -1.9% -2.3%
CORE 50+ times 6,414 6,301 6,143 6,035 5,850 -3.1% -4.8%
Stationary Cycling (Recumbent)
Total participation 1+ times 10,818 11,104 11,299 11,459 11,933 4.1% 5.6%
Casual 1-49 times 5,261 5,641 5,785 5,848 6,176 5.6% 6.8%
Regular 50-99 times 2,331 2,211 2,160 2,328 2,322 -0.3% 7.5%
Frequent 100+ times 3,226 3,253 3,354 3,283 3,435 4.6% 2.4%
CORE 50+ times 5,557 5,463 5,514 5,611 5,757 2.6% 4.4%
Stationary Cycling (Group)
Total participation 1+ times 6,314 6,504 6,762 7,854 8,738 11.3% 29.2%
Casual 1-49 times 3,371 3,620 3,844 4,536 5,088 12.2% 32.3%
Regular 50-99 times 1,221 1,150 1,197 1,436 1,584 10.3% 32.3%
Frequent 100+ times 1,722 1,735 1,721 1,883 2,066 9.7% 20.0%
CORE 50+ times 2,943 2,884 2,918 3,318 3,650 10.0% 25.1%
Stationary Cycling (Upright)
Total participation 1+ times 24,531 24,918 24,916 24,578 24,409 -0.7% -2.0%
Casual 1-49 times 11,581 12,117 12,224 12,183 12,187 0.0% -0.3%
Regular 50-99 times 5,210 4,974 4,918 4,843 4,745 -2.0% -3.5%
Frequent 100+ times 7,740 7,827 7,775 7,552 7,477 -1.0% -3.8%
CORE 50+ times 12,950 12,801 12,692 12,395 12,222 -1.4% -3.7%
*All participation figures are in 000s for the US population ages 6+

2012 SGMA PARTiciPATion ToPline RePoRT 25
Aerobic Activities (cont.)
Definition 2007 2008 2009 2010 20111 year change
2 year change
*All participation figures are in 000s for the US population ages 6+
Swimming (Fitness)
Total participation 1+ times 21,517
Casual 1-49 times 14,065
Regular 50-99 times 3,794
Frequent 100+ times 3,658
CORE 50+ times 7,453
Treadmill
Total participation 1+ times 50,073 49,722 50,395 52,275 53,260 1.9% 5.7%
Casual 1-49 times 20,891 21,077 21,161 21,896 22,642 3.4% 7.0%
Regular 50-99 times 10,728 10,541 10,462 10,756 11,035 2.6% 5.5%
Frequent 100+ times 18,454 18,105 18,772 19,623 19,583 -0.2% 4.3%
CORE 50+ times 29,182 28,646 29,234 30,378 30,617 0.8% 4.7%
Walking for Fitness
Total participation 1+ times 108,740 110,204 110,882 112,082 112,715 0.6% 1.7%
Casual 1-49 times 31,903 33,598 34,520 34,538 34,569 0.1% 0.1%
Regular 50-99 times 20,045 20,105 20,031 20,044 20,107 0.3% 0.4%
Frequent 100+ times 56,792 56,502 56,331 57,500 58,040 0.9% 3.0%
CORE 50+ times 76,837 76,606 76,362 77,544 78,146 0.8% 2.3%
Conditioning ActivitiesDefinition 2007 2008 2009 2010 2011
1 year change
2 year change
Abdominal Machine/Device
Total participation 1+ times 20,426 20,172 19,691 18,978 18,721 -1.4% -4.9%
Casual 1-49 times 7,625 7,782 7,448 7,383 7,549 2.2% 1.4%
Regular 50-99 times 4,319 4,272 4,294 4,031 3,698 -8.2% -13.9%
Frequent 100+ times 8,482 8,118 7,949 7,565 7,474 -1.2% -6.0%
CORE 50+ times 12,801 12,390 12,243 11,596 11,172 -3.7% -8.8%
Calisthenics
Total participation 1+ times 8,629 8,888 9,127 9,097 8,787 -3.4% -3.7%
Casual 1-49 times 2,041 2,539 3,131 3,182 2,996 -5.9% -4.3%
Regular 50-99 times 1,787 1,904 1,924 1,877 1,799 -4.2% -6.5%
Frequent 100+ times 4,801 4,440 4,067 4,039 3,993 -1.1% -1.8%
CORE 50+ times 6,588 6,344 5,991 5,915 5,791 -2.1% -3.3%
Pilates Training
Total participation 1+ times 9,192 9,039 8,770 8,404 8,507 1.2% -3.0%
Casual 1-49 times 5,085 5,217 5,077 4,863 5,191 6.8% 2.3%
Regular 50-99 times 1,920 1,718 1,678 1,672 1,522 -9.0% -9.3%
Frequent 100+ times 2,187 2,105 2,016 1,869 1,794 -4.0% -11.0%
CORE 50+ times 4,107 3,823 3,694 3,541 3,316 -6.4% -10.2%

Rowing Machine
Total participation 1+ times 8,782 8,902 9,098 9,469 9,765 3.1% 7.3%
Casual 1-49 times 4,451 4,614 4,751 5,023 5,359 6.7% 12.8%
Regular 50-99 times 1,609 1,730 1,828 1,693 1,657 -2.1% -9.4%
Frequent 100+ times 2,722 2,559 2,519 2,754 2,749 -0.2% 9.1%
CORE 50+ times 4,331 4,288 4,347 4,446 4,406 -0.9% 1.4%
Stretching
Total participation 1+ times 36,181 36,235 36,299 35,720 34,687 -2.9% -4.4%
Casual 1-49 times 7,863 8,266 8,727 8,578 8,165 -4.8% -6.4%
Regular 50-99 times 5,906 6,006 6,106 5,968 5,765 -3.4% -5.6%
Frequent 100+ times 22,412 21,963 21,467 21,174 20,757 -2.0% -3.3%
CORE 50+ times 28,318 27,969 27,573 27,142 26,522 -2.3% -3.8%
Tai Chi
Total participation 1+ times 3,424 3,315 3,193 2,975 -6.8% -10.3%
Casual 1-49 times 1,827 1,835 1,819 1,641 -9.8% -10.6%
Regular 50-99 times 520 505 534 562 5.2% 11.3%
Frequent 100+ times 1,077 975 841 773 -8.1% -20.8%
CORE 50+ times 1,597 1,480 1,374 1,334 -2.9% -9.8%
Yoga
Total participation 1+ times 17,758 18,934 20,998 22,107 5.3% 16.8%
Casual 1-49 times 10,736 11,143 12,045 12,548 4.2% 12.6%
Regular 50-99 times 2,808 3,297 3,802 4,065 6.9% 23.3%
Frequent 100+ times 4,214 4,494 5,151 5,494 6.7% 22.3%
CORE 50+ times 7,022 7,791 8,953 9,559 6.8% 22.7%
2012 SGMA PARTiciPATion ToPline RePoRT 26
Conditioning Activities (cont.)
Definition 2007 2008 2009 2010 20111 year change
2 year change
*All participation figures are in 000s for the US population ages 6+
Strength ActivitiesDefinition 2007 2008 2009 2010 2011
1 year change
2 year change
Free Weights (Barbells)
Total participation 1+ times 25,499 25,821 26,595 27,194 27,056 -0.5% 1.7%
Casual 1-49 times 8,181 8,454 8,528 9,072 9,345 3.0% 9.6%
Regular 50-99 times 4,950 5,176 5,436 5,368 5,367 0.0% -1.3%
Frequent 100+ times 12,368 12,191 12,631 12,754 12,345 -3.2% -2.3%
CORE 50+ times 17,318 17,367 18,067 18,122 17,711 -2.3% -2.0%
Free Weights (Dumbells)
Total participation 1+ times 32,371 33,381 35,068 36,566 36,470 -0.3% 4.0%
Casual 1-49 times 10,797 11,306 11,633 12,478 12,944 3.7% 11.3%
Regular 50-99 times 6,594 6,796 7,332 7,829 7,622 -2.6% 4.0%
Frequent 100+ times 14,980 15,280 16,103 16,259 15,904 -2.2% -1.2%
CORE 50+ times 21,574 22,076 23,435 24,088 23,526 -2.3% 0.4%

2012 SGMA PARTiciPATion ToPline RePoRT 27
Strength Activities (cont.)
Definition 2007 2008 2009 2010 20111 year change
2 year change
*All participation figures are in 000s for the US population ages 6+
Free Weights (Hand Weights)
Total participation 1+ times 43,821 43,409 44,466 45,928 46,944 2.2% 5.6%
Casual 1-49 times 15,635 15,853 15,817 16,396 17,676 7.8% 11.8%
Regular 50-99 times 8,819 8,852 9,223 9,609 9,853 2.5% 6.8%
Frequent 100+ times 19,367 18,705 19,426 19,924 19,416 -2.6% -0.1%
CORE 50+ times 28,186 27,557 28,649 29,533 29,268 -0.9% 2.2%
Home Gym Exercise
Total participation 1+ times 25,823 25,169 24,638 24,672 25,083 1.7% 1.8%
Casual 1-49 times 9,577 9,591 9,610 9,637 9,948 3.2% 3.5%
Regular 50-99 times 5,313 5,110 4,875 4,752 4,826 1.6% -1.0%
Frequent 100+ times 10,933 10,468 10,154 10,284 10,310 0.3% 1.5%
CORE 50+ times 16,246 15,578 15,029 15,035 15,136 0.7% 0.7%
Weight/Resistance Machines
Total participation 1+ times 39,290 38,844 39,075 39,185 39,548 0.9% 1.2%
Casual 1-49 times 14,555 14,742 14,411 14,484 15,287 5.5% 6.1%
Regular 50-99 times 8,012 8,038 8,223 8,091 8,145 0.7% -0.9%
Frequent 100+ times 16,723 16,064 16,442 16,610 16,116 -3.0% -2.0%
CORE 50+ times 24,735 24,102 24,665 24,701 24,261 -1.8% -1.6%
Individual Sports
Definition 2007 2008 2009 2010 20111 year change
2 year change
Adventure Racing
Total participation 1+ times 698 809 1,005 1,214 1,202 -1.0% 19.7%
Casual 1 time 257 221 343 434 337 -22.5% -1.9%
Regular 2-9 times 215 343 450 458 458 0.0% 1.7%
Frequent 10+ times 226 245 212 322 408 26.5% 92.9%
CORE 2+ times 441 588 662 700 738 5.4% 11.6%
Archery
Total participation 1+ times 5,950 6,180 6,368 6,323 6,471 2.3% 1.6%
Casual 1-25 times 4,839 5,070 5,336 5,387 5,546 3.0% 3.9%
Regular 26-51 times 687 618 541 537 558 3.9% 3.1%
Frequent 52+ times 424 493 491 399 368 -7.9% -25.2%
CORE 26+ times 1,111 1,110 1,032 936 926 -1.1% -10.3%
Billiards/Pool
Total participation 1+ times 51,089 50,054 46,012 41,195 36,831 -10.6% -20.0%
Casual 1-12 times 30,795 31,318 29,572 26,560 24,700 -7.0% -16.5%
Regular 13-24 times 6,824 6,324 5,699 5,218 4,340 -16.8% -23.8%
Frequent 25+ times 13,470 12,413 10,742 9,418 7,792 -17.3% -27.5%
CORE 13+ times 20,294 18,736 16,440 14,635 12,132 -17.1% -26.2%
2012 SGMA PARTiciPATion ToPline RePoRT 28
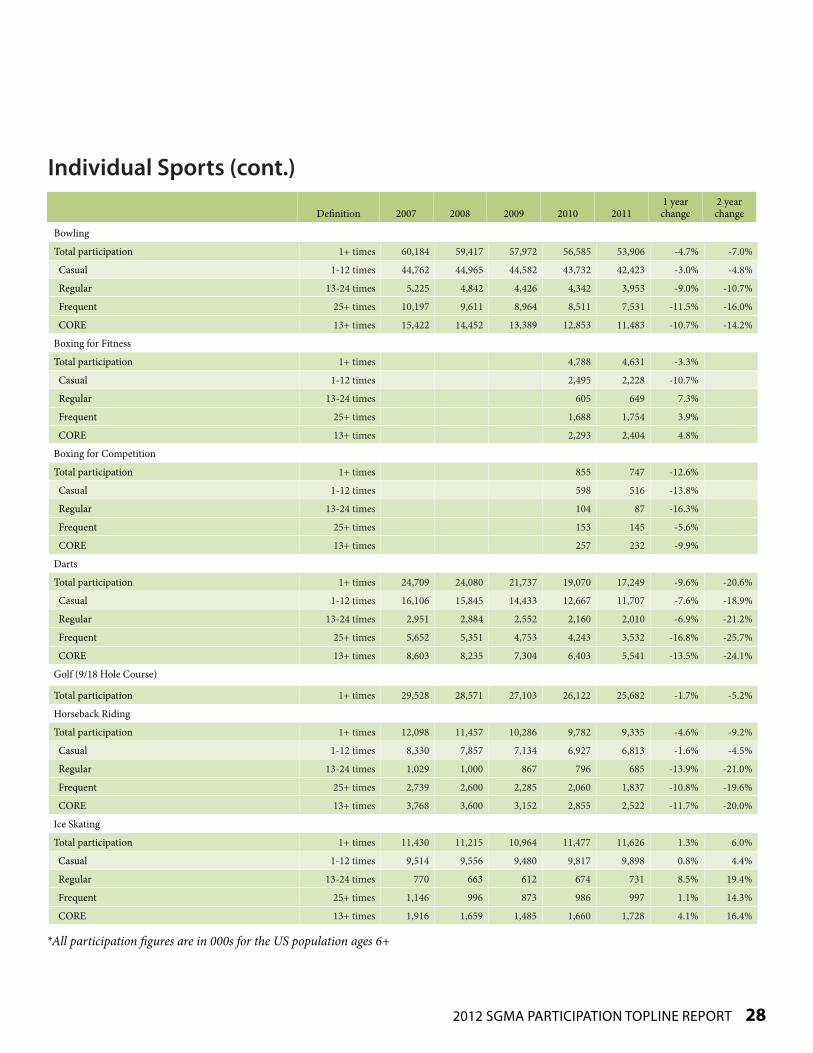
Individual Sports (cont.)
Definition 2007 2008 2009 2010 20111 year change
2 year change
*All participation figures are in 000s for the US population ages 6+
Bowling
Total participation 1+ times 60,184 59,417 57,972 56,585 53,906 -4.7% -7.0%
Casual 1-12 times 44,762 44,965 44,582 43,732 42,423 -3.0% -4.8%
Regular 13-24 times 5,225 4,842 4,426 4,342 3,953 -9.0% -10.7%
Frequent 25+ times 10,197 9,611 8,964 8,511 7,531 -11.5% -16.0%
CORE 13+ times 15,422 14,452 13,389 12,853 11,483 -10.7% -14.2%
Boxing for Fitness
Total participation 1+ times 4,788 4,631 -3.3%
Casual 1-12 times 2,495 2,228 -10.7%
Regular 13-24 times 605 649 7.3%
Frequent 25+ times 1,688 1,754 3.9%
CORE 13+ times 2,293 2,404 4.8%
Boxing for Competition
Total participation 1+ times 855 747 -12.6%
Casual 1-12 times 598 516 -13.8%
Regular 13-24 times 104 87 -16.3%
Frequent 25+ times 153 145 -5.6%
CORE 13+ times 257 232 -9.9%
Darts
Total participation 1+ times 24,709 24,080 21,737 19,070 17,249 -9.6% -20.6%
Casual 1-12 times 16,106 15,845 14,433 12,667 11,707 -7.6% -18.9%
Regular 13-24 times 2,951 2,884 2,552 2,160 2,010 -6.9% -21.2%
Frequent 25+ times 5,652 5,351 4,753 4,243 3,532 -16.8% -25.7%
CORE 13+ times 8,603 8,235 7,304 6,403 5,541 -13.5% -24.1%
Golf (9/18 Hole Course)
Total participation 1+ times 29,528 28,571 27,103 26,122 25,682 -1.7% -5.2%
Horseback Riding
Total participation 1+ times 12,098 11,457 10,286 9,782 9,335 -4.6% -9.2%
Casual 1-12 times 8,330 7,857 7,134 6,927 6,813 -1.6% -4.5%
Regular 13-24 times 1,029 1,000 867 796 685 -13.9% -21.0%
Frequent 25+ times 2,739 2,600 2,285 2,060 1,837 -10.8% -19.6%
CORE 13+ times 3,768 3,600 3,152 2,855 2,522 -11.7% -20.0%
Ice Skating
Total participation 1+ times 11,430 11,215 10,964 11,477 11,626 1.3% 6.0%
Casual 1-12 times 9,514 9,556 9,480 9,817 9,898 0.8% 4.4%
Regular 13-24 times 770 663 612 674 731 8.5% 19.4%
Frequent 25+ times 1,146 996 873 986 997 1.1% 14.3%
CORE 13+ times 1,916 1,659 1,485 1,660 1,728 4.1% 16.4%
2012 SGMA PARTiciPATion ToPline RePoRT 29
Individual Sports (cont.)
Definition 2007 2008 2009 2010 20111 year change
2 year change
*All participation figures are in 000s for the US population ages 6+
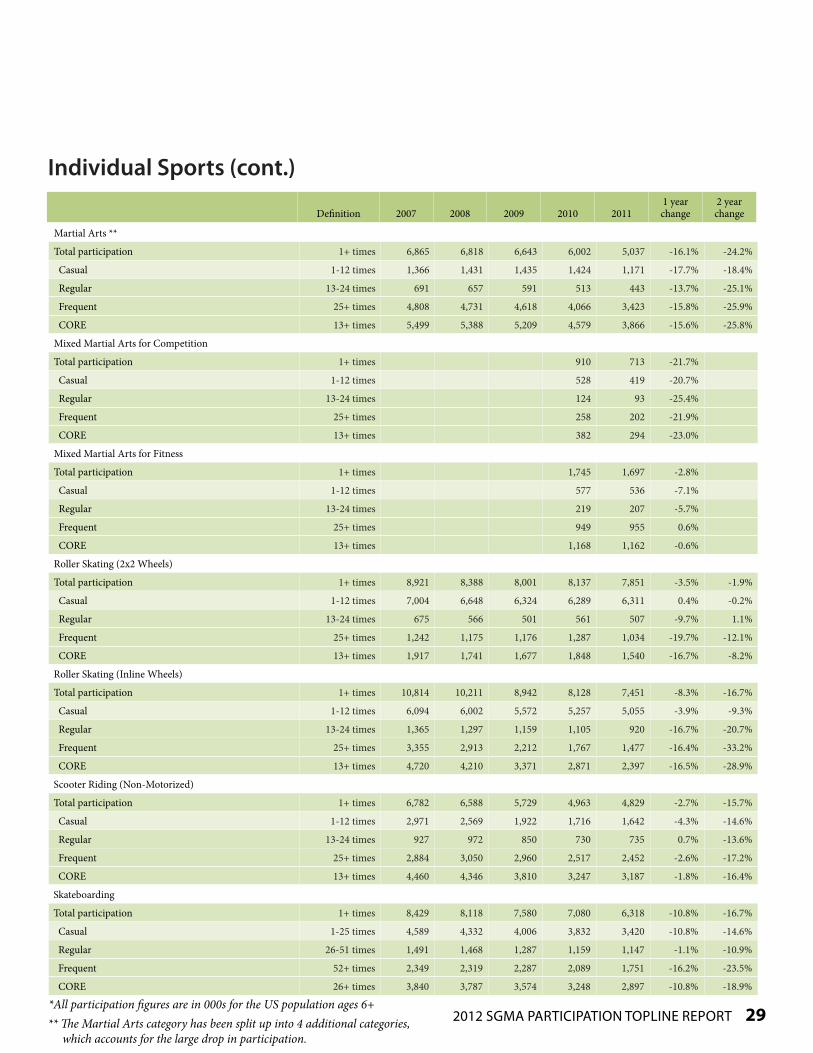
Martial Arts **
Total participation 1+ times 6,865 6,818 6,643 6,002 5,037 -16.1% -24.2%
Casual 1-12 times 1,366 1,431 1,435 1,424 1,171 -17.7% -18.4%
Regular 13-24 times 691 657 591 513 443 -13.7% -25.1%
Frequent 25+ times 4,808 4,731 4,618 4,066 3,423 -15.8% -25.9%
CORE 13+ times 5,499 5,388 5,209 4,579 3,866 -15.6% -25.8%
Mixed Martial Arts for Competition
Total participation 1+ times 910 713 -21.7%
Casual 1-12 times 528 419 -20.7%
Regular 13-24 times 124 93 -25.4%
Frequent 25+ times 258 202 -21.9%
CORE 13+ times 382 294 -23.0%
Mixed Martial Arts for Fitness
Total participation 1+ times 1,745 1,697 -2.8%
Casual 1-12 times 577 536 -7.1%
Regular 13-24 times 219 207 -5.7%
Frequent 25+ times 949 955 0.6%
CORE 13+ times 1,168 1,162 -0.6%
Roller Skating (2x2 Wheels)
Total participation 1+ times 8,921 8,388 8,001 8,137 7,851 -3.5% -1.9%
Casual 1-12 times 7,004 6,648 6,324 6,289 6,311 0.4% -0.2%
Regular 13-24 times 675 566 501 561 507 -9.7% 1.1%
Frequent 25+ times 1,242 1,175 1,176 1,287 1,034 -19.7% -12.1%
CORE 13+ times 1,917 1,741 1,677 1,848 1,540 -16.7% -8.2%
Roller Skating (Inline Wheels)
Total participation 1+ times 10,814 10,211 8,942 8,128 7,451 -8.3% -16.7%
Casual 1-12 times 6,094 6,002 5,572 5,257 5,055 -3.9% -9.3%
Regular 13-24 times 1,365 1,297 1,159 1,105 920 -16.7% -20.7%
Frequent 25+ times 3,355 2,913 2,212 1,767 1,477 -16.4% -33.2%
CORE 13+ times 4,720 4,210 3,371 2,871 2,397 -16.5% -28.9%
Scooter Riding (Non-Motorized)
Total participation 1+ times 6,782 6,588 5,729 4,963 4,829 -2.7% -15.7%
Casual 1-12 times 2,971 2,569 1,922 1,716 1,642 -4.3% -14.6%
Regular 13-24 times 927 972 850 730 735 0.7% -13.6%
Frequent 25+ times 2,884 3,050 2,960 2,517 2,452 -2.6% -17.2%
CORE 13+ times 4,460 4,346 3,810 3,247 3,187 -1.8% -16.4%
Skateboarding
Total participation 1+ times 8,429 8,118 7,580 7,080 6,318 -10.8% -16.7%
Casual 1-25 times 4,589 4,332 4,006 3,832 3,420 -10.8% -14.6%
Regular 26-51 times 1,491 1,468 1,287 1,159 1,147 -1.1% -10.9%
Frequent 52+ times 2,349 2,319 2,287 2,089 1,751 -16.2% -23.5%
CORE 26+ times 3,840 3,787 3,574 3,248 2,897 -10.8% -18.9%
** The Martial Arts category has been split up into 4 additional categories, which accounts for the large drop in participation.

2012 SGMA PARTiciPATion ToPline RePoRT 30
Individual Sports (cont.)
Definition 2007 2008 2009 2010 20111 year change
2 year change
*All participation figures are in 000s for the US population ages 6+
Trail Running
Total participation 1+ times 4,216 4,537 4,845 4,985 5,373 7.8% 10.9%
Triathlon (Non-Traditional/Off Road)
Total participation 1+ times 483 543 634 798 819 2.7% 29.2%
Casual 1 time 121 205 254 206 167 -19.0% -34.3%
Regular 2-9 times 219 208 241 360 400 11.0% 65.8%
Frequent 10+ times 143 130 139 232 253 9.0% 81.4%
CORE 2+ times 362 338 380 570 612 7.2% 60.8%
Triathlon (Traditional/Road)
Total participation 1+ times 798 943 1,148 1,593 1,686 5.8% 46.9%
Casual 1 time 248 300 374 496 519 4.6% 38.6%
Regular 2-9 times 375 436 508 594 655 10.3% 28.8%
Frequent 10+ times 175 207 265 504 513 1.7% 93.2%
CORE 2+ times 550 643 774 1,005 1,047 4.2% 35.2%
Racquet Sports
Definition 2007 2008 2009 2010 20111 year change
2 year change
Badminton
Total participation 1+ times 7,057 7,148 7,469 7,645 7,135 -6.7% -4.5%
Casual 1-12 times 4,785 4,937 5,123 4,973 4,687 -5.8% -8.5%
Regular 13-24 times 910 908 999 1,039 912 -12.2% -8.7%
Frequent 25+ times 1,362 1,304 1,347 1,634 1,536 -6.0% 14.0%
CORE 13+ times 2,272 2,211 2,346 2,672 2,448 -8.4% 4.3%
Cardio Tennis
Total participation 1+ times 830 1,004 1,340 1,293 -3.5% 28.8%
Racquetball
Total participation 1+ times 4,229 4,611 4,784 4,603 4,357 -5.3% -8.9%
Casual 1-12 times 2,292 2,603 2,807 2,754 2,587 -6.1% -7.8%
Regular 13-24 times 544 597 644 616 640 3.9% -0.5%
Frequent 25+ times 1,393 1,412 1,334 1,233 1,131 -8.3% -15.2%
CORE 13+ times 1,937 2,008 1,978 1,849 1,772 -4.2% -10.4%
Squash
Total participation 1+ times 612 659 796 1,031 1,112 7.8% 39.7%
Casual 1-7 times 323 389 512 689 725 5.1% 41.6%
Regular 8-14 times 66 82 119 107 97 -9.3% -18.5%
Frequent 15+ times 223 187 165 235 290 23.4% 75.9%
CORE 8+ times 289 269 284 342 387 13.1% 36.2%

2012 SGMA PARTiciPATion ToPline RePoRT 31
Racquet Sports (cont.)
Definition 2007 2008 2009 2010 20111 year change
2 year change
*All participation figures are in 000s for the US population ages 6+
Table Tennis
Total participation 1+ times 15,955 16,578 18,251 19,374 18,561 -4.2% 1.7%
Casual 1-12 times 10,865 11,530 12,773 13,245 12,963 -2.1% 1.5%
Regular 13-24 times 1,787 1,840 1,950 2,088 1,985 -4.9% 1.8%
Frequent 25+ times 3,303 3,208 3,528 4,041 3,613 -10.6% 2.4%
CORE 13+ times 5,090 5,048 5,478 6,129 5,598 -8.7% 2.2%
Tennis
Total participation 1+ times 16,940 17,749 18,546 18,719 17,772 -5.1% -4.2%
Team Sports
Definition 2007 2008 2009 2010 20111 year change
2 year change
Baseball
Total participation 1+ times 16,058 15,539 14,429 14,198 13,561 -4.5% -6.0%
Casual 1-12 times 4,493 4,674 4,639 4,640 4,212 -9.2% -9.2%
Regular 13-24 times 2,780 2,601 2,387 2,335 2,210 -5.4% -7.4%
Frequent 25+ times 8,785 8,265 7,403 7,223 7,140 -1.1% -3.5%
CORE 13+ times 11,565 10,866 9,790 9,558 9,350 -2.2% -4.5%
Basketball
Total participation 1+ times 25,961 26,108 25,131 25,156 24,790 -1.5% -1.4%
Casual 1-12 times 7,956 8,269 8,070 8,094 8,118 0.3% 0.6%
Regular 13-24 times 4,279 4,138 3,979 3,995 3,980 -0.4% 0.0%
Frequent 25+ times 13,726 13,701 13,082 13,067 12,692 -2.9% -3.0%
CORE 13+ times 18,005 17,839 17,061 17,062 16,672 -2.3% -2.3%
Cheerleading
Total participation 1+ times 3,279 3,192 3,070 3,134 3,049 -2.7% -0.7%
Casual 1-25 times 1,144 1,251 1,309 1,462 1,487 1.7% 13.6%
Regular 26-51 times 649 687 687 616 530 -14.0% -22.9%
Frequent 52+ times 1,485 1,254 1,075 1,057 1,032 -2.3% -4.0%
CORE 26+ times 2,135 1,940 1,761 1,672 1,562 -6.6% -11.3%
Field Hockey
Total participation 1+ times 1,127 1,122 1,092 1,182 1,147 -3.0% 5.0%
Casual 1-7 times 550 560 493 539 536 -0.5% 8.8%
Regular 8-14 times 62 113 168 213 178 -16.2% 6.0%
Frequent 15+ times 515 449 432 432 434 0.5% 0.5%
CORE 8+ times 577 562 600 644 611 -5.1% 1.9%

2012 SGMA PARTiciPATion ToPline RePoRT 32
Team Sports (cont.)
Definition 2007 2008 2009 2010 20111 year change
2 year change
*All participation figures are in 000s for the US population ages 6+
Football (Flag)
Total participation 1+ times 7,310 6,932 6,660 6,325 -5.0% -8.7%
Casual 1-12 times 4,001 3,776 3,623 3,501 -3.4% -7.3%
Regular 13-24 times 1,169 1,237 1,265 1,167 -7.8% -5.7%
Frequent 25+ times 2,140 1,919 1,772 1,658 -6.4% -13.6%
CORE 13+ times 3,309 3,156 3,037 2,825 -7.0% -10.5%
Football (Touch)
Total participation 1+ times 10,493 9,726 8,663 7,684 -11.3% -21.0%
Casual 1-12 times 6,199 5,650 5,024 4,614 -8.2% -18.3%
Regular 13-24 times 1,562 1,482 1,227 942 -23.2% -36.4%
Frequent 25+ times 2,732 2,595 2,413 2,128 -11.8% -18.0%
CORE 13+ times 4,294 4,077 3,639 3,069 -15.7% -24.7%
Football (Tackle)
Total participation 1+ times 7,939 7,816 7,243 6,850 6,448 -5.9% -11.0%
Casual 1-25 times 3,700 3,585 3,291 3,060 2,691 -12.1% -18.2%
Regular 26-51 times 1,578 1,659 1,473 1,228 1,234 0.4% -16.2%
Frequent 52+ times 2,661 2,572 2,480 2,562 2,523 -1.5% 1.8%
CORE 26+ times 4,239 4,230 3,952 3,790 3,757 -0.9% -4.9%
Gymnastics
Total participation 1+ times 4,066 3,975 3,952 4,418 4,824 9.2% 22.1%
Casual 1-49 times 2,262 2,321 2,461 2,734 2,991 9.4% 21.6%
Regular 50-99 times 822 813 785 838 884 5.4% 12.5%
Frequent 100+ times 982 841 707 846 949 12.2% 34.3%
CORE 50+ times 1,804 1,654 1,492 1,684 1,832 8.8% 22.8%
Ice Hockey
Total participation 1+ times 1,840 1,871 2,018 2,140 2,131 -0.4% 5.6%
Casual 1-12 times 558 724 918 1,006 957 -4.9% 4.3%
Regular 13-24 times 254 234 260 267 280 4.9% 7.7%
Frequent 25+ times 1,028 914 841 867 895 3.2% 6.4%
CORE 13+ times 1,282 1,148 1,101 1,134 1,174 3.5% 6.6%
Lacrosse
Total participation 1+ times 1,058 1,092 1,162 1,423 1,501 5.5% 29.1%
Casual 1-12 times 349 456 543 637 701 10.0% 29.2%
Regular 13-24 times 127 155 142 150 148 -1.3% 4.0%
Frequent 25+ times 582 482 477 636 652 2.5% 36.6%
CORE 13+ times 709 637 619 786 800 1.8% 29.1%
Paintball
Total participation 1+ times 5,476 5,167 4,705 4,104 3,606 -12.1% -23.3%
Casual 1-7 times 3,195 3,062 2,886 2,739 2,579 -5.8% -10.6%
Regular 8-14 times 735 760 793 582 386 -33.6% -51.3%
Frequent 15+ times 1,546 1,345 1,027 784 642 -18.1% -37.5%
CORE 8+ times 2,281 2,105 1,820 1,365 1,028 -24.7% -43.5%
2012 SGMA PARTiciPATion ToPline RePoRT 33
Team Sports (cont.)
Definition 2007 2008 2009 2010 20111 year change
2 year change
*All participation figures are in 000s for the US population ages 6+
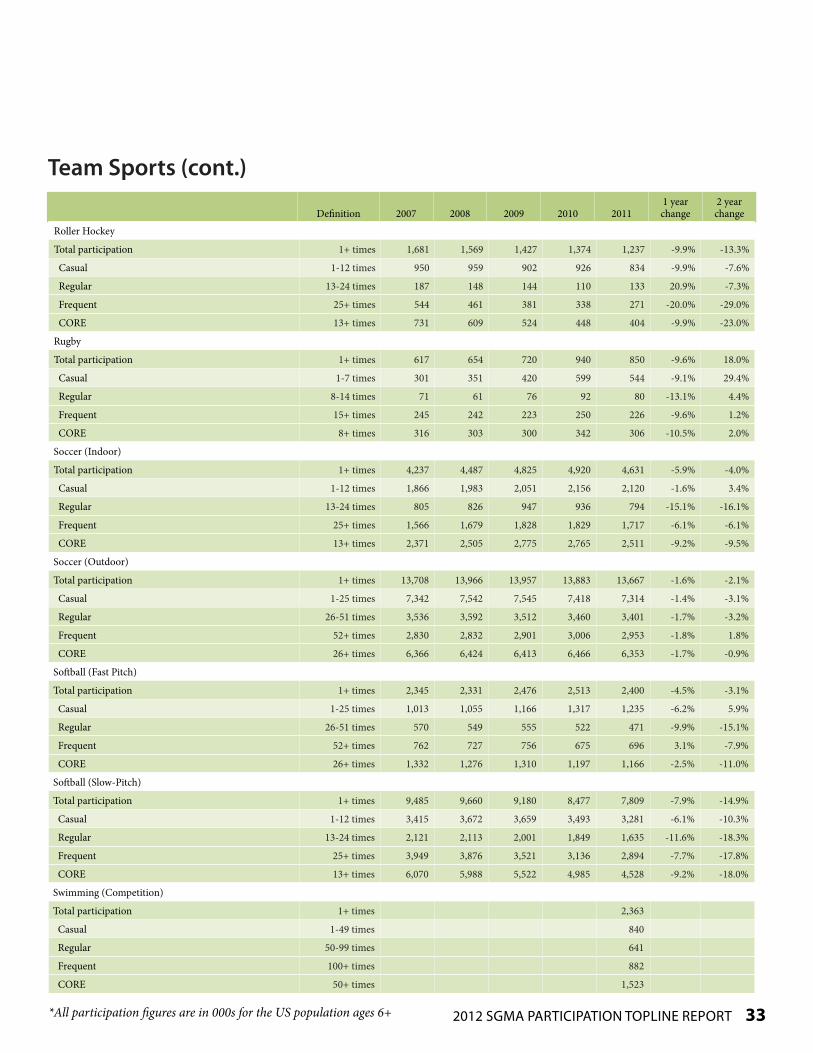
Roller Hockey
Total participation 1+ times 1,681 1,569 1,427 1,374 1,237 -9.9% -13.3%
Casual 1-12 times 950 959 902 926 834 -9.9% -7.6%
Regular 13-24 times 187 148 144 110 133 20.9% -7.3%
Frequent 25+ times 544 461 381 338 271 -20.0% -29.0%
CORE 13+ times 731 609 524 448 404 -9.9% -23.0%
Rugby
Total participation 1+ times 617 654 720 940 850 -9.6% 18.0%
Casual 1-7 times 301 351 420 599 544 -9.1% 29.4%
Regular 8-14 times 71 61 76 92 80 -13.1% 4.4%
Frequent 15+ times 245 242 223 250 226 -9.6% 1.2%
CORE 8+ times 316 303 300 342 306 -10.5% 2.0%
Soccer (Indoor)
Total participation 1+ times 4,237 4,487 4,825 4,920 4,631 -5.9% -4.0%
Casual 1-12 times 1,866 1,983 2,051 2,156 2,120 -1.6% 3.4%
Regular 13-24 times 805 826 947 936 794 -15.1% -16.1%
Frequent 25+ times 1,566 1,679 1,828 1,829 1,717 -6.1% -6.1%
CORE 13+ times 2,371 2,505 2,775 2,765 2,511 -9.2% -9.5%
Soccer (Outdoor)
Total participation 1+ times 13,708 13,966 13,957 13,883 13,667 -1.6% -2.1%
Casual 1-25 times 7,342 7,542 7,545 7,418 7,314 -1.4% -3.1%
Regular 26-51 times 3,536 3,592 3,512 3,460 3,401 -1.7% -3.2%
Frequent 52+ times 2,830 2,832 2,901 3,006 2,953 -1.8% 1.8%
CORE 26+ times 6,366 6,424 6,413 6,466 6,353 -1.7% -0.9%
Softball (Fast Pitch)
Total participation 1+ times 2,345 2,331 2,476 2,513 2,400 -4.5% -3.1%
Casual 1-25 times 1,013 1,055 1,166 1,317 1,235 -6.2% 5.9%
Regular 26-51 times 570 549 555 522 471 -9.9% -15.1%
Frequent 52+ times 762 727 756 675 696 3.1% -7.9%
CORE 26+ times 1,332 1,276 1,310 1,197 1,166 -2.5% -11.0%
Softball (Slow-Pitch)
Total participation 1+ times 9,485 9,660 9,180 8,477 7,809 -7.9% -14.9%
Casual 1-12 times 3,415 3,672 3,659 3,493 3,281 -6.1% -10.3%
Regular 13-24 times 2,121 2,113 2,001 1,849 1,635 -11.6% -18.3%
Frequent 25+ times 3,949 3,876 3,521 3,136 2,894 -7.7% -17.8%
CORE 13+ times 6,070 5,988 5,522 4,985 4,528 -9.2% -18.0%
Swimming (Competition)
Total participation 1+ times 2,363
Casual 1-49 times 840
Regular 50-99 times 641
Frequent 100+ times 882
CORE 50+ times 1,523
2012 SGMA PARTiciPATion ToPline RePoRT 34
Team Sports (cont.)
Definition 2007 2008 2009 2010 20111 year change
2 year change
*All participation figures are in 000s for the US population ages 6+
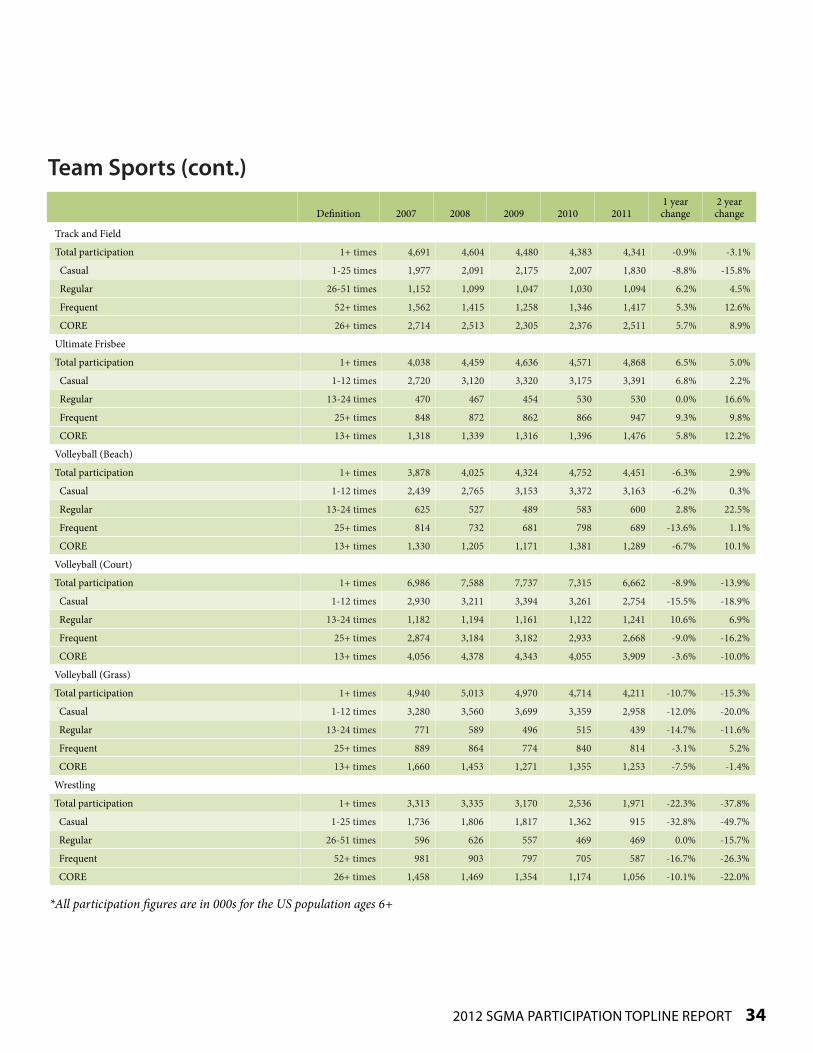
Track and Field
Total participation 1+ times 4,691 4,604 4,480 4,383 4,341 -0.9% -3.1%
Casual 1-25 times 1,977 2,091 2,175 2,007 1,830 -8.8% -15.8%
Regular 26-51 times 1,152 1,099 1,047 1,030 1,094 6.2% 4.5%
Frequent 52+ times 1,562 1,415 1,258 1,346 1,417 5.3% 12.6%
CORE 26+ times 2,714 2,513 2,305 2,376 2,511 5.7% 8.9%
Ultimate Frisbee
Total participation 1+ times 4,038 4,459 4,636 4,571 4,868 6.5% 5.0%
Casual 1-12 times 2,720 3,120 3,320 3,175 3,391 6.8% 2.2%
Regular 13-24 times 470 467 454 530 530 0.0% 16.6%
Frequent 25+ times 848 872 862 866 947 9.3% 9.8%
CORE 13+ times 1,318 1,339 1,316 1,396 1,476 5.8% 12.2%
Volleyball (Beach)
Total participation 1+ times 3,878 4,025 4,324 4,752 4,451 -6.3% 2.9%
Casual 1-12 times 2,439 2,765 3,153 3,372 3,163 -6.2% 0.3%
Regular 13-24 times 625 527 489 583 600 2.8% 22.5%
Frequent 25+ times 814 732 681 798 689 -13.6% 1.1%
CORE 13+ times 1,330 1,205 1,171 1,381 1,289 -6.7% 10.1%
Volleyball (Court)
Total participation 1+ times 6,986 7,588 7,737 7,315 6,662 -8.9% -13.9%
Casual 1-12 times 2,930 3,211 3,394 3,261 2,754 -15.5% -18.9%
Regular 13-24 times 1,182 1,194 1,161 1,122 1,241 10.6% 6.9%
Frequent 25+ times 2,874 3,184 3,182 2,933 2,668 -9.0% -16.2%
CORE 13+ times 4,056 4,378 4,343 4,055 3,909 -3.6% -10.0%
Volleyball (Grass)
Total participation 1+ times 4,940 5,013 4,970 4,714 4,211 -10.7% -15.3%
Casual 1-12 times 3,280 3,560 3,699 3,359 2,958 -12.0% -20.0%
Regular 13-24 times 771 589 496 515 439 -14.7% -11.6%
Frequent 25+ times 889 864 774 840 814 -3.1% 5.2%
CORE 13+ times 1,660 1,453 1,271 1,355 1,253 -7.5% -1.4%
Wrestling
Total participation 1+ times 3,313 3,335 3,170 2,536 1,971 -22.3% -37.8%
Casual 1-25 times 1,736 1,806 1,817 1,362 915 -32.8% -49.7%
Regular 26-51 times 596 626 557 469 469 0.0% -15.7%
Frequent 52+ times 981 903 797 705 587 -16.7% -26.3%
CORE 26+ times 1,458 1,469 1,354 1,174 1,056 -10.1% -22.0%
2012 SGMA PARTiciPATion ToPline RePoRT 35
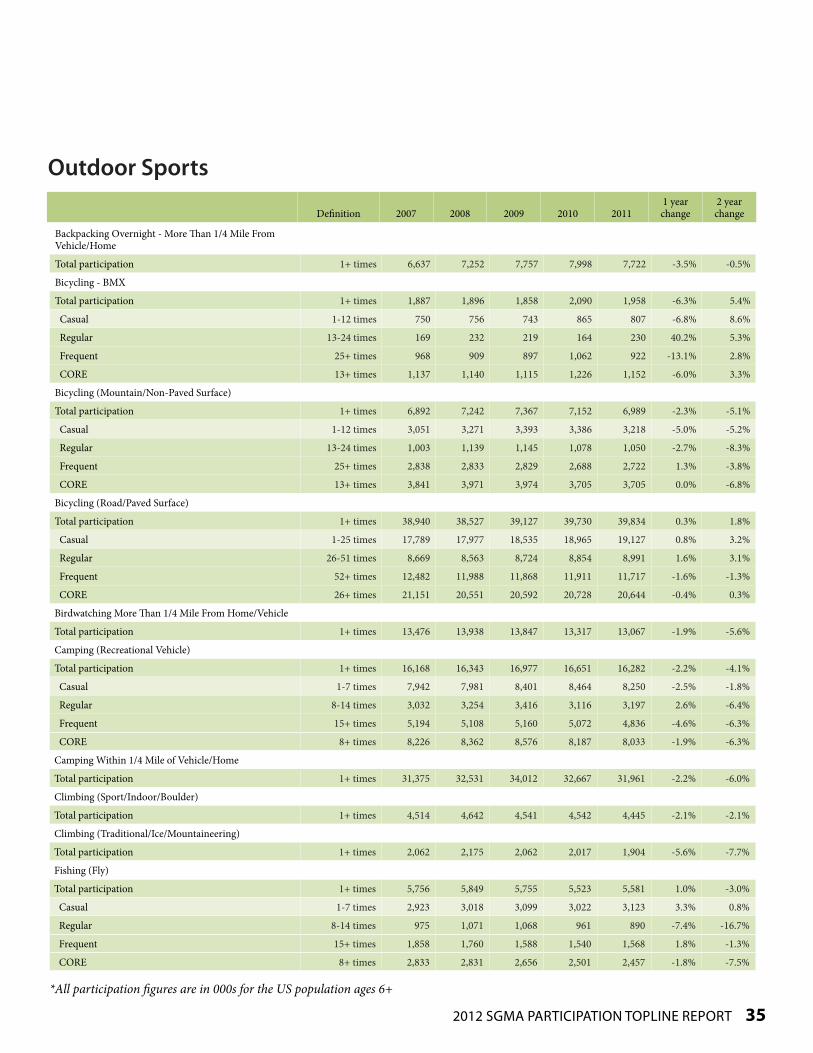
Outdoor Sports
Definition 2007 2008 2009 2010 20111 year change
2 year change
*All participation figures are in 000s for the US population ages 6+
Backpacking Overnight - More Than 1/4 Mile From Vehicle/Home
Total participation 1+ times 6,637 7,252 7,757 7,998 7,722 -3.5% -0.5%
Bicycling - BMX
Total participation 1+ times 1,887 1,896 1,858 2,090 1,958 -6.3% 5.4%
Casual 1-12 times 750 756 743 865 807 -6.8% 8.6%
Regular 13-24 times 169 232 219 164 230 40.2% 5.3%
Frequent 25+ times 968 909 897 1,062 922 -13.1% 2.8%
CORE 13+ times 1,137 1,140 1,115 1,226 1,152 -6.0% 3.3%
Bicycling (Mountain/Non-Paved Surface)
Total participation 1+ times 6,892 7,242 7,367 7,152 6,989 -2.3% -5.1%
Casual 1-12 times 3,051 3,271 3,393 3,386 3,218 -5.0% -5.2%
Regular 13-24 times 1,003 1,139 1,145 1,078 1,050 -2.7% -8.3%
Frequent 25+ times 2,838 2,833 2,829 2,688 2,722 1.3% -3.8%
CORE 13+ times 3,841 3,971 3,974 3,705 3,705 0.0% -6.8%
Bicycling (Road/Paved Surface)
Total participation 1+ times 38,940 38,527 39,127 39,730 39,834 0.3% 1.8%
Casual 1-25 times 17,789 17,977 18,535 18,965 19,127 0.8% 3.2%
Regular 26-51 times 8,669 8,563 8,724 8,854 8,991 1.6% 3.1%
Frequent 52+ times 12,482 11,988 11,868 11,911 11,717 -1.6% -1.3%
CORE 26+ times 21,151 20,551 20,592 20,728 20,644 -0.4% 0.3%
Birdwatching More Than 1/4 Mile From Home/Vehicle
Total participation 1+ times 13,476 13,938 13,847 13,317 13,067 -1.9% -5.6%
Camping (Recreational Vehicle)
Total participation 1+ times 16,168 16,343 16,977 16,651 16,282 -2.2% -4.1%
Casual 1-7 times 7,942 7,981 8,401 8,464 8,250 -2.5% -1.8%
Regular 8-14 times 3,032 3,254 3,416 3,116 3,197 2.6% -6.4%
Frequent 15+ times 5,194 5,108 5,160 5,072 4,836 -4.6% -6.3%
CORE 8+ times 8,226 8,362 8,576 8,187 8,033 -1.9% -6.3%
Camping Within 1/4 Mile of Vehicle/Home
Total participation 1+ times 31,375 32,531 34,012 32,667 31,961 -2.2% -6.0%
Climbing (Sport/Indoor/Boulder)
Total participation 1+ times 4,514 4,642 4,541 4,542 4,445 -2.1% -2.1%
Climbing (Traditional/Ice/Mountaineering)
Total participation 1+ times 2,062 2,175 2,062 2,017 1,904 -5.6% -7.7%
Fishing (Fly)
Total participation 1+ times 5,756 5,849 5,755 5,523 5,581 1.0% -3.0%
Casual 1-7 times 2,923 3,018 3,099 3,022 3,123 3.3% 0.8%
Regular 8-14 times 975 1,071 1,068 961 890 -7.4% -16.7%
Frequent 15+ times 1,858 1,760 1,588 1,540 1,568 1.8% -1.3%
CORE 8+ times 2,833 2,831 2,656 2,501 2,457 -1.8% -7.5%

2012 SGMA PARTiciPATion ToPline RePoRT 36
Outdoor Sports (cont.)
Definition 2007 2008 2009 2010 20111 year change
2 year change
*All participation figures are in 000s for the US population ages 6+
Fishing (Freshwater-Other)
Total participation 1+ times 43,859 42,095 40,646 39,911 38,864 -2.6% -4.4%
Casual 1-7 times 20,145 19,531 19,499 19,577 19,363 -1.1% -0.7%
Regular 8-14 times 8,262 7,825 7,421 7,350 7,408 0.8% -0.2%
Frequent 15+ times 15,452 14,740 13,727 12,984 12,093 -6.9% -11.9%
CORE 8+ times 23,714 22,565 21,147 20,334 19,501 -4.1% -7.8%
Fishing (Saltwater)
Total participation 1+ times 14,437 14,121 13,054 12,056 11,896 -1.3% -8.9%
Casual 1-7 times 8,460 8,438 7,866 7,138 7,119 -0.3% -9.5%
Regular 8-14 times 2,169 2,110 1,896 1,847 1,932 4.6% 1.9%
Frequent 15+ times 3,808 3,574 3,293 3,071 2,845 -7.4% -13.6%
CORE 8+ times 5,977 5,683 5,188 4,918 4,777 -2.9% -7.9%
Hiking (Day)
Total participation 1+ times 29,965 31,238 32,542 32,534 33,494 3.0% 2.9%
Hunting (Bow)
Total participation 1+ times 3,818 3,770 3,974 4,067 4,271 5.0% 7.5%
Casual 1-7 times 1,718 1,730 1,937 1,972 1,883 -4.5% -2.8%
Regular 8-14 times 596 625 720 857 918 7.1% 27.5%
Frequent 15+ times 1,504 1,415 1,317 1,239 1,471 18.7% 11.7%
CORE 8+ times 2,100 2,040 2,037 2,096 2,388 13.9% 17.2%
Hunting (Handgun)
Total participation 1+ times 2,595 2,734 2,575 2,493 2,690 7.9% 4.5%
Casual 1-7 times 1,572 1,674 1,614 1,581 1,613 2.1% 0.0%
Regular 8-14 times 449 472 401 403 471 17.0% 17.6%
Frequent 15+ times 574 588 561 510 606 18.9% 8.1%
CORE 8+ times 1,023 1,060 961 912 1,078 18.1% 12.1%
Hunting (Rifle)
Total participation 1+ times 10,635 10,490 10,729 10,632 10,479 -1.4% -2.3%
Casual 1-12 times 6,960 6,959 7,507 7,676 7,338 -4.4% -2.3%
Regular 13-24 times 1,742 1,795 1,780 1,628 1,653 1.5% -7.2%
Frequent 25+ times 1,933 1,736 1,442 1,328 1,488 12.1% 3.2%
CORE 13+ times 3,675 3,530 3,222 2,956 3,140 6.2% -2.5%
Hunting (Shotgun)
Total participation 1+ times 8,545 8,638 8,611 8,276 8,370 1.1% -2.8%
Casual 1-7 times 4,171 4,322 4,620 4,489 4,244 -5.4% -8.1%
Regular 8-14 times 1,797 1,816 1,735 1,712 1,746 2.0% 0.6%
Frequent 15+ times 2,577 2,500 2,256 2,076 2,380 14.6% 5.5%
CORE 8+ times 4,374 4,316 3,991 3,788 4,126 8.9% 3.4%
2012 SGMA PARTiciPATion ToPline RePoRT 37
Outdoor Sports (cont.)
Definition 2007 2008 2009 2010 20111 year change
2 year change
*All participation figures are in 000s for the US population ages 6+
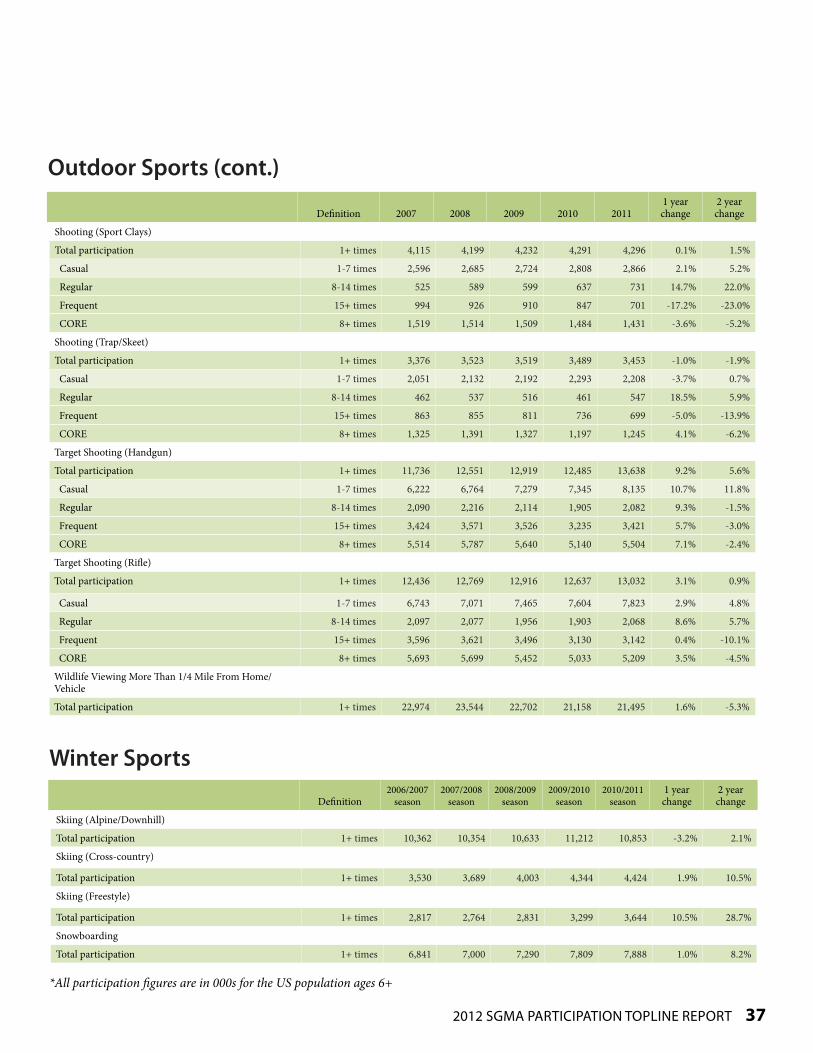
Shooting (Sport Clays)
Total participation 1+ times 4,115 4,199 4,232 4,291 4,296 0.1% 1.5%
Casual 1-7 times 2,596 2,685 2,724 2,808 2,866 2.1% 5.2%
Regular 8-14 times 525 589 599 637 731 14.7% 22.0%
Frequent 15+ times 994 926 910 847 701 -17.2% -23.0%
CORE 8+ times 1,519 1,514 1,509 1,484 1,431 -3.6% -5.2%
Shooting (Trap/Skeet)
Total participation 1+ times 3,376 3,523 3,519 3,489 3,453 -1.0% -1.9%
Casual 1-7 times 2,051 2,132 2,192 2,293 2,208 -3.7% 0.7%
Regular 8-14 times 462 537 516 461 547 18.5% 5.9%
Frequent 15+ times 863 855 811 736 699 -5.0% -13.9%
CORE 8+ times 1,325 1,391 1,327 1,197 1,245 4.1% -6.2%
Target Shooting (Handgun)
Total participation 1+ times 11,736 12,551 12,919 12,485 13,638 9.2% 5.6%
Casual 1-7 times 6,222 6,764 7,279 7,345 8,135 10.7% 11.8%
Regular 8-14 times 2,090 2,216 2,114 1,905 2,082 9.3% -1.5%
Frequent 15+ times 3,424 3,571 3,526 3,235 3,421 5.7% -3.0%
CORE 8+ times 5,514 5,787 5,640 5,140 5,504 7.1% -2.4%
Target Shooting (Rifle)
Total participation 1+ times 12,436 12,769 12,916 12,637 13,032 3.1% 0.9%
Casual 1-7 times 6,743 7,071 7,465 7,604 7,823 2.9% 4.8%
Regular 8-14 times 2,097 2,077 1,956 1,903 2,068 8.6% 5.7%
Frequent 15+ times 3,596 3,621 3,496 3,130 3,142 0.4% -10.1%
CORE 8+ times 5,693 5,699 5,452 5,033 5,209 3.5% -4.5%
Wildlife Viewing More Than 1/4 Mile From Home/Vehicle
Total participation 1+ times 22,974 23,544 22,702 21,158 21,495 1.6% -5.3%
Winter Sports
Definition2006/2007
season2007/2008
season2008/2009
season2009/2010
season2010/2011
season1 year change
2 year change
Skiing (Alpine/Downhill)
Total participation 1+ times 10,362 10,354 10,633 11,212 10,853 -3.2% 2.1%
Skiing (Cross-country)
Total participation 1+ times 3,530 3,689 4,003 4,344 4,424 1.9% 10.5%
Skiing (Freestyle)
Total participation 1+ times 2,817 2,764 2,831 3,299 3,644 10.5% 28.7%
Snowboarding
Total participation 1+ times 6,841 7,000 7,290 7,809 7,888 1.0% 8.2%

2012 SGMA PARTiciPATion ToPline RePoRT 38
Winter Sports (cont.)
Definition2006/2007
season2007/2008
season2008/2009
season2009/2010
season2010/2011
season1 year change
2 year change
*All participation figures are in 000s for the US population ages 6+
Snowmobiling
Total participation 1+ times 4,811 4,736 4,729 4,957 4,908 -1.0% 3.8%
Casual 1-7 times 2,814 2,866 2,956 3,086 3,301 7.0% 11.7%
Regular 8-14 times 799 670 701 785 660 -15.9% -5.8%
Frequent 15+ times 1,198 1,200 1,072 1,086 947 -12.8% -11.7%
CORE 8+ times 1,997 1,870 1,773 1,871 1,607 -14.1% -9.4%
Snowshoeing
Total participation 1+ times 2,400 2,661 3,177 3,627 3,967 9.4% 24.9%
Telemarking (Downhill)
Total participation 1+ times 1,173 1,304 1,459 1,652 1,960 18.7% 34.4%
Water Sports
Definition 2007 2008 2009 2010 20111 year change
2 year change
Boardsailing/Windsurfing
Total participation 1+ times 1,118 1,213 1,218 1,373 1,384 0.8% 13.7%
Casual 1-7 times 796 883 917 946 941 -0.5% 2.7%
Regular 8-14 times 121 122 117 216 200 -7.6% 70.5%
Frequent 15+ times 201 209 184 211 244 15.4% 32.3%
CORE 8+ times 322 331 302 428 444 3.7% 47.1%
Canoeing
Total participation 1+ times 9,797 9,866 9,997 10,306 10,170 -1.3% 1.7%
Jet Skiing
Total participation 1+ times 8,055 7,935 7,770 7,739 7,574 -2.1% -2.5%
Casual 1-7 times 4,919 5,027 5,138 5,203 5,400 3.8% 5.1%
Regular 8-14 times 1,217 1,127 1,077 1,097 927 -15.5% -13.9%
Frequent 15+ times 1,919 1,781 1,556 1,439 1,248 -13.3% -19.8%
CORE 8+ times 2,727 2,703 2,632 2,536 2,174 -14.3% -17.4%
Kayaking (Recreational)
Total participation 1+ times 5,070 5,655 6,226 6,339 7,347 15.9% 18.0%
Kayaking (Sea/Touring)
Total participation 1+ times 1,485 1,633 1,776 1,958 2,087 6.6% 17.5%
Kayaking (White Water)
Total participation 1+ times 1,207 1,225 1,306 1,606 1,694 5.5% 29.8%
Rafting
Total participation 1+ times 4,340 4,496 4,485 4,389 4,141 -5.7% -7.7%

2012 SGMA PARTiciPATion ToPline RePoRT 39
Water Sports (cont.)
Definition 2007 2008 2009 2010 20111 year change
2 year change
*All participation figures are in 000s for the US population ages 6+
Sailing
Total participation 1+ times 3,786 4,006 4,284 4,106 3,797 -7.5% -11.4%
Casual 1-7 times 2,264 2,452 2,687 2,604 2,470 -5.2% -8.1%
Regular 8-14 times 696 665 650 611 516 -15.6% -20.6%
Frequent 15+ times 826 890 948 891 812 -8.9% -14.3%
CORE 8+ times 1,421 1,503 1,598 1,502 1,328 -11.6% -16.9%
Scuba Diving
Total participation 1+ times 2,965 3,091 2,970 2,938 2,866 -2.5% -3.5%
Casual 1-7 times 1,947 2,065 2,015 2,014 2,027 0.7% 0.6%
Regular 8-14 times 445 494 464 438 424 -3.1% -8.6%
Frequent 15+ times 573 532 491 488 416 -14.8% -15.3%
CORE 8+ times 1,018 1,026 955 925 840 -9.2% -12.0%
Snorkeling
Total participation 1+ times 9,294 9,795 9,827 9,332 9,312 -0.2% -5.2%
Casual 1-7 times 7,168 7,568 7,716 7,329 7,272 -0.8% -5.8%
Regular 8-14 times 1,142 1,187 1,169 1,154 1,184 2.6% 1.2%
Frequent 15+ times 984 1,040 942 850 857 0.9% -9.0%
CORE 8+ times 1,919 2,124 2,111 2,003 2,041 1.9% -3.3%
Stand-Up Paddling
Total participation 1+ times 1,050 1,146 9.1%
Surfing
Total participation 1+ times 2,206 2,407 2,505 2,585 2,481 -4.0% -1.0%
Casual 1-7 times 1,256 1,408 1,429 1,423 1,462 2.7% 2.3%
Regular 8-14 times 402 333 331 440 414 -5.9% 25.3%
Frequent 15+ times 548 667 746 722 605 -16.2% -18.9%
CORE 8+ times 950 999 1,077 1,162 1,019 -12.3% -5.3%
Wakeboarding
Total participation 1+ times 3,521 3,532 3,561 3,611 3,517 -2.6% -1.2%
Casual 1-7 times 2,405 2,409 2,418 2,462 2,378 -3.4% -1.7%
Regular 8-14 times 451 494 534 550 515 -6.3% -3.5%
Frequent 15+ times 665 630 609 601 625 4.1% 2.6%
CORE 8+ times 1,116 1,124 1,143 1,150 1,141 -0.8% -0.2%
Water Skiing
Total participation 1+ times 5,918 5,756 5,228 4,849 4,626 -4.6% -11.5%
Casual 1-7 times 3,811 3,796 3,545 3,278 3,094 -5.6% -12.7%
Regular 8-14 times 805 825 801 797 756 -5.2% -5.6%
Frequent 15+ times 1,302 1,134 883 774 776 0.3% -12.1%
CORE 8+ times 2,107 1,959 1,683 1,571 1,532 -2.5% -9.0%

2012 SGMA PARTiciPATion ToPline RePoRT 40
Disclaimer While proper due care and diligence has been taken in the preparation of this document, The Physical Activity Coun-cil cannot guarantee the accuracy of the information contained and does not accept any liability for any loss or damage caused as a result of using information or recommendations contained within this document.
©2012 Physical Activity CouncilNo part of the report may be reproduced or transmitted in any form or by any means, including photocopying, without the written permission of The Physical Activity Council, any application for which should be addressed to The Physical Activity Council. Written permission must also be obtained before any part of the report is stored in a retrieval system of any nature. Contact: Sports Marketing Survey USA at (561) 427-0647 or [email protected].
The 2012 Participation Topline Report is brought to you by
About SGMA ResearchSGMA Research, powered by Sports Marketing Surveys USA (SMS) is the sole provider of marketing research and analy-sis for the Sporting Goods Manufacturers Association, (SGMA). This partnership places SMS at the forefront when it comes to marketing research for all things sport, sports participation and current trends in sports.
Sports Marketing Surveys USA has been in business since 1985, providing quantitative and qualitative marketing research and information for many of the leading manufacturers and organizations throughout the industry.
• Quantitative and Qualitative Consumer Research
• Dealer Studies
• Market Trend Analysis
• Sponsorship Evaluation
• Market Size Evaluations
• New Product Feasibility Studies
Sporting Goods Manufacturers Association8505 Fenton Street, Suite 211
Silver Spring, MD 20910p: 301.495.6321f: 301.495.6322
SGMA Research/Sports Marketing Surveys USA6650 West Indiantown Road, Suite 220
Jupiter, FL 33458p: 561.427.0647f: 561.427.0648