spontaneously t1-hyperintense lesions of the brain on mri: a
TRANSCRIPT
Spontaneously T1-Hyperintense Lesions of theBrain on MRI: A Pictorial Review
Sinan Cakirer, MD, Ercan Karaarslan, MD, and Arzu Arslan, MD
In this work, the brain lesions that cause spontaneouslyhyperintense T1 signal on MRI were studied under sevencategories. The first category includes lesions with hemor-rhagic components, such as infarct, encephalitis, intrapa-renchymal hematoma, cortical contusion, diffuse axonalinjury, subarachnoid hemorrhage, subdural and epiduralhematoma, intraventricular hemorrhage, vascular malfor-mation and aneurysm, and hemorrhagic neoplasm. Thesecond category includes protein-containing lesions, suchas colloid cyst, craniopharyngioma, Rathke’s cleft cyst, andatypical epidermoid. The third category includes lesionswith fatty components, such as lipoma, dermoid, andlipomatous meningioma. Lesions with calcification or ossi-fication, such as endocrine-metabolic disorder, calcifiedneoplasm, infection, and dural osteoma, constitute thefourth category, whereas the fifth category includes lesionswith other mineral accumulation, such as acquired hepato-cerebral degeneration and Wilson disease. The sixth cate-gory includes melanin-containing lesions, such as metasta-sis from melanoma and leptomeningeal melanosis. The lastcategory is the miscellaneous group, which includes ectopicneurohypophysis, chronic stages of multiple sclerosis, andneurofibromatosis type I. The above-mentioned lesions arepresented with their typical T1-hyperintense images, andthe underlying reasons for those appearances in magneticresonance imaging are discussed.
The brain lesions that cause spontaneous T1 shorten-ing on magnetic resonance imaging (MRI) were stud-ied under seven categories in this article. These cate-gories have included lesions with hemorrhagiccomponents, protein-containing lesions, fatty lesions,
lesions with calcification or ossification, lesions withother mineral accumulation, melanin-containing le-sions, and a miscellaneous group (Table 1).
The purpose of our study is to review, illustrate, anddiscuss the MRI findings of the brain lesions causingT1 shortening with their typical T1-hyperintense ap-pearances. The role of MRI in evaluating such lesionshas been emphasized.
Lesions with Hemorrhagic ComponentsBrain Infarcts
Infarction of brain tissue usually result from vascu-lar occlusive diseases involving arteries or (veryrarely) veins. The arteries may be occluded for avariety of reasons, most commonly because of athero-sclerotic arterial disease, followed by cardiovasculo-genic embolic occlusion, hypercoagulable states, arte-rial dissection, congenital anomalies, and neoplasticinfiltration or constriction of the arteries. Although thearterial occlusion causes infarction of a specific vas-cular territory of the brain with the involvement ofcortical gray matter and subcortical white matter,venous occlusions secondary to thrombophlebitis, hy-percoagulable states, dehydration, oral contraceptiveusage, and tumoral encasement lead to areas of infarc-tion that do not correspond to arterial distributions andprimarily affect the subcortical white matter ratherthan cortical gray matter.1-4
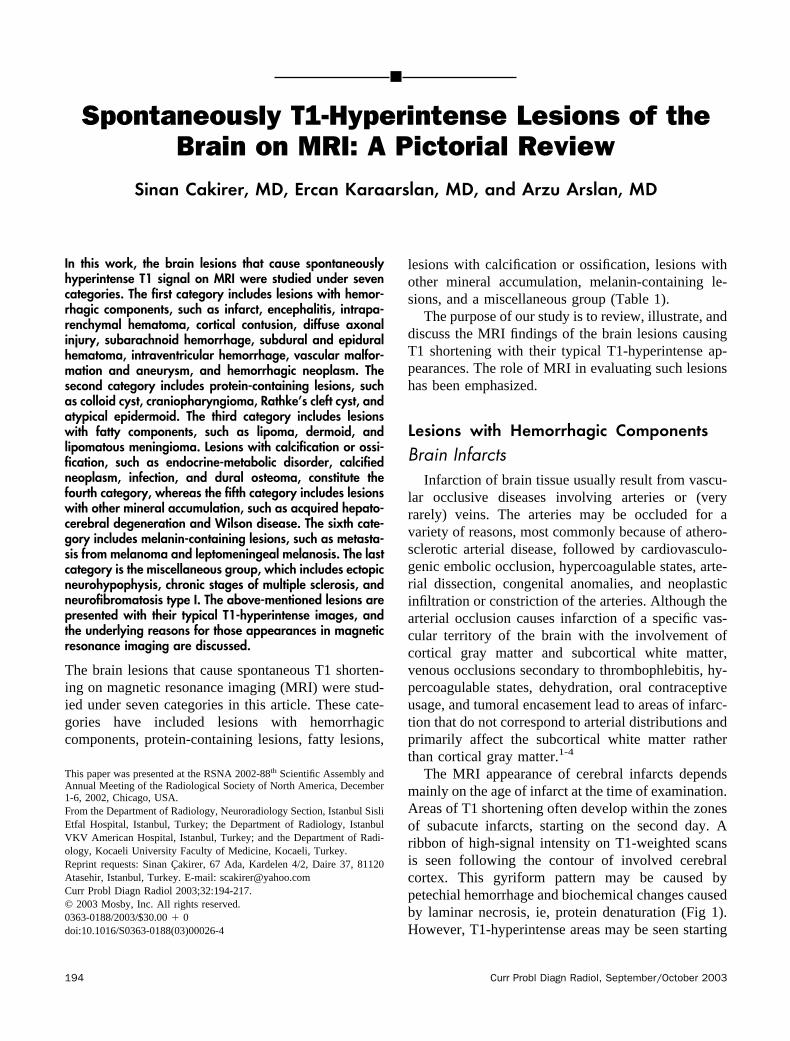
The MRI appearance of cerebral infarcts dependsmainly on the age of infarct at the time of examination.Areas of T1 shortening often develop within the zonesof subacute infarcts, starting on the second day. Aribbon of high-signal intensity on T1-weighted scansis seen following the contour of involved cerebralcortex. This gyriform pattern may be caused bypetechial hemorrhage and biochemical changes causedby laminar necrosis, ie, protein denaturation (Fig 1).However, T1-hyperintense areas may be seen starting
This paper was presented at the RSNA 2002-88th Scientific Assembly andAnnual Meeting of the Radiological Society of North America, December1-6, 2002, Chicago, USA.From the Department of Radiology, Neuroradiology Section, Istanbul SisliEtfal Hospital, Istanbul, Turkey; the Department of Radiology, IstanbulVKV American Hospital, Istanbul, Turkey; and the Department of Radi-ology, Kocaeli University Faculty of Medicine, Kocaeli, Turkey.Reprint requests: Sinan Cakirer, 67 Ada, Kardelen 4/2, Daire 37, 81120Atasehir, Istanbul, Turkey. E-mail: [email protected] Probl Diagn Radiol 2003;32:194-217.© 2003 Mosby, Inc. All rights reserved.0363-0188/2003/$30.00 � 0doi:10.1016/S0363-0188(03)00026-4
194 Curr Probl Diagn Radiol, September/October 2003

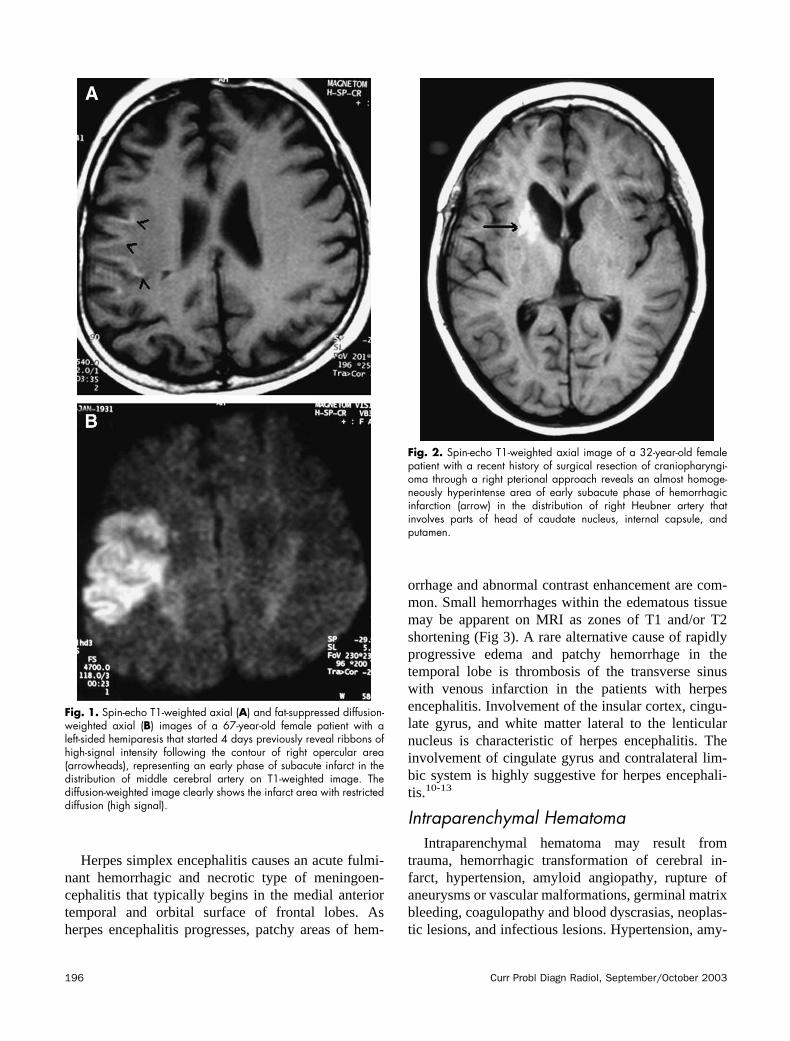
from the second day of infarct until the end of secondmonth if there is an associated area of hemorrhagesecondary to the dissolution of an embolus allowing areperfusion hemorrhage or to anticoagulant treatment(Fig 2). Multifocal hemorrhagic infarcts suggest anembolic source, such as subacute bacterial endocardi-tis. It is important to remember that hemorrhage withincerebral infarcts may mimic other causes of atypicalhematomas, such as hemorrhagic neoplasms. Venouspathologies, such as dural sinus thrombosis, shouldalso be considered as the underlying reason of hem-orrhagic cerebral infarction. Additional T2-weightedMRI sequences help to determine the exact stage of
infarct. Diffusion-weighted images show restricteddiffusion (high signal) in cerebral infarcts (Fig 1).1,3-9
InfectionsEncephalitis is a diffuse inflammatory state of brain
tissue and most commonly develops secondary to viralinfections. Viral encephalitis is usually seen in immu-nocompromised patients. Herpes encephalitis is themost common sporadic encephalitis in temperate cli-mates and is caused by herpes simplex type I. Otherless-common viral agents are cytomegalovirus, humanimmunodeficiency virus (HIV-1), and varicella-zostervirus.10,11
TABLE 1. The lesions of brain with spontaneous T1 hyperintense signal characteristics on MRI1. Hemorrhagic lesions
A. Infarcts: Subacture phase of arterial infarct associated with gyral hemorrhage and protein denaturation, embolic infarct associatedwith reperfusion, and venous infarct
B. Infections, eg, herpes simplex encephalitis, cytomegalovirus encephalitis, and HIV encephalitisC. Intraparenchymal hematoma: Traumatic, profuse hemorrhagic infarct, hypertensive hematoma, secondary to aneurysms and vascular
malformations, germinal matrix bleeding, amyloid angiopathy, coagulopathies, and blood dyscrasiasD. Cortical contusionsE. Diffuse axonal injuriesF. Subarachnoid hemorrhage: Traumatic, secondary to aneurysms and vascular malformationsG. Subdural and eipdural hematomaH. Intraventricular hemorrhage: Traumatic, secondary to aneurysms and vascular malformations, periventricular hematomas dissectiing
into ventricles, germinal matrix bleeding, amyloid angiopathy, coagulopathies, and blood dyscrasiasI. Vascular malformations and aneurysms associated with intra- or perilesional hemorrhage and/or thrombosis: AVM, cavernous
malformation. aneurysmJ. Hemorrhagic neoplasms: Primary tumors such as pituitary adenomas, anaplastic astrocytoma, oligodendroglioma, glioblastoma
multiforme, and lymphoma (in immunocompromised patients); secondary tumors such as metastasis from melanoma, renal cellcarcinoma, choriocarcinoma, brochogenic carcinoma, and thyroid carcinoma
2. Protein-containing lesionsA. Colloid cyst of third ventricleB. CraniopharynigomaC. Rathke’s cleft cystD. Atypical epidermoid
3. Fatty lesionsA. Lipoma: pericallosal, cisternal, and intraventricularB. DermoidC. Lipomatous meningioma
4. Calcified/ossified lesionsA. Endocrine-metabolic disorders: Hypo- or hyperparathyroidism, hypothryoidism, mitochondrial encephalopathies, Fahr disease (familial
cerebrovascular ferrocalcinosis), carbon monoxide poisoning, and idiopathic calcificationB. Calcified neoplasms: Craniopharyngioma, oligodendroglioma, choroid plexus papilloma, meningioma, pituitary adenoma, astrocytoma,
pericallosal lipoma, ependymoma, metastases from lung, breast, and gastrointestinal carcinomasC. Infections: Toxoplasmosis, cytomegalovirus, rubella, herpes, tuberculosis, and cysticercosis infectionsD. Dural osteomas
5. Lesions with other mineral accumulationA. Acquired hepatocerebral degenerationB. Wilson’s disease
6. Melanin-containing lesionsA. Melanoma metastasesB. Leptomeningeal melanosis
7. MiscellaneousA. Ectopic neurohypophysisB. Multiple sclerosis (chronic stage)C. Neurofibromatosis type I
Curr Probl Diagn Radiol, September/October 2003 195
Herpes simplex encephalitis causes an acute fulmi-nant hemorrhagic and necrotic type of meningoen-cephalitis that typically begins in the medial anteriortemporal and orbital surface of frontal lobes. Asherpes encephalitis progresses, patchy areas of hem-
orrhage and abnormal contrast enhancement are com-mon. Small hemorrhages within the edematous tissuemay be apparent on MRI as zones of T1 and/or T2shortening (Fig 3). A rare alternative cause of rapidlyprogressive edema and patchy hemorrhage in thetemporal lobe is thrombosis of the transverse sinuswith venous infarction in the patients with herpesencephalitis. Involvement of the insular cortex, cingu-late gyrus, and white matter lateral to the lenticularnucleus is characteristic of herpes encephalitis. Theinvolvement of cingulate gyrus and contralateral lim-bic system is highly suggestive for herpes encephali-tis.10-13
Intraparenchymal HematomaIntraparenchymal hematoma may result from
trauma, hemorrhagic transformation of cerebral in-farct, hypertension, amyloid angiopathy, rupture ofaneurysms or vascular malformations, germinal matrixbleeding, coagulopathy and blood dyscrasias, neoplas-tic lesions, and infectious lesions. Hypertension, amy-
Fig. 1. Spin-echo T1-weighted axial (A) and fat-suppressed diffusion-weighted axial (B) images of a 67-year-old female patient with aleft-sided hemiparesis that started 4 days previously reveal ribbons ofhigh-signal intensity following the contour of right opercular area(arrowheads), representing an early phase of subacute infarct in thedistribution of middle cerebral artery on T1-weighted image. Thediffusion-weighted image clearly shows the infarct area with restricteddiffusion (high signal).
Fig. 2. Spin-echo T1-weighted axial image of a 32-year-old femalepatient with a recent history of surgical resection of craniopharyngi-oma through a right pterional approach reveals an almost homoge-neously hyperintense area of early subacute phase of hemorrhagicinfarction (arrow) in the distribution of right Heubner artery thatinvolves parts of head of caudate nucleus, internal capsule, andputamen.
196 Curr Probl Diagn Radiol, September/October 2003
loid angiopathy, and coagulopathy are the most com-mon causes of nontraumatic intracranial hemorrhagein the elderly, whereas patients younger than 50usually have underlying vascular malformations andaneurysms. Hypertensive bleeding is frequently ob-served in the region of the basal ganglia, thalami, andinternal capsules (Fig 4). Lobar or subcortical locationof hematomas is generally seen with amyloid angiop-athy, vascular malformations, and aneurysms. Hemor-rhagic transformation of cerebral infarcts is usuallyseen 24 to 48 hours after the initial formation ofinfarct. It has a common predilection for the basalganglia (Fig 5) and the cortex, and deep hemorrhagicinfarctions are often associated with proximal middlecerebral artery occlusion.11,14-21
The signal-intensity characteristics of an intracra-nial hematoma depend on several factors, the mostimportant of which are listed as the age, size, location,hemoglobin oxidation state of hematoma, degree ofclot retraction, extent of edema around hematoma, andhematocrit level of the patient. The MRI appearance ofintracerebral hemorrhage on T1-weighted scanschanges during the first week of bleeding. Iron ofhemoglobin in the �2 state becomes oxidized to the�3 state in methemoglobin, which is strongly para-
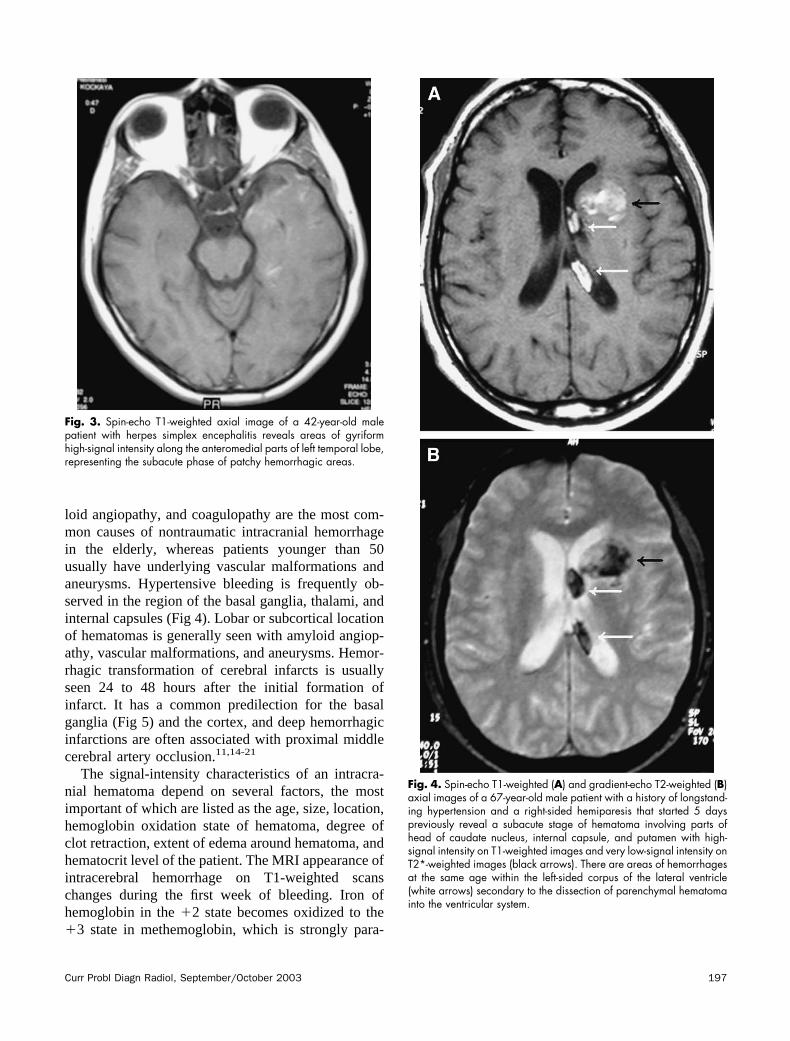
Fig. 3. Spin-echo T1-weighted axial image of a 42-year-old malepatient with herpes simplex encephalitis reveals areas of gyriformhigh-signal intensity along the anteromedial parts of left temporal lobe,representing the subacute phase of patchy hemorrhagic areas.
Fig. 4. Spin-echo T1-weighted (A) and gradient-echo T2-weighted (B)axial images of a 67-year-old male patient with a history of longstand-ing hypertension and a right-sided hemiparesis that started 5 dayspreviously reveal a subacute stage of hematoma involving parts ofhead of caudate nucleus, internal capsule, and putamen with high-signal intensity on T1-weighted images and very low-signal intensity onT2*-weighted images (black arrows). There are areas of hemorrhagesat the same age within the left-sided corpus of the lateral ventricle(white arrows) secondary to the dissection of parenchymal hematomainto the ventricular system.
Curr Probl Diagn Radiol, September/October 2003 197

magnetic during the early subacute phase of bleedingthat starts around the second day of bleeding. Whenmethemoglobin is initially intracellular, the hematomahas a high signal on T1-weighted images thatprogresses from periphery to center and a low signalon T2-weighted images that is surrounded by a zone ofhigh T2 signal secondary to edema. When methemo-globin eventually becomes primarily extracellular dur-ing the late subacute phase of bleeding that startsaround the first to second week of bleeding, thehematoma has a high signal on both T1- and T2-weighted images. Cell lysis and watery dilution ofblood products accompany the oxidation of intracere-bral hematomas, progressing inward from the periph-ery of the lesion. The combination of these eventsconverts the initially low-signal intensity of acutehematomas on T2-weighted scans to high-signal in-tensity over a period of weeks. The concentric zonesof evolving signal intensity are typical of most spon-taneous intracerebral hematomas.14-16
Cortical ContusionCortical contusions are the most common traumatic
injuries of brain parenchyma. They are often superfi-cial lesions, reflecting bruising of the cortical surface
against the adjacent osseous ridge and, less often, adural fold. Cortical contusions most frequently resultfrom acceleration/deceleration forces; however, a di-rect cortical contusion area may develop adjacent to askull fracture, as in the case of a depressed fracture.Common locations include the anteroinferior portionsof temporal lobes, perisylvian cortex, anteroinferiortemporal lobes, and (less commonly) occipital pole.Evidence of parenchymal damage usually should besought both immediately beneath and directly oppositea skull fracture or scalp injury. Petechial corticalcontusions tend to coalesce into larger foci of hemor-rhage, and they often become more evident within 24to 48 hours after the initial trauma. The appearance ofcontusion on MRI is an area of focal hemorrhageinvolving the cerebral cortex and subcortical whitematter. The signal of cortical contusion depends on thefactors related to the hematoma. As the edema andmass effect subside during the subacute phase, T1shortening develops with a gyriform contour followingthe cortical convolutions. The ribbon-like distributionof subacute hemorrhage is commonly seen withinzones of contusion, resembling the pattern of T1shortening in subacute infarction or anoxia (Fig 6).Wide hemorrhagic areas may be associated with con-tusion in some severe cases.22-25
Fig. 5. Spin-echo T1-weighted axial image of a 63-year-old malepatient with a history of longstanding hypertension reveals a hemor-rhagic transformation of right putaminal infarct in the distribution oflateral lenticulostriate branches of middle cerebral artery with thehigh-signal intensity starting from the periphery and progressingtoward the center of infarct area (arrow).
Fig. 6. Spin-echo T1-weighted axial image of a 45-year-old malepatient with a history of recent head trauma reveals a hemorrhagicarea of cortical contusion involving right occipital pole with heteroge-neous high-signal intensity (arrow).
198 Curr Probl Diagn Radiol, September/October 2003

Diffuse Axonal (Shearing) InjuriesDiffuse axonal injuries, or shearing injuries, consti-
tute the second most common traumatic injury of thebrain. Acceleration/deceleration injury, or shaking ofthe brain, causes impaired axoplasmic transport, ax-onal swelling, and disconnection; thus, a state ofaxonal transection. Diffuse axonal injury is frequentlyobserved near interfaces between tissues of differentconsistency, so that shearing forces develop whenrotation or acceleration/deceleration forces impart dif-ferent velocities and momentum to parenchyma oneach side of the tissue boundary. The most commonlocations of shearing injuries are gray–white matterjunctions in the frontal and temporal lobes, corpuscallosum, fornix, brainstem, basal ganglia, and internalcapsule. The size of shearing injuries may range froma few millimeters to centimeters. The lesions arecommonly microscopic and nonhemorrhagic; how-ever, up to 50% of shearing injuries may be hemor-rhagic (Fig 7).17,26-28
Subarachnoid HemorrhageSubarachnoid hemorrhage may result secondary to
a variety of underlying reasons, such as the trauma,rupture of aneurysms (Fig 8), bleeding vascular mal-formations, hematomas dissecting into the cerebrospi-nal fluid, and coagulopathy. Subarachnoid hemorrhageis not usually seen on MRI unless there is profusebleeding because the extravasated blood elements arediluted within cerebrospinal fluid. Computed tomog-raphy is recommended for diagnosis of subarachnoidhemorrhages. However, in the case of profuse bleed-ing into the subarachnoid space independent of theunderlying reason, hemoglobin may be deoxidized tothe deoxyhemoglobin state and further to the methe-moglobin state, giving a hyperintense appearance onT1-weighted images. Chronic stages of subarachnoidbleeding may be characterized by the deposition ofhemosiderin on the pial surface of the brain, leading toa thin hypointense rim appearance, especially promi-nent on T2-weighted images, called superficial sider-osis.29,30
Epidural and Subdural HematomasEpidural hematomas usually result from traumatic
rupture of an epidural artery, often the middle menin-geal artery, or of a dural venous sinus. The blood iscollected between the skull and outer layer of duramater with a typical biconvex shape. They do not cross
suture lines, except in cases of very large hematomasassociated with a diastatic fracture. Epidural hemato-mas cause compression of underlying brain paren-chyma and subarachnoid spaces, and herniation iscommonly detected. Epidural hematomas are com-
Fig. 7. Spin-echo T1-weighted axial image (A) and axial computedtomographic image (B) of a 36-year-old male patient with a history ofrecent head trauma reveal bilateral high-signal intensity foci of hem-orrhagic shearing injuries in the thalami (black arrows) that weredetected as high-density foci (white arrows) on an emergent computedtomographic study 4 days before MRI examination.
Curr Probl Diagn Radiol, September/October 2003 199

monly associated with skull fractures but rarely can beseen without fractures.14,22-24,31
Subdural hematomas usually result from the tear-ing of cortical arteries or veins where they enter thesubdural space. They have a typical crescentic shapeand are located between the inner layer of dura andarachnoid layer. Subdural hematomas may crosssuture lines but not dural attachments. They usuallyextend into the interhemispheric fissure. More thantwo thirds of the subdural hematomas have signifi-cant associated lesions, such as subarachnoid hem-orrhage, cortical contusion, and diffuse axonalinjuries.14,22-24,32,33
The signal intensity of epidural and subdural hema-tomas depends on several factors, but the most impor-tant factor is the age of the hematoma at the time ofexamination. Acute hematomas are isointense orslightly lower in signal intensity than cerebral paren-chyma on T1-weighted images. The hematomas havea high-signal intensity on T1-weighted images duringthe whole subacute stage, whereas they have a low-signal intensity secondary to the presence of intracel-lular methemoglobin during the early phase of thesubacute stage, and a high-signal intensity secondaryto the presence of extracellular methemoglobin duringthe late phase on T2-weighted images (Fig 9). Mixedsignal intensities may be observed, especially for
subdural hematomas, as a result of rebleeding into thehematomatous area.14,16,31-33
Fig. 8. Spin-echo T1-weighted axial images of a 41-year-old female patient who had a subarachnoid bleeding 3 days ago reveal (A) a saccularaneurysm with a signal void at the bifurcation of right middle cerebral artery (white arrow) that is surrounded by hyperintense subacute bleedingwithin the subarachnoid space (black arrow), and (B) bleeding filling the right sylvian fissure as well (black arrow).
Fig. 9. Spin-echo T1-weighted axial image of a 70-year-old femalepatient with a history of recent head trauma reveals a right-sidedcrescentic subdural hematoma along the temporo-occipital surface(black arrows) with a hyperintense signal characteristic, representingsubacute phase of hematoma. Note that an additional focal area ofsubdural hematoma is present along the right occipital pole (arrow-head).
200 Curr Probl Diagn Radiol, September/October 2003

Intraventricular HemorrhageIntraventricular hemorrhage may be seen as a result
of several conditions, such as trauma, bleeding sec-ondary to vascular malformations and aneurysms,periventricular hematomas dissecting into ventricles(Fig 4), germinal matrix bleeding (Fig 10), amyloidangiopathy, coagulopathies, and blood dyscrasias.Hemorrhage commonly arises from fragile vessels inthe periventricular germinal matrix of premature new-borns. Hematomas may remain confined to the sub-ependymal region or rupture into the ventricular sys-tem, often causing secondary hydrocephalus. In adults,hematomas in the posterior fossa or basal ganglia mayrupture into the fourth, third, or lateral ventricles. Theventricles may be grossly expanded by throm-bus.14,17,19,21,23,30,34-36
Vascular Malformations and AneurysmsArteriovenous malformations (AVMs) are the most
common symptomatic cerebral vascular malforma-tions. AVMs may be sporadic, congenital, or associ-ated with a history of trauma. They are angiogenicallyimmature lesions with continuing vascular remodel-ing. They are most commonly located in the supraten-torial area (80-90%), whereas an infratentorial loca-tion is rare. AVMs contain multiple tightly packedtortuous tubular flow void structures on T1- andT2-weighted images secondary to patent arteries withhigh blood flow. They may contain thrombosed ves-sels with variable signal, areas of hemorrhage invarious phases, calcification, and gliosis as well. Thesignal-intensity characteristics of AVMs depend onthe presence of various components, as mentionedpreviously. Areas of T1 shortening may be detectedsecondary to thrombosis, hemorrhage, or calcification.AVMs do not contain brain tissue within the nidus oflesion. They are not usually associated with masseffect, except in the case of a recent hemorrhage orvenous occlusion.14,16,19
Cavernous malformations, or cavernomas, are themost common angiographically occult vascular mal-formations. They are angiogenically immature dy-namic lesions with endothelial proliferation andincreased neoangiogenesis. Almost 75% of the cav-ernomas occur as solitary sporadic lesions, whereasthe rest of lesions are detected in the multiplefamilial form. They are collections of sinusoidalvascular spaces surrounded by a gliotic pseudocap-sule without intervening neuroglial tissue. MRIappearance of cavernous angiomas is highly char-acteristic. An aggregate, multinodular, or popcornmorphology with prominent central zones of T1shortening is surrounded by a characteristic rind ofT2 shortening that is attributable to the accumula-tion of hemosiderin from old hemorrhages (Fig 11).Calcification may also contribute to low-signal in-tensity within and surrounding cavernous angiomas.They may range in size from a few millimeters toseveral centimeters in diameter. Any region of thebrain may be affected; however, supratentorial cav-ernomas occur more frequently than infratentoriallesions. They have a propensity for repeated intrale-sional hemorrhage.14,16,20,37,38
Intracranial aneurysms constitute the most commonunderlying reason for nontraumatic subarachnoidhemorrhage, and they may cause areas of T1 shorten-
Fig. 10. Spin-echo T1-weighted axial image of a 2-day-old maleinfant with a history of premature birth at 31 weeks of gestation showsthat bilateral lateral ventricles are enlarged with intraventricular pos-terior layering of hyperintense blood components secondary to germi-nal matrix bleeding. Note that both the amount and the myelination ofthe white matter have seriously decreased. Septum pellucidum is alsoabsent.
Curr Probl Diagn Radiol, September/October 2003 201
ing during the subacute phase of subarachnoid bleed-ing, as explained above. The aneurysms may besaccular, fusiform, or blister-like structures. Saccularaneurysms occur typically at arterial bifurcations, andthey are frequently located around the circle of Willis.Saccular aneurysms greater than 25 mm in diameterare referred to as giant aneurysms. The lumina of giantsaccular aneurysms may be at least partially occupiedby a thrombus that often has a lamellar or concentricappearance. The layers of intermediate- and high-signal intensity caused by thrombi of different agesand an additional zone of signal void layer represent-ing the patent lumen are seen. This laminated internalarchitecture is a hallmark of thrombosed aneurysm.The circulation of blood within large-sized aneurysmsis often complex, with lower flow velocities and lessturbulence than is typically present within the lumenof smaller aneurysms. As a result, large aneurysmsmay demonstrate mixed intraluminal signal intensityon MRI scans. It may be difficult to distinguishbetween slowly flowing but patent components of theaneurysm and intraluminal thrombus on standard spin-echo scans. Flow-sensitive sequences are important inevaluating such cases.14,29,30,39,40
Hemorrhagic NeoplasmsIntracranial neoplasms, whether primary or meta-
static, may be associated with hemorrhagic compo-nents. The reported incidence of hemorrhage in intra-cranial neoplasms varies from 1% to 15% in variousseries. Higher grades of malignancy, presence ofneovascularity, presence of arteriovenous shuntswithin the lesions, rapidly growing neoplasms withassociated necrosis, and vascular invasion by neo-plasms may be the underlying factors contributing tothe bleeding within the neoplasms. Primary tumors,such as pituitary adenomas, anaplastic astrocytoma,oligodendroglioma, glioblastoma multiforme, andlymphoma (in the case of immunocompromised pa-
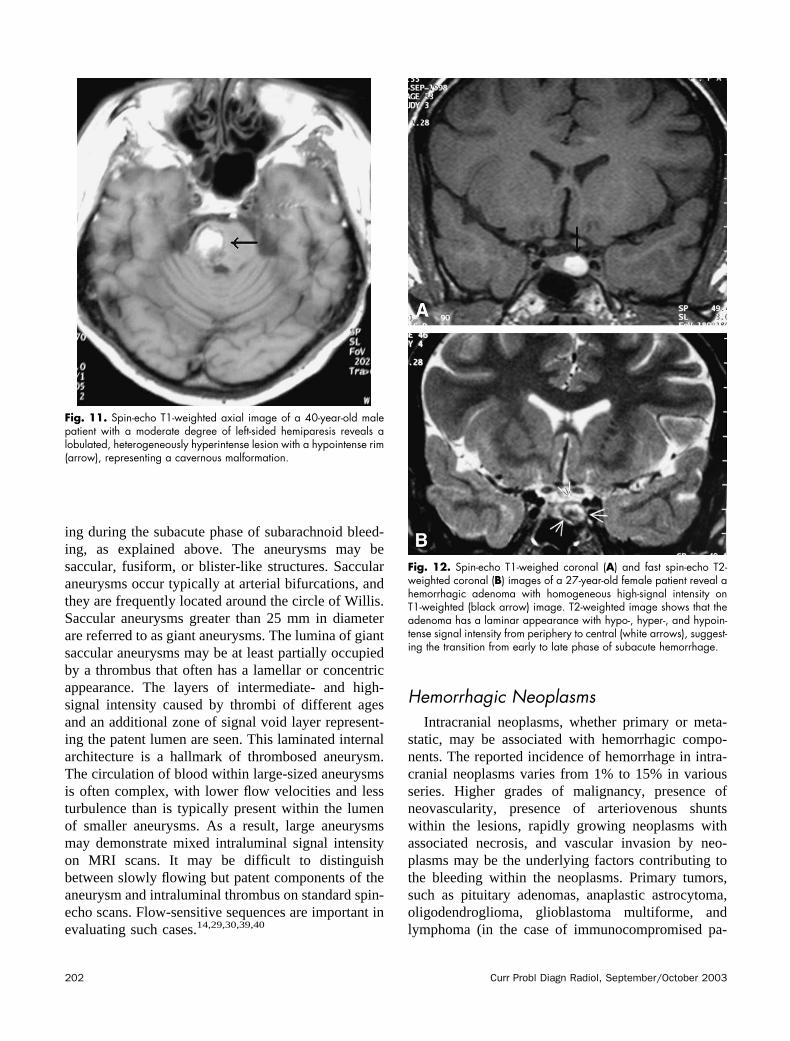
Fig. 11. Spin-echo T1-weighted axial image of a 40-year-old malepatient with a moderate degree of left-sided hemiparesis reveals alobulated, heterogeneously hyperintense lesion with a hypointense rim(arrow), representing a cavernous malformation.
Fig. 12. Spin-echo T1-weighed coronal (A) and fast spin-echo T2-weighted coronal (B) images of a 27-year-old female patient reveal ahemorrhagic adenoma with homogeneous high-signal intensity onT1-weighted (black arrow) image. T2-weighted image shows that theadenoma has a laminar appearance with hypo-, hyper-, and hypoin-tense signal intensity from periphery to central (white arrows), suggest-ing the transition from early to late phase of subacute hemorrhage.
202 Curr Probl Diagn Radiol, September/October 2003
tients), and secondary tumors, such as metastasis frombronchogenic carcinoma, renal cell carcinoma, mela-noma, choriocarcinoma, and thyroid carcinoma, arethe most common intracranial neoplasms associatedwith hemorrhage.21,41-44
The MRI appearance of a hemorrhagic neoplasticlesions is usually characterized by a more complexheterogeneous pattern of bleeding, nonhemorrhagiccomponents that enhance after intravenous gadoliniumadministration, disordered evolution of hemorrhagicelements within the lesion, persisting peripheraledema during the evolution of lesion, and mass effect.Primary tumors are solitary, and metastatic tumors aretypically multiple.21,43,44
Pituitary adenomas are common, benign, slowlygrowing tumors representing approximately half ofthe sellar and parasellar neoplasms in adults. Pitu-itary adenomas commonly have intermediate signal-intensity characteristics on T1- and T2-weightedsequences. However, the cysts, hemorrhage, andnecrosis, which are more common in the case ofmacroadenomas with a size of more 10 mm, may beassociated with adenomas, leading to a heteroge-neous signal-intensity pattern (Fig 12). The patternof hemorrhage within pituitary adenomas variesfrom homogeneous to heterogeneous. The hemor-rhages within an adenoma are much more com-monly microscopic and subclinical. Acute bleedinginto an adenoma may cause sudden enlargement ofthe tumor, with compression on the optic chiasmand on the rest of hypophyseal gland. Rapidlydeveloping visual impairment and endocrine dys-function, usually accompanied by headache, is
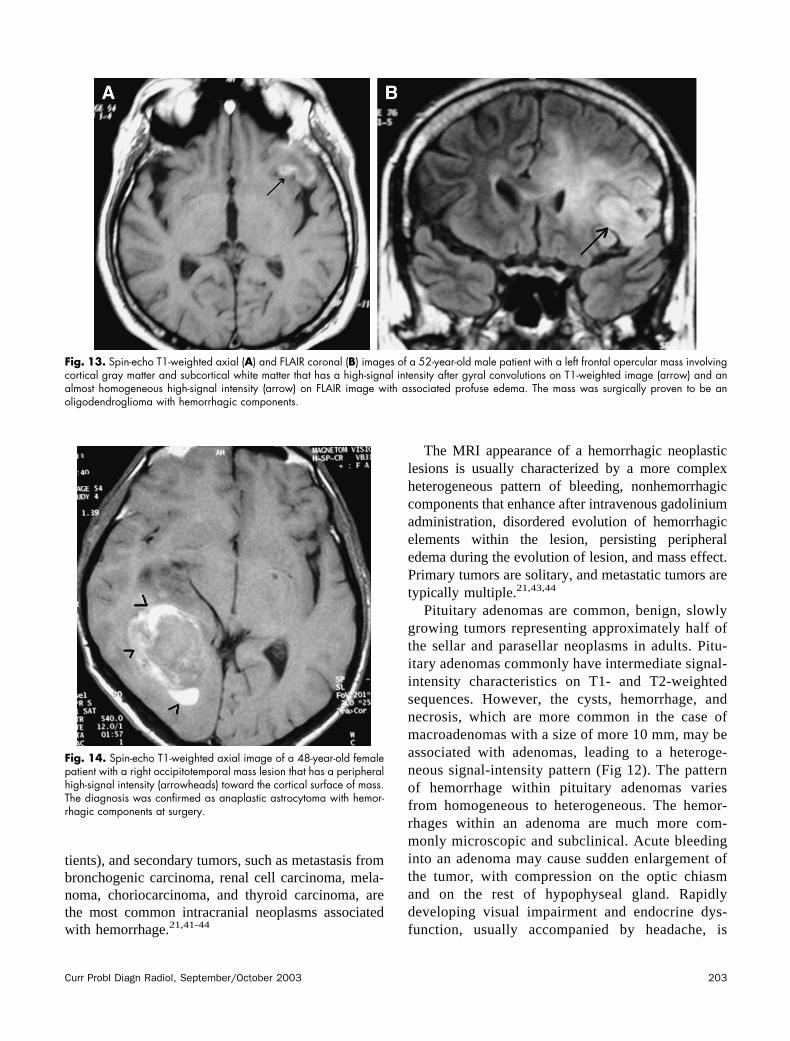
Fig. 13. Spin-echo T1-weighted axial (A) and FLAIR coronal (B) images of a 52-year-old male patient with a left frontal opercular mass involvingcortical gray matter and subcortical white matter that has a high-signal intensity after gyral convolutions on T1-weighted image (arrow) and analmost homogeneous high-signal intensity (arrow) on FLAIR image with associated profuse edema. The mass was surgically proven to be anoligodendroglioma with hemorrhagic components.
Fig. 14. Spin-echo T1-weighted axial image of a 48-year-old femalepatient with a right occipitotemporal mass lesion that has a peripheralhigh-signal intensity (arrowheads) toward the cortical surface of mass.The diagnosis was confirmed as anaplastic astrocytoma with hemor-rhagic components at surgery.
Curr Probl Diagn Radiol, September/October 2003 203
called pituitary apoplexy. Some observers suggestan increased incidence of pituitary hemorrhage inpatients receiving bromocriptine therapy.43,45-47
Anaplastic astrocytoma, oligodendroglioma, glioblas-toma multiforme, and lymphoma (in immunocompro-
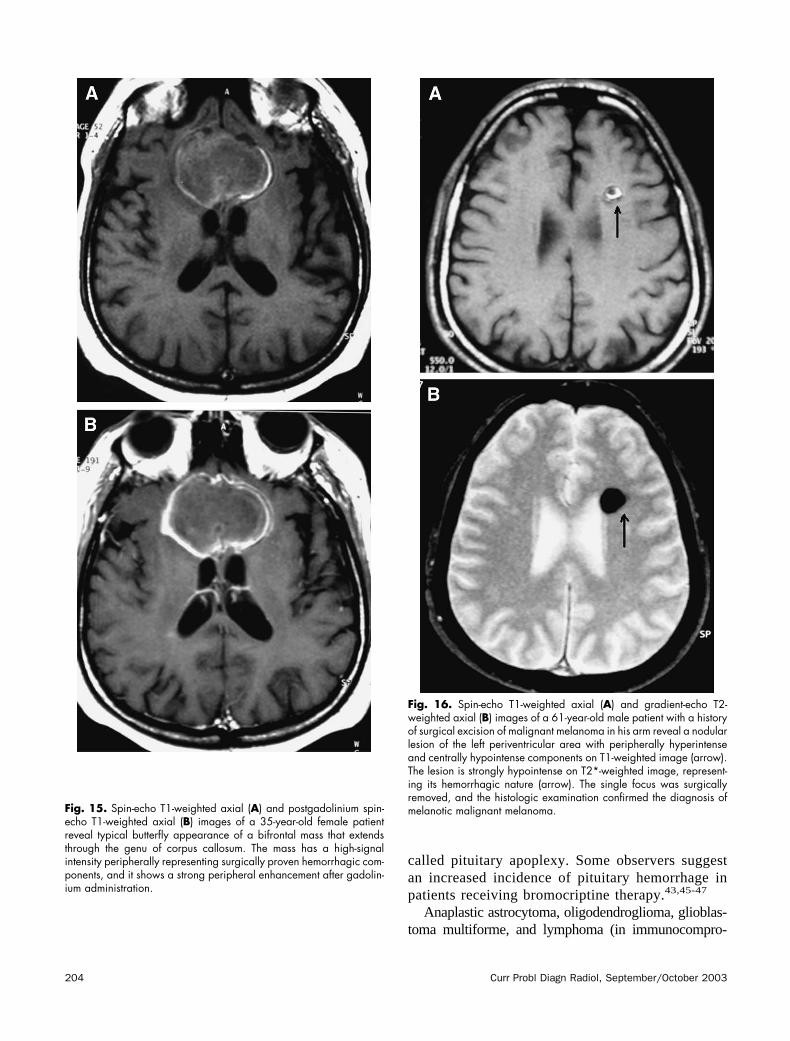
Fig. 15. Spin-echo T1-weighted axial (A) and postgadolinium spin-echo T1-weighted axial (B) images of a 35-year-old female patientreveal typical butterfly appearance of a bifrontal mass that extendsthrough the genu of corpus callosum. The mass has a high-signalintensity peripherally representing surgically proven hemorrhagic com-ponents, and it shows a strong peripheral enhancement after gadolin-ium administration.
Fig. 16. Spin-echo T1-weighted axial (A) and gradient-echo T2-weighted axial (B) images of a 61-year-old male patient with a historyof surgical excision of malignant melanoma in his arm reveal a nodularlesion of the left periventricular area with peripherally hyperintenseand centrally hypointense components on T1-weighted image (arrow).The lesion is strongly hypointense on T2*-weighted image, represent-ing its hemorrhagic nature (arrow). The single focus was surgicallyremoved, and the histologic examination confirmed the diagnosis ofmelanotic malignant melanoma.
204 Curr Probl Diagn Radiol, September/October 2003

mised patients) are the other primary neoplasms associ-ated with hemorrhage. Macroscopic hemorrhage isrelatively uncommon in glial tumors. Microscopic hem-orrhage is a common pathological feature within high-grade gliomas. Oligodendrogliomas are relatively rare,slowly growing gliomas with usually mixed histologicpatterns. They make up a disproportionate share oflesions presenting with gross hemorrhage (Fig 13). Areasof signal void are also seen at sites of clump-likecalcification. High-grade gliomas, including anaplasticastrocytoma (Fig 14) and glioblastoma multiforme (Fig15), are highly malignant neoplasms with necrosis andneovascular proliferation that represent a likely source ofbleeding. Hemorrhage and necrosis also may be associ-ated with primary brain lymphoma in immunocompro-mised patients.21,43-45
Metastases represent approximately one third ofintracranial tumors. They are usually located at thegray–white matter interface of cerebral hemispheres.Hemorrhage, calcifications, and cysts may be associ-ated with metastatic tumors. Neoplasms, such asmelanoma (Fig 16), choriocarcinoma, hypernephroma,
bronchogenic carcinoma (Fig 17), and thyroid carci-noma, usually cause hemorrhagic cerebral metastases.The high-signal intensity of T1-weighted images sug-gest the presence of subacute or early chronic hemor-rhagic elements within the lesion. Hemorrhagic me-tastases may simulate the appearance of cavernousangiomas or other occult vascular malformations whenthey are solitary.21,43,44
Fig. 17. Spin-echo T1-weighted axial image of a 74-year-male patientshows several hyperintense nodular lesions at the gray–white matterjunction, representing hemorrhagic metastases from a known primarybronchogenic carcinoma. The right frontal nodule (black arrow) has anaccompanying edema, whereas the left parietal nodule (white arrow)causes no edema.
Fig. 18. Spin-echo T1-weighted sagittal image of a 46-year-oldfemale patient presenting with headache and hydrocephalus reveals ahomogeneously hyperintense cystic lesion (arrow) within the thirdventricle. Note that surgically proven colloid cyst causes enlargementof the ventricular system.
Fig. 19. Spin-echo T1-weighted sagittal image of a 34-year-oldfemale patient reveals a well-circumscribed intrasellar lesion (arrow)with high signal intensity that was surgically removed with a resultantdiagnosis of Rathke’s cleft cyst.
Curr Probl Diagn Radiol, September/October 2003 205

Protein-containing LesionsColloid Cysts
Colloid cysts exclusively arise from the inferioraspect of the septum pellucidum and protrude into theanterior portion of the third ventricle between columnsof the fornix; however, some authors have reported thepresence of colloid cysts in unusual locations, such as
the posterior fossa and lateral ventricles. Typicalclinical presentation is with episodes of positionalheadaches caused by intermittent hydrocephalus. Thethird ventricle is enlarged to accommodate the cyst;lateral ventricles are enlarged as the result of obstruc-tion in foramen of Monro. The cysts are well-circum-scribed, with hyperintense signal-intensity on both T1-and T2-weighted sequences in almost 60% of thepatients due to protein and mucin content of the lesion;however, they show variable signal-intensity charac-teristics in the rest of the patients, depending on thecontent of the cyst (Fig 18). Thin rim enhancementmay be observed around the cyst, representing afibrous capsule, after intravenous gadolinium admin-istration. Differential diagnosis from the masses, suchas meningioma and ependymoma, is not difficultbecause of their typical features on MRI.48-50
CraniopharyngiomaCraniopharyngiomas are usually histologically be-
nign but locally aggressive lesions arising from squa-mous epithelial rests along Rathke’s cleft. They maypresent with a variety of signal intensities, sizes, andmorphologies on MRI pictures. Craniopharyngiomasmost commonly involve the suprasellar region, aloneor in combination with intrasellar components. Themidline location is typical. They are usually well-circumscribed lobulated lesions with variable low-,intermediate-, or high-signal on T1- and T2-weightedimages. T1-hyperintense components within cranio-pharyngiomas most often represent high protein con-tent within cystic regions of the tumor. Experimentalstudies and analysis of fluid from tumor cysts havesuggested that appreciable T1 shortening is usuallycorrelated with protein concentrations in the range of10% to 30%. Calcification and hemorrhage may beassociated with craniopharyngiomas, causing variablesignal-intensity patterns on T1- and T2-weighted im-ages.47,51
Rathke’s Cleft CystRathke’s cleft cysts are uncommon, benign cystic
lesions that are derived from the remnants of theepithelium embryologically lining Rathke’s cleft (cra-niopharyngeal duct). They may be intrasellar in 50%of the cases, suprasellar in 25% of the cases, and bothin 25% of the cases. The cysts are usually simple, linedby a single epithelial layer. They may contain variableamounts of protein, mucopolysaccharide, cellular de-bris, and cholesterol. Their signal intensity may be
Fig. 20. Spin-echo T1-weighted coronal image of a 59-year-old malepatient reveals a left-sided suprasellar cystic mass with homogeneouslyhigh-signal intensity. The mass was found to be an epidermoid cyst thatsurrounded the supraclinoid segment of left internal carotid artery andprechiasmatic optic nerve at surgery.
Fig. 21. Spin-echo T1-weighted sagittal image of a 36-year-oldfemale patient with dizziness reveals a pericallosal curvilinear hyper-intense lipomatous mass associated with hypoplasia of the splenium ofcorpus callosum (arrow).
206 Curr Probl Diagn Radiol, September/October 2003
correspondingly high, low, or intermediate on T1- andT2-weighted sequences, depending on the contents ofcystic lesions (Fig 19). Gadolinium enhancement isusually absent.47,52
Atypical Epidermoid CystsEpidermoid cysts are nonneoplastic, congenital,
or acquired extra-axial off-midline lesions that arefilled with desquamated cells and keratinaceousdebris. The prepontine and cerebellopontine angle
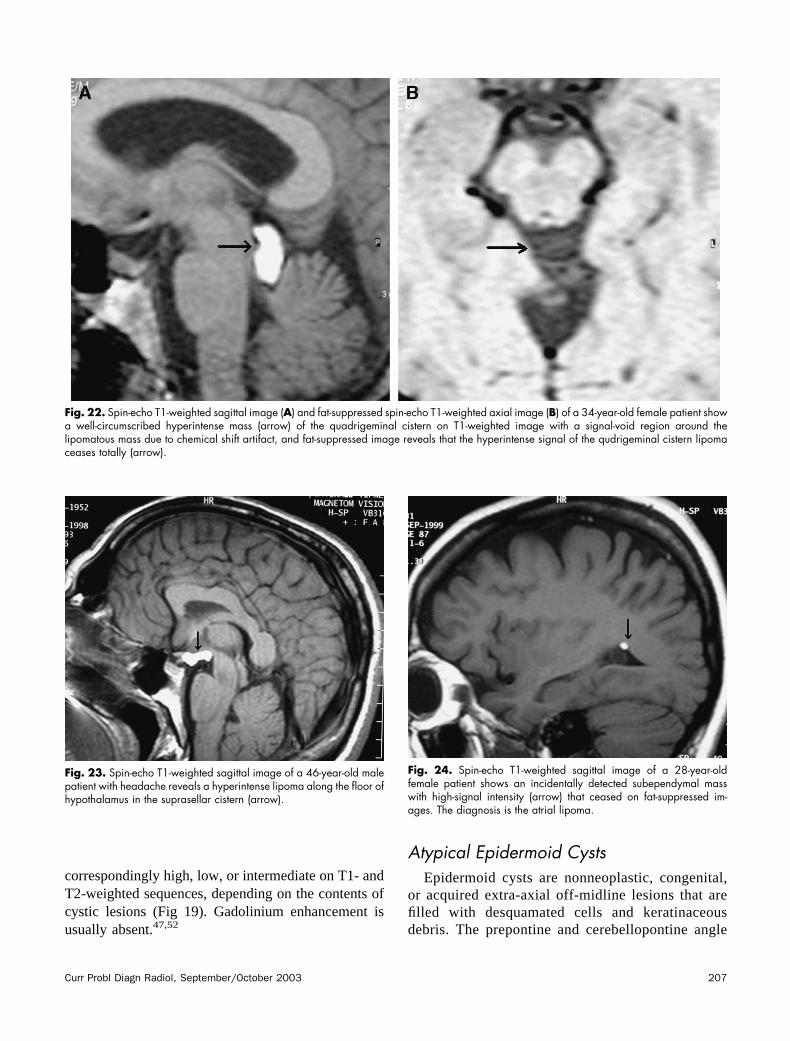
Fig. 22. Spin-echo T1-weighted sagittal image (A) and fat-suppressed spin-echo T1-weighted axial image (B) of a 34-year-old female patient showa well-circumscribed hyperintense mass (arrow) of the quadrigeminal cistern on T1-weighted image with a signal-void region around thelipomatous mass due to chemical shift artifact, and fat-suppressed image reveals that the hyperintense signal of the qudrigeminal cistern lipomaceases totally (arrow).
Fig. 23. Spin-echo T1-weighted sagittal image of a 46-year-old malepatient with headache reveals a hyperintense lipoma along the floor ofhypothalamus in the suprasellar cistern (arrow).
Fig. 24. Spin-echo T1-weighted sagittal image of a 28-year-oldfemale patient shows an incidentally detected subependymal masswith high-signal intensity (arrow) that ceased on fat-suppressed im-ages. The diagnosis is the atrial lipoma.
Curr Probl Diagn Radiol, September/October 2003 207

cisterns and suprasellar and parasellar areas arecommon sites for epidermoid cysts. They are well-circumscribed, spheroid, or multilobulated cysticlesions. They usually cause encasement rather thandisplacement of the neighboring cranial nerves and
vessels. They frequently have signal intensitiessimilar to that of cerebrospinal fluid on MRI. Veryrarely, epidermoid cysts demonstrate short T1 andT2 values resembling dermoid cysts (Fig 20). Suchmasses usually contain viscous liquid componentscontaining relatively high concentrations of proteinand causing high-signal intensity on T1-weightedscans. The lack of contrast enhancement is charac-teristic of epidermoid cysts.53-57
Fatty LesionsLipomas
Intracranial lipomas are uncommon congenitalmalformations that result from persistence and ab-normal differentiation of the meninx primitiva.Microscopically, they are composed of adiposetissue with a variable mixture of vascular elements,musculo-collagenous fibers, and glial and ganglioncells. They are located at or near the midline in 80%to 95% of the cases. The common locations forlipomas are as pericallosal (25-50%) (Fig 21),sylvian fissure, quadrigeminal cistern (Fig 22), in-terpeduncular cistern, cerebellopontine angle cis-tern, cerebellomedullary cistern, chiasmatic-supra-sellar cistern (Fig 23), and choroid plexus of theatrium (Fig 24). Lipomas can be nodular or curvi-linear. They may contain calcifications. Intracraniallipomas are often asymptomatic and discovered
Fig. 25. Spin-echo T1-weighted axial image (A) and fat-suppressedfast spin-echo T2-weighted coronal images (B) of a 52-year-old femalepatient with severe headache reveal a mass of the sylvian cistern thatis heterogeneously hyperintense on T1-weighted image with the ceaseof high signal on fat-suppressed image. The mass was surgicallyremoved with the resultant diagnosis of dermoid cyst.
Fig. 26. Spin-echo T1-weighted sagittal image of a 25-year-oldfemale patient presenting with a longstanding history of visual impair-ment and a recent onset of severe headaches shows a suprasellarhigh-intensity mass that was surgically proven as dermoid cyst, andassociation of scattered hyperintense foci along the neighboring sulcisecondary to the rupture of cyst.
208 Curr Probl Diagn Radiol, September/October 2003
incidentally. The clinical findings, if present, areusually related to associated anomalies, such ascorpus callosum dysgenesis (Fig 21). Lipomas arecharacteristically hyperintense masses on T1- and
less hyperintense masses on T2-weighted se-quences, with decreased signal intensity on fat-suppressed sequences on MRI. A more specific clueto the diagnosis of lipoma and other lipid-containingmasses is the chemical shift artifact, which is simply
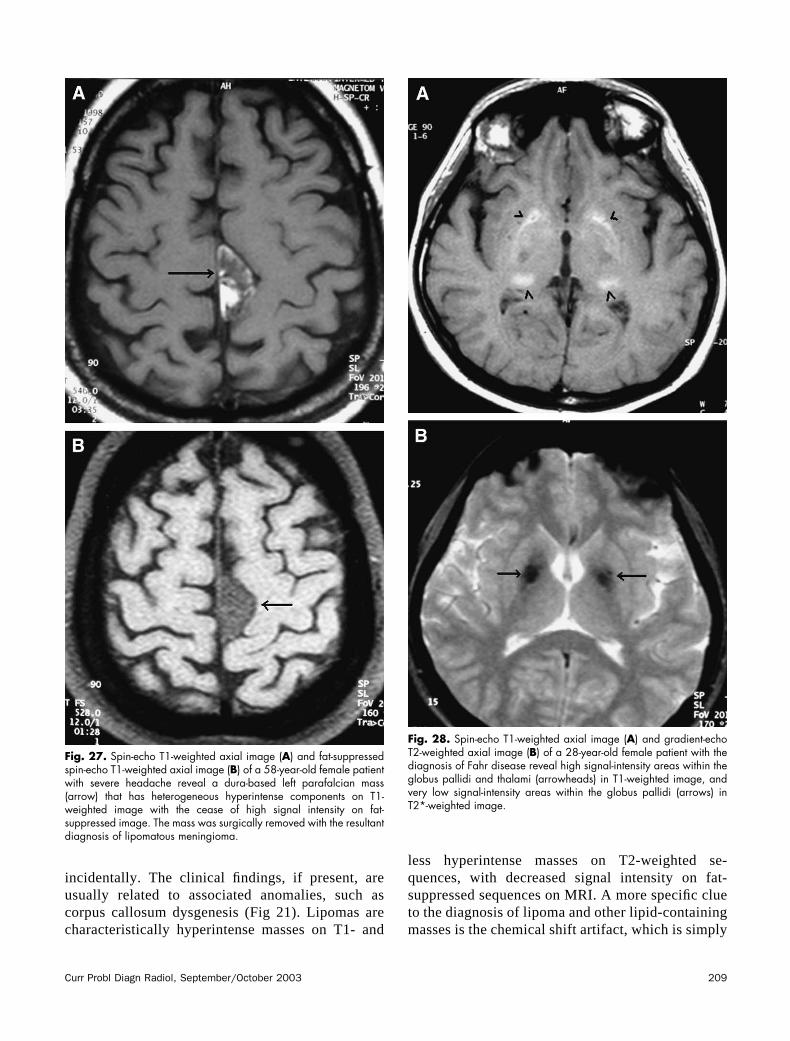
Fig. 27. Spin-echo T1-weighted axial image (A) and fat-suppressedspin-echo T1-weighted axial image (B) of a 58-year-old female patientwith severe headache reveal a dura-based left parafalcian mass(arrow) that has heterogeneous hyperintense components on T1-weighted image with the cease of high signal intensity on fat-suppressed image. The mass was surgically removed with the resultantdiagnosis of lipomatous meningioma.
Fig. 28. Spin-echo T1-weighted axial image (A) and gradient-echoT2-weighted axial image (B) of a 28-year-old female patient with thediagnosis of Fahr disease reveal high signal-intensity areas within theglobus pallidi and thalami (arrowheads) in T1-weighted image, andvery low signal-intensity areas within the globus pallidi (arrows) inT2*-weighted image.
Curr Probl Diagn Radiol, September/October 2003 209
related to the difference in resonant frequenciesbetween fat and water protons. This artifact isdisplayed as a region of signal void at fat–waterinterfaces and hyperintensity at water–fat interfaces,along the frequency encoding axis.57-61
Dermoid CystsDermoid cysts are benign, slowly growing cystic
lesions arising from ectodermal cells enclosed in-tracranially during embryogenesis that are filled withlipid material, cholesterol, desquamated cells, andkeratinaceous debris. Dermoid cysts may contain skinappendages, such as hair follicles, sweat glands, andsebaceous glands, in addition to squamous epithelium.Calcification is rare. They are found most commonlyin the parasellar region. They are well-circumscribedextra-axial lesions with high signal on T1-weightedimages and variable signal intensity on T2-weightedimages. The lipid content of dermoid cysts causeshigh-signal intensity on T1-weighted scans (Fig 25).The fluid–fluid or fluid–debris levels may be presentwithin the cystic lesions. They do not enhance aftergadolinium administration. Dermoid cysts may leak orrupture, releasing their content into the subarachnoid
space and ventricular system. The resultant appear-ance of scattered lipid droplets within sulci and cis-terns is seen (Fig 26). Some patients may experiencechemical meningitis, particularly when the contents ofa ruptured cyst extend beyond the ventricles to involvethe subarachnoid spaces. The rupture of dermoid cystsmay even cause noncommunicating hydrocepha-lus.53,57,62,63
Lipomatous MeningiomaMeningiomas are the most common intracranial
extra-axial tumors. They are usually benign, slowly
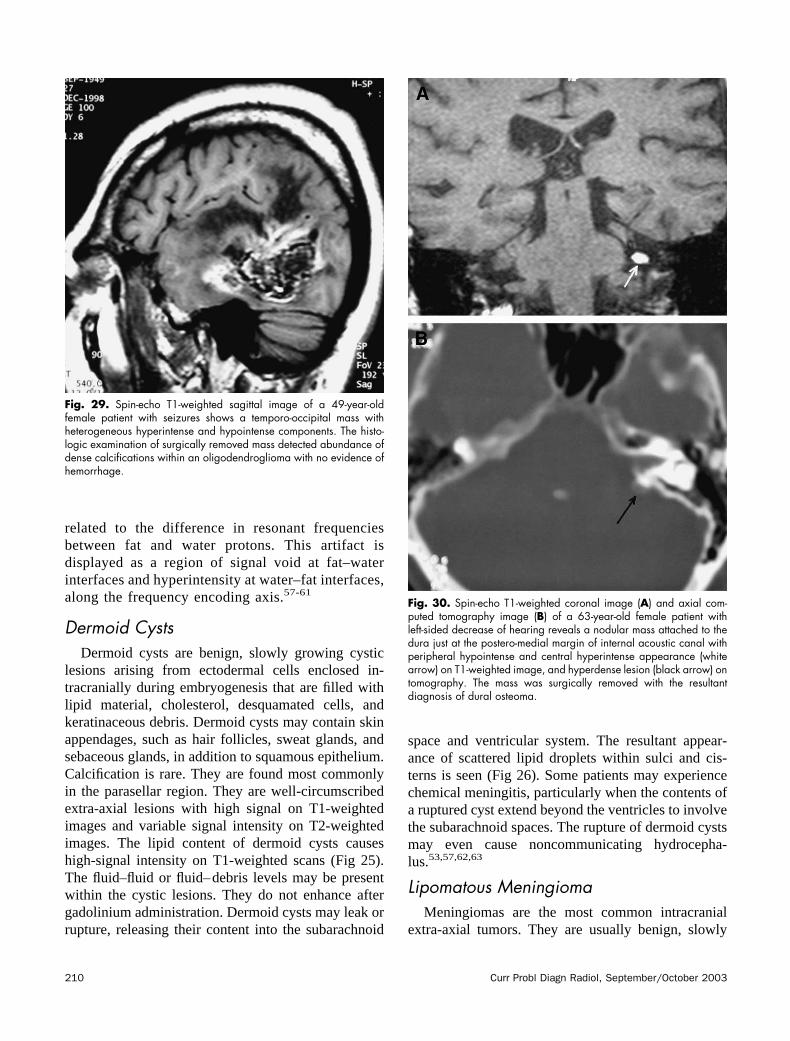
Fig. 29. Spin-echo T1-weighted sagittal image of a 49-year-oldfemale patient with seizures shows a temporo-occipital mass withheterogeneous hyperintense and hypointense components. The histo-logic examination of surgically removed mass detected abundance ofdense calcifications within an oligodendroglioma with no evidence ofhemorrhage.
Fig. 30. Spin-echo T1-weighted coronal image (A) and axial com-puted tomography image (B) of a 63-year-old female patient withleft-sided decrease of hearing reveals a nodular mass attached to thedura just at the postero-medial margin of internal acoustic canal withperipheral hypointense and central hyperintense appearance (whitearrow) on T1-weighted image, and hyperdense lesion (black arrow) ontomography. The mass was surgically removed with the resultantdiagnosis of dural osteoma.
210 Curr Probl Diagn Radiol, September/October 2003
growing neoplasms; however, they may rarely revealmalignant behavior. They are well-circumscribed, du-ral-based lesions. They may cause compression ofadjacent brain parenchyma, encasement of arteries,and compression of dural venous sinuses. The mostcommon locations for meningiomas are the parasagit-tal area, convexity, sphenoid ridge, parasellar area,posterior fossa, optic nerve sheath, and intraventricularregion. They are usually isointense with cortical graymatter on all MRI sequences with a prominent gado-linium enhancement. Calcification is a frequently de-tected characteristic of the lesions. Necrosis, cysts, andhemorrhage may be associated in around 25% of themasses. Dural tail reaction that is characterized bythickened dura tapering away from the tumor ischaracteristic, but not pathognomonic, for meningio-mas.55,64,65
Lipomatous meningiomas are relatively rare, be-nign tumors that are characterized either by an admix-ture of mature adipocytes and meningioma or theproduction of lipids by neoplastic meningothelial cells
assuming a lipoblast-like appearance. The lipomatouschanges are thought to appear as a result of metaplasticchanges of meningothelial cells. The signal intensityof lipomatous meningiomas is heterogeneous, buthyperintense components are detected on both T1- andT2-weighted images secondary to the presence of lipid(Fig 27).64-67
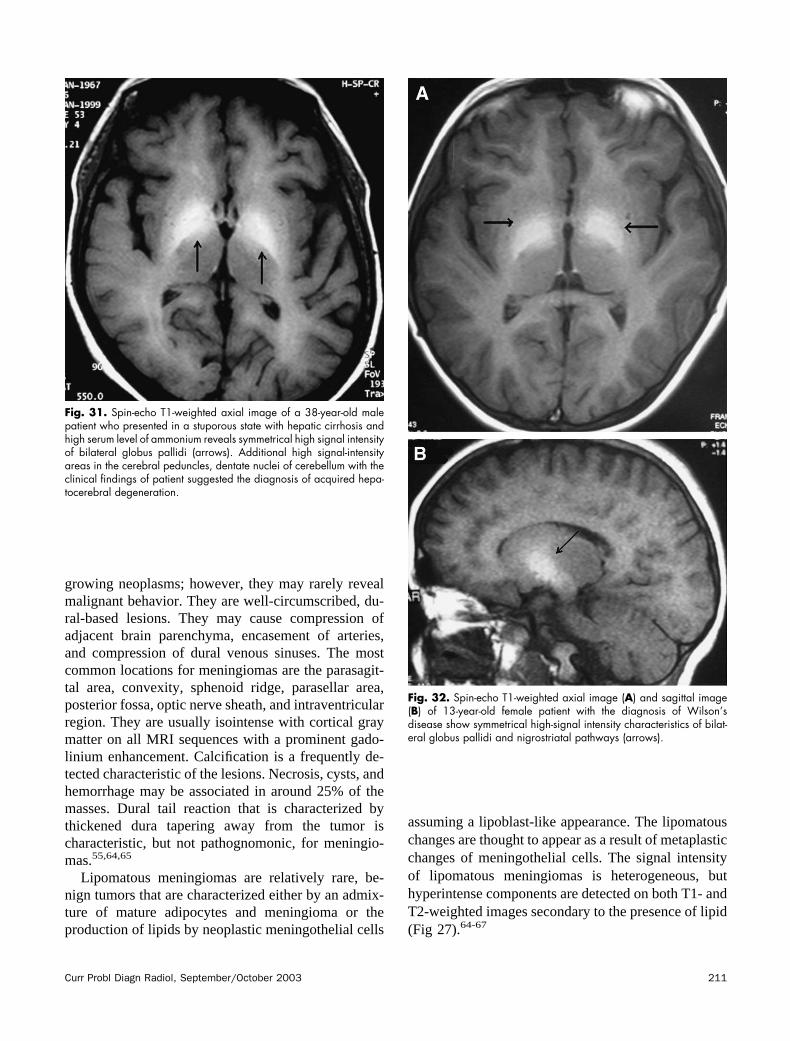
Fig. 31. Spin-echo T1-weighted axial image of a 38-year-old malepatient who presented in a stuporous state with hepatic cirrhosis andhigh serum level of ammonium reveals symmetrical high signal intensityof bilateral globus pallidi (arrows). Additional high signal-intensityareas in the cerebral peduncles, dentate nuclei of cerebellum with theclinical findings of patient suggested the diagnosis of acquired hepa-tocerebral degeneration.
Fig. 32. Spin-echo T1-weighted axial image (A) and sagittal image(B) of 13-year-old female patient with the diagnosis of Wilson’sdisease show symmetrical high-signal intensity characteristics of bilat-eral globus pallidi and nigrostriatal pathways (arrows).
Curr Probl Diagn Radiol, September/October 2003 211
Lesions with Calcified or OssifiedComponents
Endocrine–Metabolic DisordersThe signal intensity of calcification is usually charac-
terized by hypointense appearance in both T1- andT2-weighted sequences on MRI. However, the presenceof diamagnetic calcium salts and association with otherparamagnetic cations, such as iron and manganese, mayparadoxically cause T1 shortening in some cases. Thesize and configuration of calcium deposits are alsoimportant determinants of the signal intensity of calcifi-cation. Hypo- or hyperparathyroidism, hypothyroidism,mitochondrial encephalopathies, Fahr disease (familialcerebrovascular ferrocalcinosis or bilateral striopal-lidodentate calcinosis) (Fig 28), carbon monoxide poi-soning, and idiopathic calcification are commonly pre-sented with intracranial calcifications.68-72
Calcified NeoplasmsPrimary neoplasms, such as craniopharyngioma,
oligodendroglioma (Fig 29), choroid plexus papil-loma, meningioma, pituitary adenoma, astrocytoma,pericallosal lipoma, ependymoma, and metastasesfrom lung, breast, and gastrointestinal carcinomas maycontain areas of calcification.47,72-78
InfectionsPrevious inflammatory diseases developing second-
ary to toxoplasmosis, cytomegalovirus, rubella, her-
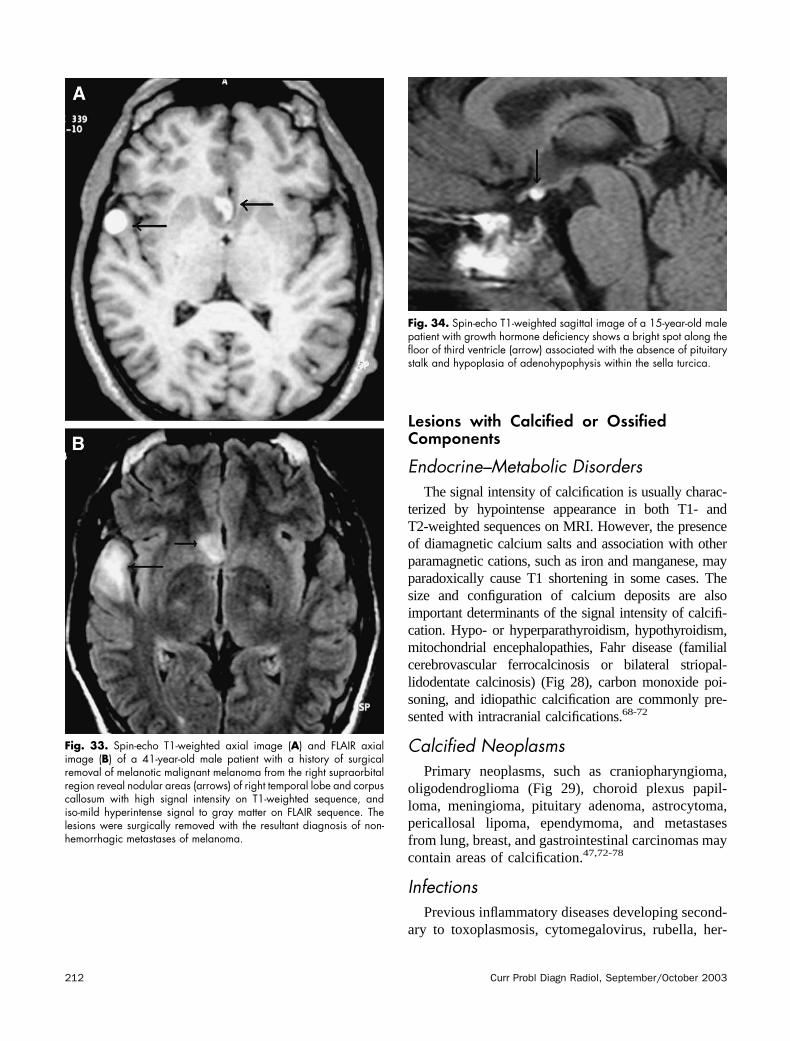
Fig. 33. Spin-echo T1-weighted axial image (A) and FLAIR axialimage (B) of a 41-year-old male patient with a history of surgicalremoval of melanotic malignant melanoma from the right supraorbitalregion reveal nodular areas (arrows) of right temporal lobe and corpuscallosum with high signal intensity on T1-weighted sequence, andiso-mild hyperintense signal to gray matter on FLAIR sequence. Thelesions were surgically removed with the resultant diagnosis of non-hemorrhagic metastases of melanoma.
Fig. 34. Spin-echo T1-weighted sagittal image of a 15-year-old malepatient with growth hormone deficiency shows a bright spot along thefloor of third ventricle (arrow) associated with the absence of pituitarystalk and hypoplasia of adenohypophysis within the sella turcica.
212 Curr Probl Diagn Radiol, September/October 2003

pes, tuberculosis, and cysticercosis infections maycause foci of calcifications.10,68,70
Dural OsteomasOsteomas are benign proliferations of bone located
in the skull or paranasal sinuses. The dural osteomasare very rarely detected lesions. The signal intensity ofdural osteomas is characterized by a hyperintenseappearance on T1- and T1-weighted images, probablysecondary to fibro-fatty stromal components (Fig30).79-81
Lesions with Other MineralAccumulation
Acquired Hepatocerebral DegenerationAcquired hepatocerebral degeneration is a rare,
nonhereditary, irreversible neurologic syndrome thatoccurs in patients with chronic liver disease associatedwith multiple metabolic insults. Most of the disordersof cerebral function develop rapidly and result mainlyin a disturbance of consciousness ranging from con-fusion to stupor to coma and death. The pathophysi-ology and the locations of the cerebral injuries are
incompletely understood. Enlargement and hyperpla-sia of protoplasmic astrocytes in the cerebral andcerebellar cortex, basal ganglia, and diencephalic nu-clei are seen in acute forms of hepatocerebral degen-eration. Gray and white matter necrosis with cavita-tion, gliosis, and myelin degeneration may occur inchronic forms. A variety of different MRI findingshave been reported in these patients. Hyperintensesignal changes on T1-weighted sequences and hypoin-tense or isointense signal changes on T2-weightedsequences have been reported in the basal ganglia,subthalamic area, quadrigeminal plate, cerebral pe-duncles, internal capsules, and anterior pituitary gland(Fig 31). Bilateral symmetrical hyperintensity of theglobus pallidus particularly is reported in T1-weightedimages in 52% to 100% of patients with chronic liverdiseases. This hyperintense signal change on T1-weighted images is reported to be caused by thedeposition of manganese, most probably reflecting thepresence of an adaptive process designed to improvethe efficacy of ammonia detoxification by astrocytes.The signal hyperintensity may reverse after livertransplantation.82-84
Wilson’s DiseaseWilson’s disease is an autosomal-recessive disease
that is characterized by decreased functional serumceruloplasmin levels and altered copper metabolismwith increased urinary excretion of copper. The dis-ease usually presents in childhood with abnormal toxiccopper deposition in tissues, resulting in cirrhosis, anddegenerative changes in the basal ganglia and brain-stem. The signal-intensity changes on MRI are similarto those of acquired hepatocerebral degeneration (Fig32).85-87
Melanin-containing Lesions
MelanomaMelanoma develops from melanocytes that are
derived from neural crest cells. Melanoma typicallycauses hemorrhagic intracranial metastases (Fig 16);however, cerebral metastases may demonstrate hyper-intense appearances on T1-weighted images and al-most isointense to gray-matter appearance on T2-weighted images secondary to melanotic melanoma,even in the absence of hemorrhage (Fig 33). Thepresence of melanin molecules within the melanocyteswith its unpaired electrons is believed to account for
Fig. 35. Spin-echo T1-weighted axial image of a 42-year-old malepatient with the diagnosis of multiple sclerosis reveals multiple periven-tricular chronic plaque lesions with peripheral high signal intensity.Note the association of ventricular enlargement concordant withlongstanding course of the disease.
Curr Probl Diagn Radiol, September/October 2003 213
the observed paramagnetic effects on signal intensity.Amelanotic metastases from primary melanomas arenot associated with shortening of T1 or T2 values inthe absence of hemorrhage.43,72,88
Neurocutaneous MelanosisNeurocutaneous melanosis is a rare neuroectoder-
mal dysplasia that is characterized by the prolifer-ation of melanocytes in leptomeninges associatedwith multiple congenital pigmented or giant hairycutaneous nevi. It may change into primary centralnervous system melanoma. The patients reveal mul-tiple meningeal-based lesions usually less than 3 cmin diameter with intermediate- to high-signal inten-sity on T1-weighted images and variable signalintensity on T2-weighted images. The lesions revealstrong gadolinium enhancement. Vermian hypopla-sia, arachnoid cysts, and Dandy–Walker malforma-tion may be seen in association with neurocutaneousmelanosis.88-90
Miscellaneous Lesions
Ectopic NeurohypophysisThe normal neurohypophysis demonstrates high-
signal intensity on T1-weighted images. T1 shorteningof the neurohypophysis seems to reflect enhancedrelaxation of water protons in the vicinity of neurose-cretory vesicles that function in the storage and secre-tion of oxytocin and vasopressin. On sagittal MRI, theneurohypophyseal focus of T1 shortening lies imme-diately anterior to the dorsum sella and has beenreferred to as the posterior pituitary bright spot. Thebright spot can be seen as an ectopic zone of T1shortening representing the functional neurohypophy-sis along the floor of the third ventricle (Fig 34). Thisbright spot fails to develop in the normal intrasellarlocation because of impaired formation of the pituitaryinfundibulum, which normally transmits carrier-boundneuropeptide hormones from the hypothalamus to theneurohypophysis. The failure of development of thepituitary infundibulum and hypoplasia of the adeno-
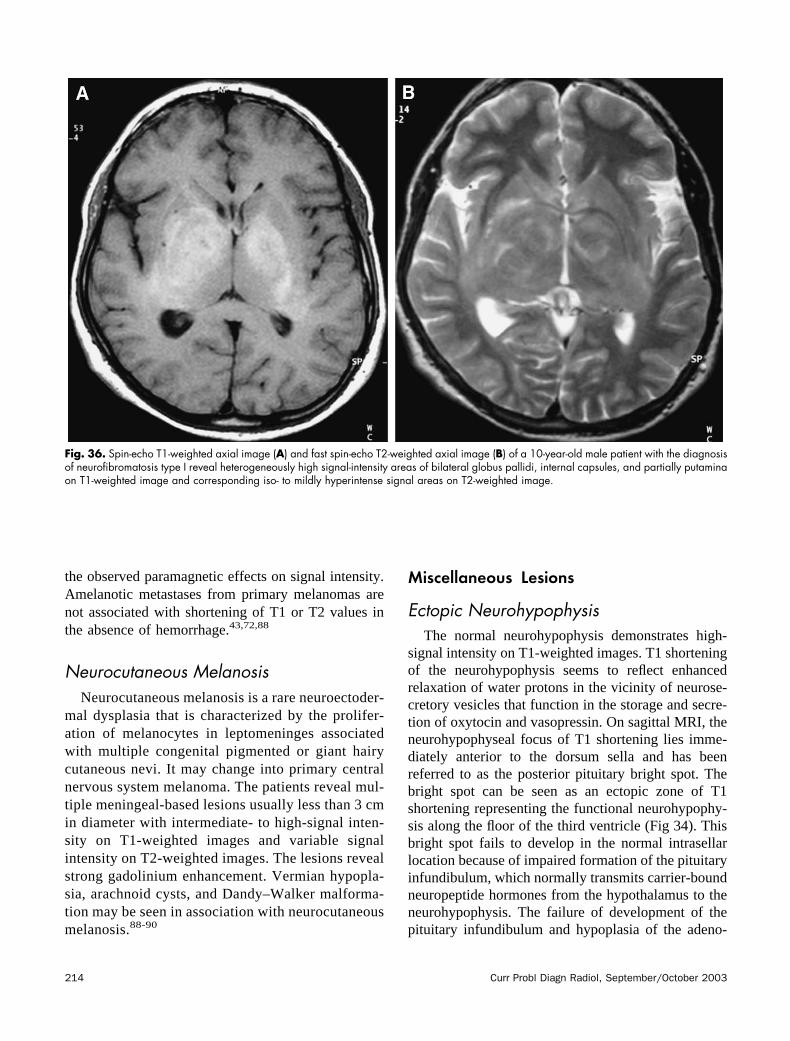
Fig. 36. Spin-echo T1-weighted axial image (A) and fast spin-echo T2-weighted axial image (B) of a 10-year-old male patient with the diagnosisof neurofibromatosis type I reveal heterogeneously high signal-intensity areas of bilateral globus pallidi, internal capsules, and partially putaminaon T1-weighted image and corresponding iso- to mildly hyperintense signal areas on T2-weighted image.
214 Curr Probl Diagn Radiol, September/October 2003

hypophysis may be isolated abnormalities or part of amidline dysgenesis syndrome.47,91,92
Chronic Phase of Multiple SclerosisMultiple sclerosis is the most common demyeli-
nating disease. The plaque lesions of multiple scle-rosis have usually low- to intermediate-signal inten-sity on T1-weighted images and high-signalintensity on T2-weighted images with or withoutgadolinium enhancement depending on the activityof disease. Chronic plaque lesions of multiple scle-rosis may be characterized by peripheral T1 short-ening (Fig 35). The basis for such peripheral T1shortening is undetermined but may be related to theaccumulation of myelin degradation products. Thefinding is normally noted in the context of long-standing disease. Long-standing multiple sclerosismay also be associated with ventricular and sulcalenlargement, associated with variable degrees ofcerebral atrophy.93-97
Neurofibromatosis Type INeurofibromatosis type I is the most common
neurocutaneous syndrome with an autosomal-domi-nant transmission. Focal areas of high-signal intensityare present in the basal ganglia (most commonlyglobus pallidi), thalami, hippocampal gyri, and brain-stem. The lesions are benign, multiple, nonenhancingsignal areas with minimal or no mass effect. They arethought to represent hamartomas, spongiotic, or vac-uolar changes of myelin with usually high signal onT2-weighted images and intermediate to slightly highsignal on T1-weighted images (Fig 36). Although theprecise reason for the signal-intensity changes is notclear, it may be attributed to an admixture of areas ofmyelin breakdown and remyelination of initially de-stroyed myelin and probable association of microcal-cifications. They may show spontaneous regressionover time by serial MRI.98-101
REFERENCES1. Zaheer A, Ozsunar Y, Schaefer PW. Magnetic resonance
imaging of cerebral hemorrhagic stroke. Top Magn ResonImaging 2000;11:288-99.
2. Castillo M, Scatliff JH, Kwock L, et al. Postmortem MRimaging of lobar cerebral infarction with pathologic and invivo correlation. Radiographics 1996;16:241-50.
3. Pessin MS, Teal PA, Caplan LR. Hemorrhagic infarction:guilt by association? Am J Neuroradiol 1991;12:1123-6.
4. Komiyama M, Nakajima H, Nishikawa M, et al. Serial MRobservation of cortical laminar necrosis caused by braininfarction. Neuroradiology 1998;40:771-7.
5. Serrano Ponz M, Ara Callizo JR, Fayed Miquel N, et al.Hypoxic encephalopathy and cortical laminar necrosis. RevNeurol 2001;32:843-7.
6. elq Uessar A, Meunier JC, Delmaire C, et al. MRI imagingin cortical laminar necrosis. J Radiol 1999;80:913-6.
7. Komiyama M, Nishikawa M, Yasui T. Cortical laminarnecrosis in brain infarcts: chronological changes on MRI.Neuroradiology 1997;39:474-9.
8. Server A, Dullerud R, Haakonsen M, et al. Post-traumaticcerebral infarction. Neuroimaging findings, etiology andoutcome. Acta Radiol 2001;42:254-60.
9. LeBihan D, Turner R, Douek P, et al. Diffusion MR imaging:clinical applications. Am J Roentgenol 1992;159:591-9.
10. Bale JF Jr, Murph JR. Congenital infections and the nervoussystem. Pediatr Clin North Am 1992;39:669-90.
11. Bradley WG Jr. Hemorrhage and hemorrhagic infections inthe brain. Neuroimaging Clin North Am 1994;4:707-32.
12. Kleinschmidt–DeMasters BK, Gilden DH. The expandingspectrum of herpes virus infections of the nervous system.Brain Pathol 2001;11:440-51.
13. Demaerel P, Wilms G, Robberecht W, et al. MRI of herpessimplex encephalitis. Neuroradiology 1992;34:490-3.
14. Barkovich AJ, Atlas SW. Magnetic resonance imaging ofintracranial hemorrhage. Radiol Clin North Am 1988;26:801-20.
15. Lang EW, Ren Ya Z, Preul C, et al. Stroke patterninterpretation: the variability of hypertensive versus amyloidangiopathy hemorrhage. Cerebrovasc Dis 2001;12:121-30.
16. Offenbacher H, Fazekas F, Schmidt R, et al. MR of cerebralabnormalities concomitant with primary intracerebral hema-tomas. Am J Neuroradiol 1996;17:573-8.
17. Boto GR, Lobato RD, Rivas JJ, et al. Basal ganglia hema-tomas in severely head injured patients: clinicoradiologicalanalysis of 37 cases. J Neurosurg 2001;94:224-32.
18. Felderhoff–Mueser U, Rutherford MA, Squier WV, et al.Relationship between MR imaging and histopathologic find-ings of the brain in extremely sick preterm infants. Am JNeuroradiol 1999;20:1349-57.
19. Warren DJ, Hoggard N, Walton L, et al. Cerebral arterio-venous malformations: comparison of novel magnetic reso-nance angiographic techniques and conventional catheterangiography. Neurosurgery 2001;48:973-82.
20. Kupersmith MJ, Kalish H, Epstein F, et al. Natural history ofbrainstem cavernous malformations. Neurosurgery 2001;48:47-53.
21. Destian S, Sze G, Krol G, et al. MR imaging of hemorrhagicintracranial neoplasms. Am J Roentgenol 1989;152:137-44.
22. Firsching R, Woischneck D, Klein S, et al. Classification ofsevere head injury based on magnetic resonance imaging.Acta Neurochir (Wien) 2001;143:263-71.
23. Bruce DA. Imaging after head trauma: why, when andwhich. Childs Nerv Syst 2000;16:755-9.
24. Gentry LR. Imaging of closed head injury. Radiology 1994;191:1-17.
25. Dashti SR, Decker DD, Razzaq A, et al. Current patterns ofinflicted head injury in children. Pediatr Neurosurg 1999;31:302-6.
Curr Probl Diagn Radiol, September/October 2003 215

26. Parizel PM, Ozsarlak XX, Van Goethem JW, et al. Imagingfindings in diffuse axonal injury after closed head trauma.Eur Radiol 1998;8:960-5.
27. Mittl RL, Grossman RI, Hiehle JF, et al. Prevalence of MRevidence of diffuse axonal injury in patients with mild headinjury and normal head CT findings. Am J Neuroradiol1994;15:1583-9.
28. Karantanas A, Paterakis K. Magnetic resonance imaging andbrainstem injury. J Neurosurg 2000;92:896-7.
29. Kivisaari RP, Salonen O, Servo A, et al. MR imaging afteraneurysmal subarachnoid hemorrhage and surgery: a long-term follow-up study. Am J Neuroradiol 2001;22:1143-8.
30. van Gijn J, Rinkel GJ. Subarachnoid haemorrhage: diagno-sis, causes and management. Brain 2001;24:249-78.
31. Sullivan TP, Jarvik JG, Cohen WA. Follow-up of conserva-tively managed epidural hematomas: implications for timingof repeat CT. Am J Neuroradiol 1999;20:107-13.
32. Williams VL, Hogg JP. Magnetic resonance imaging ofchronic subdural hematoma. Neurosurg Clin North Am2000;11:491-8.
33. Romano VA, Toffol GJ. Confirmation of traumatic inter-hemispheric subdural hematoma by magnetic resonanceimaging. J Emerg Med 1994;12:369-73.
34. Keeney SE, Adcock EW, McArdle CB. Prospective obser-vations of 100 high-risk neonates by high-field (1.5 Tesla)magnetic resonance imaging of the central nervous system: I.Intraventricular and extracerebral lesions. Pediatrics 1991;87:421-30.
35. Duncan CC, Ment LR. Intraventricular hemorrhage andprematurity. Neurosurg Clin North Am 1993;4:727-34.
36. Fusch C, Ozdoba C, Kuhn P, et al. Perinatal ultrasonographyand magnetic resonance imaging findings in congenitalhydrocephalus associated with fetal intraventricular hemor-rhage. Am J Obstet Gynecol 1997;177:512-8.
37. Massa–Micon B, Luparello V, Bergui M, et al. De novocavernoma case report and review of literature. Surg Neurol2000;53:484-7.
38. Houtteville JP. Brain cavernoma: a dynamic lesion. SurgNeurol 1997;48:610-4.
39. Firat MM, Cekirge S, Saatci I, et al. Guglielmi detachablecoil treatment of a partially thrombosed giant basilar arteryaneurysm in a child. Neuroradiology 2000;42:142-4.
40. Katayama Y, Tsubokawa T, Miyazaki S, et al. Growth oftotally thrombosed giant aneurysm within the posteriorcranial fossa. Diagnostic and therapeutic considerations.Neuroradiology 1991;33:168-70.
41. Sze G, Milano E, Johnson C, et al. Detection of brainmetastases: comparison of contrast-enhanced MR with un-enhanced MR and enhanced CT. Am J Neuroradiol 1990;11:785-91.
42. Okamoto K, Ito J, Ishikawa K, et al. Diffusion-weightedecho-planar MR imaging in differential diagnosis of braintumors and tumor-like conditions. Eur Radiol 2000;10:1342-50.
43. Lieu AS, Hwang SL, Howng SL, et al. Brain tumors withhemorrhage. J Formos Med Assoc 1999;98:365-7.
44. Isoda H, Takahashi M, Arai T, et al. Multiple haemorrhagicbrain metastases from papillary thyroid cancer. Neuroradiol-ogy 1997;39:198-202.
45. Piotin M, Tampieri D, Rufenacht DA, et al. The various MRIpatterns of pituitary apoplexy. Eur Radiol 1999;9:918-23.
46. Kurihara N, Takahashi S, Higano S, et al. Hemorrhage inpituitary adenoma: correlation of MR imaging with operativefindings. Eur Radiol 1998;8:971-6.
47. Yousem DM, Arrington JA, Kumar AJ, et al. Bright lesionson sellar/parasellar T1-weighted scans. Clin Imaging 1990;14:99-105.
48. Pollock BE, Schreiner SA, Huston J. A theory on the naturalhistory of colloid cysts of the third ventricle. Neurosurgery2000;46:1077-81.
49. Young WB, Silberstein SD. Paroxysmal headache caused bycolloid cyst of the third ventricle: case report and review ofthe literature. Headache 1997;37:15-20.
50. Armao D, Castillo M, Chen H, et al. Colloid cyst of the thirdventricle: imaging- pathologic correlation. Am J Neuroradiol2000;21:1470-7.
51. Gonzales–Portillo G, Tomita T. The syndrome of inappro-priate secretion of antidiuretic hormone: an unusual presen-tation for childhood craniopharyngioma: report of threecases. Neurosurgery 1998;42:917-21.
52. Ross DA, Norman D, Wilson CB. Radiologic characteristicsand results of surgical management of Rathke’s cysts in 43patients. Neurosurgery 1992;30:173-9.
53. Loevner LA. Imaging features of posterior fossa neoplasmsin children and adults. Semin Roentgenol 1999;34:84-101.
54. Gupta VK, Khandelwal N, Gupta SK, et al. Cranial cysticepidermoid: report of two cases and review of the literature.Australas Radiol 1996;40:434-6.
55. Ochi M, Hayashi K, Hayashi T, et al. Unusual CT and MRappearance of an epidermoid tumor of the cerebellopontineangle. Am J Neuroradiol 1998;19:1113-5.
56. Ikushima I, Korogi Y, Hirai T, et al. MR of epidermoids witha variety of pulse sequences. Am J Neuroradiol 1997;18:1359-63.
57. Bonneville F, Sarrazin JL, Marsot–Dupuch K, et al. Unusuallesions of the cerebellopontine angle: a segmental approach.Radiographics 2001;21:419-38.
58. Bakshi R, Shaikh ZA, Kamran S, et al. MRI findings in 32consecutive lipomas using conventional and advanced se-quences. J Neuroimaging 1999;9:134-40.
59. Ickowitz V, Eurin D, Rypens F, et al. Prenatal diagnosis andpostnatal follow-up of pericallosal lipoma: report of sevennew cases. Am J Neuroradiol 2001;22:767-72.
60. Sener RN. Isolated choroid plexus lipomas. Comput MedImaging Graph 1995;19:423-6.
61. Uchino A, Hasuo K, Matsumoto S, et al. Solitary choroidplexus lipomas: CT and MR appearance. Am J Neuroradiol1993;14:116-8.
62. Patkar D, Krishnan A, Patankar T, et al. Ruptured intracra-nial dermoids: magnetic resonance imaging. J Postgrad Med1999;45:49-52.
63. Karabulut N, Oguzkurt L. Tetraventricular hydrocephalusdue to ruptured intracranial dermoid cyst. Eur Radiol 2000;10:1810-1.
64. LeRoux P, Hope A, Lofton S, et al. Lipomatous meningioma:an uncommon tumor with distinct radiographic findings.Surg Neurol 1989;32:360-5.
216 Curr Probl Diagn Radiol, September/October 2003

65. Roncaroli F, Scheithauer BW, Laeng RH, et al. Lipomatousmeningioma: a clinicopathologic study of 18 cases withspecial reference to the issue of metaplasia. Am J Surg Pathol2001;25:769-75.
66. Jesionek–Kupnicka D, Liberski PP, Kordek R, et al. Meta-plastic meningioma with lipomatous changes. Folia Neuro-pathol 1997;35:187-90.
67. Okamoto K, Ito J, Tokiguchi S, et al. Development of fatwithin a meningioma. Neuroradiology 1996;38:214-6.
68. Avrahami E, Cohn DF, Feibel M, et al. MRI demonstrationand CT correlation of the brain in patients with idiopathicintracerebral calcification. J Neurol 1994;241:381-4.
69. Manyam BV, Bhatt MH, Moore WD, et al. Bilateral strio-pallidodentate calcinosis: cerebrospinal fluid, imaging, andelectrophysiological studies. Ann Neurol 1992;31:379-84.
70. Wimberger D, Prayer L, Kramer J, et al. MRI in basalganglia diseases. J Neural Transm Suppl 1991;33:133-40.
71. O’Donnell P, Buxton PJ, Pitkin A, et al. The magneticresonance imaging appearances of the brain in acute carbonmonoxide poisoning. Clin Radiol 2000;55:273-80.
72. Boyko OB, Burger PC, Shelburne JD, et al. Non-hememechanisms for T1 shortening: pathologic, CT, and MRelucidation. Am J Neuroradiol 1992;13:1439-45.
73. Gupta V, Singh D, Sinha S, et al. An oligoastrocytoma withwidespread calcification along axonal fibres. Neurol India2001;49:174-7.
74. Perry A, Scheithauer BW, Szczesniak DM, et al. Combinedoligodendroglioma/pleomorphic xanthoastrocytoma: a prob-able collision tumor [case report]. Neurosurgery 2001;48:1358-61.
75. Sastre–Garriga J, Tintore M, Montaner J, et al. Calcifiedcerebral metastases. Study of two cases and review ofliterature. Neurologia 2000;15:136-9.
76. Dibiane A, Amrar F, Abdelmoumni A, et al. Multiplecalcified cerebral metastases revealing bronchial adenocarci-noma. Apropos of a case. J Radiol 1998;79:563-5.
77. Stadnik T, Deroover J, Gosens A, et al. Calcified, cystic brainmetastases. Eur J Radiol 1997;25:36-40.
78. Duval L, Defebvre L, Durieu J, et al. Multiple calcified brainmetastases revealing a lung carcinoma. Acta Neurol Belg1996;96:312-5.
79. Lee ST, Lui TN. Intracerebral osteoma: case report. Br JNeurosurg 1997;11:250-2.
80. Choudhury AR, Haleem A, Tjan GT. Solitary intraduralintracranial osteoma. Br J Neurosurg 1995;9:557-9.
81. Ruelle A, Datti R, Andrioli G. Cerebellopontine angleosteoma causing trigeminal neuralgia: case report. Neurosur-gery 1994;35:1135-7.
82. Jog MS, Lang AE. Chronic acquired hepatocerebraldegeneration: case reports and new insights. Mov Disord1995;10:714-22.
83. Lee J, Lacomis D, Comu S, et al. Acquired hepatocerebraldegeneration: MR and pathologic findings. Am J Neuroradiol1998;19:485-7.
84. Morgan MY. Cerebral magnetic resonance imaging in pa-tients with chronic liver disease. Metab Brain Dis 1998;13:273-90.
85. Giagheddu M, Tamburini G, Piga M, et al. Comparison ofMRI, EEG, EPs and ECD-SPECT in Wilson’s disease. ActaNeurol Scand 2001;103:71-81.
86. Alanen A, Komu M, Penttinen M, et al. Magnetic resonanceimaging and proton MR spectroscopy in Wilson’s disease.Br J Radiol 1999;72:749-56.
87. Mochizuki H, Kamakura K, Masaki T, et al. Atypical MRIfeatures of Wilson’s disease: high signal in globus palliduson T1-weighted images. Neuroradiology 1997;39:171-4.
88. Akinwunmi J, Sgouros S, Moss C, et al. Neurocutaneousmelanosis with leptomeningeal melanoma. Pediatr Neuro-surg 2001;35:277-9.
89. Foster RD, Williams ML, Barkovich AJ, et al. Giant con-genital melanocytic nevi: the significance of neurocutaneousmelanosis in neurologically asymptomatic children. PlastReconstr Surg 2001;107:933-41.
90. Byrd SE, Reyes–Mugica M, Darling CF, et al. MR ofleptomeningeal melanosis in children. Eur J Radiol 1995;20:93-9.
91. Mucelli RSP, Frezza F, Magnaldi S, et al. Magnetic reso-nance imaging in patients with panhypopituitarism. EurRadiol 1992;2:42-6.
92. Ultmann MC, Siegel SF, Hirsch WL, et al. Pituitary stalk andectopic hyperintense T1 signal on magnetic resonance imag-ing. Implications for anterior pituitary dysfunction. Am J DisChild 1993;147:647-52.
93. Wallace CJ, Seland TP, Fong TC. Multiple sclerosis: theimpact of MR imaging. Am J Roentgenol 1992;158:849-57.
94. Lucchinetti C, Bruck W, Noseworthy J. Multiple sclerosis:recent developments in neuropathology, pathogenesis, mag-netic resonance imaging studies and treatment. Curr OpinNeurol 2001;14:259-69.
95. Nyul LG, Udupa JK. MR image analysis in multiple sclero-sis. Neuroimaging Clin North Am 2000;10:799-816.
96. Simon JH. Brain and spinal cord atrophy in multiple sclero-sis. Neuroimaging Clin North Am 2000;10:753-70.
97. Barkhof F, Karas GB, van Walderveen MA. T1 hypointen-sities and axonal loss. Neuroimaging Clin North Am 2000;10:739-52.
98. Terada H, Barkovich AJ, Edwards MSB, et al. Evolution ofhigh-intensity basal ganglia lesions on T1-weighted MR inneurofibromatosis type I. Am J Neuroradiol 1996;17:755-60.
99. Raininko R, Thelin L, Eeg-Olofsson XX. Non-neoplasticbrain abnormalities on MRI in children and adolescents withneurofibromatosis type 1. Neuropediatrics 2001;32:225-30.
100. Griffiths PD, Blaser S, Mukonoweshuro W, et al. Neurofi-bromatosis bright objects in children with neurofibroma-tosis type 1: a proliferative potential? Pediatrics 1999;104:e49.
101. DeBella K, Poskitt K, Szudek J, et al. Use of unidentifiedbright objects on MRI for diagnosis of neurofibromatosis 1 inchildren. Neurology 2000;54:1646-50.
Curr Probl Diagn Radiol, September/October 2003 217