spontaneous surface tension- induced displacement … · spontaneous surface tension- induced...
TRANSCRIPT
SPONTANEOUS SURFACE TENSION-INDUCED DISPLACEMENT OF A LIQUID PLUG IN CAPILLARY TUBE
J. Kim1, J.D. O’Neill1, and G. Vunjak-Novakovic1, 2* 1Department of Biomedical Engineering, Columbia University, New York, NY 10027, USA
2Department of Medicine, Columbia University, New York, NY 10032, USA
ABSTRACT We report on the underlying mechanism of spontaneous displacement of liquid plugs induced by
surface tension in a small confined geometry (e.g., capillary tube). Experimental results show that the plug displacement is due to the instantaneous increase in kinetic energy that results from the surface tension between liquid plugs. Thus, the distance between plugs, which is inversely related to the surface tension energy, modulates the displacement speed and the total travel distance of the plugs. Our study provides an important basis for understanding flow phenomena of liquid plugs within small geometries. KEYWORDS: Surface tension, Kinetic energy, Liquid plug displacement
INTRODUCTION
Surface tension can produce sufficient energy to promote the flow and movement of small objects (length scale: 1 mm). For instance, by employing surface tension forces, shorebirds move prey suspended in water droplets toward their mouths by repeatedly opening and closing their beaks. Droplet motion is enabled by the surface tension forces generated by contact-angle hysteresis within the bird’s beak [1].
Additionally, recent studies demonstrated that small liquid plugs traveling through a microchannel network can spontaneously displace by surface tension when plugs traveling ahead are ruptured [2]. While understanding the subtle physical mechanism of plug displacement would enhance the ability to manipulate small volumes of liquid, studies on this fluid transport behavior are lacking and require further investigation.
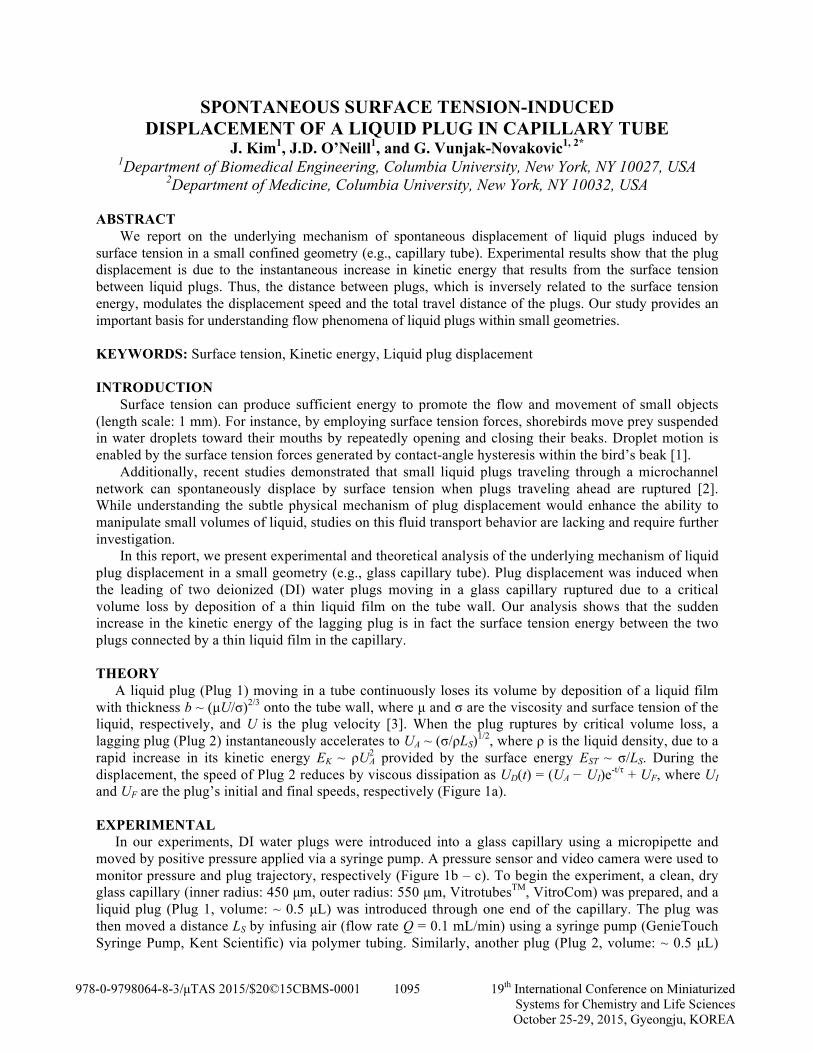
In this report, we present experimental and theoretical analysis of the underlying mechanism of liquid plug displacement in a small geometry (e.g., glass capillary tube). Plug displacement was induced when the leading of two deionized (DI) water plugs moving in a glass capillary ruptured due to a critical volume loss by deposition of a thin liquid film on the tube wall. Our analysis shows that the sudden increase in the kinetic energy of the lagging plug is in fact the surface tension energy between the two plugs connected by a thin liquid film in the capillary.
THEORY
A liquid plug (Plug 1) moving in a tube continuously loses its volume by deposition of a liquid film with thickness b ~ (µU/σ)2/3 onto the tube wall, where µ and σ are the viscosity and surface tension of the liquid, respectively, and U is the plug velocity [3]. When the plug ruptures by critical volume loss, a lagging plug (Plug 2) instantaneously accelerates to UA ~ (σ/ρLS)1/2, where ρ is the liquid density, due to a rapid increase in its kinetic energy EK ~ ρU2
A provided by the surface energy EST ~ σ/LS. During the displacement, the speed of Plug 2 reduces by viscous dissipation as UD(t) = (UA − UI)e-t/τ + UF, where UI and UF are the plug’s initial and final speeds, respectively (Figure 1a).
EXPERIMENTAL
In our experiments, DI water plugs were introduced into a glass capillary using a micropipette and moved by positive pressure applied via a syringe pump. A pressure sensor and video camera were used to monitor pressure and plug trajectory, respectively (Figure 1b – c). To begin the experiment, a clean, dry glass capillary (inner radius: 450 µm, outer radius: 550 µm, VitrotubesTM, VitroCom) was prepared, and a liquid plug (Plug 1, volume: ~ 0.5 µL) was introduced through one end of the capillary. The plug was then moved a distance LS by infusing air (flow rate Q = 0.1 mL/min) using a syringe pump (GenieTouch Syringe Pump, Kent Scientific) via polymer tubing. Similarly, another plug (Plug 2, volume: ~ 0.5 µL)
1095978-0-9798064-8-3/µTAS 2015/$20©15CBMS-0001 19th International Conference on Miniaturized Systems for Chemistry and Life Sciences October 25-29, 2015, Gyeongju, KOREA
was introduced through the same end of the capillary. Both plugs were moved in the capillary by airflow (Q = 0.5 mL/min) applied to the capillary tube via the syringe pump. The pressure applied at the capillary inlet was measured using a pressure sensor (MPXV7002GC6U, Freescale Semiconductor), while videos of the plugs traveling were recorded using a digital camera (Nikon J1, Nikon).
RESULTS AND DISCUSSION
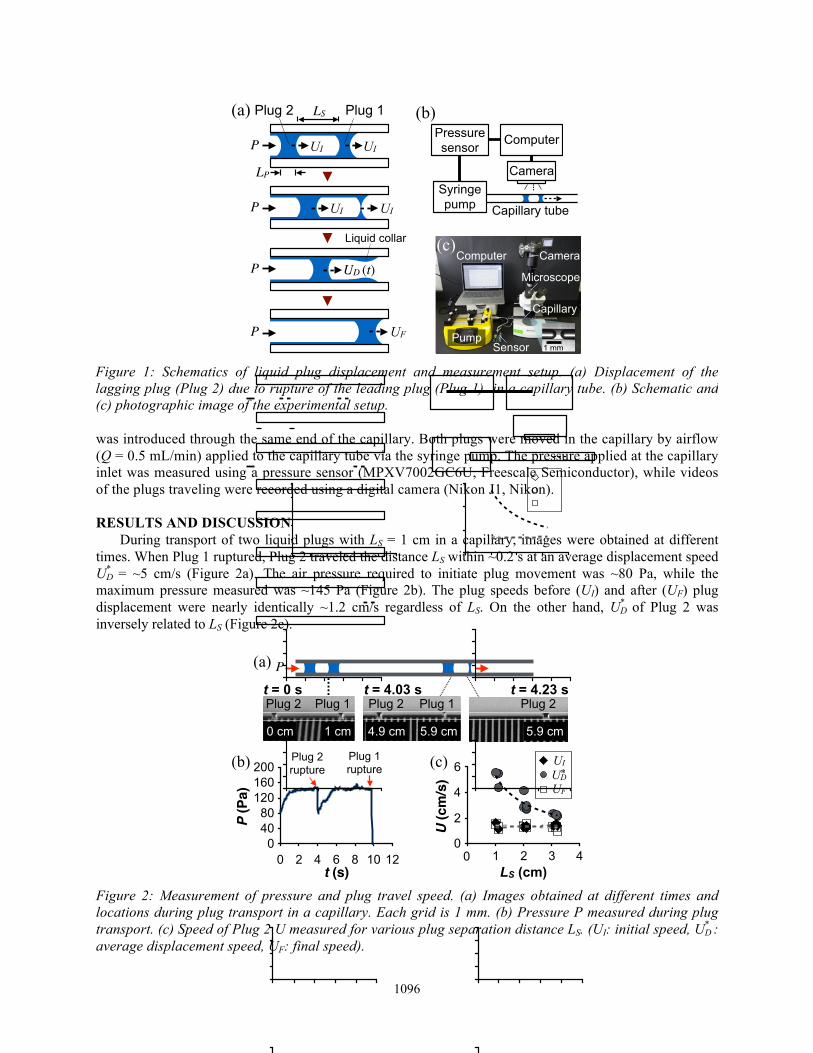
During transport of two liquid plugs with LS = 1 cm in a capillary, images were obtained at different times. When Plug 1 ruptured, Plug 2 traveled the distance LS within ~0.2 s at an average displacement speed U*
D = ~5 cm/s (Figure 2a). The air pressure required to initiate plug movement was ~80 Pa, while the maximum pressure measured was ~145 Pa (Figure 2b). The plug speeds before (UI) and after (UF) plug displacement were nearly identically ~1.2 cm/s regardless of LS. On the other hand, U*
D of Plug 2 was inversely related to LS (Figure 2c).
P
P
P
P
LS
UI
UI
Plug 1Plug 2
UF
UI
UI
UD (t)
LP
Liquid collar
(a)
(a)
t = 0 s
0 cm 1 cm
Plug 2 Plug 1 t = 4.03 s t = 4.23 s
4.9 cm 5.9 cm 5.9 cm
Plug 2 Plug 1 Plug 2
P
0.00
0.02
0.04
0.06
0 0.01 0.02 0.03 0.04
U (c
m/s
)
LS (cm)
6(c) UIUDUF*
4
2
00 1 2 3 4
Pres
sure
(Pa)
0
40
80
120
160
200
Time (s)
0 2 4 6 8 10 12
(b)
t (s)
Plug 1 rupture
Plug 2 rupture
P (P
a)
200
120
400
80
160
(b)Pressure sensor
Computer
CameraSyringe pump Capillary tube
1 mm
CameraComputer
PumpSensor
Microscope
(c)
Capillary
Plug
le
ngth
(m
m)
0.000.200.400.600.80
Time (s)0.0 0.5 1.0 1.5
Plug
leng
th
(mm
)
0.000.200.400.600.80
Time (s)0.0 0.1 0.2 0.3 0.4 0.5
(b)
Pick
upPi
ckup
(d)
LS = 1.2 cm
LS = 2.1 cm
3τ
3τ
L P (m
m)
L P (m
m)
0.80.60.40.20.0
0.80.60.40.20.0
t (s)0.0 0.1 0.2 0.3 0.4 0.5
t (s)0.0 0.5 1.0 1.5
Spee
d (m
/s)
0.00
0.10
0.20
Time (s)0.0 0.1 0.2 0.3 0.4 0.5
Spee
d (m
/s)
0.00
0.05
0.10
0.15
0.20
Time (s)
0.0 0.5 1.0 1.5
(a)
(c)
LS = 1.2 cm
LS = 2.1 cm
MeasuredUD = 15.8e-t/0.03 + 1.2
MeasuredUD = 14.8e-t/0.03 + 1.2
20.015.010.0
5.00.0U
(cm
/s)
5τ
20.015.010.0
5.00.0
t (s)
t (s)
U (c
m/s
)
0.0 0.1 0.2 0.3 0.4 0.5
0.0 0.5 1.0 1.5
5τ
Figure 2: Measurement of pressure and plug travel speed. (a) Images obtained at different times and locations during plug transport in a capillary. Each grid is 1 mm. (b) Pressure P measured during plug transport. (c) Speed of Plug 2 U measured for various plug separation distance LS. (UI: initial speed, U*
D : average displacement speed, UF: final speed).
P
P
P
P
LS
UI
UI
Plug 1Plug 2
UF
UI
UI
UD (t)
LP
Liquid collar
(a)
(a)
t = 0 s
0 cm 1 cm
Plug 2 Plug 1 t = 4.03 s t = 4.23 s
4.9 cm 5.9 cm 5.9 cm
Plug 2 Plug 1 Plug 2
P
0.00
0.02
0.04
0.06
0 0.01 0.02 0.03 0.04
U (c
m/s
)
LS (cm)
6(c) UIUDUF*
4
2
00 1 2 3 4
Pres
sure
(Pa)
0
40
80
120
160
200
Time (s)
0 2 4 6 8 10 12
(b)
t (s)
Plug 1 rupture
Plug 2 rupture
P (P
a)
200
120
400
80
160
(b)Pressure sensor
Computer
CameraSyringe pump Capillary tube
1 mm
CameraComputer
PumpSensor
Microscope
(c)
Capillary
Plug
le
ngth
(m
m)
0.000.200.400.600.80
Time (s)0.0 0.5 1.0 1.5
Plug
leng
th
(mm
)
0.000.200.400.600.80
Time (s)0.0 0.1 0.2 0.3 0.4 0.5
(b)
Pick
upPi
ckup
(d)
LS = 1.2 cm
LS = 2.1 cm
3τ
3τ
L P (m
m)
L P (m
m)
0.80.60.40.20.0
0.80.60.40.20.0
t (s)0.0 0.1 0.2 0.3 0.4 0.5
t (s)0.0 0.5 1.0 1.5
Spee
d (m
/s)
0.00
0.10
0.20
Time (s)0.0 0.1 0.2 0.3 0.4 0.5
Spee
d (m
/s)
0.00
0.05
0.10
0.15
0.20
Time (s)
0.0 0.5 1.0 1.5
(a)
(c)
LS = 1.2 cm
LS = 2.1 cm
MeasuredUD = 15.8e-t/0.03 + 1.2
MeasuredUD = 14.8e-t/0.03 + 1.2
20.015.010.0
5.00.0U
(cm
/s)
5τ
20.015.010.0
5.00.0
t (s)
t (s)
U (c
m/s
)
0.0 0.1 0.2 0.3 0.4 0.5
0.0 0.5 1.0 1.5
5τ
Figure 1: Schematics of liquid plug displacement and measurement setup. (a) Displacement of the lagging plug (Plug 2) due to rupture of the leading plug (Plug 1) in a capillary tube. (b) Schematic and (c) photographic image of the experimental setup.
1096

P
P
P
P
LS
UI
UI
Plug 1Plug 2
UF
UI
UI
UD (t)
LP
Liquid collar
(a)
(a)
t = 0 s
0 cm 1 cm
Plug 2 Plug 1 t = 4.03 s t = 4.23 s
4.9 cm 5.9 cm 5.9 cm
Plug 2 Plug 1 Plug 2
P
0.00
0.02
0.04
0.06
0 0.01 0.02 0.03 0.04
U (c
m/s
)
LS (cm)
6(c) UIUDUF*
4
2
00 1 2 3 4
Pres
sure
(Pa)
0
40
80
120
160
200
Time (s)
0 2 4 6 8 10 12
(b)
t (s)
Plug 1 rupture
Plug 2 rupture
P (P
a)
200
120
400
80
160
(b)Pressure sensor
Computer
CameraSyringe pump Capillary tube
1 mm
CameraComputer
PumpSensor
Microscope
(c)
Capillary
Plug
le
ngth
(m
m)
0.000.200.400.600.80
Time (s)0.0 0.5 1.0 1.5
Plug
leng
th
(mm
)
0.000.200.400.600.80
Time (s)0.0 0.1 0.2 0.3 0.4 0.5
(b)
Pick
upPi
ckup
(d)
LS = 1.2 cm
LS = 2.1 cm
3τ
3τ
L P (m
m)
L P (m
m)
0.80.60.40.20.0
0.80.60.40.20.0
t (s)0.0 0.1 0.2 0.3 0.4 0.5
t (s)0.0 0.5 1.0 1.5
Spee
d (m
/s)
0.00
0.10
0.20
Time (s)0.0 0.1 0.2 0.3 0.4 0.5
Spee
d (m
/s)
0.00
0.05
0.10
0.15
0.20
Time (s)
0.0 0.5 1.0 1.5
(a)
(c)
LS = 1.2 cm
LS = 2.1 cm
MeasuredUD(t) = 15.8e-t/0.03 + 1.2
MeasuredUD(t) = 14.8e-t/0.03 + 1.2
20.015.010.0
5.00.0U
(cm
/s)
5τ
20.015.010.0
5.00.0
t (s)
t (s)U
(cm
/s)
0.0 0.1 0.2 0.3 0.4 0.5
0.0 0.5 1.0 1.5
5τ
Figure 3: Measurements of travel speed U and length LP of Plug 2 during plug displacement. (a) Travel speed and (b) length of Plug 2 for LS = 1.2 cm. (c) Travel speed and (d) length of Plug 2 for LS = 2.1 cm.
A detailed study of the travel speed U and length LP of Plug 2 was conducted during displacement of
Plug 2 for LS = 1.2 cm and 2.1 cm. Time-lapse images of the plug were obtained from videos recorded using a high-speed camera to determine the plug speeds and length changes. For LS = 1.2 cm, the accelerated plug speed UA ~ 15.8 cm/s, and the final plug speed UF ~ 1.2 cm/s, while τ ~ 0.03 s and thus UD(t) = 15.8e-t/0.03 + 1.2 (Figure 3a). During displacement, the length of Plug 2 initially decreased quickly as the plug traveled rapidly, depositing thicker film, and then increased as it picked up the liquid volume (i.e., liquid collar) deposited on the wall by Plug 1 (Figure 3b). For LS = 2.1 cm, we obtained UD(t) = 14.8e-t/0.03 + 1.2 (Figure 3c) and also observed rapid initial decrease in the plug length followed by the pick-up of liquid volume (Figure 3d).
CONCLUSION
We reported experimental and theoretical studies of the transport behavior of a series of liquid plugs accelerated by surface tension energy in a capillary tube. In particular, we presented the subtle mechanism of the displacement of DI water plugs traveling through a glass capillary tube. Results showed that the plug slows down due to the viscous resistance force at the tube surface during plug displacement, and the plug eventually recovers its initial traveling speed. Thus, plug displacement speed can be UD(t) = (UA − UI)e-t/τ + UF. We envision that these insights will lead to a better understanding of liquid plug transport in small-scale applications such as porous media, capillary networks, and pulmonary conducting airways. ACKNOWLEDGEMENTS
The authors gratefully acknowledge the financial support of the National Institutes of Health (grants HL120046 and EB002520), Mikati Family Fund for Translational Research, and the Raymond and Bever-ly Sackler Foundation.
REFERENCES [1] M. Prakash, D. Quere, and J.W.M. Bush, “Surface Tension Transport of Prey by Feeding Shorebirds:
The Capillary Ratchet,” Science, 320, 931-934, 2008. [2] M. Baudoin, Y. Song, P. Manneville, and C. Baroud, “Airway Reopening Through Catastrophic
Events in a Hierarchical Network,” Proc. Natl. Acad. Sci. USA, 110, 859-864, 2013. [3] F. Bretherton, “The Motion of Long Bubbles in Tubes,” J. Fluid. Mech., 10, 166-188, 1961. CONTACT * Gordana Vunjak-Novakovic; phone: +1-212-305-2304; [email protected]
1097