spokane county profile - government information portal
TRANSCRIPT

������������� �����
����������������������� ������������������������������������������
����
For additional labor market information, contact our
� homepage at www.wa.gov/esd/lmea
� On-line database (WILMA) at www.wilma.org
� Labor Market Information Center (LMIC) at1-800-215-1617
SPOKANE COUNTY PROFILEJANUARY 2001
Labor Market and Economic Analysis BranchEmployment Security Department
This report has been prepared in accordance withRCW 50.38.050.
Carver Gayton, CommissionerWashington State Employment Security Department
Greg Weeks, DirectorLabor Market and Economic Analysis BranchP.O. Box 9046Mail Stop 46000Olympia, WA 98507-9046(360) 438-4800
Prepared by Loretta Payne, Economic Analystand Revelyn Froyalde, Research AnalystLayout by Bonnie Dalebout, Graphic Designer
Price $4.50plus 8.0% sales tax for Washington residents
Acknowledgements:
Spokane Area Economic Development Council801 W. Riverside, Ste. 302Spokane, WA 99201-0901(509) 624-9285
WorkSource SpokaneSouth 130 ArthurP.O. Box TAF-C-14Spokane, WA 99220(509) 532-3000
Fred Walsh, Regional Labor EconomistWashington State Employment Security Department(509) 532-3188

TABLE OF CONTENTSEXECUTIVE SUMMARY ........................... 1
INTRODUCTION ..................................... 2
GEOGRAPHY .......................................... 3
ECONOMIC HISTORY ............................. 4
POPULATION .......................................... 6
Population Trends
Towns and Cities
Age Groups
Demographics
CIVILIAN LABOR FORCE ....................... 10
Demographics
UNEMPLOYMENT ................................. 12
Trend
Unemployment Insurance Claims
Industrial Typology
INDUSTRIES, EMPLOYMENT,AND WAGES .......................................... 16
Employment Trend
Location Quotients
Goods and Services
Annual Average Covered Wage
Agriculture, Forestry, and Fishing
Construction and Mining
Manufacturing
Transportation and Public Utilities
Trade
Finance, Insurance, and Real Estate
Services
Government
Industry Projections
OCCUPATIONAL PROFILE ..................... 27
PERSONAL INCOME.............................. 30
Total Personal Income
Components of Personal Income
Earned Income
Transfer Payments
Investment Income
EMPLOYMENT SERVICES ANDECONOMIC DEVELOPMENT ................. 35
Workforce Development
Economic Development

Spokane County Profile - 1
Spokane County is the economic hub of the area tra-ditionally known as the Inland Empire, most recentlycoined as the Inland Northwest. It has a strong and di-versified manufacturing sector, a wholesale trade andfinance sector that, among its other functions, services alarge agricultural community, and a strong retail tradeand services sector. Spokane County has much to offernew arrivals. Land and housing are relatively inexpen-sive compared to many other large metropolitan areas.Congestion, crime, and pollution are not huge factors asthey are in some areas. And many enjoy the four-seasonweather, particularly when compared to the rain of west-ern Washington.
Population growth has slowed significantly during thelatter part of the last decade, from an average of 2.2percent between 1990 and 1995, to an average of 0.7percent from 1996 to 2000. Despite the negligible growthrate of 0.1 percent in 2000, Spokane County’s popula-tion of 415,000 is the largest of any county in easternWashington and the fourth largest in the state.
Spokane County experienced healthy economicgrowth with an average job growth rate of 3.0 percentfrom 1987 to 1994. Since the peak growth rate of 4.2percent in 1994, it has gradually declined to .9 percentin 1999. Despite the slowdown, the annual job growthrate of .9 percent kept pace with the .9 percent in popu-lation growth and .8 percent growth in the civilian laborforce. The unemployment rate remained relatively lowat 5.2 percent in 1999.
Despite low population and job growth rates, totalpersonal income in 1998 (the most recent data avail-
able) increased 3.7 percent. Spokane per capita incomeincreased 3.8 percent to $23,450, compared to the state-wide PCI of $28,719. Median household income wasestimated to be $36,576 while the statewide average was$48,289. And, in 1999 the annual average wage for thecounty was $27,556, compared to a statewide averageat $35,724. While these income and wage figures seemlow compared to the statewide averages, two facts shouldbe noted: (1) the statewide averages are strongly influ-enced by the higher concentration of population and wellpaid high-tech and aerospace jobs of King County and(2) the cost of living in King County is considerably higherthan in Spokane County.
Despite a strong manufacturing sector with stable anddiverse industries such as primary and fabricated alu-minum production, industrial machinery, electronicequipment, aerospace and other transportation equip-ment the decline in jobs has been most noticeable inthis sector. Manufacturing jobs declined by 1.3 percentin1998 and again by 1.8 percent in 1999, for a total lossof 700 jobs. Over 500 of these jobs were in primary metalindustries, predominately aluminum.
Although construction was showing negative growthin 1997 and 1998, there was a sudden surge in growthof 5.8 percent in 1999. In 1999, the other remainingsectors had growth rates ranging from .4 percent fortrade to 2.5 percent for transportation and public utili-ties (TPU). Overall, the economy of the area is slowingdown, as is the rest of the state and the nation, but isstill healthy.
EXECUTIVE SUMMARY
Spokane County Profile - 2
This report profiles the labor market and economiccharacteristics of Spokane County. It was prepared bythe Labor Market and Economic Analysis (LMEA)Branch of the Washington State Employment SecurityDepartment and is one in a series that profiles labormarket and economic conditions in each ofWashington’s 39 counties.
The profile is designed to assist state and local plan-ners in developing local economic strategies. It is alsoan effective tool for answering labor market and eco-nomic questions frequently asked about the county.Readers with specific information needs should referto the Table of Contents or to the data appendix tomore quickly access those sections of particular inter-est to them.
Like the earlier Spokane County Profile of August1996, the purpose of this report is to provide a compre-hensive labor market and economic analysis of SpokaneCounty. Characteristics profiled include the following:
� physical geography, economic history, anddemographics
� labor force composition and trends� industries, employment, income, and earnings� skills and occupations� economic development and employment services
INTRODUCTION
The profile is available in a Pdf format fromthe LMEA Internet homepage. Much of the in-formation included in this report is also regu-larly updated on the homepage. Current andhistorical labor market information that can beaccessed by area or by type of information canbe found at:
http://www.wa.gov/esd/lmea
Any inquiries or comments about information in theprofile should be directed to the Labor Market and Eco-nomic Analysis Branch or the regional labor economist.

Spokane County Profile - 3
Spokane County is one of four eastern Washingtoncounties set along the Washington-Idaho border. Locatedroughly between the 47th and 48th parallels, Spokane iscentrally located along the border. The county comprisesa total land mass of 1,763.8 square miles (or 2.7 per-cent of the state’s total land mass). As such, it ranks 19thin size among Washington counties.
Spokane County is rectangular in shape save a jaggednorthwest corner. The county is bounded to the northand west by Pend Oreille and Lincoln counties, respec-tively. Its northwest corner is shared with Stevens County.To the south is Whitman County and to the east is thestate of Idaho.
Spokane County’s topography is quite varied. The ter-rain in the north county is increasingly forested andmountainous as it runs up against the foothills of theColville National Forest. This part of the county includesMount Spokane (5,878 feet above sea level). The LittleSpokane River flows through the northern county from
origins further north in Pend Oreille County. The riverflows south to central Spokane County where it mergeswith the larger Spokane River.
From origins in Idaho, the Spokane River flows westinto central Spokane County and the city of Spokane.After winding through the city (and across SpokaneFalls), the Spokane River turns to the northwest where itis joined by the Little Spokane River and delineates partof the border between Spokane and Stevens counties.The river eventually empties into the Columbia River.
The topography in the southeast part of the countyis that of the rich and fertile Palouse Hills. It is thissection of the county that is recognized for its agricul-tural fertility. The southwest part of the county is one ofchanneled rock outcroppings and big lakes (e.g., Bad-ger, Bonnie, Chapman, Clear, Four Lakes, Silver, Will-iams). Much of this region is also part of the TurnbullNational Wildlife Refuge.
GEOGRAPHY
2WKHU�&RXQWLHV
6SRNDQH�&RXQW\
0DMRU�:DWHU
�7�7
Spokane
Coeurd’Alene
PendOreille
StevensFerry
Lincoln
Adams Whitman
CANADAIDAHO
��WA
�
���9 0
���9 0
Spokane County Profile - 4
The following was excerpted from A View of theFalls: An Illustrated History of Spokane, by WilliamStimson; Spokane Corona: Eras & Empires, by EdmundT. Becher; and Spokane, 1889-1964, by the SpokaneCommittee of 64.
Long before the advent of white exploration and settle-ment, the Spokane tribe held sway over present-day Spo-kane County. Parts of the area were also inhabited by theCoeur d’Alene tribe (most of whom are now across theborder in Idaho).
The Spokanes were seminomadic in the sense thattheir migration patterns were largely dictated by seasonalsustenance. Salmon—the staple of their diet—wereabundant in local rivers during summer. Camas rootsand berries, which supplemented their diet, were gath-ered in fall. Late in fall and into winter, the Spokanehunted dear, bear, and other game. The most fascinatingpart of this ritual, however, was their trek across theRockies to the Great Plains to hunt buffalo.
The Spokanes were the first inhabitants of the regionto engage in trade and commerce. In fact, they oftenoperated as middlemen in trade between coastal tribesand those of the Great Plains. For example, they wouldtrade their dried salmon to the Blackfeet tribe for buf-falo hides, and then trade some of the hides to the coastaltribes for shells and other coastal goods. There werealso the Colvilles and other prominent tribes of what isnow eastern Washington. With the Spokanes, these tribesformed a powerful confederation.
The first whites in present-day Spokane County werefur traders and trappers. In 1810, the North West Com-pany, a Canadian firm, established an outpost wherethe Spokane and Little Spokane rivers meet. The furtrade would become an institution in the area for thenext four decades.
Missionaries arrived in the Spokane Valley in greatnumbers in the late 1830s and early 1840s. Among themore notable were the Reverend Henry T. Cowley, andJesuit Priests Pierre De Smet, Joseph Joset, and JosephCataldo. They came with the intention of converting thelocal tribes to Christianity, and had varying success.
White settlement of the region got fully underway inthe 1850s. The pace of homesteading was such thatWashington became its own territory in 1853 (havingbeen partitioned from Oregon Territory). As whites
moved into the area, local tribes were displaced orforced to relocate in order to accommodate new settle-ment. Treaties established in 1855 were broken, re-sulting in the Indian War of 1855-1858. After a seriesof battles in Spokane County—including the defeat ofColonel Steptoe at present-day Rosalia—the Indiantribes were finally suppressed.
With the land secured for expansion, white settlersproceeded to engage in agriculture, particularly the cul-tivation of wheat and other grains and fruit orchards.This activity was particularly evident in the south andwest parts of the county.
In 1873, James N. Glover purchased 158 acres of landnear Spokane Falls in hopes of creating a new town.Those 158 acres comprise most of Spokane’s present-day downtown business district. For that reason, Gloveris referred to as the “Father of Spokane.” Spokane grewquickly as the business center of the region known asthe Inland Empire (extending west to the Cascades, eastto the Rockies, north to the Canadian Selkirks, and southto the Blue Mountains). Spokane County was establishedin late 1880.
The Spokane Indian Reservation was established in1881 (the same year the city of Spokane was incorpo-rated). At first, members of the Spokane tribe refused tomove onto the reservation, choosing instead to purchaseproperty around the city and take up farming or ranch-ing. By 1887, however, most were forced off of the landand committed to the reservation.
The discovery of gold, silver, and lead in the Coeurd’Alene region (which generally encompasses present-day Stevens, Ferry, and Pend Oreille counties and north-ern Idaho) in the 1880s precipitated a rush ofprospectors into the region. By the mid-1890s, high min-ing operations were underway in the region—financedlargely by East Coast dollars. Though itself mineral-poor,the city of Spokane benefited tremendously from thedollars and wealth generated by mining activity—dol-lars that were funneled through the city’s banks, busi-nesses, and other avenues. The city became the choiceof rich mine owners for establishing headquarters andresidences. At the turn of the century, for example, therewere some 200 mining offices in the city. With its myriadof saloons, gambling houses, and houses of prostitution,the city was also a place where miners could escape bleakmining camps.
ECONOMIC HISTORY

Spokane County Profile - 5
In 1889—at the height of Spokane’s mining era—the city was virtually destroyed by a disastrous fire. Al-though devastating, the fire proved a blessing in disguiseas the town fathers took advantage of the disaster andrebuilt the city into a virtual study of classic Europeanarchitecture. Helped by the fortunes of wealthy mineowners (and railroad tycoons), downtown office build-ings and palatial mansions sprung up everywhere.
The arrival of the railroad era in Spokane County wasyet another significant event that unfolded at about thesame time as mining. The Northern Pacific Railroad ledthe way by completing its line through Spokane in 1881.This was followed by the Great Northern and Union Pa-cific railroads in 1901 and 1911, respectively. By the1920s, Spokane was a major railroad town. Approxi-mately 100 trains a day passed through Spokane beforemoving on to some 500 communities across the region.
Spokane had been prevented from developing a largemanufacturing base, however, by railroad pricing poli-cies. It cost Spokane businesses twice as much to shipgoods East as it did comparable businesses in Seattle.Railroads had a monopoly in Spokane while those inPuget Sound had to compete with ocean transport. TheInterstate Commerce Commission forced railroads toamend their rates in 1918.
The Great Depression of 1929 hit Spokane Countyhard. The city of Spokane, moreover, with its heavy con-centration of financial institutions and retail establish-ments was especially hard hit. Jobs were generated bythe Grand Coulee Dam Project, and irrigation and inex-pensive electricity followed the 1929-34 construction.The onset of World War II in 1941 finally drew the countyout of the depression as Spokane County became thesite of defense activities (e.g., Velox Naval Supply Depot,Galena Army Air Corp Base, Fort George Wright, andBaxter Army Hospital).
Spokane County emerged from World War II with adecidedly newer look, thanks largely to the Departmentof Defense. In 1950, the Army Air Depot was renamedFairchild Air Force Base, adding jobs and a huge mili-tary payroll to the area. The Army Air Corp gave an oldairfield to the city which, in turn, transformed it intoSpokane International Airport. The Velox Supply Depot,with its warehouses and railroad access, became Spo-kane Industrial Park. Meanwhile, Baxter Army Hospitalbecame the Veterans Hospital.
Returning GIs contributed to a local housing boomand completion of Interstate 90 in 1967 opened the way
to greater migration into the Spokane Valley. Yet, boththe city and county continued to exist quietly. All thatchanged, however, in 1974 when the World Expositionwas hosted by the city of Spokane. At the time, Spokanewas unknown to most of the world—and even the coun-try. Lee Iacocca, for example, when asked if Chryslerwould be interested in sponsoring an exhibit, replied,“Where the hell is Spokane?” The Expo, however, proveda great success. During its six month run, the fair drewover 5.6 million visitors—surpassing even the organiz-ers’ attendance projections. The fair boosted the localeconomy and put Spokane on the world map.
Today, Spokane County is the acknowledged capitalof the “Inland Northwest.” As the major metropolitanarea in that region, it serves an important role as theretail trade and services hub for much of the area. Thisrole extends from health care to business and finance,to manufacturing, services and beyond.
Spokane County—namely, the city of Spokane—is alsoa regional center for arts and entertainment. These attrac-tions include a major civic theater as well as several smallerones, a symphony and other musical venues, an opera,and several museums. The county also hosts minor leaguebaseball, soccer, and hockey franchises, as well as golf,cycling, and auto and horse racing.
Spokane County serves as a major source of servicesfor important agricultural activities in the Inland North-west. A recent addition to this range of services is theWashington International Agricultural Trade Center. Spo-kane County has a vibrant manufacturing base in suchareas as food and wood processing, printing and pub-lishing, primary metals, electrical equipment and com-puters, and transportation equipment. The county alsoserves as a resource center for manufacturing sectorsacross the Inland Northwest through its network of fi-nancial and other business services.
Eastern Washington University (Cheney), SpokaneFalls Community College, Spokane Community College,Eastern State Hospital (Medical Lake), and Fairchild AirForce Base combine with other smaller entities to presenta significant government sector.
Last, but not least, Spokane County continues to be asignificant presence in the agricultural industry. Thewestern and southern county are dominated by wheatand cattle, while the north is home to fruit orchards andthe east to grass seed.

Spokane County Profile - 6
The Office of Financial Management has estimatedSpokane County’s 2000 population at 415,000, rankingit the fourth largest of Washington’s 39 counties. With anarea covering 1,764 square miles, Spokane County’spopulation density stands at 235 people per square mile,making it the eighth most densely populated county inthe state.
Population is viewed correctly as a key economic in-dicator of an area’s vitality. With the exception of retir-
The population of Spokane increased from 287,487in 1970 to 415,000 in 2000 (see Figure 1). The annualaverage growth rate during these thirty years was 1.2percent, compared to 1.8 percent average growth forthe state. Throughout the 1970s, Spokane County grewan average of 1.7 percent per year, with growth ratesranging from 0.1 percent to 3.3 percent. The growthrate was equivalent to the statewide average annualgrowth. The similarities between Spokane County andthe state stopped at the end of the decade.
In the 1980s, population growth in the county slowedto an average of .5 percent, while state growth remainedthe same at 1.7 percent. Two national recessions, abooming Puget Sound region, and the Soviet grain em-bargo all contributed to the decline in population growth.
POPULATIONees and a minority of “footloose” workers, people tendto migrate to an area that has economic opportunities.In short, people follow jobs. However, changes in popu-lation are lagging, not leading, indicators. It takes timefor people to arrive in an area where jobs are prevalent,and it takes time for them to leave once the demand forlabor eases. Nevertheless, population changes provideinsight into how the economy is performing and howthe economy has performed over time.
Population Trends
Figure 1Population TrendSpokane County, 1970-2000Source: Office of Financial Management
250,000
270,000
290,000
310,000
330,000
350,000
370,000
390,000
410,000
430,000
1970 1973 1976 1979 1982 1985 1988 1991 1994 1997 2000
The stagnation of the 1980s, however, did not carryover into the 1990s. While the average growth rate from1990 to 1995 (2.2 percent) was comparatively high, theaverage for 1996 to 2000 was much lower at .7 percent.State growth averaged 2.3 percent from 1990 to 1995and 1.3 percent for the remainder of the decade.
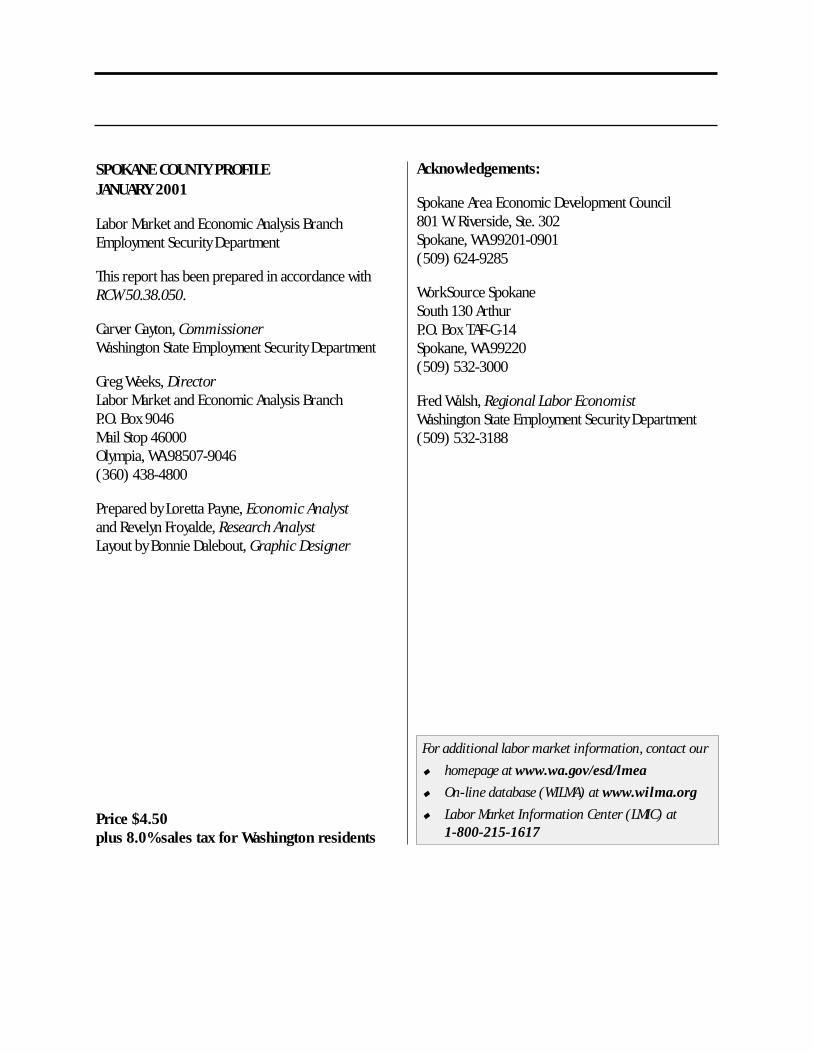
Components of population change such as births,deaths, and migration can provide insight into largerpopulation trends (see Figure 2). From 1990 to 2000the population of Spokane increased by 53,667. Fifty-nine percent of this growth was due to migration. Fig-ure 3 shows the annual rate of migration from 1970 to1999. It can be seen that annual migration was fairlyhigh from 1989 to 1994, 5,000 to 7,000 persons eachyear. Since then it has tapered off until there was an ac-tual out migration of 515 people in 1998.
Figure 2Components of Population ChangeSpokane County, 1990-2000Source: Office of Financial Management
33,672
22,010
31,657
53,66755,682
0
10,000
20,000
30,000
40,000
50,000
60,000
Births Deaths NaturalIncrease
NetMigration
Total Change
Spokane County Profile - 7
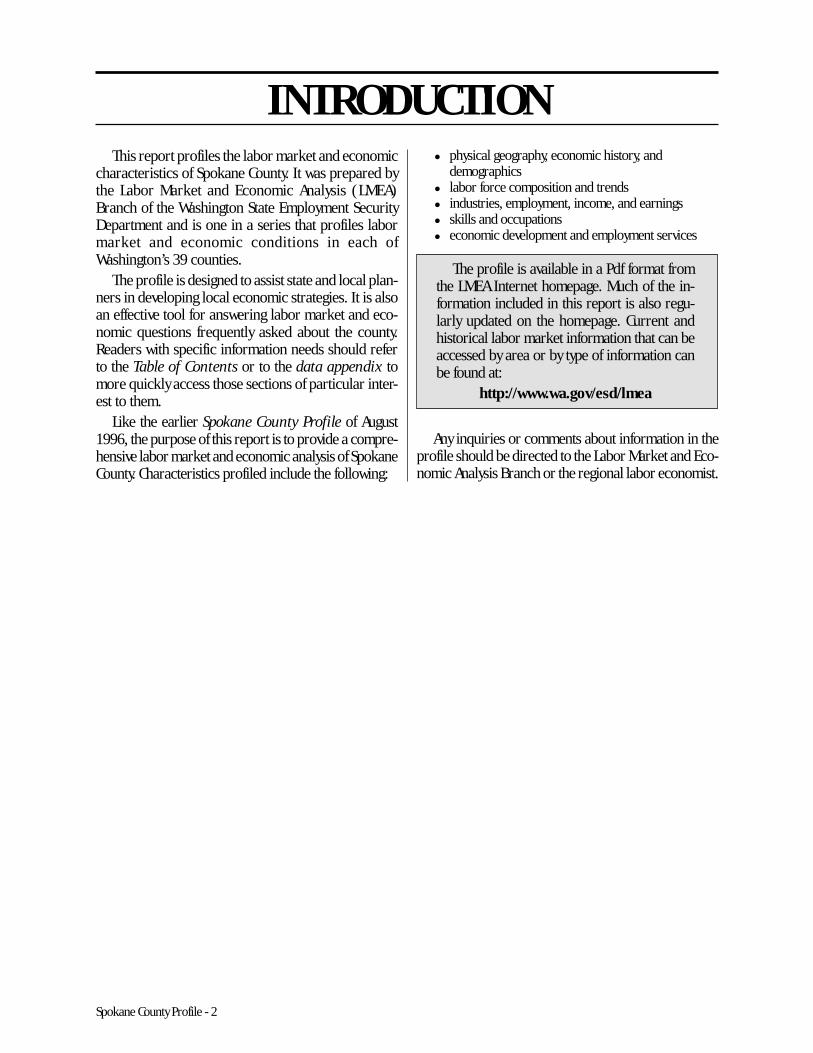
Of Spokane County’s 415,000 residents, 51 percentlived in incorporated, while 49 percent lived in unincor-porated regions in 2000. Since 1990, unincorporatedregions have grown 22 percent, while incorporated ar-eas have grown only 9 percent. In contrast, statewideunincorporated regions increased only 3 percent whileincorporated regions grew 34 percent.
The city of Spokane, not surprisingly, is far and awaythe most populous municipality, comprising 89 percent
Figure 3Migration Growth RatesSpokane County, 1970-1999Source: Office of Financial Management
-4,000
-2,000
0
2,000
4,000
6,000
8,000
10,000
1970 1974 1978 1982 1986 1990 1994 1998
The recent downturn could be due, in part, toFairchild Air Force Base which has had a significantimpact on Spokane County’s population since beingcommissioned in 1950. The number of military per-sonnel at Fairchild AFB declined from 3,933 in 1995to 2,995 in 1999. Moreover, Fairchild AFB’s impact onthe county population is magnified by non-military fam-ily members, civilian employment, and military retir-ees and dischargees.
Towns and Cities
ghC%0991 1991 2991 3991 4991 5991 6991 7991 8991 9991 0002 00-09
enakopS 333,163 969,563 965,473 006,383 000,293 002,104 005,604 009,904 009,014 005,414 000,514 %51.procninU 344,561 634,861 843,471 150,081 450,681 604,191 440,791 880,991 784,991 140,202 313,202 %22
.procnI 098,591 335,791 122,002 945,302 649,502 497,902 654,902 218,012 314,112 954,212 786,212 %9
.stHyawriA 179,1 589,1 090,2 093,2 025,2 019,2 046,3 931,4 064,4 594,4 545,4 %131yenehC 327,7 048,7 088,7 078,7 022,8 042,8 081,8 072,8 594,8 545,8 517,8 %31
kraPreeD 872,2 592,2 573,2 544,2 075,2 057,2 538,2 098,2 029,2 569,2 089,2 %13dleifriaF 615 715 785 095 995 036 836 326 426 506 706 %81
hataL 302 581 102 912 112 522 412 022 212 212 202 %0.kLlacideM 466,3 447,3 087,3 507,3 066,3 056,3 086,3 097,3 038,3 078,3 098,3 %6
doowlliM 955,1 566,1 566,1 086,1 507,1 507,1 096,1 576,1 086,1 566,1 546,1 %6drofkcoR 184 084 584 494 505 525 915 235 725 715 615 %7
elgnapS 922 532 532 542 542 052 052 052 052 552 852 %31enakopS 561,771 964,871 008,081 008,381 006,581 008,881 007,781 003,881 003,881 002,981 002,981 %7ylrevaW 101 811 321 111 111 901 011 321 511 031 921 %82
Figure 4Population of Cities, Towns, and CountySpokane County, 1990-2000Source: Office of Financial Management
of the incorporated population. Spokane is followed byCheney (4 percent), Medical Lake (2 percent), AirwayHeights (2 percent), Deer Park (1 percent), andMillwood (1 percent). The rest of the municipalitiescontribute the remaining 1 percent. Figure 4 shows thespecific data for Spokane County between 1990 and2000. The table also shows the level of growth for theten year period. The greatest growth is seen for AirwayHeights at 131 percent. The city of Spokane has shown arelatively low growth of 7 percent.
Spokane County Profile - 8
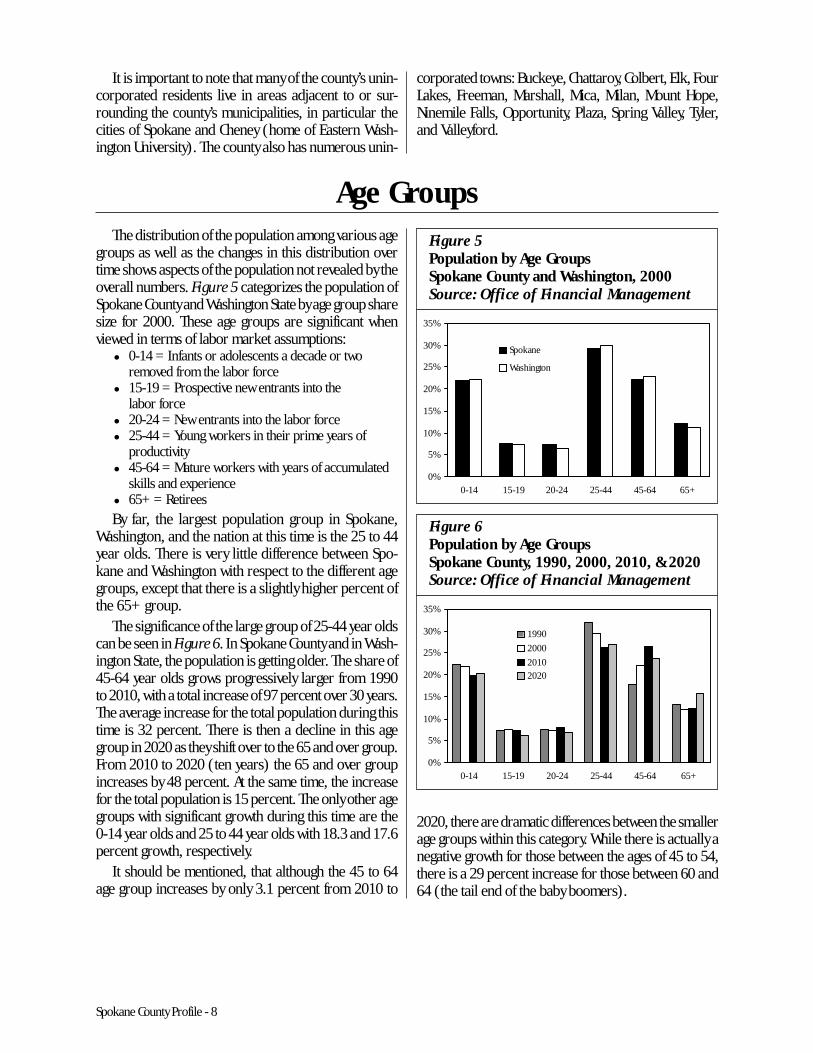
The distribution of the population among various agegroups as well as the changes in this distribution overtime shows aspects of the population not revealed by theoverall numbers. Figure 5 categorizes the population ofSpokane County and Washington State by age group sharesize for 2000. These age groups are significant whenviewed in terms of labor market assumptions:
� 0-14 = Infants or adolescents a decade or tworemoved from the labor force
� 15-19 = Prospective new entrants into thelabor force
� 20-24 = New entrants into the labor force� 25-44 = Young workers in their prime years of
productivity� 45-64 = Mature workers with years of accumulated
skills and experience� 65+ = Retirees
By far, the largest population group in Spokane,Washington, and the nation at this time is the 25 to 44year olds. There is very little difference between Spo-kane and Washington with respect to the different agegroups, except that there is a slightly higher percent ofthe 65+ group.
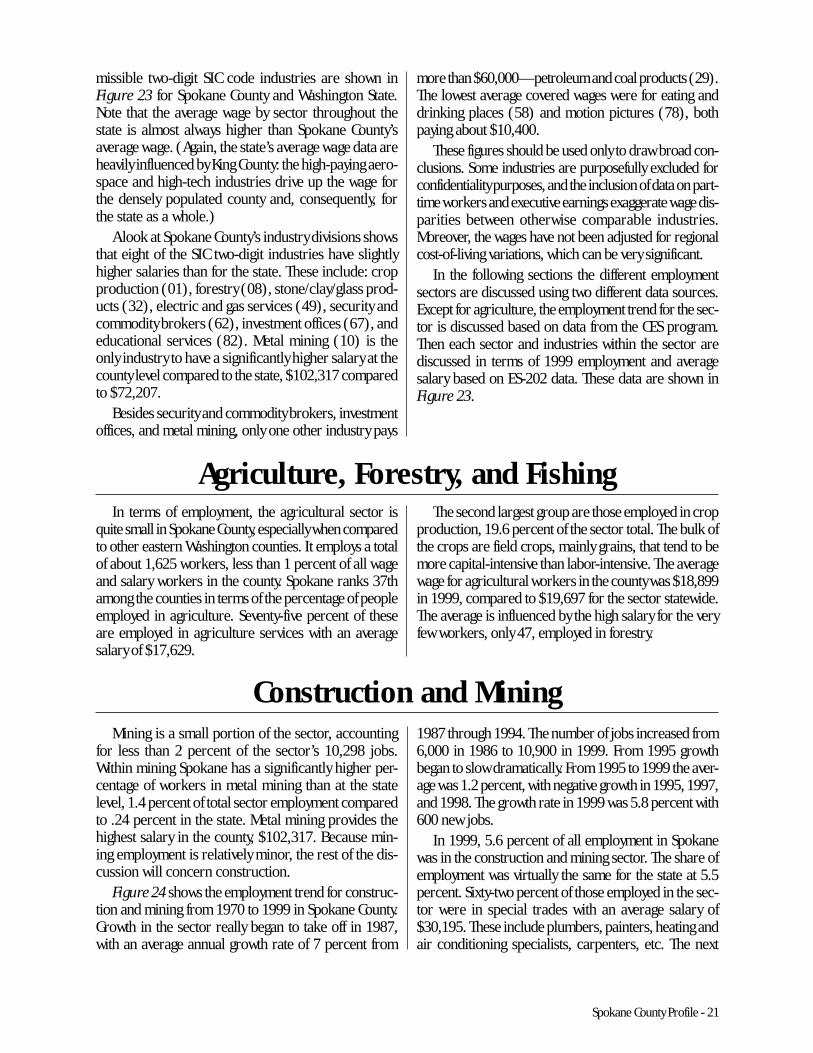
The significance of the large group of 25-44 year oldscan be seen in Figure 6. In Spokane County and in Wash-ington State, the population is getting older. The share of45-64 year olds grows progressively larger from 1990to 2010, with a total increase of 97 percent over 30 years.The average increase for the total population during thistime is 32 percent. There is then a decline in this agegroup in 2020 as they shift over to the 65 and over group.From 2010 to 2020 (ten years) the 65 and over groupincreases by 48 percent. At the same time, the increasefor the total population is 15 percent. The only other agegroups with significant growth during this time are the0-14 year olds and 25 to 44 year olds with 18.3 and 17.6percent growth, respectively.
It should be mentioned, that although the 45 to 64age group increases by only 3.1 percent from 2010 to
It is important to note that many of the county’s unin-corporated residents live in areas adjacent to or sur-rounding the county’s municipalities, in particular thecities of Spokane and Cheney (home of Eastern Wash-ington University). The county also has numerous unin-
corporated towns: Buckeye, Chattaroy, Colbert, Elk, FourLakes, Freeman, Marshall, Mica, Milan, Mount Hope,Ninemile Falls, Opportunity, Plaza, Spring Valley, Tyler,and Valleyford.
Age GroupsFigure 5Population by Age GroupsSpokane County and Washington, 2000Source: Office of Financial Management
0%
5%
10%
15%
20%
25%
30%
35%
0-14 15-19 20-24 25-44 45-64 65+
Spokane
Washington
Figure 6Population by Age GroupsSpokane County, 1990, 2000, 2010, & 2020Source: Office of Financial Management
0%
5%
10%
15%
20%
25%
30%
35%
0-14 15-19 20-24 25-44 45-64 65+
1990
2000
20102020
2020, there are dramatic differences between the smallerage groups within this category. While there is actually anegative growth for those between the ages of 45 to 54,there is a 29 percent increase for those between 60 and64 (the tail end of the baby boomers).

Spokane County Profile - 9
In accordance with the federal Office of Managementand Budget, the state Office of Financial Managementtracks five broad race and ethnic groups: White, Black,American Indian/Eskimo or Aleut (AIEA), Asian or Pa-cific Islander (API), and Hispanic origin. (People of His-panic origin can be of any race and are tallied separately.)Figure 7 shows the percentage of the population for eachof these groups for Spokane County and Washington State,in 1990 (Census) and 1998 (estimate).
Interestingly, the gender makeup of Spokane Countychanges from 1990 to 1998. The percentage of femalesdeclines from 51.4 percent to 50.9. There is a similardecline for the state as a whole.
Racial characteristics have also shifted slightly overthe years. The percentage of whites in the Spokane popu-lation decreased from 93.5 to 92.1 percent. This shiftwas even more pronounced for the state, from 90.6 per-cent to 88.7 percent. In 1998, the next largest ethnicgroups after whites were Asian/Pacific Islanders (2.5percent), Hispanic (2.3 percent), AIEAs (1.6 percent),and Blacks (1.4 percent). In contrast, for the state theorder of minority ethnic groups was Hispanic (6.2 per-cent), API (5.9 percent), Blacks (3.5 percent) and AIEAs(1.9 percent). The only similar percentage is for AIEAs.
Despite the differences, growth rates for the differentgroups have been similar for the county and the state,
except for Blacks and Hispanics. Blacks had a 19.7 per-cent growth in the county, compared to 30.2 percent forthe state. There was an even greater difference for His-panics, 37.3 percent for the county verses 66.1 percentfor the state. Figure 8 shows the change from 1990 to1998 in the share of population for the different minor-ity groups in Spokane County. The greatest change is seenfor APIs which increase from 1.8 percent to 2.5 percentof the population.
Figure 8Population by Race and Hispanic OriginSpokane County, 1990 and 1998Source: Office of Financial Management
Demographics
8991-0991enakopS susneC0991 setamitsE8991 egnahC%
latoT 333,163 %0.001 009,014 %0.001 %7.31etihW 587,733 %5.39 725,873 %1.29 %1.21kcalB 679,4 %4.1 659,5 %4.1 %7.91
tuelA/naidnI 812,5 %4.1 427,6 %6.1 %9.82rednalsIcificaP/naisA 163,6 %8.1 390,01 %5.2 %7.85
cinapsiH 399,6 %9.1 106,9 %3.2 %3.73elameF 816,581 %4.15 332,902 %9.05 %7.21
notgnihsaWlatoT 296,668,4 %0.001 004,757,5 %0.001 %3.81etihW 704,114,4 %6.09 175,701,5 %7.88 %8.51kcalB 275,251 %1.3 076,891 %5.3 %2.03
tuelA/naidnI 952,78 %8.1 905,901 %9.1 %5.52rednalsIcificaP/naisA 454,512 %4.4 056,143 %9.5 %6.85
*cinapsiH 075,412 %4.4 464,653 %2.6 %1.66elameF 259,254,2 %4.05 419,458,2 %6.94 %4.61
ecarynafoebyamscinapsiH*
Figure 7Population by Race and Hispanic OriginSpokane County and Washington, 1990 and 1998Source: Office of Financial Management
1.4%
1.8%1.9%
1.4%1.6%
2.5%2.3%
1.4%
0.0%
0.5%
1.0%
1.5%
2.0%
2.5%
3.0%
Black Indian/Aleut Asian/PacificIslander
Hispanic
1990
1998

Spokane County Profile - 10
The resident civilian labor force is defined as allpersons 16 years of age and older within a specifiedgeographic area who are either working or activelyseeking work. This excludes those serving in the armedforces. Like the general population, the labor force canbe seen as a key economic indicator. Patterns of growthand decline in the county’s labor force are largely drivenby economic cycles as well as activity in the local con-struction, government and/or other predominant sec-tors in the county economy. Since gross domesticproduct and gross state product are not gathered atthe county level, labor force changes, as well as othermeasures, serve as proxies.
CIVILIAN LABOR FORCE
Figure 9Civilian Labor ForceSpokane County, 1970-1999Source: Employment Security Department
100,000
120,000
140,000
160,000
180,000
200,000
220,000
1970 1974 1978 1982 1986 1990 1994 1998
The civilian labor force in Spokane County grew from112,500 in 1970 to 210,300 in 1999 (Figure 9). Theaverage annual growth rates are shown in Figure 10for 1970 to 1999. The average annual growth duringthis time period was 2.2 percent for Spokane County,compared to an average growth rate of 2.7 percent forthe state.
The average CLF growth rate declined dramaticallyfrom 3.5 percent in the 70s to 1.1 percent in the 80s.The 1980s began with two national recessions. The av-erage then increased to 2.2 percent for the decade ofthe 90s. Most recently the CLF growth rate has declinedsteadily from 3.8 percent in 1995 to .8 percent in 1999.There was a similar decline for the state from 3.4 per-cent in 1995 to 1.2 percent in 1999.
Figure 11 shows the 1997 estimates, based on the1990 Census, of the percentage share of the labor forceheld by each of the predominant ethnic and racial groupsfor both Spokane County and Washington State. In 1997,93.7 percent of the labor force in Spokane County waswhite. Whites are then followed by APIs (2.2 percent),Hispanics (1.7 percent), AIES (1.4 percent) and Blacks(1.0 percent). All of these groups hold a higher per-centage of the labor force for the state as a whole, ex-cept for AIEAs which is the same for both the county andthe state (1.4 percent). This is to be expected as these
Demographics
-6.0%
-4.0%
-2.0%
0.0%
2.0%
4.0%
6.0%
8.0%
1970 1974 1978 1982 1986 1990 1994 1998
Figure 10Civilian Labor Force Annual Growth RatesSpokane County, 1970-1999Source: Employment Security Department
groups also represent a larger portion of the populationfor the state.
Ethnically, Spokane County’s labor force compositionis comparable to its population makeup (see Figure 12).Although Whites make up a greater share of the CLF thanthe population, the difference is not large, 93.7 percentof the CLF and 92 percent of the population. Although allof the smaller ethnic groups discussed earlier make upa smaller percentage of the labor force than they do thepopulation, the differences are not large. The largest dis-

Spokane County Profile - 11
crepancy is for Hispanics which make up 2.3 percent ofthe population but only 1.7 percent of the labor force.
As mentioned earlier, the population of SpokaneCounty is relatively evenly split between males and fe-
males. The labor force however, is not. According to the1997 estimate, 53 percent of the work force is male while47 percent is female. This is also the case statewide wheremales also have a majority of 54.3 percent.
1.0%1.4%
2.2%1.7%
2.8%
1.4%
5.4% 5.5%
0.0%
1.0%
2.0%
3.0%
4.0%
5.0%
6.0%
Black AIEA API Hispanic
Spokane
Washington
Figure 11Civilian Labor Force by Race and EthnicitySpokane County and Washington, 1997Source: Employment Security Department
Figure 12Share of Population (1998) and CivilianLabor Force (1997) by Race and EthnicitySource: Employment Security Department
1.4%1.6%
2.5%2.3%
1.0%
1.4%
2.2%
1.7%
0.0%
0.5%
1.0%
1.5%
2.0%
2.5%
3.0%
Black AIEA API Hispanic
Population
Labor Force

Spokane County Profile - 12
Figure 13 shows the unemployment rates for Spo-kane County, Washington, and the U.S. since 1970. Un-employment in the county tracks remarkably well withunemployment in Washington and throughout the na-tion, rising during periods of national economic con-traction and falling during economic expansions. Forall three regions the unemployment rate has been on afairly steady decline since 1982, when it peaked at 12.3percent in Spokane County.
From 1970 to 1999, the unemployment rate for thecounty has only rarely been higher than the state aver-age, but the difference has declined even further sincethe 1970s. The average unemployment rate for Spokanein the 70s was 7.5 percent, compared to 8.4 percent forthe state. In the recessionary decade of the 80s the Spo-kane unemployment rate increased to an average of 8.5percent, slightly higher than the state average of 8.4 per-cent. Both the county and the state experienced doubledigit unemployment rates from 1981 to 1983. Spokaneregained its edge in the 1990s; the decade average forthe county was 5.5 percent, and 6 percent for the state.
The Spokane unemployment rate reached a 30 yearlow of 4.6 percent in 1997, but then increased to 4.8percent in 1998 and 5.2 percent in 1999. In compari-son, the state unemployment rate decreased steadily from6.5 percent in 1996 to 4.7 percent in 1999. Spokane’sunemployment rate ranked 14th among all 39 Washing-ton counties. It is difficult to determine the cause of theincreasing unemployment rate. Although there was adecline in the growth rate of all nonagriculture jobs therewas a corresponding decline in the CLF growth rate. From1997 to 1999 there were 5,200 new jobs and 5,000 newpersons in the labor force. The increase in the unem-ployment rate is due, in part, to a loss of 700 jobs inmanufacturing from 1997 to 1999.
The unemployment rates disaggregated by race,ethnicity, and sex for Spokane County and the state areshown in Figure 14. The overall unemployment rate was4.6 percent. Although Blacks have the highest unemploy-ment rate (9.5 percent), this accounts for only 200 per-sons, 2.1 percent of the unemployed.
UNEMPLOYMENTThe civilian labor force consists of both those who
are working and those without a job who are looking forwork. The unemployment rate is the percentage of thetotal labor force who are not working but who are ac-tively looking for work. At the national level, the unem-ployment rate is determined by a monthly survey of
households. At the local level, the state’s portion of thishousehold survey is integrated with other information(e.g., unemployment insurance claims and surveys ofbusiness establishments) to produce unemployment ratesat the state and county level.
Trend
4%
5%
6%
7%
8%
9%
10%
11%
12%
13%
1970 1974 1978 1982 1986 1990 1994 1998
SpokaneWashingtonU.S.
Figure 13Unemployment RatesSpokane, Washington, & U.S., 1970-1999Source: Employment Security Department
Figure 14Unemployment by Race, Ethnicity, & GenderSpokane County, 1997Source: Employment Security Department
4.6% 4.4%
7.1%
8.7%
5.6%
4.7%
9.5%
0%
1%
2%
3%
4%
5%
6%
7%
8%
9%
10%
Total White Black AIEA API Hispanic Female

Spokane County Profile - 13
One of the key factors, and perhaps most reliablemethods, in determining unemployment is the numberof claims filed with the Employment Security Departmentfor unemployment insurance (UI) benefits. Figure 15shows the number of UI claims filed in Spokane Countyand Washington State during FY1999-2000 by occupa-tional groupings. Occupational groupings differ fromindustry designations in that the former deal with thetype of work performed regardless of industry and thelatter deal with work performed within a given industry.
Spokane County had 26,474 UI claimants between July1, 1999 and June 30, 2000.
Unemployment Insurance Claims
enakopS notgnihsaWstnamialC egatnecreP stnamialC egatnecreP
krowlarutcurtS 103,5 %0.02 140,86 %2.91laireganamdnalacinhcet,lanoisseforP 089,4 %8.81 757,96 %7.91
lacirelC 401,3 %7.11 168,93 %3.11ecivreS 310,3 %4.11 265,53 %0.01
sedarTenihcaM 455,2 %6.9 346,12 %1.6selaS 378,1 %1.7 927,71 %0.5
noitatropsnartdnathgierfrotoM 733,1 %1.5 399,61 %8.4gnissecorP 223,1 %0.5 838,71 %0.5
gnildnahslairetamdnagnigakcaP 301,1 %2.4 748,62 %6.7krowhcneB 889 %7.3 515,01 %0.3
gnihsifdna,yrtserof,erutlucirgA 417 %7.2 658,62 %6.7CEN,suoenallecsiM 581 %7.0 444,2 %7.0
latoT 474,62 %0.001 680,453 %0.001
ralloC-etihW 079,21 %0.94 909,261 %0.64ralloC-eulB 405,31 %0.15 771,191 %0.45
dedulcxesnoitapuccoCEN/suoenallecsiM
The concentration of UI claims in Spokane Countyoccupational groupings closely resemble the concentra-tions statewide. The majority of claims fell in four prin-cipal areas: structural work, professional/technical/managerial, service, and clerical. The only occupationswhich had a greater percentage of claims statewide thanfor the county were professional/managerial, packag-ing, and agriculture. The greatest difference between thecounty and the state was for the number of UI claims foragriculture, 2.7 percent for the county and 7.6 percentfor the state.
Figure 15Unemployment Insurance ClaimantsSpokane County and Washington State, July 1, 1999 - June 30, 2000Source: Employment Security Department

Spokane County Profile - 14
The characteristics of an area’s industrial base hintat the unemployment patterns that the area might face.Therefore, calculations were made to establish theshare of seasonality, cyclicality, and structural maturityin the area’s employment base. These terms are de-fined as follows.
Industries with seasonal employment patterns arecharacterized by large employment increases and de-creases in particular months of the year, for example,construction and retail sales. These variations occurduring the same months each year and are caused byfactors that repeat each year, for example: poor weatherconditions, holiday seasons, and weather-related activi-ties such as harvesting. A seasonal industry is one in whichthe maximum variation between the highest and lowestmonthly employment is about 19 percent or more of theindustry’s annual average employment.
Cyclicality refers to business and unemploymentpatterns caused by or linked to the broader movementsof the economy—expansions and contractions. Unem-ployment in such industries is attributable to a generaldecline in macroeconomic activity, especially expen-ditures, which occurs during a business-cycle down-turn. When the economy dips into a contraction, orrecession, aggregate demand declines, so less outputis produced and sold, and thus fewer workers and otherresources are employed. Hence business activity of thecyclical variety decreases and unemployment increases.Industries that are especially sensitive to these eco-nomic swings are classified as cyclical industries, forexample, ship building, aerospace, and automobilemanufacturing. A cyclical industry is one in which thetotal employment variation over a seven-year period isvery high when compared to a straight-line trend pro-jection for the same period.
Structurally mature industries are characterized bylong-term declines in total annual average employment.These declines may be the result of increased productiv-ity, automation, technological change, exhaustion of natu-ral resources, or other factors. Decreasing sales are dueto either displacement by less-expensive competitors, ordecreasing overall demand for the good. Affected indus-tries must either shut down, or restructure.
Areas with a high degree of structurally mature in-dustries experience specific unemployment issues. First,structurally mature industries shed a significant numberof workers causing unemployment to increase. Second,
unemployment can persist because of a mismatch be-tween the skills possessed by the available work forceand the skills called for in existing and newly createdjobs. The impact of structurally mature industries on localeconomies, therefore, can be devastating in the shortrun. The structurally mature designation is determinedby comparing two consecutive years of annual averageemployment against the two consecutive years that oc-curred seven years earlier.
Only private industries were included when produc-ing the figures below, so the large impact of governmentemployment is excluded.
The number of workers employed in these type in-dustries in Spokane County has been tabulated (see Fig-ure 16). In 1998, seasonal industries accounted for26,560 workers, or 17.5 percent of all non-governmentemployment; another 21,773 workers, 14.4 percent ofthe total, were employed in structurally mature indus-tries, and only 20,997 workers, 13.8 percent, were incyclical industries. As the chart shows, this differs mod-erately from the statewide typology which was 20.4 per-cent seasonal, 16.5 percent structurally mature, and 14percent cyclical. Note: The percentages will not neces-sarily total 100 percent. An industry can be recog-nized in more than one typology. Construction, forexample, is very dependent upon weather and is alsohighly sensitive to fluctuations in overall economicactivity, i.e., the business cycle. It has been catego-rized as both seasonal and cyclical.
The greatest difference between the state and thecounty is for seasonal employment, 17.5 percent for the
Industrial Typology
14.4% 13.8%
17.5%16.5%
14.0%
20.4%
0%
5%
10%
15%
20%
25%
Structural Cyclical Seasonal
Spokane
Washington
Figure 16Industrial TypologySpokane County and Washington, 1998Source: Employment Security Department

Spokane County Profile - 15
county and 20.4 percent for the state. Although Spokanemight be considered to be in a “rural” or “agricultural”area, it is in reality an urban center. The higher percent-age of seasonal jobs for the state reflects the inclusion ofthe more agriculturally based rural counties.
Because all these types of industries tend toward vola-tility and higher levels of unemployment, and becauseSpokane County has lesser concentrations of workers inthese type industries than the state as a whole, it followsthat Spokane County’s unemployment would be less thanthe statewide average.

Spokane County Profile - 16
Since the “double-dip” recessions of the early 1980s,which brought down the county’s employment to 122,600in 1982, nonfarm employment in Spokane County hasincreased every year (Figure 17). Job growth has sinceaveraged 2.6 percent annually with no negative growthduring this time and hit an all-time high of 189,900 in1999. The latest national recession, occurring early inthis decade, had minimal effect upon Spokane County.
The county’s economic strength during the late 1980swas fueled by strong national economic growth and anincrease in population driven by strong in-migration.Some of the migrants brought employment with them. Anumber of relatively small, light manufacturing entitiesrelocated in Spokane during that period. Spokane de-veloped a reputation as an attractive place with less con-gestion, pollution, crime, etc., than found in many larger
urban cities. Attractive land and housing prices were alsoa major incentive that lured people and companies tothe area. Aggressive economic development efforts byMomentum, a group of local business leaders, also con-tributed significantly to the boom. Growth in Spokanedeveloped a life of its own which continued even as thenational economy faltered in the 1990-91 recession.
Since reaching a peak of 4.2 percent in 1994, the jobgrowth rate has steadily declined to .9 percent in 1999(Figure 18). From 1995 to 1997 the only sector to shownegative growth was transportation and public utilities(-2.4 percent annual average). This sector then improvedwith an average positive growth of 1.9 percent from 1997to 1999. From 1997 to 1999, only manufacturing showednegative growth (-1.6 percent annual average).
INDUSTRIES, EMPLOYMENT,AND WAGES
Data in this section are derived through two differentBureau of Labor Statistics programs, which are con-ducted in Washington by the Employment Security De-partment. Current Employment Statistics (CES) generatesmonthly nonagricultural employment figures. The Quar-
terly Employment and Wages program (ES-202) includesdata on both agricultural and nonagricultural employ-ment covered under the state unemployment insuranceprogram. Approximately 90 percent of all workers inthe state are covered by unemployment insurance.
Employment Trend
Figure 17Nonagricultural Wage & Salary EmploymentSpokane County, 1970-1999Source: Employment Security Department
50,000
70,000
90,000
110,000
130,000
150,000
170,000
190,000
210,000
1970 1974 1978 1982 1986 1990 1994 1998-4%
-2%
0%
2%
4%
6%
8%
10%
1970 1974 1978 1982 1986 1990 1994 1998
Spokane
Washington
Figure 18Nonagricultural Wage & Salary GrowthSpokane County and Washington, 1970-1999Source: Employment Security Department

Spokane County Profile - 17
One way of determining the industrial makeup of anarea, and thereby its relative economic strength or weak-ness, is to compare it to another area. This comparisoncan be done using various measures of economic activ-ity, such as employment, income, or retail sales. In thefollowing analysis, location quotients are calculated us-ing employment figures.
The following section shows fairly specifically, by in-dustry sector, how Spokane County’s employment pat-terns both differ from and coincide with WashingtonState’s. When comparing an industry’s share of totalemployment at the county level to the same industry’sshare at the statewide level, it becomes apparent thatsome county employment is distributed differently thanstatewide employment. The location quotient comparesthe share of total employment in a particular industrydivision in the county with the share it represents inWashington State.
The quotient is determined by dividing the localindustry’s share of local total employment by the sameindustry’s share of total employment at the state level. Avalue higher than 1.0 denotes a local industry with ahigher percentage of employment than exists in the sameindustry at the state level. A value below 1.0 denotes theopposite. A quotient of 1.0 denotes an industry in whichthe county is comparable to the state as a whole.
A quotient above 1.0 suggests that the good or ser-vice produced by an industry is exported from the area;a quotient below 1.0 is a sign that, hypothetically, goodsor services must be imported into an area to provide thesame consumption patterns found at the state level. Thegreater the value above or below 1.0, the stronger thesuggestion of exporting or importing becomes.
Figure 19 shows the location quotients of the majorindustry sectors in Spokane County. Except for agricul-ture (.27), all sectors are fairly close to the statewidenorm (quotient of 1.0), indicating that importing/export-ing consumption patterns in the county are very similarto the statewide patterns. Like the industrial typology dis-cussed earlier, this is another signal that the county’seconomy tends to work very much like the state’s. A quo-tient of 1.21 shows that the wholesale trade sector issomewhat more predominant in the county, comparedto the state.
Four of the nine sectors are importing sectors, butonly to a small degree (except for agriculture). The posi-tive quotients for construction, trade, services, and FIREreflect the urban nature of Spokane County which pro-vides services to the surrounding rural counties.
Figure 19Location QuotientsSpokane County, 1999Source: Employment Security Department
Location Quotients
1.21
1.14
1.11
1.06
1.01
0.95
0.87
0.80
0.27
0.00 0.20 0.40 0.60 0.80 1.00 1.20 1.40
Wh.Trade
FIRE
Services
R.Trade
Const.
Gov’t
Mfg.
TPU
Agric.
There are three broad sectors in an economy: pri-mary, secondary, and tertiary. The primary sector is com-prised of agriculture and mining. The secondary sectoris the goods-producing sector, comprised of manufac-turing and construction. Finally, the service-sector is ev-erything else—although government is often excluded.(The easiest way to remember the difference between a‘good’ and a ‘service’ is that dropping a ‘service’ on one’sfoot doesn’t hurt.) Over the past several decades, mostjob growth in the U.S. has been in the service sector.
Goods and ServicesFigure 20 shows the total number of jobs in each
sector from 1970 to 1999 in Spokane County. Jobs inthe goods producing sector increased 186 percent from17,600 to 32,700; service jobs increased 217 percent,from 72,600 to 157,300. The latter calculation includesgovernment jobs in the service sector. In contrast, thegoods and service sectors statewide grew by 177 per-cent and 270 percent, respectively.

Spokane County Profile - 18
Figure 21 shows the percentage of jobs which fall withinthe goods and service sectors of the economy for both thecounty and the state. Although the percentage of jobs inthe goods sector (mining, construction, and manufac-
Annual average covered wages are derived by divid-ing the total wages paid in an area by the annual averageemployment in that area. Jobs not covered by the unem-ployment insurance program are excluded; however, ap-proximately 90 percent of all employment in the state iscovered under the program. (Note: all amounts herehave been inflation adjusted to 1998 dollars.) Theaverage wage does not include any benefits (e.g., insur-ance or retirement plans) other than actual wages.
Figure 22 show the real annual covered wage from1970 to 1999 for Spokane County and Washington State.For Spokane the annual wage peaked in 1978 at $27,632.It then declined steadily until it bottomed out at $23,909in 1990. Since then the annual wage has increased eachyear until reaching $27,556 in 1999, compared to thestate wage of $35,724. Although the Spokane averagecovered wage follows the state trend, with peaks andvalleys occurring in the same years, there is always agap between the two. The state wage has been consis-tently higher than the county wage, but the gap has in-creased over the years from $1,651 in 1970 to $5,269in 1998.
It should be remembered that King County, with itshuge population and highly paid high-tech and aerospaceindustries, is the strongest driver of the statewide aver-age. In fact, King County was the only county to have an
Figure 20Total Number of Jobs in Goods and ServicesSpokane County, 1970-1999Source: Employment Security Department
Figure 21Percentage of Jobs in Goods SectorSpokane County and Washington, 1970-1999Source: Employment Security Department
15,000
35,000
55,000
75,000
95,000
115,000
135,000
155,000
175,000
1970 1974 1978 1982 1986 1990 1994 1998
Goods
Services
15%
17%
19%
21%
23%
25%
27%
29%
1970 1974 1978 1982 1986 1990 1994 1998
Spokane
Washington
turing) statewide decreased from 27 percent in 1970 to20 percent in 1999, the decline in the county was muchless dramatic—from 20 percent to 17 percent.
Annual Average Covered WageFigure 22Real Average Covered WageSpokane County and Washington, 1970-1999Source: Employment Security Department
$20,000
$22,000
$24,000
$26,000
$28,000
$30,000
$32,000
$34,000
$36,000
$38,000
1970 1974 1978 1982 1986 1990 1994 1998
Spokane
Washington
annual covered wage higher than the state average of$35,724. Spokane ranked eighth of all 39 counties.
Although the annual wage has improved since 1990,the fact that in 1998 it was less than it was 20 years ear-lier is a matter of concern that has been a subject ofconsiderable discussion. It is a national trend as well asone occurring in Washington and in Spokane County.Some of the explanations proffered are listed below;undoubtedly, each is a contributing factor.

Spokane County Profile - 19
� Pay declines within industries caused byinternational competition, restructuring, thedecreased power of unions to set wages, andother factors.
� An overall decline in high paying goods-producingjobs accompanied by a large increase in lower
paying trade and services jobs.� The substitution of employee benefits for direct
pay increases.� Increase in part-time workers.
The annual average 1999 covered wage, and thenumber employed, for major industry divisions and per-
enakopS notgnihsaWtnemyolpmE egaWgvA tnemyolpmE egaWgvA
CIS latoT 017,381 859,446,2latoT-etavirP 049,351 196,03$ 186,491,2 849,63$
gnihsiFdna,yrtseroF,erutlucirgA 526,1 998,81$ 511,78 796,91$10 sporC-noitcudorPlarutlucirgA 303 694,41$ 011,45 746,31$20 kcotseviL-noitcudorPlarutucirgA 501 229,21$ 837,5 331,02$70 secivreSlarutlucirgA 071,1 926,71$ 098,42 669,81$80 yrtseroF 74 745,03$ 773,2 240,62$
gniniMdnanoitcurtsnoC 892,01 037,54$ 403,641 223,24$01 gniniMlateM 341 713,201$ 353 702,27$31 noitcartxEsaGdnaliO * * 83 164,23$41 sleuFtpecxe,slareniMcilatemnoN 22 102,92$ 013,2 804,63$51 srotcartnoCgnidliuBlareneG 237,2 517,03$ 341,93 383,43$61 gnidliuBtpecxe,noitcurtsnoCyvaeH 810,1 322,63$ 889,81 902,44$71 srotcartnoCedarTlaicepS 083,6 591,03$ 274,58 662,43$
gnirutcafunaM 595,12 976,23$ 921,953 158,04$02 stcudorPderdniKdnadooF 906,1 351,82$ 195,04 451,13$22 stcudorPlliMelitxeT * * 800,1 768,43$32 stcudorPelitxeTrehtOdnalerappA 183 207,61$ 070,7 154,12$42 stcudorPdooWdnarebmuL 512,1 209,02$ 741,33 077,73$52 serutxiFdnaerutinruF 322 246,12$ 116,4 778,72$62 stcudorPdeillAdnarepaP 333 906,14$ 967,51 891,15$72 gnihsilbuPdnagnitnirP 927,1 450,82$ 275,32 464,33$82 stcudorPdeillAdnaslacimehC 645 182,44$ 401,6 398,07$92 stcudorPlaoCdnamuelorteP * * 421,2 233,66$03 stcudorPcitsalPsuoenallecsiMdnarebbuR 235 994,42$ 510,01 242,13$13 stcudorPrehtaeLdnarehtaeL * * 173 317,12$23 stcudorPssalGdna,yalC,enotS 772,1 472,83$ 336,8 215,53$33 seirtsudnIlateMyramirP 774,3 955,24$ 685,11 760,44$43 stcudorPlateMdetacirbaF 493,1 247,82$ 581,41 178,23$53 .piuqEretupmoCdnayrenihcaMlairtsudnI 837,2 231,83$ 314,42 655,64$63 retupmoCtpecxe,tnempiuqEcinortcelE 335,2 249,43$ 132,81 020,14$73 tnempiuqEnoitatropsnarT 485,1 383,04$ 616,411 995,55$83 stcudorPdetaleRdnastnemurtsnI 144,1 407,35$ 735,41 668,45$93 seirtsudnIgnirutcafunaMsuoenallecsiM 044 842,22$ 645,8 627,73$
seitilitUcilbuPdnanoitnatropsnarT 850,4 351,42$ 557,37 314,04$14 tisnarTregnessaPnabruretnIdnalacoL 142 187,41$ 086,6 707,91$24 gnisuoheraWdnagnikcurT 404,2 005,92$ 276,13 108,03$44 noitatropsnarTretaW * * 588,8 554,55$54 riAyBnoitatropsnarT 314,1 771,82$ 604,62 384,83$64 saGlarutaNtpecxe,senilepiP * * 211 126,75$
Figure 23Annual Covered Wages and EmploymentSpokane County and Washington State, 1999Source: Employment Security Department

Spokane County Profile - 20
enakopS notgnihsaWCIS tnemyolpmE egaWgvA tnemyolpmE egaWgvA
74 secivreSnoitatropsnarT 763 763,42$ 329,11 258,33$84 noitacinummoC 777,1 680,24$ 496,13 550,95$94 secivreSyratinaSdnasaG,cirtcelE 232,1 664,55$ 616,51 614,35$
edarTelaselohW 265,21 251,43$ 331,941 580,04$05 sdooGelbaruD-edarTelaselohW 142,8 535,63$ 277,48 722,44$15 sdooGelbarudnoN-edarTelaselohW 123,4 967,13$ 163,46 349,53$
edarTliateR 129,43 967,81$ 854,274 285,22$25 seilppuSnedraGdnaslairetaMgnidliuB 115,1 276,12$ 168,12 730,52$35 serotSesidnahcreMlareneG 571,4 934,61$ 782,94 120,12$45 serotSdooF 053,5 264,91$ 233,96 603,02$55 snoitatSecivreSdnasrelaeDevitomotuA 669,3 810,92$ 050,84 615,03$65 serotSyrosseccAdnalerappA 962,1 196,31$ 504,52 330,12$75 serotSsgnihsinrufemoHdnaerutinruF 938,1 101,22$ 625,12 094,72$85 secalPgniknirDdnagnitaE 916,21 524,01$ 940,671 652,21$95 liateRsuoenallecsiM 291,4 933,71$ 849,06 399,22$
etatsElaeR&,ecnarusnI,ecnaniF 136,01 193,15$ 221,431 199,25$06 snoitutitsnIyrotisopeD 783,3 233,23$ 481,83 855,73$16 snoitutitsnIyrotisopednoN 523,1 755,54$ 835,11 634,94$26 srekorBytidommoCdnaytiruceS 607 073,69$ 189,7 812,69$36 sreirraCecnarusnI 379,1 244,53$ 968,62 146,44$46 ecivreSdna,srekorB,stnegAecnarusnI 570,1 020,53$ 823,31 936,04$56 etatsElaeR 189,1 493,71$ 336,33 873,62$76 seciffOtnemtsevnIrehtOdnagnidloH 481 916,79$ 985,2 560,67$
secivreS 368,45 458,02$ 557,017 587,92$07 secalPgnigdoLrehtOdnasletoH 422,3 425,51$ 212,82 736,61$27 secivreSlanosreP 278,1 239,41$ 054,22 993,71$37 secivreSssenisuB 975,8 492,22$ 464,561 797,88$57 gnikraPdna,secivreS,riapeRotuA 389,1 912,22$ 009,52 928,42$67 secivreSriapeRsuoenallecsiM 995 466,32$ 575,7 278,92$87 serutciPnoitoM 504 364,01$ 829,9 164,31$97 secivreSnoitaerceRdnatnemesumA 863,2 463,21$ 862,04 746,91$08 secivreShtlaeH 915,02 667,82$ 728,581 616,13$18 secivreSlageL 104,1 310,23$ 825,71 948,44$28 secivreSlanoitacudE 830,2 747,72$ 027,22 231,72$38 secivreSlaicoS 058,4 105,61$ 041,95 080,71$48 snedraGlacigolooZ,lacinatoB,smuesuM * * 235,1 174,12$68 snoitazinagrOpihsrebmeM 455,1 761,71$ 085,42 541,22$78 secivreStnemeganaMdnagnireenignE 019,2 425,33$ 630,46 926,64$88 sdlohesuoHetavirP 625,2 441,8$ 934,33 418,8$98 CEN,secivreS 53 884,72$ 651,2 581,64$
tnemnrevoG 077,92 688,43$ 772,054 908,63$laredeF 014,4 885,04$ 136,76 858,24$
etatS 070,8 646,33$ 487,611 190,53$lacoL 092,71 324,03$ 268,562 774,23$
.sreyolpmelaudividnirofatadfoerusolcsiddiovaotnwohstonsegawdnatnemyolpmE*
Figure 23 (Continued)Annual Covered Wages and EmploymentSpokane County and Washington State, 1999Source: Employment Security Department
Spokane County Profile - 21
missible two-digit SIC code industries are shown inFigure 23 for Spokane County and Washington State.Note that the average wage by sector throughout thestate is almost always higher than Spokane County’saverage wage. (Again, the state’s average wage data areheavily influenced by King County: the high-paying aero-space and high-tech industries drive up the wage forthe densely populated county and, consequently, forthe state as a whole.)
A look at Spokane County’s industry divisions showsthat eight of the SIC two-digit industries have slightlyhigher salaries than for the state. These include: cropproduction (01), forestry (08), stone/clay/glass prod-ucts (32), electric and gas services (49), security andcommodity brokers (62), investment offices (67), andeducational services (82). Metal mining (10) is theonly industry to have a significantly higher salary at thecounty level compared to the state, $102,317 comparedto $72,207.
Besides security and commodity brokers, investmentoffices, and metal mining, only one other industry pays
more than $60,000—petroleum and coal products (29).The lowest average covered wages were for eating anddrinking places (58) and motion pictures (78), bothpaying about $10,400.
These figures should be used only to draw broad con-clusions. Some industries are purposefully excluded forconfidentiality purposes, and the inclusion of data on part-time workers and executive earnings exaggerate wage dis-parities between otherwise comparable industries.Moreover, the wages have not been adjusted for regionalcost-of-living variations, which can be very significant.
In the following sections the different employmentsectors are discussed using two different data sources.Except for agriculture, the employment trend for the sec-tor is discussed based on data from the CES program.Then each sector and industries within the sector arediscussed in terms of 1999 employment and averagesalary based on ES-202 data. These data are shown inFigure 23.
In terms of employment, the agricultural sector isquite small in Spokane County, especially when comparedto other eastern Washington counties. It employs a totalof about 1,625 workers, less than 1 percent of all wageand salary workers in the county. Spokane ranks 37thamong the counties in terms of the percentage of peopleemployed in agriculture. Seventy-five percent of theseare employed in agriculture services with an averagesalary of $17,629.
Agriculture, Forestry, and FishingThe second largest group are those employed in crop
production, 19.6 percent of the sector total. The bulk ofthe crops are field crops, mainly grains, that tend to bemore capital-intensive than labor-intensive. The averagewage for agricultural workers in the county was $18,899in 1999, compared to $19,697 for the sector statewide.The average is influenced by the high salary for the veryfew workers, only 47, employed in forestry.
Mining is a small portion of the sector, accountingfor less than 2 percent of the sector’s 10,298 jobs.Within mining Spokane has a significantly higher per-centage of workers in metal mining than at the statelevel, 1.4 percent of total sector employment comparedto .24 percent in the state. Metal mining provides thehighest salary in the county, $102,317. Because min-ing employment is relatively minor, the rest of the dis-cussion will concern construction.
Figure 24 shows the employment trend for construc-tion and mining from 1970 to 1999 in Spokane County.Growth in the sector really began to take off in 1987,with an average annual growth rate of 7 percent from
Construction and Mining1987 through 1994. The number of jobs increased from6,000 in 1986 to 10,900 in 1999. From 1995 growthbegan to slow dramatically. From 1995 to 1999 the aver-age was 1.2 percent, with negative growth in 1995, 1997,and 1998. The growth rate in 1999 was 5.8 percent with600 new jobs.
In 1999, 5.6 percent of all employment in Spokanewas in the construction and mining sector. The share ofemployment was virtually the same for the state at 5.5percent. Sixty-two percent of those employed in the sec-tor were in special trades with an average salary of$30,195. These include plumbers, painters, heating andair conditioning specialists, carpenters, etc. The next

Spokane County Profile - 22
largest group, with about 26 percent of total construc-tion jobs, was general building. This group is generallyemployed in new construction, both commercial andresidential. About 10 percent of construction jobs dealtwith heavy construction, primarily highway and streetconstruction and sewer and utility lines.
The construction and mining average salary($45,730) is the only sector salary higher than the stateaverage ($42,322). It is also the second highest sectorsalary in the county after FIRE ($51,391). If metal min-ing is taken out of the calculation for the average sectorsalary, the Spokane average goes down to $31,584, com-pared to the state average of $37,317, and compared tothe average salary for the county of $30,691. Metal min-ing greatly influences the average even though it onlyaccounts for 1.4 percent of sector employment.
Major employers in the area are found in a number ofindustries, including aluminum, machinery, computer andperipherals, transportation equipment (including engines,boats, trailers, and aircraft), and printing and publishing.The three largest industries within the sector are: primarymetal industries (16.1 percent), industrial machinery andcomputer equipment (12.7 percent), and electronicequipment (11.7 percent). Fortunately, all three of theseindustries provide salaries higher than the sector averageof $32,679. Thirty percent of employment in primary metalindustries is due to the production of alumina. Manufac-turing no longer provides the highest sector salary as itused to; it now ranks fourth after construction and min-ing, wholesale trade, FIRE, and government.
Figure 24Construction and Mining EmploymentSpokane County, 1970-1999Source: Employment Security Department
4,000
5,000
6,000
7,000
8,000
9,000
10,000
11,000
12,000
1970 1974 1978 1982 1986 1990 1994 1998
Figure 25 shows that employment in manufacturinghas increased from 12,660 jobs in 1970 to 21,800 jobsin 1999, an average annual growth rate of 2 percent.More recently, the annual growth rate has declinedsteadily from 5.1 percent in 1994 to -1.8 percent in 1999.Manufacturing jobs declined by 1.3 percent in1998 andagain by 1.8 percent in 1999, for a total loss of 700 jobs.Over 500 of these jobs were in primary metal industries,predominately aluminum.
With an 11.6 percent share of all nonfarm employ-ment, manufacturing in the county is proportionatelysmaller than the state’s, which has a 13.8 percent share.However, the county has not experienced the same de-cline which has occurred throughout the state. Since1970, the statewide sector shrunk from 22.2 to 13.8percent, while the county share declined only from 14to 11.6 percent.
The manufacturing sector is the cornerstone of Spo-kane County’s economic health. Although the county islocated far from major markets, it has developed intomore than a regional hub. The sector produces goodsfor local, regional, national, and international markets,ranging from processed food to airplane parts to com-puters. In terms of employment, manufacturing tendsto follow national trends quite closely. As Figure 25shows, most declines in the work force have occurredduring periods of national recessions, showing that thesector is closely linked to the same influences that af-fect the nation.
ManufacturingFigure 25Manufacturing EmploymentSpokane County, 1970-1999Source: Employment Security Department
10,000
12,000
14,000
16,000
18,000
20,000
22,000
24,000
1970 1974 1978 1982 1986 1990 1994 1998

Spokane County Profile - 23
Besides agriculture, TPU, which includes trucking,warehousing, and utilities, is the county’s smallest sec-tor with only 4 percent of all employment. Compared toother sectors, its growth has been diminutive. As shownin Figure 26, employment in TPU increased from only7,400 workers in 1970 to 8,100 workers in 1999.
The lack of growth was initiated by the huge drop of1,200 workers in a two-year period during the reces-sions of the early 1980s. Employment dropped from apeak of 8,200 in 1980 to 7,000 in 1982. Employmentgradually increased and finally surpassed the former peakin 1994 when there were 8,400 workers in the sector.The number of workers then began to decline reaching7,800 in 1997. It has since rebounded reaching 8,100in 1999. The average wage was $32,396 in 1999.
The largest industry in the sector is trucking and ware-housing, with about 32 percent of sector jobs (2,404workers). This percentage, which is higher than the state-wide average of 24 percent, reflects Spokane County’sposition as an agricultural hub for a large area. The com-munications industry, which includes cable, broadcast
Figure 27 shows the employment trend for the tradesector in Spokane County from 1970 to 1999. The num-ber of jobs increased more than two fold from 23,400 in1970 to 48,400 in 1999 with an average annual growthrate of 2.6 percent. The average rate of growth for thestate was 3.4 percent. Most recently the growth rate forSpokane declined from 3.4 percent in 1998 to 0.4 per-cent in 1999.
Until 1989 trade was the largest employer in SpokaneCounty. Since then it has remained in second place afterservices. In 1999, trade employment was 25.8 percentof total employment compared to services which was29.9 percent. Trade is broken down into two compo-nents, wholesale and retail. Wholesale and retail tradecomprised 6.8 percent and 19 percent, respectively, oftotal employment.
The average wage for wholesale trade is significantlyhigher than for retail trade, $34,152 verses $18,769.Wholesale trade, with 24 percent of trade employment,generated 40 percent of trade’s entire payroll in 1999.Wholesale trade employment also has a higher percent-age at the county level than for the state, 6.8 verses 5.6
Figure 26TPU EmploymentSpokane County, 1970-1999Source: Employment Security Department
Transportation and Public Utilities (TPU)
6,000
6,500
7,000
7,500
8,000
8,500
9,000
1970 1974 1978 1982 1986 1990 1994 1998
TV, radio, and telephone service, is the second largestindustry with about 1,777 employees (24 percent of thesector). Workers in air transportation (1,423) were thethird largest industry within the sector with 19 percentof total sector employment.
TradeFigure 27Trade EmploymentSpokane County, 1970-1999Source: Employment Security Department
percent. Within wholesale trade durable goods constitutea higher percentage for the county (65 percent) than thestate (57 percent). This is favorable for the county as du-rable goods provide a higher average salary than non-du-rable goods, $36,535 and $31,769, respectively.
20,000
25,000
30,000
35,000
40,000
45,000
50,000
1970 1974 1978 1982 1986 1990 1994 1998

Spokane County Profile - 24
Figure 28 shows the trend for employment in the FIREsector for Spokane County from 1970 to 1999. Employ-ment in the FIRE sector almost doubled from 5,300 in1970 to 11,100 in 1999. The sector had an average an-nual growth rate of 2.7 percent, somewhat less than thestate average growth rate of 3.0 percent. Most recentlythe annual growth rate has declined from 2.9 percent in1997 to 1.8 percent in 1999.
The FIRE sector, reflective of Spokane County’s roleas a regional financial hub for a wide agricultural area,is larger in terms of employment than the sector is on astatewide basis, 5.8 percent compared to 5.1 percentfor the state. The average wage for the sector was $51,391in 1999, the highest sectoral wage.
Thirty-two percent of sector employment in 1999 wasin depository institutions: banks, credit unions, savingsand loans, etc. with an average salary of $32,332. Insur-ance carriers and real estate each provided 19 percentof sector employment. Security and commodity brokersearned the highest salary of $96,370 but provided only6.6 percent of sector employment (706 workers).
The services sector has been the fastest growing andis now the largest sector in Spokane County. In 1989 itsurpassed trade in size, and each year since has increasedthe spread. Service employment tripled from 18,700 jobsin 1970 to 57,900 in 1999 (Figure 29). This was due toan average annual growth rate of 4.0 percent, comparedto the state growth rate of 5.2 percent.
Almost a third (29.9 percent) of all nonfarm jobs inthe county are in the services sector. Statewide 26.9 per-cent of all jobs are in the service sector. The averagewage for 1999 was $20,854.
Spokane has a number of hospitals and other medi-cal facilities and is a medical care center for a large sur-
Retail trade provided 19 percent of total employmentfor the county and 17.9 percent for the state. The aver-age wage for retail ($18,769) is the lowest sectoral wage.It should be noted, though, that the trade sector, like theagricultural sector, has a high level of part-time workwhich strongly affects the average wage. (All jobs aretreated equally in the average wage calculations, so thatone entailing 20 hours work a week is counted the sameas one entailing 40 hours a week.)
The largest employing industry in retail trade waseating and drinking places, employing over 12,619 work-ers, 36 percent of all retail employment, and paid anaverage wage of $10,425, the lowest in the county. Res-taurant work is characterized by part-time work andentry-level pay scales (often minimum wage), so this fig-ure is not surprising. Food stores had 5,350 employeesand both auto dealers/service stations and general mer-chandise stores employed around 4,000 workers.
Finance, Insurance, and Real Estate (FIRE)Figure 28FIRE EmploymentSpokane County, 1970-1999Source: Employment Security Department
Servicesrounding area. Health care services is, by far, the largestindustry in the services sector. About 38 percent of ser-vices jobs in Spokane County are in the health care in-dustry (the figure is only 26 percent statewide). Thehealth service average wage, $28,766, is lower than thecounty’s overall average wage and the average for healthcare workers statewide, which was $31,616 in 1999.
The industry encompasses employment at hospitalsand nursing homes as well as the offices of physiciansand dentists and others. The largest employers are gen-eral medical hospitals, who had about 7,000 workerson the payroll in 1999, 34 percent of health servicesemployment. Private physicians and clinics were the next
4,000
5,000
6,000
7,000
8,000
9,000
10,000
11,000
12,000
1970 1974 1978 1982 1986 1990 1994 1998

Spokane County Profile - 25
largest group with almost 3,800 employees, 18 percentof the total. Nursing care facilities employed some 3,000
workers (15 percent). The next two largest groups weredentists (1,500 workers) and home health care services(1,430 workers). Average wages in these industries rangefrom the high paid by hospitals of $36,113 to the $15,783received by home health care providers.
The next largest industry in the sector is business ser-vices; firms which provide services to producers (i.e.,businesses) rather than to consumers, with 16 percentof services employment. Most industry employment isconcentrated in temporary help services (20 percent)and building maintenance services (15 percent). Build-ing maintenance earned the lowest average salary of$11,000 within business services. The average wage forthe industry in 1999 was $22,294.
There is a fair amount of employment in social ser-vices (8.8 percent), hotels and lodging places (5.9 per-cent), and engineering and management services (5.3percent). The latter earns the highest average wage withinthe sector, $33,524.
Figure 29Services EmploymentSpokane County, 1970-1999Source: Employment Security Department
10,000
20,000
30,000
40,000
50,000
60,000
70,000
1970 1974 1978 1982 1986 1990 1994 1998
Civilian government employment has grown steadily,if not spectacularly, since the early 1980s (Figure 30).Since 1970 the number of jobs has increased from17,800 then to 31,800 in 1999. The average annualgrowth rate for government has been 2.1 percent in Spo-kane County and 2.3 percent for the state. Interestingly,while the county growth rate has increased steadily from.7 percent in 1996 to 2.3 percent in 1999, the annualgrowth rate for the state was 1.5 percent in 1996 and1999, with only negligible increases in between.
Public employment has a 16.2 percent share of allnonfarm jobs in the county, fairly comparable to the state-wide share of 17 percent. Although government is notthe largest or fastest growing sector, it provides an ele-ment of stability to the economy as well as a relativelywell-paid work force that injects a sizable payroll intothe local area.
Jobs within government in Spokane County are dis-tributed very much like they are statewide. Federal gov-ernment has 14.8 percent of the total in the county and15 percent statewide. State government accounts for 27.1percent in the county and 25.9 percent statewide. Localgovernment, easily the largest, has a 58.1 percent sharein the county and 59 percent throughout the state.
The federal presence in Spokane County largely stemsfrom the postal service and civilian employment atFairchild Air Force Base. All told, the federal govern-
GovernmentFigure 30Government EmploymentSpokane County, 1970-1999Source: Employment Security Department
ment has a $179 million payroll in the county that re-sults in an average wage of $40,588. Although the mili-tary are not normally factored into labor force andnonfarm jobs calculations, the Air Force has a strongeffect upon the area. According to a presentation doneby a Fairchild Air Force Base representative in 2000, thebase had a payroll of $96 million for civilians, $52 mil-lion for military personnel, and $145 million for mili-tary retirees. The Office of Financial Managementestimated there to be 2,995 active duty personnel in Spo-kane County in 1999, a decline of 938 since 1995.
15,000
17,000
19,000
21,000
23,000
25,000
27,000
29,000
31,000
33,000
1970 1974 1978 1982 1986 1990 1994 1998

Spokane County Profile - 26
Nonfarm employment projections for the 1998-2003period, for Spokane County and Washington State, areshown in Figure 31. The projections are made by Em-ployment Security Department analysts based on histori-cal trends and anticipated developments in the variousindustries. The county is expected to have substantiallygreater growth in its employment base than the state,
The bulk of state government jobs (43 percent) arewith the higher education facilities in the county: East-ern Washington University in Cheney and Spokane andSpokane Falls community colleges. Although not as highas the federal average wage, state government workers,including the educational staff, averaged $33,646 inwages in 1999.
Almost two-thirds of local government is involved withK-12 education and most of the remainder is given overto governmental administrative and executive functions.In 1999, this sector had close to 17,300 employees inSpokane County. The average wage of $30,423 was thelowest of the three governmental divisions, and slightlyless than the county’s overall average.
Industry Projections
enakopS notgnihsaW8991 3002 egnahC% sboJ# 8991 3002 egnahC%
tnemyolpmEmrafnoNlatoT 009,881 000,312 %8.21 001,42 000,595,2 006,738,2 %3.9gnirutcafunaM 002,22 004,32 %4.5 002,1 008,873 001,073 %3.2-
gniniM&noitcurtsnoC 003,01 008,01 %9.4 005 000,741 001,261 %3.01seitilitU&noitatropsnarT 002,8 007,8 %1.6 005 001,631 007,241 %8.4edarTliateR&elaselohW 001,84 000,35 %2.01 009,4 000,426 008,186 %3.9
etatsElaeR&,.snI,ecnaniF 009,01 009,11 %2.9 000,1 000,531 009,241 %9.5secivreS 009,75 000,96 %2.91 001,11 000,017 004,928 %8.61
tnemnrevoG 003,13 002,63 %7.51 009,4 001,464 006,805 %6.9
Figure 31Industry ProjectionsSpokane County and Washington State, 1998 and 2003Source: Employment Security Department
12.8 percent compared to 9.3 percent, which translatesinto 24,100 more jobs. The greatest growth for the countyis expected in services at 19.2 percent, which is alsotrue for the state. Government in the county is expectedto grow by 15.7 percent, compared to state growth ofonly 9.6 percent. The only sector expected to have lessgrowth than the state is construction and mining, 4.9percent in the county and 10.3 percent for the state.

Spokane County Profile - 27
A different but informative way to view an area’s workforce is in terms of occupational divisions rather thanindustrial divisions. Occupation data differ from indus-try data in that the former are categorized by job func-tion regardless of output, whereas the latter arecategorized by final product. In other words, an occu-pation category, such as managerial and administrative,tracks employment and wages for all workers (16 andolder) who perform a certain class of duties regardlessof the industry. Figure 32 shows employment in the ma-jor occupational divisions as well as the share of eachgrouping for Spokane County and the state for 1998 and
the 2008 projections. The data are based on Occupa-tional Employment Surveys (OES) conducted in the areaby the Employment Security Department in 1998.
The occupational makeup reveals only a modest de-parture from the state’s occupational structure. Themost visible disparities between the county and statewere for service occupations (18.5 verses 15.4 per-cent) and agricultural occupations (.8 verses 3.9 per-cent). These dissimilarities are the result of SpokaneCounty having a regional service sector and field cropswhich are not labor-intensive, such as wheat. Dividingthe occupational mix into blue-collar and white-collar
OCCUPATIONAL PROFILE
enakopS8991 erahS% 8002 erahS% ghC% sboJ
latoT 358,512 %0.001 471,742 %0.001 %5.41 123,13evitartsinimdAdnalaireganaM 311,51 %0.7 277,71 %2.7 %6.71 956,2
.hceT&,.forparaP,lanoisseforP 003,64 %4.12 470,65 %7.22 %1.12 477,9selaS&gnitekraM 837,52 %9.11 229,82 %7.11 %4.21 481,3
troppuS.nimdA&lacirelC 680,63 %7.61 998,83 %7.51 %8.7 318,2secivreS 710,04 %5.81 317,74 %3.91 %2.91 696,7
detaleR&,gnihsiF,yrtseroF,.gA 218,1 %8.0 388,1 %8.0 %9.3 17riapeR&,tfarC,noitcudorP.cerP 134,32 %9.01 263,52 %3.01 %2.8 139,1
srerobaL&,srotacirbaF,srotarepO 653,72 %7.21 945,03 %4.21 %7.11 391,3ralloC-etihW 452,361 %6.57 083,981 %6.67 %0.61 621,62
ralloC-eulB 995,25 %4.42 497,75 %4.32 %9.9 591,5
notgnihsaW8991 erahS% 8002 erahS% ghC% sboJ
latoT 059,240,3 %0.001 091,385,3 %0.001 %8.71 042,045evitartsinimdAdnalaireganaM 786,632 %8.7 654,882 %1.8 %9.12 967,15
.hceT&,.forparaP,lanoisseforP 989,986 %7.22 497,968 %3.42 %1.62 508,971selaS&gnitekraM 058,543 %4.11 491,604 %3.11 %4.71 443,06
troppuS.nimdA&lacirelC 747,474 %6.51 746,915 %5.41 %5.9 009,44secivreS 581,964 %4.51 718,475 %0.61 %5.22 236,501
detaleR&gnihsiF,yrtseroF,.gA 601,911 %9.3 172,221 %4.3 %7.2 561,3riapeR&,tfarC,noitcudorP.cerP 891,633 %0.11 224,473 %4.01 %4.11 422,83
srerobaL&,srotacirbaF,srotarepO 881,173 %2.21 985,724 %9.11 %2.51 104,65ralloC-etihW 854,612,2 %8.27 809,856,2 %2.47 %0.02 054,244
ralloC-eulB 294,628 %2.72 282,429 %8.52 %8.11 097,79
Figure 32Occupational Employment and ProjectionsSpokane County and Washington State, 1998 and 2008Source: Employment Security Department

Spokane County Profile - 28
occupations, one can see that Spokane County has aslightly higher percentage of white-collar occupationsthan the state as a whole.
Occupational employment projections are also shownin Figure 32. The greatest growth for Spokane occupa-tions is expected for professional, paraprofessional, andtechnical (21.1 percent change) and services (19.2 per-cent), both of which will remain as the two predomi-
nant occupations. This relates well to national trends thatshow the economy becoming more service-oriented.Even with only 7.8 percent projected growth, clericaland administrative support occupations will remain asthe third largest occupational category with a 15.7 per-cent share in 1998, followed by marketing and salesoccupations at 12.4 percent.
Similar occupational growth is expected for the state,only higher rates for each category.
eltiTlanoitapuccO *egaW **knaRsnoitapuccOevitartsinimdAdnalaireganaM
evitucexEpoT®anaMlareneG 52.72$ 2rotartsinimdA®anaMrehtOllA 53.42$ 21
reganaMlaicnaniF 94.52$ 14reganaMgnigdoL&ecivreSdooF 13.31$ 55
rgMleRcilbuP,gnisitrevdA,gnitekraM 01.42$ 06rotartsinimdAnoitacudE 30.72$ 66
reganaMnoitcurtsnoC 97.42$ 98reganaMetatsElaeR&ytreporP 09.11$ 39
reganaMecivreShtlaeH&enicideM 79.32$ 99reganaMgnisahcruP 36.91$ 131
reganaMecivreSevitartsinimdA 01.22$ 161reganaMnoitcudorPlairtsudnI 19.42$ 071
rgMecneicSlrtaN,htaM,gnireenignE 53.13$ 271rgMnoitaleRrobaL&niarT,lennosreP 30.22$ 771rgMseitilitU,tropsnarT,noitacinummoC 54.22$ 002
snoitapuccOlacinhceTdna,lanoisseforparaP,lanoisseforPesruNderetsigeR 15.02$ 6
loohcSyradnoceS,rehcaeT 064,83$ 71yratnemelE,rehcaeT 052,93$ 81
rotiduA&tnatnuoccA 73.91$ 03lanoisseforparaP,ediArehcaeT 71.9$ 43
reywaL 63.33$ 63noegruS&naicisyhP 78.15$ 44
esruNlacitcarPdesneciL 95.41$ 74hceT,forparaP,forPhtlaeHrehtOllA 95.41$ 84hceT,forparaP,lanoisseforPrehtOllA 11.91$ 94
noitacudElanoitacovnoN,rotcurtsnI 00.21$ 65noitacudElanoitacoV,rehcaeT 61.81$ 36
cirtaihcysP&lacideMcxe,kroWlaicoS 22.61$ 46rehcaeTyradnocestsoPrehtOllA 052,03$ 17
cirtaihcysP&lacideM,kroWlaicoS 74.61$ 38noitacudElaicepS,rehcaeT 004,83$ 48
retfarD 85.41$ 68PDE,tsylanAmetsySretupmoC 55.12$ 29
tropS,hcaoC&rotcurtsnI 46.61$ 89naicinhceTcinortcelE&lacirtcelE 25.21$ 201
ngiseDroiretnItpecxe,rengiseD 67.9$ 401rekroWtroppuStnemeganaMrehtOllA 95.71$ 801
remmargorPretupmoC 19.81$ 211tsicamrahP 35.92$ 721
reenignEcinortcelE&lacirtcelE 26.52$ 231rolesnuoC,lanoitacudE&lanoitacoV 10.61$ 531
rolesnuoClaitnediseR 18.8$ 831rotamitsEtsoC 88.81$ 931detaleR&tsitrA 83.31$ 241
tsigolonhceTyrotarobaLcinilC&lacideM 05.71$ 341tsineigyHlatneD 54.42$ 541
rotidE&retirW 65.81$ 741eniraM&epacsdnaLtpecxe,tcetihcrA 67.02$ 051
rolesnuoC&reciffOnaoL 60.02$ 251
Figure 33Occupational WagesSpokane County, 1998Source: Employment Security Department
eltiTlanoitapuccO *egaW **knaRreenignElacinahceM 57.42$ 651
ygrelC 35.71$ 851rekroWecivreSnamuH 84.9$ 951
reenignErehtOllA 04.72$ 061cepSnoitaleRrobaL&niarT,lennosreP 39.71$ 261
tsigolonhceTcigoloidaR 41.71$ 361ciffarTgnidulcni,reenignEliviC 24.22$ 761
tsilaicepSlaicnaniFrehtOllA 45.61$ 861hceTdetaleR&gnireenignErehtOllA 09.51$ 171
mraF,liateR,lslhWcxe,tnegAesahcruP 43.61$ 571mraFtpecxe,reyuBliateR,elaselohW 48.61$ 971
lanoisseforP,nairarbiL 89.91$ 181rekroWnoitaerceR 20.01$ 381
naicinhceTgnireenignEliviC 84.81$ 981tsnoCcxe,rotcepsnI&reciffOylpmoC 31.02$ 391
lagelaraP 95.61$ 591rehpargotohP 97.21$ 791reraperPxaT 57.21$ 991
snoitapuccOdetaleRdnaselaSliateR,nosrepselaS 68.9$ 1
reihsaC 88.7$ 4detaleR&selaS,rosivrepuSeniLtsriF 99.71$ 7
detaleR,icS,liateRcxe,peRselaS 34.91$ 91roolFselaS,krelCkcotS 87.8$ 05
leR&selaSrooD-oT-rooD,retekrameleT 12.9$ 35noitapuccOdetaleR&selaSrehtOllA 86.11$ 75
krelClatneR&retnuoC 64.7$ 85liateRcxe,detaleR&ecneicS,peRselaS 53.91$ 67
straP,nosrepselaS 41.31$ 88selaS,secivreSlaicnaniF,seitiruceS 29.82$ 411
rekroWselaSecnarusnI 85.02$ 321secivreSssenisuB,tnegAselaS 92.61$ 351
etatsElaeR,tnegAselaS 26.31$ 081gnisitrevdA,tnegAselaS 81.51$ 481
tnegAlevarT 27.9$ 891snoitapuccOtroppuSevitartsinimdAdnalacirelC
krelCeciffOlareneG 09.9$ 3krelCgnitiduA&gnitnuoccA,gnipeekkooB 27.01$ 5
lacideM&lageLtpecxe,yraterceS 43.11$ 9krelCnoitamrofnI,tsinoitpeceR 27.8$ 02
lacirelC,rosivrepuSeniLtsriF 85.51$ 12esuoheraWromoorkcotS,krelCkcotS 17.9$ 42
krelCgnivieceR&gnippihS,ciffarT 90.11$ 82troppuSnimdA&lacirelCrehtOllA 92.21$ 24
gnissecorPdroWgnidulcni,tsipyT 21.11$ 34relleTknaB 44.8$ 25
krelC,tssAlanoitacudE&ediArehcaeT 95.8$ 57reirraCliaMlatsoP 91.61$ 08
rotcelloCtnuoccA&lliB 98.01$ 18rotagitsevnI,retsujdAecnarusnI 18.91$ 09
rotarepOdraobhctiwS 83.9$ 001
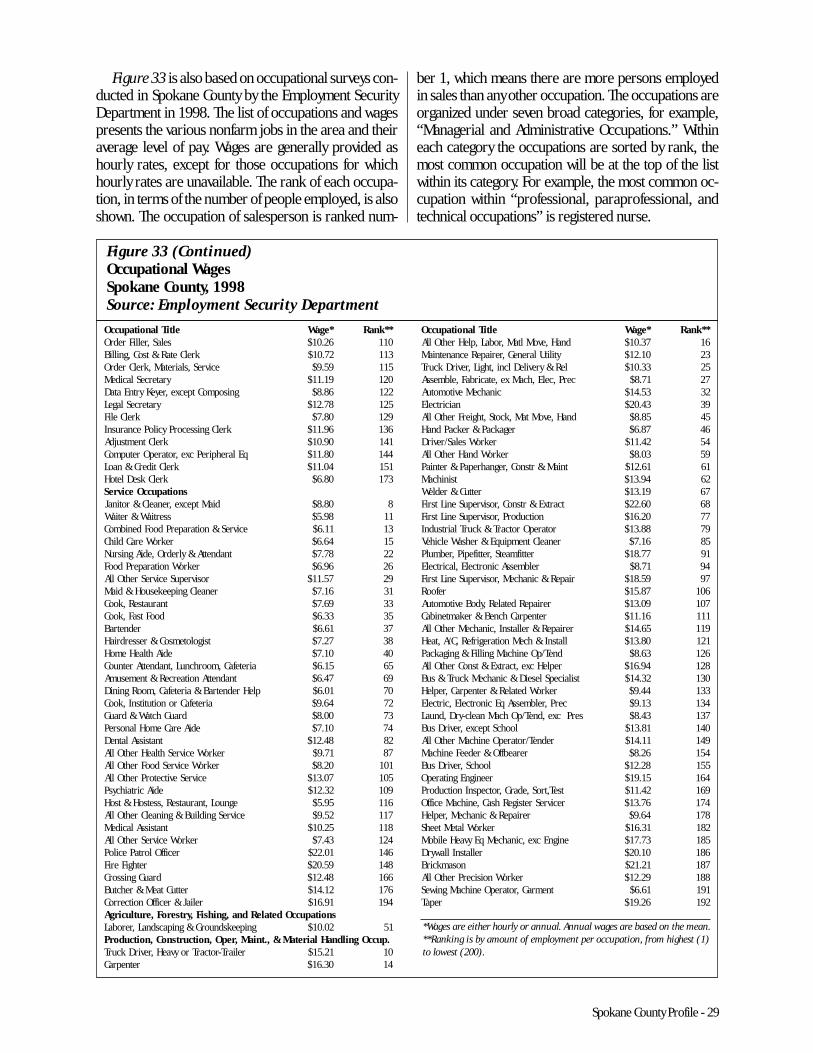
Spokane County Profile - 29
Figure 33 is also based on occupational surveys con-ducted in Spokane County by the Employment SecurityDepartment in 1998. The list of occupations and wagespresents the various nonfarm jobs in the area and theiraverage level of pay. Wages are generally provided ashourly rates, except for those occupations for whichhourly rates are unavailable. The rank of each occupa-tion, in terms of the number of people employed, is alsoshown. The occupation of salesperson is ranked num-
ber 1, which means there are more persons employedin sales than any other occupation. The occupations areorganized under seven broad categories, for example,“Managerial and Administrative Occupations.” Withineach category the occupations are sorted by rank, themost common occupation will be at the top of the listwithin its category. For example, the most common oc-cupation within “professional, paraprofessional, andtechnical occupations” is registered nurse.
Figure 33 (Continued)Occupational WagesSpokane County, 1998Source: Employment Security Department
eltiTlanoitapuccO *egaW **knaRselaS,relliFredrO 62.01$ 011
krelCetaR&tsoC,gnilliB 27.01$ 311ecivreS,slairetaM,krelCredrO 95.9$ 511
yraterceSlacideM 91.11$ 021gnisopmoCtpecxe,reyeKyrtnEataD 68.8$ 221
yraterceSlageL 87.21$ 521krelCeliF 08.7$ 921
krelCgnissecorPyciloPecnarusnI 69.11$ 631krelCtnemtsujdA 09.01$ 141
qElarehpirePcxe,rotarepOretupmoC 08.11$ 441krelCtiderC&naoL 40.11$ 151
krelCkseDletoH 08.6$ 371snoitapuccOecivreS
diaMtpecxe,renaelC&rotinaJ 08.8$ 8ssertiaW&retiaW 89.5$ 11
ecivreS&noitaraperPdooFdenibmoC 11.6$ 31rekroWeraCdlihC 46.6$ 51
tnadnettA&ylredrO,ediAgnisruN 87.7$ 22rekroWnoitaraperPdooF 69.6$ 62
rosivrepuSecivreSrehtOllA 75.11$ 92renaelCgnipeekesuoH&diaM 61.7$ 13
tnaruatseR,kooC 96.7$ 33dooFtsaF,kooC 33.6$ 53
rednetraB 16.6$ 73tsigolotemsoC&resserdriaH 72.7$ 83
ediAhtlaeHemoH 01.7$ 04airetefaC,moorhcnuL,tnadnettAretnuoC 51.6$ 56
tnadnettAnoitaerceR&tnemesumA 74.6$ 96pleHrednetraB&airetefaC,mooRgniniD 10.6$ 07
airetefaCronoitutitsnI,kooC 46.9$ 27drauGhctaW&drauG 00.8$ 37
ediAeraCemoHlanosreP 01.7$ 47tnatsissAlatneD 84.21$ 28
rekroWecivreShtlaeHrehtOllA 17.9$ 78rekroWecivreSdooFrehtOllA 02.8$ 101
ecivreSevitcetorPrehtOllA 70.31$ 501ediAcirtaihcysP 23.21$ 901
egnuoL,tnaruatseR,ssetsoH&tsoH 59.5$ 611ecivreSgnidliuB&gninaelCrehtOllA 25.9$ 711
tnatsissAlacideM 52.01$ 811rekroWecivreSrehtOllA 34.7$ 421
reciffOlortaPeciloP 10.22$ 641rethgiFeriF 95.02$ 841
drauGgnissorC 84.21$ 661rettuCtaeM&rehctuB 21.41$ 671
reliaJ&reciffOnoitcerroC 19.61$ 491snoitapuccOdetaleRdna,gnihsiF,yrtseroF,erutlucirgA
gnipeeksdnuorG&gnipacsdnaL,rerobaL 20.01$ 15.puccOgnildnaHlairetaM&,.tniaM,repO,noitcurtsnoC,noitcudorP
reliarT-rotcarTroyvaeH,revirDkcurT 12.51$ 01retnepraC 03.61$ 41
eltiTlanoitapuccO *egaW **knaRdnaH,evoMltaM,robaL,pleHrehtOllA 73.01$ 61
ytilitUlareneG,reriapeRecnanetniaM 01.21$ 32leR&yrevileDlcni,thgiL,revirDkcurT 33.01$ 52
cerP,celE,hcaMxe,etacirbaF,elbmessA 17.8$ 72cinahceMevitomotuA 35.41$ 23
naicirtcelE 34.02$ 93dnaH,evoMtaM,kcotS,thgierFrehtOllA 58.8$ 54
regakcaP&rekcaPdnaH 78.6$ 64rekroWselaS/revirD 24.11$ 45
rekroWdnaHrehtOllA 30.8$ 95tniaM&rtsnoC,regnahrepaP&retniaP 16.21$ 16
tsinihcaM 49.31$ 26rettuC&redleW 91.31$ 76
tcartxE&rtsnoC,rosivrepuSeniLtsriF 06.22$ 86noitcudorP,rosivrepuSeniLtsriF 02.61$ 77
rotarepOrotcarT&kcurTlairtsudnI 88.31$ 97renaelCtnempiuqE&rehsaWelciheV 61.7$ 58
rettifmaetS,rettifepiP,rebmulP 77.81$ 19relbmessAcinortcelE,lacirtcelE 17.8$ 49
riapeR&cinahceM,rosivrepuSeniLtsriF 95.81$ 79refooR 78.51$ 601
reriapeRdetaleR,ydoBevitomotuA 90.31$ 701retnepraChcneB&rekamtenibaC 61.11$ 111
reriapeR&rellatsnI,cinahceMrehtOllA 56.41$ 911llatsnI&hceMnoitaregirfeR,C/A,taeH 08.31$ 121
dneT/pOenihcaMgnilliF&gnigakcaP 36.8$ 621repleHcxe,tcartxE&tsnoCrehtOllA 49.61$ 821
tsilaicepSleseiD&cinahceMkcurT&suB 23.41$ 031rekroWdetaleR&retnepraC,repleH 44.9$ 331
cerP,relbmessAqEcinortcelE,cirtcelE 31.9$ 431serPcxe,dneT/pOhcaMnaelc-yrD,dnuaL 34.8$ 731
loohcStpecxe,revirDsuB 18.31$ 041redneT/rotarepOenihcaMrehtOllA 11.41$ 941
reraebffO&redeeFenihcaM 62.8$ 451loohcS,revirDsuB 82.21$ 551reenignEgnitarepO 51.91$ 461
tseT,troS,edarG,rotcepsnInoitcudorP 24.11$ 961recivreSretsigeRhsaC,enihcaMeciffO 67.31$ 471
reriapeR&cinahceM,repleH 46.9$ 871rekroWlateMteehS 13.61$ 281
enignEcxe,cinahceMqEyvaeHeliboM 37.71$ 581rellatsnIllawyrD 01.02$ 681
nosamkcirB 12.12$ 781rekroWnoisicerPrehtOllA 92.21$ 881
tnemraG,rotarepOenihcaMgniweS 16.6$ 191repaT 62.91$ 291
*Wages are either hourly or annual. Annual wages are based on the mean.**Ranking is by amount of employment per occupation, from highest (1)to lowest (200).

Spokane County Profile - 30
Personal income is generally seen as a key indicatorof a region’s economic vitality. Conceptually, personalincome captures all forms of income: wages, salaries,government transfer payments, retirement income, farmincome, self-employed income, proprietors’ income,interest, dividends, and rent, but not contributions to-ward social insurance. By definition business and cor-porate incomes are not included.
Figure 34 shows real and nominal total personal in-come for Spokane from 1970 to 1998.
In 1998, total personal income in Spokane Countywas $9.57 billion, up 3.7 percent from the previous year.Total personal income averaged 3.0 percent annualgrowth from 1970 to 1998. For the same period, totalpersonal income for the state had an average annualgrowth of 4.0 percent. Spokane County ranked 4th amongthe 39 counties in terms of total personal income.
Figure 35 shows the annual growth rates for totalpersonal income for both Spokane County and Wash-ington State from 1971 to 1998. For the most part, thecounty growth rate has followed and been close to thestate growth rate, although usually slightly less. From
PERSONAL INCOMEThis section deals with income rather than wages, which
were discussed earlier and which are only one aspect ofincome. Data in this section are derived from the U.S.
Department of Commerce, Bureau of Economic Analysis.All income data have been adjusted to 1998 dollars.
Total Personal Income
Figure 34Total Personal Income, Real and NominalSpokane County, 1970-1998Source: Bureau of Economic Analysis
Figure 35Personal Income Annual Growth RatesSpokane County and Washington, 1971-1998Source: Bureau of Economic Analysis
$0
$1,000,000
$2,000,000
$3,000,000
$4,000,000
$5,000,000
$6,000,000
$7,000,000
$8,000,000
$9,000,000
$10,000,000
1970 1974 1978 1982 1986 1990 1994 1998
Real
Nominal
1985 to 1990 a gap emerged between the county andthe state growth rates, with Spokane lagging behind.The gap narrowed, sometimes crossing, between 1991and 1995, only to emerge again and widen between1996 and the present.
The total amount of income in an area is only a sen-sible concept if there is some relationship to the num-ber of people in an area. Per capita income (PCI)captures that. By dividing total personal income by thepopulation, one arrives at a figure that can be used as acommon denominator between different time periodsor different areas.
Figure 36 shows PCI for Spokane County and Wash-ington State since 1970. The narrowest gap between thetwo was in 1973 when the county’s per capita incomewas only $1,206 less than the state’s. Although there havebeen some ups and downs in the differential, it has ingeneral been gradually widening with its pace acceler-ated since 1978. In 1998 (the most recent figures avail-able), Spokane County’s per capita income was $23,450and Washington’s was $28,719, a difference of more than$5,000. Spokane ranked 12th out of 39 counties for PCI.
-4%
-2%
0%
2%
4%
6%
8%
10%
1971 1974 1977 1980 1983 1986 1989 1992 1995 1998
Spokane
Washington

Spokane County Profile - 31
It should be remembered that King County, with itshuge population and highly paid high-tech and aerospace
industries, is the strongest driver of the statewide aver-age. In fact, King and San Juan counties were the onlycounties to have PCIs higher than the state average.
Per capita personal income is a good measure of howpersonal income is growing relative to the population.However, it gives no indication of how income is distrib-uted among the population. To a degree, median house-hold income does that. It indicates the point in incomewhere half of all households have a higher income andhalf have a lower income. Washington State’s Office ofFinancial Management estimated the median householdincome of Spokane County to be $36,576 in 1998. Thiswas quite a bit less than the statewide average of $48,289.(However, only two counties had a median incomegreater than the statewide average: Like most other fig-ures, this one is strongly driven by the concentration ofpopulation and high income in King and Snohomishcounties.) Spokane ranked 13th among the 39 countiesfor median income.
Figure 36Per Capita IncomeSpokane, Washington, & U.S., 1970-1998Source: Bureau of Economic Analysis
$12,000
$14,000
$16,000
$18,000
$20,000
$22,000
$24,000
$26,000
$28,000
$30,000
1970 1974 1978 1982 1986 1990 1994 1998
Spokane
WashingtonU.S.
As mentioned earlier, personal income encompassesmany different types of income. All the various types,however, can be subsumed under the three broad cat-egories: earnings, transfer payments, and investment in-come. Earnings include wages, salaries, and proprietors’income; transfer payments include income maintenance,unemployment insurance, medical, and retirement pay-ments; investment income consists of interest, dividends,and rent. Figure 37 shows that the only significant dif-ference between Spokane County and Washington Statewith respect to shares of the personal income compo-nents in 1998 is for transfer payments. Interestingly, Spo-
Components of Personal Income
Figure 37Personal Income ComponentsSpokane County and Washington, 1998Source: Bureau of Economic Analysis
20%16%
71%
19%12%
72%
0%
10%
20%
30%
40%
50%
60%
70%
80%
Inv. Trans. Earn.
Spokane
Washington
Figure 38Personal Income Component TrendSpokane County, 1970-1998Source: Bureau of Economic Analysis
0%
10%
20%
30%
40%
50%
60%
70%
80%
90%
100%
1970 1974 1978 1982 1986 1990 1994 1998
Transfers
Investment
Earned
kane shows a higher percentage of transfer paymentsthan for the state, 16 percent verses 12 percent. This ispossibly due to the large number of retired veterans.
Figure 38 shows how the shares of personal incomecomponents for Spokane have changed over time, from1970 to 1998. Unlike some counties the changes havenot been dramatic. Earnings as a share of personal in-come has declined from 76 to 71 percent. The statewideearnings as a share of personal income declined from78 to 72 percent. Investment has increased from 15 to20 percent, and transfer payments have increased from13 to 16 percent.

Spokane County Profile - 32
Earnings constitute the lion’s share of personal in-come, although its share size has fallen significantly overthe last two decades. There are three types of earnings:wages and salaries, proprietors’ income, and “other la-bor income.” Other labor income includes a number oftypes but is mainly driven by employer contributions tohealth care and retirement plans. The components whichcomprise earned income are based on residence withinthe county. In addition to the three primary componentsthere is also an “adjustment for residence,” referred toas “external” income. This is the amount of incomeearned outside of the county by residents of the county,or, if the figure is negative it is the amount of moneyearned within the county by non-residents of the county.This can be a very large percentage in counties with sub-stantial numbers of commuters.
Figure 39 compares the share of each earned incomecomponent for Spokane County and Washington State in1998. As can be seen in the graph the biggest differencebetween the state and the county is the difference in “ex-ternal” income. For Spokane 4.5 percent of countyearned income ($307 million) is earned by those livingoutside of the county, while 1.6 percent of earned in-come within Washington State was earned by those work-ing outside of the state. This share has increased from .6
percent in 1970. External income can be in the form ofany of the other three components (wages and salary,proprietor’s, or other labor). As Spokane is an urbanhub surrounded by rural counties, it makes sense thatpeople would commute into Spokane for work. It issomewhat surprising that the figure is not even larger.
Figure 40 shows the change of the four earned incomecomponents for Spokane County from 1970 to 1998. Ex-ternal and other labor income have had the greatestgrowth, each increasing by 400 percent since 1970. Thepercentage of external income increased from -2.3 per-cent in 1970 to -4.5 percent in 1998. Other labor incomeincreased from a 5.2 percent to a 10 percent share of allearnings. The big increase in other labor income stemsfrom the tax advantages accruing to employers (and em-ployees) on indirect sorts of compensation.
Wages and salaries grew by 200 percent from 1970to 1998, and increased only barely from an 80.9 to 81percent share of the total. Proprietors’ income grew theleast (137 percent) and declined from 13.9 percent oftotal earnings in 1970 to 9 percent in 1998. In absolutenumbers, proprietors’ income declined from $656 mil-lion in 1993 to $531 million in 1995, before making apartial comeback to $610 million in 1998. Proprietors’income is the aggregate of all the self-employed work-ers in the county, including farmers.
Transfer payments and investment income have bothincreased by about 300 percent since 1970, while earnedincome has only increased 200 percent. Statewide, trans-fer payments and investment income increased 355 and395 percent, respectively. Earned income increased 276
percent statewide. It must be remembered that earnedincome, even though its growth has been slow comparedto the others, still has a 71 percent share of all personalincome, amounting to $6 billion in 1998.
Earned Income
Figure 39Components of Earned IncomeSpokane County & Washington, 1998Source: Bureau of Economic Analysis
81.0%
10.0% 9.0%
-4.5%
79.5%
11.2%9.3%
1.6%
-10.0%
0.0%
10.0%
20.0%
30.0%
40.0%
50.0%
60.0%
70.0%
80.0%
90.0%
W&S OL Prop Ext.
Spokane
Washington
Figure 40Trends in Earned Income ComponentsSpokane County, 1970 and 1998Source: Bureau of Economic Analysis
80.9%
5.2%13.9%
10.0%
-2.3%
81.0%
-4.5%
9.0%
-10%
0%
10%
20%
30%
40%
50%
60%
70%
80%
90%
W&S OL Prop Ext.
1970
1998

Spokane County Profile - 33
Figure 41 shows the transfer payment componentsfor Spokane County and Washington State in 1998. (Note:The total does not add up to 100 percent as veterans’benefits and other smaller components are not in-cluded for this analysis.) Previous county profiles in-cluded the medical component under retirement. But,as this component has become a significant percentageof transfer payments over time, it is now shown as a sepa-rate component. The county component shares are verysimilar to the state, except that retirement is slightly less,while medical and income maintenance are slightly more.It is interesting that retirement is a lesser share of trans-fer payments than the state, even though Spokane has ahigher percentage of persons over 65. In 1998, 12.3percent of the Spokane population was over 65 com-pared to 11.4 percent statewide.
Figure 42 shows the components of transfer paymentsfrom 1970 to 1998 for Spokane County. Medical in-creased dramatically from 15 percent of transfer pay-ments in 1970 to 35 percent in 1998. All other
Figure 41Transfer Payment ComponentsSpokane County and Washington, 1998Source: Bureau of Economic Analysis
Transfer Paymentscomponents have decreased as a share of the total overtime. Unemployment insurance decreased steadily from9 to 3 percent of the total; income maintenance from 13to 10 percent; and retirement from 47 to 41 percent.Income maintenance are those payments generallythought of as welfare. Some of the various programs areAFDC, food stamps, and general assistance.
From 1970 to 1998, medical transfer payments in-creased by 650 percent. This was followed by retirementwhich grew by 280 percent, income maintenance whichincreased by 220 percent, and unemployment insurancewhich increased by only 160 percent. Except for UI allother transfer payments had lower growth rates thanstatewide growth rates. The greatest difference was forretirement which increased 358 percent statewide. Un-employment insurance does not follow a trend like theothers but expands and contracts along with the economy,growing greatly as unemployment increases and fallingoff as it decreases. Retirement still holds the largest shareof transfer payments.
41%
10%
4%
35%
43%
9%
4%
33%
0%
5%
10%
15%
20%
25%
30%
35%
40%
45%
50%
Retire IncM UI Med
Spokane
Washington
Figure 42Transfer Payment Component TrendsSpokane County, 1970-1998Source: Bureau of Economic Analysis
0%
10%
20%
30%
40%
50%
60%
70%
80%
90%
1970 1974 1978 1982 1986 1990 1994 1998
Med.
UI
IncMaint.
Retire.

Spokane County Profile - 34
As can be seen in Figure 38, investment as a shareof total personal income has increased overtime, from15 percent in 1970 to 20 percent in 1998. At 303 per-cent total growth, investment income came in secondafter transfer payments (312 percent). The annual in-vestment growth rate has closely followed the statewidegrowth rate (see Figure 43), although it has laggedbehind from time to time, most recently in 1990. In-vestment income has had an average annual rate ofgrowth of 4.1 percent since 1970, with annual ratesranging from a high of 11.5 percent in 1989 to a low of-5.3 the very next year. The statewide average annualgrowth rate is 5.1 percent. The county average growthrate since 1994 is 5.1 percent.
Investment IncomeFigure 43Annual Investment Growth RatesSpokane County and Washington, 1971-1998Source: Bureau of Economic Analysis
-8%
-6%
-4%
-2%
0%
2%
4%
6%
8%
10%
12%
14%
1971 1974 1977 1980 1983 1986 1989 1992 1995 1998
Spokane
Washington

Spokane County Profile - 35
The Workforce Investment Act (WIA) of 1998 re-placed the Job Training Partnership Act (JTPA) of 1982on July 1, 2000. The purpose of WIA is to provide train-ing, education, and other services that prepare all indi-viduals, not just youth and unskilled adults, for currentand future jobs. It is guided by several principles: uni-versal access, individual empowerment, streamlined ser-vices, state and local flexibility, strong local role,increased accountability, and improved youth programs.It is upon this legislation that the Employment SecurityDepartment and other providers base their training andemployment service programs.
The Spokane Area Workforce Development Coun-cil (WDC) was established in accordance with the re-quirements of the Workforce Investment Act of 1998 (PL105-220) in 1999. It represents workforce area XII,which encompasses Spokane County. Each WDC is re-sponsible for strategic planning for employment andtraining related programs, oversight of the WorkSourcesystem within its specific geographic area, and servicedelivery to eligible dislocated workers, adults, and youth.The WDC is led by private business and has wide repre-sentation from labor, education, and other local organi-zations in the community. The WIA and Governor Locke’sExecutive Order 99-02 describe the functions of the WDCas follows:
� Provide input to the state Workforce DevelopmentBoard (WDB) in the development of the stateunified plan, which articulates their local strategiesand needs.
� In partnership with the local elected officials,develop and maintain a local unified plan for theworkforce development system including, but notlimited to, the local plan required by law. The WDCsubmits a unified plan to the WDB for review and tothe Governor for approval.
� Conduct oversight of the local one-stop system,including selection, certification, and de-certificationof one-stop providers.
� Promote coordination of workforce developmentactivities at the local level and ensure that they arelinked with local economic development strategies.
EMPLOYMENT SERVICES ANDECONOMIC DEVELOPMENT
Workforce Development� Establish youth councils, which are responsible for
developing portions of the local plan relating toeligible youth, as well as implement and administeryouth programs.
� Provide for a coordinated and responsive system ofoutreach to employers.
� Identify eligible providers using performancestandards established by the WDB.
� On behalf of the Governor, negotiate with localelected officials and the WDB to developperformance measures for local programs.
� Assess the planning process to identify qualityimprovements.
� Implement a partnership agreement with localelected officials that establishes the workingrelationships and specific responsibilities of eachbody in the partnership.
� Collaborate in the development of WorkFirst servicearea plans.
The Spokane Area Workforce Development Councilis located at 808 W. Spokane Falls Blvd., Room 606, CityHall, Spokane, Washington 99201. Hours of operationare 7:30 a.m. to 5:00 p.m. Telephone: (509) 625-6210.Fax: (509) 625-6929. Email: [email protected](Website address: under construction)
Spokane WorkSource Center. A WorkSource Cen-ter is a facility characterized by the provision of co-lo-cated and integrated services offered through a varietyof self-service, group, and one-on-one activities. TheCenters will provide customers one point at which toaccess programs administered by multiple agencies. Theywill offer access to all WorkSource Center system ser-vices, most of which will be available on site. However,not all services will necessarily be provided on a full-time basis. Each area will have at least one full serviceCenter. In terms of services, the Center must:
� provide all core services;� provide all required programs;� serve as a “broker” for services not available on site
such as training or support services;� provide referrals for services not provided through
the WorkSource System;

Spokane County Profile - 36
� coordinate services for customers; and� provide access to the Internet and other electronic
linkages.
The core services, which are available onsite orthrough electronic access and which are available to allcustomers (no eligibility required), include:
� initial assessment to evaluate job readiness basedon job skills, experience, aptitudes, interests,and abilities;
� job counseling to help customers determine whatservices are available and best use of theinformation;
� job referral and placement providing access toavailable jobs and posting of resumes;
� employer services that provide access to labormarket information, recruitment, screening, andreferral of qualified applicants;
� information and referral to services such as housing,food, and medical assistance;
� information on training and retraining programssuch as basic skills, literacy, occupational skillstraining, and apprenticeships;
� labor market information on current occupationalsupply and demand and occupational wages;
� computers with Internet access;� access to a telephone to file for Unemployment
Insurance benefits; and� translation services to customers in their first
language using AT&T services or the Internet.
The programs (eligibility required) include:� WIA Title I (adults, dislocated workers, youth, and
national programs)� Title V of the Older Americans Act� Veterans’ Employment Programs� Claimant Placement Program� Worker Retraining� Post Secondary Vocational-Technical Programs� Vocational Rehabilitation� Welfare to Work� Adult Basic Education Programs� ESL Programs� Worker Profiling� Migrant Farm Worker Services� NAFTA/Trade Assistance Act� HUD Employment & Training� Early Intervention services to potentially
dislocated workers� Rapid Response to plant closures� WorkFirst (employment services only)� Community Services Block Grant
The Spokane WorkSource Center is located at 130 S.Arthur. Its office hours are 8 a.m. to 5 p.m., Mondaythrough Friday. Staff can be reached by phone at (509)532-3000 or by at fax (509) 532-3082 or by e-mail:
[email protected]. The Website address iswww.workspokane.org.
Educational Facilities. Eastern Washington Uni-versity is the largest higher education institution in Spo-kane County. It is accredited by the Northwest Associationof Schools and Colleges and holds additional accredita-tion from other state and national organizations withrespect to specific professional programs (i.e., business,computer science, dental hygiene, dietetics, geology,music, nursing, physical therapy, social work, and ur-ban and regional planning).
Eastern Washington University’s 350-acre main cam-pus is 16 miles south of Spokane in Cheney. Among itsfacilities are the John F. Kennedy Memorial Library, Uni-versity Conference Center, Fine Arts Complex, Anthro-pology Museum, Speech and Hearing Clinic, DentalHygiene Clinic and Applied Physiology Lab.
There is, however, also the Eastern Washington Uni-versity Spokane Center. Spokane Center is located inSpokane’s downtown business district and is used mainlyby working adults and place-bound students. The 57,000square foot facility has 34 classrooms, a library (includ-ing the Spokane County Medical Library), computer labs,administrative and faculty offices and a number of stu-dent service facilities.
Gonzaga University was established in 1887 as adivinity school by early Jesuit missionaries to the PacificNorthwest. Originally known as Gonzaga College, theschool was renamed Gonzaga University in 1912 when itexpanded into secular studies. Today, Gonzaga Univer-sity remains a private, four-year institution of higher edu-cation affiliated with, but independent of, the RomanCatholic Church. Gonzaga University is accredited by theNorthwest Association of Schools and Colleges and holdsadditional accreditation from other organizations in re-lation to specific professional programs (e.g., law, engi-neering, teacher education, anesthesiology).
The Gonzaga University campus occupies 80 acres ofproperty along the north bank of the Spokane River. Thecampus has 39 permanent buildings, not to mention asmall lake. Among the more notable buildings are theCrosby Library (350,000 books, 2,000 periodical sub-scriptions, state/national depository), Data ProcessingCenter, Russell Theater (fine arts productions), Televi-sion Production Center (professional color facilities, FMradio station), Jepson Center (School of Business Ad-ministration), Martin Center (sports and recreation), LawSchool Library, Herak Center for Engineering, and St.Aloysius Catholic Church.

Spokane County Profile - 37
Gonzaga University has 7 schools and colleges. TheCollege of Arts and Sciences (BA degree in 30 areas, BSdegree in 5 areas), The School of Business Administra-tion (B.B.A. and MBA degrees), The School of Educa-tion (B.E. and M.E. degrees for special education orphysical education), The School of Engineering (BS de-grees for civil, electrical and mechanical engineering),The School of Law (Juris Doctorate degree), The Gradu-ate School (Master degrees as listed above as well as forDivinity) and The School of Professional Studies (BS inNursing and Bachelor of General Studies).
Whitworth College was founded in 1853 by GeorgeWhitworth on behalf of the Presbyterian Church (USA).Conceived as a Presbyterian missionary school, the Col-lege was initially established in Sumner and thenTacoma before relocating to its present-day Spokanelocation in 1914. Today, the College and its 200-acremain campus are located 15 minutes from downtownSpokane and house 40 permanent buildings including12 residence halls.
Whitworth College offers Bachelor of Arts and/or Sci-ence degrees in the following areas: Art, Biology, Busi-ness, Chemistry, computer Science, CommunicationStudies, Economics, Education, English, Geology, HealthEducation, Physical Education, History, Political Science,Mathematics, Modern Languages, Music, Nursing, Phi-losophy, Physics, Psychology, Recreation, Religion, So-ciology and Theater Arts. The College also offers a Mastersof Education degree.
The Washington State University Spokane branchcampus focuses mostly on graduate and research pro-grams in areas such as computer science, electrical andmechanical engineering, engineering management, nu-trition, materials science, and speech and hearing sciences.
Spokane Community College was created in 1963when a college transfer program was added to the Spo-kane Technical and Vocational School. The College’s 108-acre campus is located northeast of the city center nearthe industrial area. Although primarily a vocational andtechnical institute, Spokane Community College offers abroad range of liberal arts courses leading to an Associ-ate in Arts degree and possible transfer to a four-yearcollege. Among the college’s most notable programs arehealth sciences, agricultural technology, general scienceand automotive and heavy equipment training.
Originally established in 1967 as a branch of Spo-kane Community College, Spokane Falls CommunityCollege became a separate campus in 1970. The College’s113-acre campus is located on the site of the old FortWright military post just northwest of the city center. Spo-
kane Falls Community College is accredited by the North-west Association of School and Colleges and the Wash-ington State Board of Community College Education.
Spokane Falls Community College emphasizes bothliberal arts and pre-professional training. For example,it offers an Associate in Arts degree that can lead to atransfer to a four-year college. It also awards Associatein Applied Science degrees in such areas as business,broadcasting, graphic design, photography, human ser-vices, visual media, real estate, orthotics-prosthetics, etc.
The Institute for Extended Learning is an extensionof both of the aforementioned community colleges andincludes the following:
� Colville Center. Located 70 miles north ofSpokane, Colville Center enables residents of Ferry, Stevens,and Pend Oreille counties to complete their first year ofcollege study in the Colville area. The program is limited togeneral education, liberal arts, business, and secretarialstudies. An audio conference network allows some studentsin rural areas to access a limited number of courses via ateleconference system.
� Fairchild Center. Located 12 miles west of Spokaneat Fairchild Air Force Base, Fairchild Center enablesenlisted personnel (and civilians) to earn Associate in Artsdegrees from Spokane Falls Community College through itswide range of liberal arts courses. The Center also offerscourses in GED preparation, high school completion,remedial Math and English and vocational training.
� Adult Education Center. Located in downtownSpokane, the Adult Education Center has five programs thatcater to the educational needs of people 19 years of ageand older. Those programs are Adult Basic Education, AdultHigh School, English as a Second Language, GeneralEducation Development and a Reading Clinic.
� Intercollegiate Center for Nursing Education(ICNE) is a consortium school for Eastern WashingtonUniversity, Washington State University and WhitworthCollege. It offers bachelor and masters degree nursingprograms as well as continuing education courses forregistered nurses.
Riverpoint Higher Education Park. With a ribbon-cutting and dedication in April 1996, this is the newestcollege-level educational facility in the Spokane area.Located on the Spokane River adjacent to Gonzaga Uni-versity, the campus occupies 48 acres and offers upper-level coursework and awards bachelor and graduatedegrees from Eastern Washington University and Wash-ington State University-Spokane.
The just dedicated Classroom Building has 119,000square feet over three floors. With about 1,400 staff/stu-dents in 1996, the population is expected to expand to5,000 by 2010. Degrees are awarded by EWU in Busi-

Spokane County Profile - 38
ness Administration, Computer Science, Public Admin-istration, and Physical Therapy. WSU-Spokane offers de-grees in Criminal Justice, Education, Engineering, andInterdisciplinary Design, which includes architecture,landscape architecture, interior design, and construc-tion management. Both universities are planning futureofferings in the health field.
The Park also houses the Spokane IntercollegiateResearch & Technology Institute (SIRTI). This institu-tion, which was established in 1989, has 64,000 squarefeet over four floors. Its mission is to develop, manageand promote projects and programs that advance thetransfer, application, and commercialization of technol-ogy to expand the regional economy. SIRTI is an alli-ance of business and industry, higher education, andgovernment whose goal is to build sustainable economicgrowth for the regional economy and to spark innova-
together to further the business and commercial inter-ests of their respective communities. The county also hasthe Spokane Regional Convention and Visitors Bureau.
Infrastructure. An area’s infrastructure is an inte-gral part of economic development. The following areprimary elements currently in place in Spokane County.
Roads and Highways. Spokane County is well servedby an extensive network of roads and highways—a net-work that provides access to and from the city of Spo-kane at the county’s relative geographic center.
U.S. Interstate Route 90 is the county’s main thorough-fare. It stretches roughly east and west through the middleof Spokane County, strategically intersecting the city ofSpokane. Interstate 90 serves as a direct link betweenthe cities of Spokane and Seattle—and an indirect linkto major eastern Washington cities such as Yakima,Ellensburg, Richland-Kennewick-Pasco, and Moses Lake.
U.S. Routes 2 and 395 and U.S. Route 195 extendnorth and south, respectively, from Interstate 90 at Spo-kane. U.S. Routes 2 and 395 lead to counties in north-east Washington, while U.S. Route 195 leads to the citiesof Pullman and Clarkston-Lewiston.
A network of State Routes—27, 206, 290, 291, 902,and 904—and local roads tie into the larger interstateroutes to complete a relatively comprehensive transpor-tation grid across the county.
Air Transportation. Spokane County has three pub-lic airports: Spokane International Airport, Felts FieldAirport, and Deer Park Airport. It is Spokane Interna-
tion in manufacturing, biomedical, environmental, andinformation-based industries.
Riverpoint Higher Education Park is a collaborativeenterprise which includes support from both commu-nity colleges as well as Whitworth College and GonzagaUniversity. Gonzaga’s library, for example, is available tostudents at Riverpoint.
In addition to the above-mentioned local institutions,there are five other major colleges and universities inthis region. The following list includes their distancefrom Spokane.
� Washington State University, Pullman (76 miles)� Central Washington University, Ellensburg
(174 miles)� Lewis-Clark State College, Lewiston ID (135 miles)� University of Idaho, Moscow (80 miles)� North Idaho College, Coeur d’Alene (35 miles)
Spokane Area Economic Development Council.The Spokane Area EDC is the principle provider of eco-nomic development information in Spokane County. It isa nonprofit organization comprised of representativesfrom business, labor, education, and government. Theprimary purpose of the EDC is to promote quality growthand development of the regional economy. This is ac-complished by assisting local companies, through re-tention and expansion activities, and by recruiting newcompanies to the region. These activities will focus onthose business sectors that will enhance the level of newjobs and income levels for the greater Spokane area.
For more information on the Spokane County area,please contact Mark E. Turner, President, at (509) 624-9285 or Fax (509) 624-3759. Email:[email protected]. Web page address at:http://www.spokanedc.org
Chambers of Commerce. There are six Chambersof Commerce in Spokane County. They are AirwayHeights, West Plains, Deer Park, Fairfield, Spokane Re-gional, and Spokane Valley. The latter two are the largestof the six and both supply a wealth of information on theInternet. Their Internet addresses are:
Spokane Regional Chamber of Commercehttp://www.spokane.org/chamber
Spokane Valley Chamber of Commercehttp://www.svcc.org
Chambers of Commerce are groups of local businessestablishments and other interested parties who work
Economic Development

Spokane County Profile - 39
tional Airport, however, that sets Spokane County apartfrom other counties in eastern Washington in the area ofair transportation.
Spokane International Airport is a regional hub forair passengers throughout eastern Washington, north-ern Idaho and western Montana. The airport’s 9,000 footand 8,200 foot runways accommodate jets as large asBoeing 747s, allowing the airport to be served by carri-ers such as Alaska Airlines, America West Express, DeltaAirlines, Horizon Air, Northwest Airlines, Southwest Air-lines, United Airlines and other smaller carriers. A ma-jor expansion that resulted in the construction of a newcommuter terminal was competed and opened in No-vember 2000. The airport also has engine repair, fuel-ing, and hanger services. More information on theSpokane International Airport is available at http://www.spokane.org
Felts Field is a general aviation airport with runwaysof 4,500 feet and 3,062 feet that accommodate up to300 aircraft including corporate aircraft and helicop-ters. The airport is also a center for Washington StateCommunity College system’s aviation school and severalprivate aviation schools. Airport activities include smallpackage cargo, medical airlifts (helicopter) and avia-tion services.
Deer Park is a general aviation airport with a 6,100 footrunway that accommodates aircraft as large as DC-3s.
Rail Service. Burlington Northern Railroad and UnionPacific Railroad operate in Spokane County with 73 and10 active spurs, respectively. Both ship general freightand commodities.