splash screen
DESCRIPTION
Splash Screen. Five-Minute Check (over Lesson 7–5) Main Idea and Vocabulary Example 1:Make Predictions Using Proportions Example 2:Make Predictions Using Proportions. Lesson Menu. Predict the actions of a larger group using a sample. survey. population sample. Main Idea/Vocabulary. - PowerPoint PPT PresentationTRANSCRIPT

Five-Minute Check (over Lesson 7–5)
Main Idea and Vocabulary
Example 1:Make Predictions Using Proportions
Example 2:Make Predictions Using Proportions
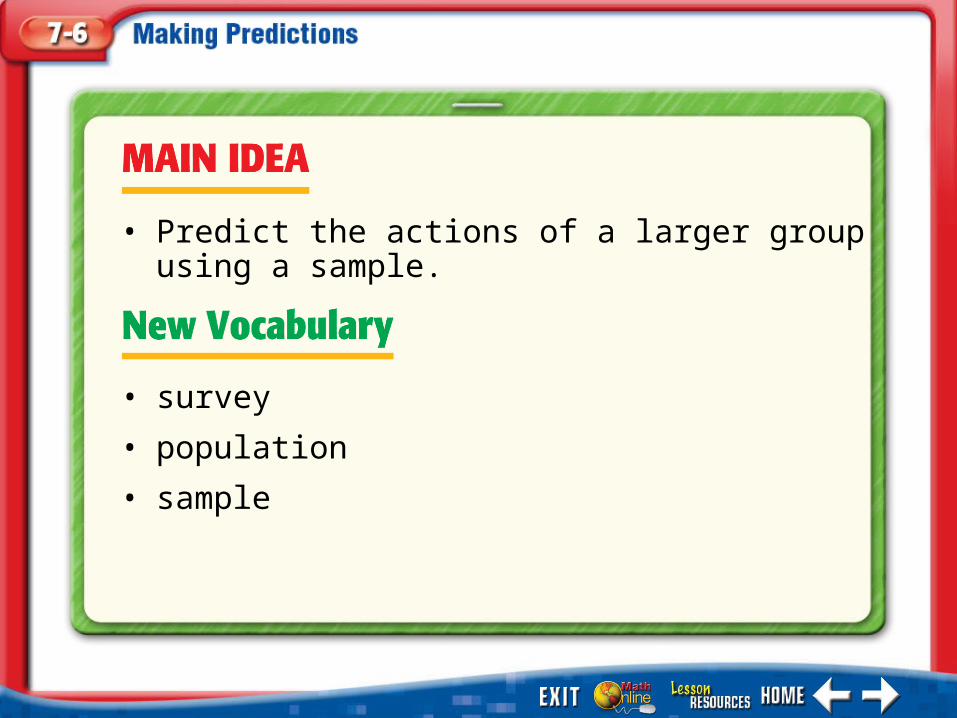
• survey
• population
• sample
• Predict the actions of a larger group using a sample.
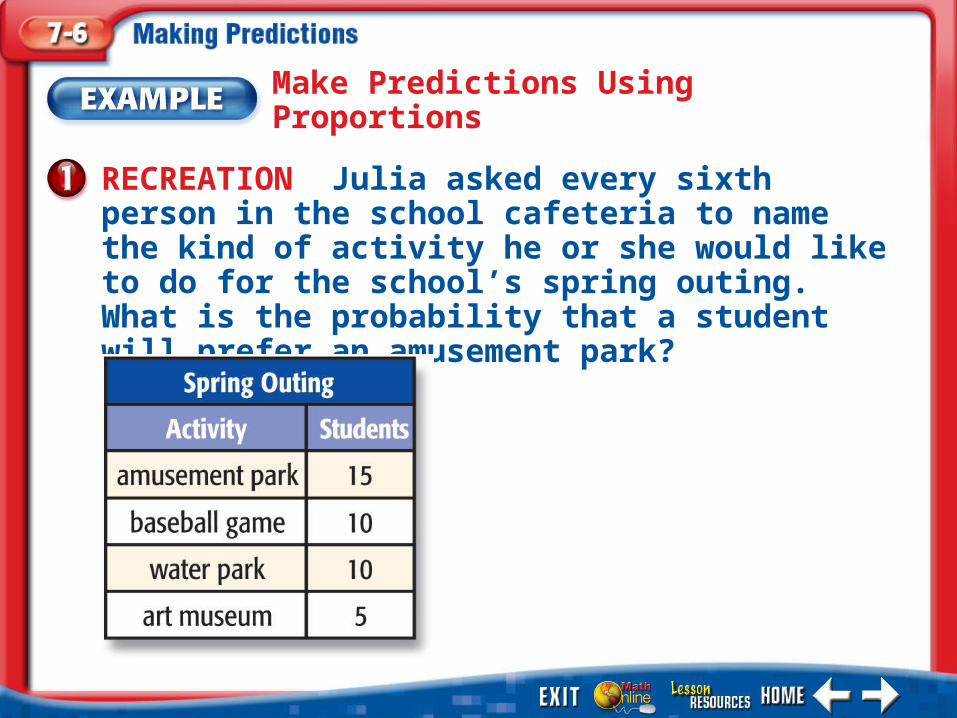
Make Predictions Using Proportions
RECREATION Julia asked every sixth person in the school cafeteria to name the kind of activity he or she would like to do for the school’s spring outing. What is the probability that a student will prefer an amusement park?

Make Predictions Using Proportions

1. A
2. B
3. C
4. D0% 0%0%0%
HOCKEY Kyle asked every third hockey player in his league what type of snack they prefer to have after a hockey game. What is the probability that a hockey player will prefer cookies for their snack?
A.
B.
C.
D.

Make Predictions Using Proportions
RECREATION Julia asked every sixth person in the school cafeteria to name the kind of activity he or she would like to do for the school’s spring outing. There are 408 students at Julia’s school. Predict how many students prefer going to an amusement park.

Make Predictions Using Proportions
Let a represent the number of students who prefer an amusement park.
×51
×51
Write a proportion.

Make Predictions Using Proportions
Answer: Of the 408 students, about 153 will prefer going to an amusement park.

1. A
2. B
3. C
4. D
0% 0%0%0%
A. 10 players
B. 12 players
C. 30 players
D. 32 players
HOCKEY Kyle asked every third hockey player in his league what type of snack they prefer to have after a hockey game. There are 128 hockey players in Kyle’s league. Predict how many of the hockey players prefer cookies for their snack after a game.
End of the Lesson

Five-Minute Check (over Lesson 7–5)
Image Bank
Math Tools
Animation Menu
Probability and Area

7-2 Circle Graphs
7-8 Estimating With Percents

1. A
2. B
3. C
4. D0% 0%0%0%
A. 9 ways; FBB, FSS, FSB, BFF, BSS, BFS, SFF, SBB, SBF
B. 6 ways; FBS, FSB, BFS, BSF,SFB, SBF
C. 4 ways; FBS, BFS, SFB, SBF
D. 3 ways; FSB, BSF, SBF
Trevor has a football trophy, a basketball trophy, and a spelling bee trophy. Make an organized list to show how many ways Trevor can arrange the trophies on a shelf.
(over Lesson 7-5)

1. A
2. B
3. C
4. D
0% 0%0%0%
Which choice shows the tree diagram for diamonds or glass with gold, silver, or platinum?
(over Lesson 7-5)
A. B.
C. D.

1. A
2. B
3. C
4. D0% 0%0%0%
A. 8
B. 10
C. 15
D. 35
How many different three-card hands are possible with a deck of five cards?
(over Lesson 7-5)
