spire cleanliness plan - university of...
TRANSCRIPT

SUBJECT: SPIRE Cleanliness Plan
PREPARED BY: Bruce Swinyard
DOCUMENT No: SPIRE-RAL-PRJ-1070
ISSUE: 1.0 Date: 9 January 2002
CHECKED BY: David Smith – AIV Manager Marc Ferlet – Optical Systems Eric Clark – Product Assurance
Date:
APPROVED BY: Eric Sawyer – Project Manager Date:

Ref: SPIRE-RAL-PRJ-1070
Issue: 1.0 Date: 9 January 2002 Page: 2 of 28
Project Document
SPIRE SPIRE Cleanliness Plan
Distribution
All Subsystem Managers (for internal distribution as appropriate) John Delderfield RAL Ken King RAL Eric Sawyer RAL David Smith RAL Marc Ferlet RAL Eric Clark RAL
Ref: SPIRE-RAL-PRJ-1070
Issue: 1.0 Date: 9 January 2002 Page: 3 of 28
Project Document
SPIRE SPIRE Cleanliness Plan
CChhaannggee RReeccoorrdd
ISSUE DATE 1.0 January 2002 New Document

Ref: SPIRE-RAL-PRJ-1070
Issue: 1.0 Date: 9 January 2002 Page: 4 of 28
Project Document
SPIRE SPIRE Cleanliness Plan
Table of Contents 1. Introduction .................................................................................................................................... 7 2. Overall Particulate Budget ............................................................................................................. 7 3. Effective and Geometrical Obscuration Ratio ............................................................................... 8 4. Particulate Exposure During Phases of Instrument AIV.............................................................. 10 5. Allocation of particulate budget for instrument integration......................................................... 11
5.1 Structure during metrology....................................................................................................... 11 5.2 Structure, Mirrors and optical components during integration and optical alignment............. 12 5.3 Other sub-systems during integration....................................................................................... 12 5.4 Outside of closed FPU; JFETs and JFET/FPU harnesses during all AIV procedures ............. 12
6. Total Sub-system Particulate Cleanliness Budgets ...................................................................... 14 7. Molecular Contamination............................................................................................................. 15
7.1 Working Assumptions .............................................................................................................. 15 7.2 Contamination Requirements ................................................................................................... 15 7.3 Molecular Contamination Budgets ........................................................................................... 16 7.4 Contamination Control Philosophy .......................................................................................... 16
Appendix A: SPIRE Contamination Risk Analysis. .............................................................................. 18 Appendix B: Effect of Particulate Contamination on SPIRE Mirror Performance at 200 µm............... 21 Appendix C: Short note (simulation report) on particle contamination levels estimation for SPIRE.... 26

Ref: SPIRE-RAL-PRJ-1070
Issue: 1.0 Date: 9 January 2002 Page: 5 of 28
Project Document
SPIRE SPIRE Cleanliness Plan
Glossary SPIRE Spectral and Photometric Imaging REceiver BOL Beginning of life EOL End of life PPM Parts per million

Ref: SPIRE-RAL-PRJ-1070
Issue: 1.0 Date: 9 January 2002 Page: 6 of 28
Project Document
SPIRE SPIRE Cleanliness Plan
References
Applicable Documents AD1 SPIRE PA Plan SPIRE-RAL-PRJ-000017 AD2 SPIRE Instrument AIV Plan SPIRE-RAL-PRJ-000410 Reference Documents RD1
“Scattering in sub-mm range by dust on reflectors and its consequences in the caes of the Planck telescope.” ESA memorandum 170500/EEA/PDM
RD2 “Practical significance of dust contamination scattering effect” ESA memorandum 270700/EEA/PDM
RD3 ESA PSS-01-204

Ref: SPIRE-RAL-PRJ-1070
Issue: 1.0 Date: 9 January 2002 Page: 7 of 28
Project Document
SPIRE SPIRE Cleanliness Plan
1. INTRODUCTION This document is based on and incorporates two previous notes on the risk of contamination for the SPIRE instrument (appendix A) and the effect of particulate contamination on the effective area of the optical components in the SPIRE instrument (appendix B). The SPIRE PA plan has, to some extent, taken these into account (see appendix B of AD1), this document replaces the appropriate section in the PA plan and will become a reference document to the PA Plan. In this document all these issues are brought together the requirements on the sub-systems are expressed in terms of an allocation in the standard ESA Parts Per Million (ppm – see RD3) at delivery to RAL.
2. OVERALL PARTICULATE BUDGET The total loss through the optical chain due to particulate contamination should be kept as low as practicable. At present the specification for the Herschel telescope is that the BOL obscuration for the telescope surfaces is 5000 ppm; essentially equivalent to 0.5% loss in reflectivity. Nominally this is per surface (so 1% loss total) however it is highly unlikely that the secondary will suffer the same level of contamination and we can therefore assume the total loss will be 0.5% total for the telescope. For the purposes of setting the instrument budget we will adopt a policy of having no more loss than the telescope mirrors – i.e. the throughput loss due to contamination of the mirrors shall be no more than 0.5%. As well as the total throughput loss there will also be an increased emissivity associated with the particulate contamination. SPIRE assumes a conservative figure for the telescope emissivity (0.04) and so we have already effectively factored in the increase due to contamination. For the instrument level budget we ignore the increase in emissivity as all our mirrors are at <6 K and will therefore not contribute to the photon background on the detectors. One other consideration has to be borne in mind when setting the particulate contamination budget and that is the increase in the side lobes caused by scattering. Again this is considered non-critical for SPIRE at the likely level that 5000 ppm will induce. Using the equations in appendix B it is shown that for the mirrors if we wish to keep the loss due to particulate contamination to below 0.5%, then the maximum exposure time in a given clean room environment is as given in table 1. In fact there is an error in the reasoning in appendix B as here the 0.5% loss was applied per mirror – in fact this would give an overall loss for 10 mirrors of 1.0-0.99510=0.05 – a total throughput loss of 5% - unacceptable. In fact the loss per mirror should be 0.05% to give the total throughput loss of 0.5%. Table 1b shows the total exposure times to achieve Aeff = 0.9995 for the four cleanroom classes. The effective area reduction per mirror can be translated directly into an effective obscuration ratio expressed in parts per million as described in the introduction. The total, time integrated, budget for the optical surfaces at the beginning of in-flight operations is therefore 500 ppm and will be used to inform the distribution of the cleanliness budget between the various FPU sub-systems and integration procedures.

Ref: SPIRE-RAL-PRJ-1070
Issue: 1.0 Date: 9 January 2002 Page: 8 of 28
Project Document
SPIRE SPIRE Cleanliness Plan
Cleanroom Class Approximate Exposure Time for Αeff=0.995
100 100 1000 40 10000 15
100000 7 Tabel 1a: Exposure limits to achieve 0.5% effective area loss at 200 µµµµm wavelength from
appendix B
Table 1b: Modelled exposure limits to achieve 0.05% effective area loss at 200 µµµµm
wavelength – see figure 1
3. EFFECTIVE AND GEOMETRICAL OBSCURATION RATIO While the effective area or obscuration ratio is the most useful measure for the instrument performance, it is not in accordance with the ESA definition which is strictly based on geometrical coverage. In PSS-01-204 the acceptable obscuration factor per day is given for different classes of cleanroom – these figures are given in table 2. It should be noted that these figures are not what will actually be achieved in the given class of clean, merely what is acceptable under a given set of measurement conditions for that class of clean room. With a naïve interpretation of the ESA specification it would seem that with this definition of geometrical obscuration ratio we would achieve 150 ppm total on the mirrors if they were exposed in a class 100 cleanroom for 100 days. Contrast this with the calculated value of the effective obscuration ratio of 5000 ppm! Either there is some discrepancy between the model for fallout and the acceptance limits or the effective area of the particles is very much higher than the geometrical area.
Cleanroom Class ESA acceptance level in ppm/day
100 1.5 1000 12 10000 60
100000 225 Table 2: ESA PSS-01-204 acceptance limits for different classes of cleanroom
Using the equations in appendix B* we can calculate as a function of exposure time in a given cleanroom both the effective obscuration ratio – i.e. including the effect of the particle extinction at a given wavelength, and the straightforward geometrical obscuration ratio. These are shown in figure 1. Also shown in figure 1 are the 500 ppm and 5000 ppm limits and the extrapolated obscuration ratios from the PSS-01-204 acceptance limits. * See also appendix C where Marc Ferlet the original author of the work has run a more sophisticated analysis that comes to essentially the same conclusion
Cleanroom Class Approximate Exposure Time for Aeff=0.9995
100 30 1000 13
10000 7 100000 3

Ref: SPIRE-RAL-PRJ-1070
Issue: 1.0 Date: 9 January 2002 Page: 9 of 28
Project Document
SPIRE SPIRE Cleanliness Plan
Some interesting points arise from inspection of figure 1:
1. The effective obscuration ratio is always smaller than the geometrical one at this wavelength.
2. The effective and geometrical obscuration ratios become equivalent after a sufficiently long time in any cleanroom equating to the situation where the surface density of larger particles is great enough that thes ebegin to dominate the scattering losses.
3. One would expect the ESA standard ppm/day factor to agree with the model prediction for the geometrical obscuration at least at the 1 day point on the x-axis – in fact the model is about a factor of 2 higher for each cleanroom case. However, I have used a very pessimistic cleanroom “activity factor” of 1 as compared to the standard factor of ≤0.5 so the model is in fact in agreement with the standard over short time durations.
4. The model predicts a very non-linear increase in the obsuration ratio for all cleanroom classes for both the effective and geometrical obscuration ratios it appears to imply that extrapolating the ESA standard factor beyond a few days leads to a very over optimistic prediction of the cleanliness.
Figure 1: Model prediction of obscuration ratio (OR) as a function of exposure time in four different cleanroom classes – green 100; red 1000; maroon 10000 and purple 100000. The solid coloured lines are the effective OR the dashed lines the geometrical OR. The dotted black lines are the extrapolated
OR versus time from the exposure limits given in PSS-01-204. The solid horizontal lines represent 500 ppm and 5000 ppm respectively.
I conclude from this that it is unsafe to use the projections from PSS-01-204 for setting the exposure limits for SPIRE and the model results given in table 1b are preferred albeit that they represent perhaps a conservatively lower limit on the exposure times – see discussion below.
Ref: SPIRE-RAL-PRJ-1070
Issue: 1.0 Date: 9 January 2002 Page: 10 of 28
Project Document
SPIRE SPIRE Cleanliness Plan
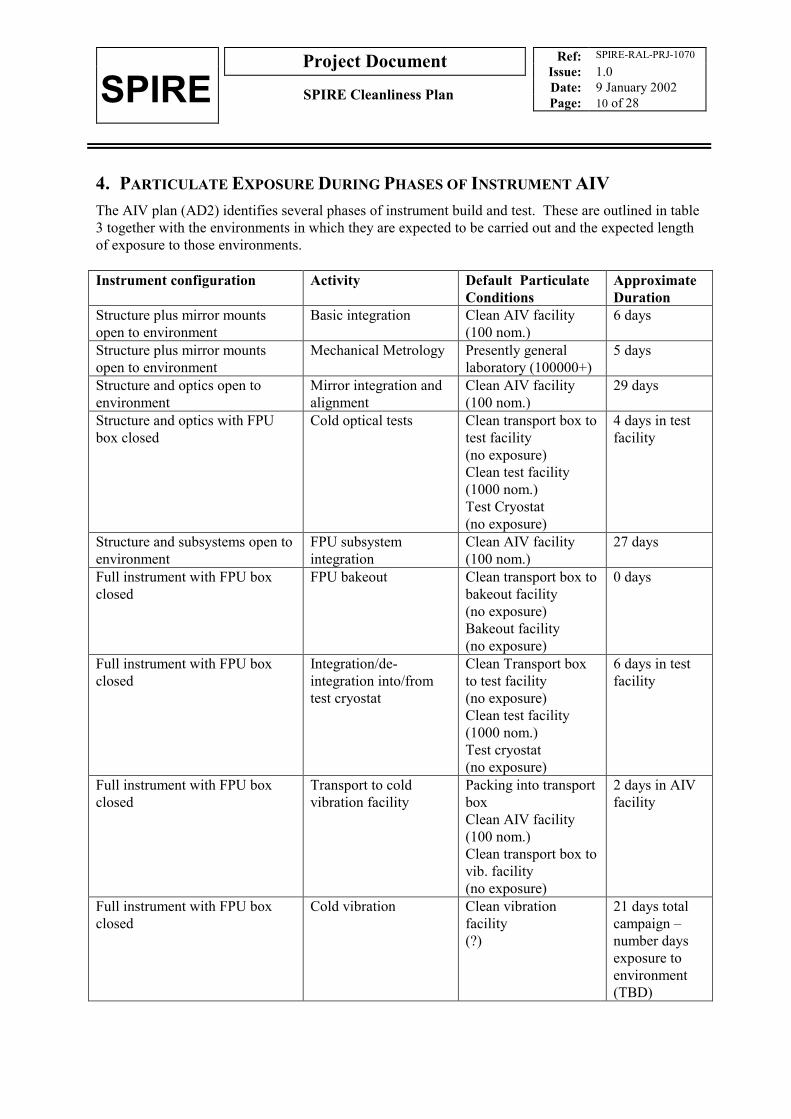
4. PARTICULATE EXPOSURE DURING PHASES OF INSTRUMENT AIV The AIV plan (AD2) identifies several phases of instrument build and test. These are outlined in table 3 together with the environments in which they are expected to be carried out and the expected length of exposure to those environments. Instrument configuration Activity Default Particulate
Conditions Approximate Duration
Structure plus mirror mounts open to environment
Basic integration Clean AIV facility (100 nom.)
6 days
Structure plus mirror mounts open to environment
Mechanical Metrology Presently general laboratory (100000+)
5 days
Structure and optics open to environment
Mirror integration and alignment
Clean AIV facility (100 nom.)
29 days
Structure and optics with FPU box closed
Cold optical tests Clean transport box to test facility (no exposure) Clean test facility (1000 nom.) Test Cryostat (no exposure)
4 days in test facility
Structure and subsystems open to environment
FPU subsystem integration
Clean AIV facility (100 nom.)
27 days
Full instrument with FPU box closed
FPU bakeout Clean transport box to bakeout facility (no exposure) Bakeout facility (no exposure)
0 days
Full instrument with FPU box closed
Integration/de-integration into/from test cryostat
Clean Transport box to test facility (no exposure) Clean test facility (1000 nom.) Test cryostat (no exposure)
6 days in test facility
Full instrument with FPU box closed
Transport to cold vibration facility
Packing into transport box Clean AIV facility (100 nom.) Clean transport box to vib. facility (no exposure)
2 days in AIV facility
Full instrument with FPU box closed
Cold vibration Clean vibration facility (?)
21 days total campaign – number days exposure to environment (TBD)

Ref: SPIRE-RAL-PRJ-1070
Issue: 1.0 Date: 9 January 2002 Page: 11 of 28
Project Document
SPIRE SPIRE Cleanliness Plan
Instrument configuration Activity Default Particulate Conditions
Approximate Duration
Full instrument with FPU box closed
Transport to cold vibration facility
Packing into transport box Clean vibration facility (?) Clean transport box to RAL (no exposure)
2 days
Full instrument with FPU box closed
Integration/de-integration into/from test cryostat
Clean test facility (1000 nom.) Test cryostat (no exposure)
6 days in test facility
Full instrument with FPU box closed
Transport to system level integration facility
Packing into transport box Clean AIV facility (100 nom.) Clean transport box to vib. facility (no exposure)
2 days
Full instrument with FPU box closed
System level AIV including integration into payload module
Clean AIV facility (100 ?) Herschel payload module (no exposure)
Many days
Table 3: Instrument AIV activities and particulate exposure times.
5. ALLOCATION OF PARTICULATE BUDGET FOR INSTRUMENT INTEGRATION
5.1 Structure during metrology This represents the “dirtiest” environment the inside of the instrument will experience. We should assume that the structure only experiences the full environment for 50% of the actual elapsed time the procedure takes – i.e. it is bagged or covered during non-working periods – but that the activity factor is high during the process itself. The true exposure to the class 100000 environment will therefore be equivalent to 3 days with an activity factor of 1 – we can see from figure 1 that this amounts to 500 ppm. Whilst the structure does not directly influence the performance of the optics we could take the precautionary approach that we are “only as clean as the dirtiest part” in which case this will use the whole of the structure budget. To ensure that the instrument remains within budget for the rest of the AIV programme we will inspect and clean the structure and covers after metrology to return it to at least the state at delivery. Witness samples will also travel with the structure and will be exposed during the metrology procedures. These will be used to check the cleanliness state of the structure on return to the clean AIV facility.

Ref: SPIRE-RAL-PRJ-1070
Issue: 1.0 Date: 9 January 2002 Page: 12 of 28
Project Document
SPIRE SPIRE Cleanliness Plan
5.2 Structure, Mirrors and optical components during integration and optical alignment Inspection of table 3 shows that the internal optical components (mirrors plus mounts and structure) of SPIRE will be exposed to a class 100 environment for a maximum of 72 days actual activity. In fact it is unlikely that any one component will experience this environment for all of that time and at least 50% of this time the components will be covered as only single shift working is envisaged. The absolute maximum expected obscuration ratio at the end of the integration for any one mirror will therefore be the equivalent of 36 days or from figure 1 700 ppm. We can expect a further reduction of this due to the pessimistic assumptions that went into figure one. Using an “activity factor” of 0.5 rather than 1 reduces the exposure to about 375 ppm (see figure 2) – we will take this as the budget for the mirrors and optics during integration. We will inspect the mirrors and witness samples after integration to check the cleanliness state. If necessary we will clean the mirrors and optical components using a dry nitrogen gas line or similar.
5.3 Other sub-systems during integration Here the exposure will be less as the integration takes place over a total time of about 27 working days and each individual sub-system is not necessarily exposed for all this time. Taking the same factor of 50% true exposure time and the activity factor of 0.5 as for the mirrors we can see that the maximum exposure for any one sub-system after 27 days activity, equivalent to 13.5 days exposure, will be 60 ppm. Note this will in principle include the JFETs and the JFET to BDA harnesses.
5.4 Outside of closed FPU; JFETs and JFET/FPU harnesses during all AIV procedures We assume that the outside of the FPU box will, following metrology and subsequent cleaning, be subject to the same exposure as the inside for integration and alignment, i.e. 375 ppm. It will spend an elapsed time of about 16 working days in the class 1000 test facility at RAL. Taking the 50% true exposure factor and the activity factor of 0.5 this amounts to an additional ~65 ppm, negligible. The unknown situation is what happens at the cryogenic vibration facility. Once again we will ship the FPU and JFET boxes with witness mirrors that will remain with the units during vibration. On return to RAL they will be inspected and the outside of the units cleaned if necessary, The Herschel system requirement for units in the cryostat is to have a cleanliness of no more than 300 ppm on delivery (minutes of contamination control working group PT-9144). As it stands we will be just outside this limit for the FPU; JFET units and JFET/FPU harnesses after our AIV programme. We will, therefore, inspect and clean these items before shipping. It is assumed that once the FPU has been closed no particulates can enter or escape from the subsystems inside the covers. However the shutter is mounted externally to the covers so it too will be subject to inspection and cleaning.

Ref: SPIRE-RAL-PRJ-1070
Issue: 1.0 Date: 9 January 2002 Page: 13 of 28
Project Document
SPIRE SPIRE Cleanliness Plan
Figure 2: Model obscuration ratio versus exposure time in cleanroom classes as shown in figure 1. Here the “activity factor” has been reduced from 1 to a more realistic 0.5. Note the much better agreement between the ESA standard figures (black dashed lines) and the model for short exposure durations.

Ref: SPIRE-RAL-PRJ-1070
Issue: 1.0 Date: 9 January 2002 Page: 14 of 28
Project Document
SPIRE SPIRE Cleanliness Plan
6. TOTAL SUB-SYSTEM PARTICULATE CLEANLINESS BUDGETS Table 5 gives the budgetary breakdown for the FPU subsystems making up the total 500 ppm requirement for subsystems within the FPU covers and the 300 ppm external cleanliness requirement demanded by ESA.
Subsystem Stage in Programme
Budget Total
Delivery <1000 ppm (will be cleaned after metrology anyway)
N/A
Metrology 500 ppm Then cleaned to give <125 ppm (TBC)
125 ppm
Structure; covers; mirror mounts etc inside FPU
Integration and alignment
375 ppm 500 ppm
Delivery <125 ppm 125 ppm Mirrors and filters Integration and alignment
375 ppm 500 ppm
Delivery <440 ppm 440 ppm FPU subsystems inside covers Integration 60 ppm 500 ppm
Delivery <500 ppm (They will be cleaned anyway after the AIV programme this to ensure they don’t contaminate internal subsystems)
N/A Subsystems outside covers (Shutter)
AIV Programme
375 ppm Then cleaned to give <300 ppm for delivery to ESA
300 ppm
Delivery <1000 ppm (will be cleaned during AIV programme)
N/A Outside of instrument FPU and JFET units
AIV Programme (Total)
500 ppm Then cleaned to give <300ppm for delivery to ESA
300 ppm
Table 5: Particulate cleanliness budgets for SPIRE sub-systems

Ref: SPIRE-RAL-PRJ-1070
Issue: 1.0 Date: 9 January 2002 Page: 15 of 28
Project Document
SPIRE SPIRE Cleanliness Plan
7. MOLECULAR CONTAMINATION
7.1 Working Assumptions We can make the following assumptions about the molecular contamination in the context of SPIRE:
1. The only components that are susceptible to molecular contamination are the mirrors; optical filters and the bolometer elements of the detector arrays.
2. The major contaminant is likely to be water ice and any other contaminant can be represented as water ice.
3. In all circumstances the structure of the SPIRE instrument will cool first and act as point of “first pumping” within the instrument box.
4. The instrument box will have been placed under vacuum for a sufficient time to allow all surfaces to outgas, and the products to be expelled from the box, before cool down commences. This should be no more than 3-4 hours.
7.2 Contamination Requirements An analysis has been carried out using the MathCad worksheet written by Nick Whyborn (appendix D) for calculating the effect of water ice on the transmission and reflectivity of optical components in the sub-millimetre. This shows that we can stand up 50 microns of water ice on the SPIRE mirrors before there is a significant degradation in the performance. The optical filters are made from 100 µm thick polypropylene and further layers of water ice on top on this will not affect the filter performance. The exception are the dichroics which may be constructed in a similar manner to the HIFI polariser grids with 2.5 µm mylar sheets as the substrate. Here only up to 0.5 µm ice may be tolerated before the performance begins to suffer significantly. However a development program is ongoing for these components and it is hoped to replace them with polypropylene components thus removing the stricter contamination requirement. For safety we will impose the stricter requirement on these components and in the environs of the detector boxes. The detectors themselves have not been shown to be sensitive to molecular contamination and no special care is taken over these components when they are used in, for instance, ground based or balloon experiments. However a precautionary approach will be adopted and a general requirement will be set for no more than 0.5 µm water ice contamination on all components in the sealed detector box environment at beginning of the instrument AIV.

Ref: SPIRE-RAL-PRJ-1070
Issue: 1.0 Date: 9 January 2002 Page: 16 of 28
Project Document
SPIRE SPIRE Cleanliness Plan
7.3 Molecular Contamination Budgets These general requirements lead to the beginning of life (i.e. on delivery) and end of life budgets set out in table 6.
Subsystem Stage in Programme
Budget
Subsystem Delivery
1x10⁻⁵ g cm –2
Instrument Delivery 5 x10⁻⁵ g cm-2
Detectors
EOL 1x10⁻⁴ g cm-2
Subsystem Delivery
1x10⁻⁵ g cm –2
Instrument Delivery 5 x10⁻⁵ g cm-2
Filters; Dichroics and mirrors in detector boxes
EOL 1x10⁻⁴ g cm-2
Subsystem Delivery
1x10⁻⁵ g cm –2
Instrument Delivery 5 x10⁻⁵ g cm-2
Structure and sub-systems in detector boxes
EOL 1x10⁻⁴ g cm-2
Subsystem Delivery
1x10⁻⁴ g cm –2
Instrument Delivery 5 x10⁻⁴ g cm-2
Structure; covers; mirror mounts etc inside FPU
EOL 1x10⁻³ g cm-2
Subsystem Delivery
1x10⁻⁴ g cm –2
Instrument Delivery 5 x10⁻⁴ g cm-2
Mirrors and filters in main FPU
EOL 1x10⁻³ g cm-2
Subsystem Delivery
1x10⁻⁴ g cm –2
Instrument Delivery 5 x10⁻⁴ g cm-2
FPU subsystems inside covers
EOL 1x10⁻³ g cm-2
Subsystem Delivery
1x10⁻⁵ g cm –2
Instrument Delivery 5 x10⁻⁵ g cm-2
Subsystems outside covers (Shutter)
EOL 1x10⁻⁴ g cm-2
Subsystem Delivery
1x10⁻⁵ g cm –2
Instrument Delivery 5 x10⁻⁵ g cm-2
Outside of instrument FPU and JFET units
EOL 1x10⁻⁴ g cm-2
Table 6: Contamination budgets for sub-systems in SPIRE
7.4 Contamination Control Philosophy These budgets are very loose by comparison to normal space instrumentation standards. Essentially the only requirement on the sub-systems is to clean the parts before assembly; assemble the sub-system

Ref: SPIRE-RAL-PRJ-1070
Issue: 1.0 Date: 9 January 2002 Page: 17 of 28
Project Document
SPIRE SPIRE Cleanliness Plan
under humidity controlled conditions and to then keep the assembled sub-system in a controlled environment. The detectors, perhaps the most sensitive sub-system, are essentially sealed against ingress of molecular contaminant with only low conductivity pumping paths. Thus when the instrument has been pumped down it is extremely unlikely that any molecular contamination could reach them from the SPIRE instrument and it is virtually impossible for any external contamination to reach them. The nature of the detector technology makes the use of clean handling and assembly conditions a necessity during detector build so they will be built and delivered clean. The instrument level AIV programme will anyway observe standard clean facilities (class 100 for optics; class 1000 for the instrument when assembled) and procedures for all phases of the AIV to keep the within particulate budget. It can be assumed that the molecular contamination under such circumstances will also be commensurate with the standard cleanroom class budgets and there will provide witness measurements at all stages of the instrument AIV.
Ref:
SPIRE-R
AL-PR
J-1070
Issue: 1.0
Date:
9 January 2002 Page:
18 of 28
Project Docum
ent SPIR
E
SPIRE C
leanliness Plan
APPEN
DIX
A: SPIR
E C
ON
TAM
INA
TION
RISK
AN
ALY
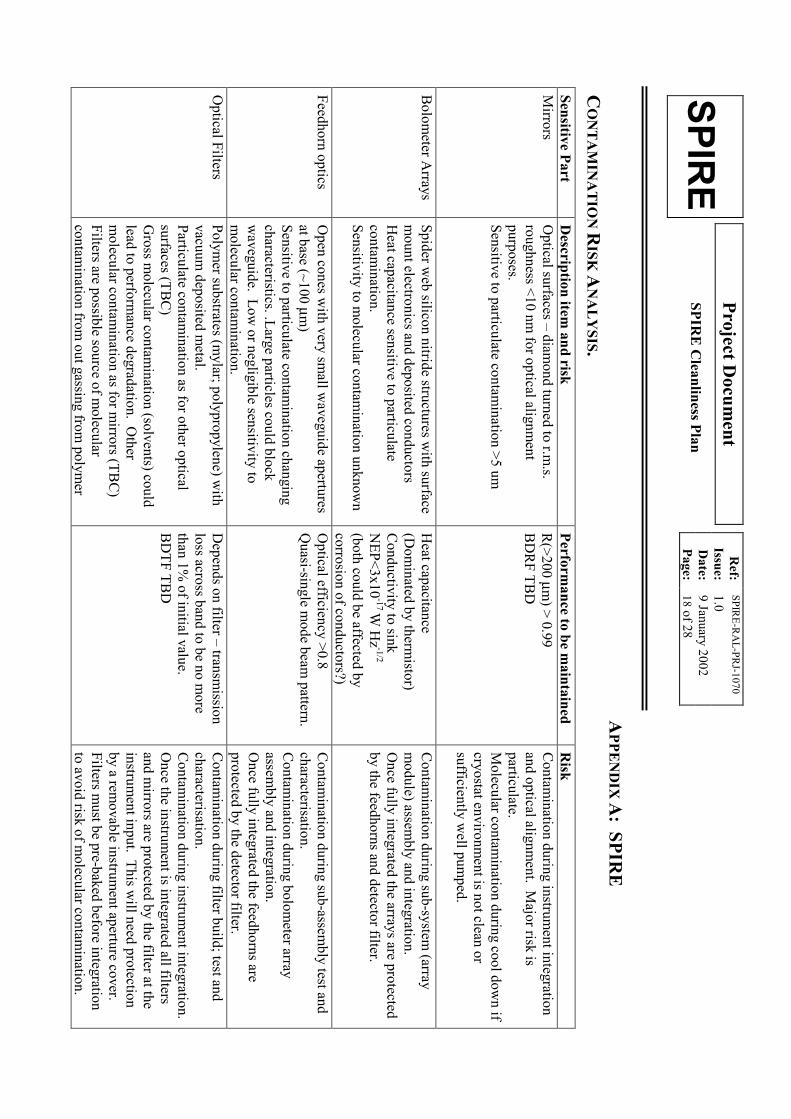
SIS. Sensitive Part
Description item
and risk Perform
ance to be maintained
Risk
Mirrors
Optical surfaces – diam
ond turned to r.m.s.
roughness <10 nm for optical alignm
ent purposes. Sensitive to particulate contam
ination >5 um
R(>200 µm
) > 0.99 B
DR
F TBD
C
ontamination during instrum
ent integration and optical alignm
ent. Major risk is
particulate. M
olecular contamination during cool dow
n if cryostat environm
ent is not clean or sufficiently w
ell pumped.
B
olometer A
rrays Spider w
eb silicon nitride structures with surface
mount electronics and deposited conductors
Heat capacitance sensitive to particulate
contamination.
Sensitivity to molecular contam
ination unknown
Heat capacitance
(Dom
inated by thermistor)
Conductivity to sink
NEP<3x10
-17 W H
z-1/2
(both could be affected by corrosion of conductors?)
Contam
ination during sub-system (array
module) assem
bly and integration. O
nce fully integrated the arrays are protected by the feedhorns and detector filter.
Feedhorn optics O
pen cones with very sm
all waveguide apertures
at base (~100 µm)
Sensitive to particulate contamination changing
characteristics. .Large particles could block w
aveguide. Low or negligible sensitivity to
molecular contam
ination.
Optical efficiency >0.8
Quasi-single m
ode beam pattern.
Contam
ination during sub-assembly test and
characterisation. C
ontamination during bolom
eter array assem
bly and integration. O
nce fully integrated the feedhorns are protected by the detector filter.
Optical Filters
Polymer substrates (m
ylar; polypropylene) with
vacuum deposited m
etal. Particulate contam
ination as for other optical surfaces (TB
C)
Gross m
olecular contamination (solvents) could
lead to performance degradation. O
ther m
olecular contamination as for m
irrors (TBC
) Filters are possible source of m
olecular contam
ination from out gassing from
polymer
Depends on filter – transm
ission loss across band to be no m
ore than 1%
of initial value. B
DTF TB
D
Contam
ination during filter build; test and characterisation. C
ontamination during instrum
ent integration. O
nce the instrument is integrated all filters
and mirrors are protected by the filter at the
instrument input. This w
ill need protection by a rem
ovable instrument aperture cover.
Filters must be pre-baked before integration
to avoid risk of molecular contam
ination.

Ref:
SPIRE-R
AL-PR
J-1070
Issue: 1.0
Date:
9 January 2002 Page:
19 of 28
Project Docum
ent SPIR
E
SPIRE C
leanliness Plan
substrates. SM
EC (FTS m
irror m
echanism)
Mechanical parts no or very low
susceptibility. O
ptical encoder may be sensitive to particulate
contamination (increased scattering?) or
molecular contam
ination. Freezing of H2 O
or other m
olecular species on detector/grating elem
ents much m
ore serious as they work in 400-
700 nm band.
Roof top m
irrors as per mirrors above.
Signal from optical encoder m
ust be >TB
D. C
ontrast in fringes from
optical encoder >TBD
R
oof tops must have R
>0.99
Contam
ination during sub-system assem
bly; integration and verification. A
ll parts always
exposed? C
ontamination during instrum
ent assembly
and integration. Once the instrum
ent is integrated the SM
EC is protected by input
filter. M
olecular contamination during cool dow
n if cryostat environm
ent is not clean or sufficiently w
ell pumped.
BSM
Mechanism
M
echanical parts have no or very low
susceptibility M
irror as per mirrors above
R>0.99
As for SM
EC.
Calibrators
No susceptibility. Possible source of particulate
or molecular contam
inant. N
/A
FTS calibrator may use blackening m
aterial that has the potential to shed particles and m
olecular contamination. Special care m
ust be taken w
ith the preparation and handling of this m
aterial. Structural Elem
ents N
o susceptibility. Possible source of particulate and m
olecular contamination if not cleaned and
handled in correct environment.
N/A
Lots of nooks and crannies in the structural elem
ents where particles and m
olecular contam
ination might hide. Structure w
ill also absorb sm
all amounts of w
ater (alum
inium) and m
ust be pre-baked before integration.
Harnesses and
connectors N
o susceptibility. Possible source of particulate and m
olecular contamination if not cleaned and
handled in correct environment.
N/A
Insulating m
aterial may crack and flake
giving rise to particulate contamination.
Insulating material m
ay be source of m
olecular contamination – harness m
ust be pre-baked before integration.
Black B
affles N
o susceptibility. Possible source of particulate and m
olecular contamination (black paint)
N/A
B
lackening material as for FTS calibrators.
Cooler
No susceptibility. Possible source of particulate
N/A
A
gain lots of nooks and crannies. Also

Ref:
SPIRE-R
AL-PR
J-1070
Issue: 1.0
Date:
9 January 2002 Page:
20 of 28
Project Docum
ent SPIR
E
SPIRE C
leanliness Plan
and molecular contam
ination if not cleaned and handled in correct environm
ent. polym
eric materials are used in the
construction of the cooler.

Ref: SPIRE-RAL-PRJ-1070
Issue: 1.0 Date: 9 January 2002 Page: 21 of 28
Project Document
SPIRE SPIRE Cleanliness Plan
APPENDIX B: EFFECT OF PARTICULATE CONTAMINATION ON SPIRE MIRROR PERFORMANCE AT 200 µµµµM. Introduction The effect of exposure of optical surfaces in a given particulate environment will depend on a number of factors. At the most basic level we need to consider two aspects:
− Fairly obviously, the number and size of particles deposited on the surface in a given time. This in turn will depend on the environment in which the optics are stored and handled – generally designated by the cleanroom “class” – and the activities that are carried out on, or in the vicinity, of the optical components.
− The optical properties of the particles deposited on the surface. The particles can, under the correct circumstances, scatter, absorb and emit radiation. All of these effects are to some degree undesirable. Analysis of the optical properties of dust is complex and generally dependent on the wavelength of interest; the size distribution of the particles and the material from which the particles are made.
Effective Obscuration by Particulate Contamination So, we can take the analysis of the problem in two sections. First, how much dust will there be? RD1 gives a summary of a semi-empirical analysis of the subject and I quote only the results here. The rate of fall out of particles of radius >5 µm from air in a cleanroom class C is given by:
773.0)00634.0( Cn ρ=D per square foot per day (1) The parameter ρ depends on the type of clean room. For conventional cleanrooms with 15-20 air changes per hour, the value is given as 2851 (seems a very accurate value!). For laminar flow benches it may be as low as 800. For still air or a low number of air changes (say test facilities) it may be as high as 28510. In RD1 there is some discussion of correction factors for equation 1 depending on the orientation of the surface (vertical or horizontal) and the activity being carried on in the clean room. In the all the following analysis I set both of these to the worst case values of 1 – i.e. I ignore them. We now wish to know the number of particles deposited on a surface as a function both of time and particle diameter n(x,t). RD1 gives this as:
),()log()(2),( txNx
xttxn sα= (2
Here α(t) is a coefficient that describes the evolution of the surface cleanliness with time. In RD1 the following semi-empirical formula is used to describe the surface contamination evolution:
2018)(
25 +
+=αt
tt (4)
Ns(x,t) is the total number of particles per unit area for particles >x after time t. The definition of Ns is given by the MIL-STD-1246C definition of surface cleanliness:
Log(Ns(x,t)) = α(t)[log2(Xc) – log2(x)] (5)

Ref: SPIRE-RAL-PRJ-1070
Issue: 1.0 Date: 9 January 2002 Page: 22 of 28
Project Document
SPIRE SPIRE Cleanliness Plan
Where Xc is the surface cleanliness factor and can be taken as the maximum radius particle present in the distribution. The obscuration ratio for particles with an area given by A(x) and a number distribution of n(x,t) is defined in RD1 as:
∫=Φmax
min
),()(x
x
dxtxnxA (6)
If we assume that all the particles deposited are spherical in form with A(x) = πx2/4, then the obscuration ratio is given by, combining equations 1-6 and converting to radius in microns:
∫−α
××ρπα=Φ
max
min
))(logmin)()(log(10
773.022
10)log(1029.92
)00634.0()( x
x
xxt dxxxtCt (7)
As this function can go greater than 1 – indicating particles falling on particles – a “corrected” obscuration ratio is further defined:
Φ+Φ=Φ
1corr (8)
Optical Effects and Effective Area The scattering, absorption and emission of particles is described by the Mie scattering theory and, although treated explicitly in RD1, is beyond the scope of the present study. For our purposes we need to estimate the loss in throughput per optical surface after some period of exposure to a given cleanroom environment. In the previous section we have shown how to estimate of the surface coverage by particles – we now need a robust estimate of the effect of those particles on the effective area of each optical surface. We can define the effective obscuration in terms of the standard extinction efficiency from scattering theory, Qext, by rewriting equation 6 as:
∫=Φmax
min
),()()(x
xext dxtxnxAkxQ (9)
and Φeff is then found using the corrected form for Φ given in equation 8. Qext is a function of the size parameter kx where k=2π/λ, is the wavenumber. The form of Qext(kx) is highly complex and dependent on the shape and material properties of the particles. RD1 attempts to treat these explicitly because there the interest is in the details of the scattering from the Planck mirror. As we are only interested in the general loss of throughput we can take a simplified form for Qext given by
Qxxext =
+2
1
4
4
( / )( / )
λλ
(10)

Ref: SPIRE-RAL-PRJ-1070
Issue: 1.0 Date: 9 January 2002 Page: 23 of 28
Project Document
SPIRE SPIRE Cleanliness Plan
and shown in figure 1. This follows the general form shown in RD1 and tends to Qext=2 at large values of kx as expected (note 29/8/2001 – Marc Ferlet has calculated the obscuration using a more realistic form for the extinction – see appendix C). Setting the wavelength to 200µm and the maximum and minimum radii to 5 and 1995µm, we can now calculate the effective obscuration versus time for different cleanroom classes. This is shown in figure 2. To convert to affective area – i.e. percentage throughput – we can use the simple form given in RD2:
Aeff= exp(-Φeff) (11)
Aeff is plotted as a function of time for the same cleanroom classes in figures 3a and 3b. We can see from figure 3b that this analysis indicates that the effective area of any exposed optical element will fall to 99% of the clean value after approximately 100 days for class 100; 40 days for class 1000; 16 days for class 10000 and 7 days for class 100000. Conclusions Although the SPIRE team’s initial estimate was that the instrument can live with a reasonably large degree of particulate contamination, the analysis here shows that, in order to maintain the optical throughput per surface >99% some caution is required in their handling. The assumptions made in the analysis are pessimistic in the estimate of the amount of particles that will be deposited, but possibly optimistic in the assessment of the optical extinction properties of the particles. On this basis, and emphasising the pre-cautionary approach to be taken for flight model AIV I recommend the following procedures for the SPIRE assembly and integration:
1. Use at least class 1000 laminar flow environments wherever possible when assembling and aligning the optical system. Wherever possible class 100 laminar flow environments are preferred for bare optical elements.
2. Where this is not feasible the maximum allowed cleanroom class is 10000 and the exposure of any optical surface should be no more than one day.
3. When the instrument is stored for prolonged periods of time (>1 day) with optical elements exposed it must be in a class 100 laminar flow environment or equivalent (vacuum chamber or suitable cover)
4. Particle counters and witness mirrors must be provided in all environments where bare optics are exposed.
5. Whatever the general cleanroom class in which the instrument is held, all operations carried out on the optics or in the vicinity of the optics should be done by personnel with cleanroom standard coat; hat; shoes and gloves. Facial hair must also be covered with a mask.
6. When optical elements have been exposed to non-clean (i.e. class >1000) environments they should be inspected and, if necessary, particulate contamination removed using dry nitrogen gas to blow the contamination away in a safe direction.
7. Structure and other non-optical surfaces that have been exposed to non-clean environments must be inspected and, where necessary, cleaned before introducing optical elements into their vicinity.
8. Once the instrument is fully integrated and with a cover fitted to the optical aperture to protect the input filter, it may be exposed to relatively dirty environments without affecting the performance of the instrument. However it is not recommended that environments greater than class 10000 are used for prolonged periods of time as particulate contamination on the outside of the instrument may find its way to the inside following

Ref: SPIRE-RAL-PRJ-1070
Issue: 1.0 Date: 9 January 2002 Page: 24 of 28
Project Document
SPIRE SPIRE Cleanliness Plan
removal of the cover. The instrument should be inspected following prolonged (>1 day) exposure to class>1000 and, if necessary, the outside cleaned by blowing off particulate contamination using dry nitrogen.
Figure 1: Extinction coefficient versus size parameter used for estimating the effect of dust on the
performance of the SPIRE optical surfaces. In reality the form of the extinction coefficient may be very much more complex than shown here.
100000
100
1000
10000

Ref: SPIRE-RAL-PRJ-1070
Issue: 1.0 Date: 9 January 2002 Page: 25 of 28
Project Document
SPIRE SPIRE Cleanliness Plan
Figure 2: Effective obscuration versus time for cleanroom class 100, 1000, 10000 and 100000 for a “standard” environment and 5<x<1995 µµµµm.
Figure 3a: Effective area versus time for cleanroom class 100, 1000, 10000 and 100000 for a
“standard” environment and 5<x<1995 µµµµm.
Figure 3b: As 3a with x-axis blown up.
100000
100
1000
10000
100000
100
1000
10000

Ref: SPIRE-RAL-PRJ-1070
Issue: 1.0 Date: 9 January 2002 Page: 26 of 28
Project Document
SPIRE SPIRE Cleanliness Plan
APPENDIX C: SHORT NOTE (SIMULATION REPORT) ON PARTICLE CONTAMINATION LEVELS ESTIMATION FOR SPIRE. Marc Ferlet RAL July 2001 Following the note “Effect of particle contamination on SPIRE mirror performance at 200µm” (Bruce Swinyard, 26/09/2000) and further discussion, an estimation of the maximum exposure time to particle contamination in controlled and clean environment (clean rooms), under constraint of max optical degradation of the optical surfaces, was performed. The model used is decribed in the ref. RD1 and 2 as quoted in the note. From discussion, the environmental parameters taken as inputs in the computations are the following: Clean room class: 10 000 (with mean fall-out rate i.e. rho=2851), High activity in the clean-room (coef=1.0) and position horizontal (coef=1.0) for the optical surfaces, The model computes the extinction efficiency of individual particles and then averages it over the particle size distribution and individual particle cross-sections. For simplicity and quick estimation, the particles were taken as spherical in shape and mainly composed of a material with a refractive index varying from ~(1.65+0.03*i) to ~(2.1+0.1*i) over the SPIRE wavelength spectrum (200->700µm respectively). More complex modelling would include averaging the results obtained from a mixture of particles shapes and composition. Requirement: max optical loss, per optical surface, from the effective obscuration ratio (OR) is chosen for the test as 0.5% (or also expressed as 5000 ppm) for each channel. The results are summarised in the table below. Wavelength (µµµµm)
Effective OR (%) max. specified
Exposure time to reach the specified max. effective OR (days)
200 0.5 ~12 300 0.5 ~12 400 0.5 ~12 500 0.5 ~12 600 0.5 ~13 700 0.5 ~13 These results are coherent with the test case performed at 200µm in the note which, for the same cleanroom class, gives an exposure time around 15-20 days. This assumes no cleaning stage. To illustrate the results, the time variations of the obscuration factors are displayed in the figure below.

Ref: SPIRE-RAL-PRJ-1070
Issue: 1.0 Date: 9 January 2002 Page: 27 of 28
Project Document
SPIRE SPIRE Cleanliness Plan
0 2 4 6 8 10 12 14 16 18 200
0.1
0.2
0.3
0.4
0.5
0.6
0.7
0.8
0.9
1
Exposure time (days)
Obscuration factor (%)
Time variations of the Obscuration Ratios (effective ones and geometric)
Effective OR (Mie model)Geometric OR
- Class=10000, - Lambda=200 microns,- spherical particles withmax. diam. 2000 microns,and n~1.75+0.04i
Effective OR ( via multipole expansion& coupling with optical surface)
Requirement:0.5 % loss max.
Figure 1: Graphical example of results for estimation of OR at 200 microns.
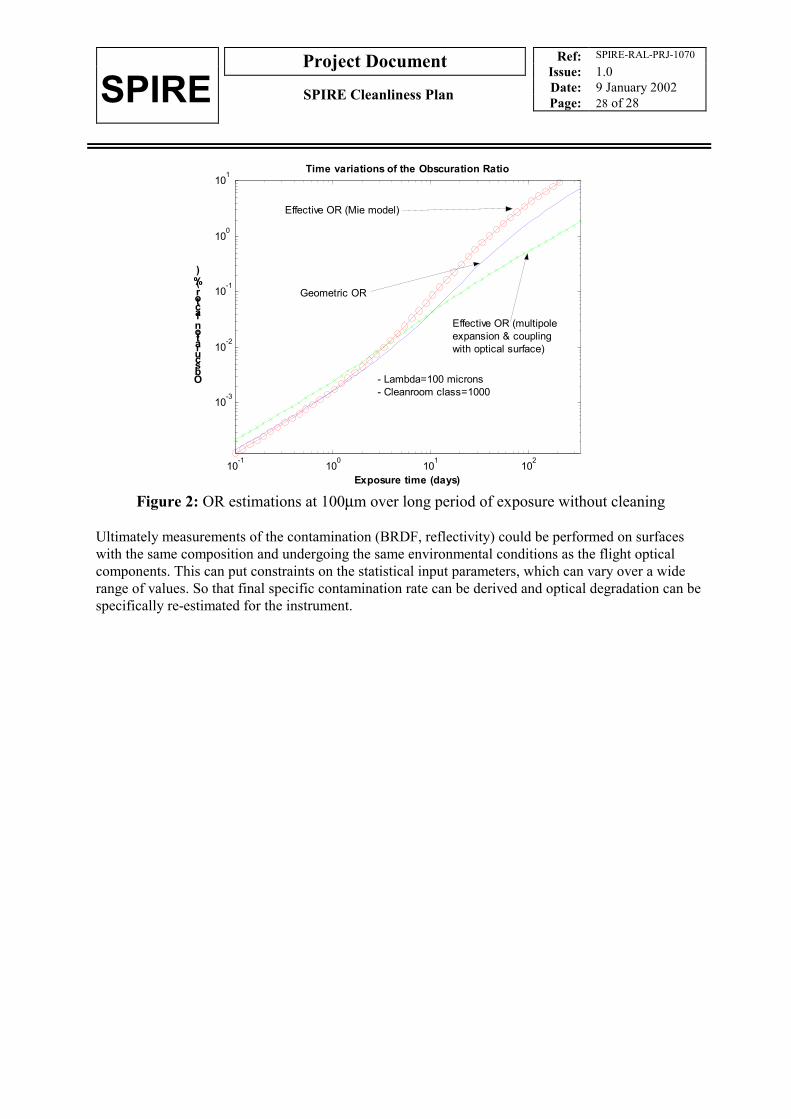
For theses relatively short periods of contamination and that specific range of the spectrum, the geometric OR and the model-dependent effective OR are still relatively close in value. Therefore requirements based on the commonly used geometric OR are relevant for the optical performance degradation for which one would rather use the effective OR. As contamination and degradation can occur during other stages of the ground periods (i.e. storage, transport, launch), the requirement on max allowed optical performances degradation should be actually reduced by an amount which takes these stages into account, before being translated into a max allowed period in AIV/AIT clean-rooms. Another test at shorter wavelength (100 µm), therefore more relevant to PACS, was performed. The clean room class was set to 1000 with a medium-high activity coefficient (0.7). A log-log plot of the estimated OR versus exposure time is displayed in figure 2 below. After a period of one year without cleaning or extra protection/venting of surfaces, the optical degradation is estimated to be of at least ~2% per surface. Requirements below 1000ppm/surface would force to reduce the AIT/AIV exposure periods shorter than a few weeks.
Ref: SPIRE-RAL-PRJ-1070
Issue: 1.0 Date: 9 January 2002 Page: 28 of 28
Project Document
SPIRE SPIRE Cleanliness Plan
10-1 100 101 102
10-3
10-2
10-1
100
101
Exposure time (days)
Obscuration factor (%)
Time variations of the Obscuration Ratio
Effective OR (Mie model)
Geometric OR
Effective OR (multipoleexpansion & couplingwith optical surface)
- Lambda=100 microns- Cleanroom class=1000
Figure 2: OR estimations at 100µm over long period of exposure without cleaning
Ultimately measurements of the contamination (BRDF, reflectivity) could be performed on surfaces with the same composition and undergoing the same environmental conditions as the flight optical components. This can put constraints on the statistical input parameters, which can vary over a wide range of values. So that final specific contamination rate can be derived and optical degradation can be specifically re-estimated for the instrument.