spending review 2021 an analysis of the distribution of
TRANSCRIPT

0
Spending Review 2021
An analysis of the distribution of enterprise supports
ADRIAN HURLEY
DETE VOTE
DEPARTMENT OF PUBLIC EXPENDITURE AND REFORM
2021
This paper has been prepared by IGEES staff
in the Department of Public Expenditure
and Reform. The views presented in this
paper do not represent the official views of
the Department or Minister for Public
Expenditure and Reform.
1
Executive Summary Context
This paper carries out a descriptive analysis on the distribution of enterprise supports from the enterprise agencies under the aegis of the Department of Enterprise, Trade and Employment for the years 2015-2020.
The distribution of supports are analysed at a firm, regional and sectoral level.
The paper primarily focuses on Enterprise Ireland, IDA Ireland, and Local Enterprise Offices.
Key Findings Over the period 2015-2020 approximately €2.4bn was approved by the selected enterprise
agencies for client support. A total of €1.6bn of actual payments were made during this period. The value of annual approvals and payments that Enterprise Ireland and IDA Ireland make are
significantly larger than the Local Enterprise Offices.
The main supports provided by Enterprise Ireland are the Seed and Venture Capital Fund and the Company Development support. For IDA Ireland it is RD&I support and it’s Property Programme. Local Enterprise Offices focus on the Priming Grant and the Business Expansion Grant.
Firm level distribution
A higher number of approvals and payments are made to smaller firms compared to larger firms. For example, 43% of firms who receive a payment are micro versus 6% who are large.
In contrast, in value terms the percentage allocated across firms increases with firm size. For example, 32% of all payments in value terms went to large enterprises versus 12% going to micro.
92% of firms who receive a payment are Irish owned. However, non-Irish owned firms receive a higher allocation in value terms on a proportionate basis. The average payment made to an Irish owned firm is €35,406 and the average payment made to a non-Irish owned firm is €240,651.
IDA Ireland are more likely to support medium and large non-Irish owned firms. Enterprise Ireland have a spread across micro, small and medium firms which are Irish owned and Local Enterprise Offices focus only on Irish owned micro businesses. This is aligned to the agencies mandates.
Regional level distribution
The combined regional distribution of enterprise supports for most counties is similar to how the overall enterprise base is distributed and how the overall agency client base is distributed. Dublin (32%), Cork (13%) and Galway (8%) are the counties which receive the greatest level of support.
Although Dublin has 55% of IDA Ireland clients, it receives 21% of the support provided. In contrast, Cork, Galway, Limerick, Tipperary, and Waterford all receive a greater share of support in value terms from IDA Ireland relative to the proportion of clients located in the county.
For Enterprise Ireland 9% of payments go to overseas clients although they make up only 1% of the client base. These mainly go to overseas funds who then distribute the money to Irish firms.
The distribution of supports for the Local Enterprise Offices is similar to its client base. Sectoral level distribution
The sectoral level analysis includes clients of Enterprise Ireland and IDA Ireland as data is not available on this from the Local Enterprise Offices.
Manufacturing is the sector which receives most payments across the agencies (47%). Next is information and communication (21%) and then finance and insurance (21%).
Within manufacturing the targeting of support differs across the agencies. Enterprise Ireland has a strong focus on food products and beverages. IDA Ireland focuses support on medical devices and pharmaceuticals.
Policy considerations The findings of this paper raise a number of considerations for the Department of Enterprise and
the selected enterprise agencies. These include aligning support provision with the goals of balanced development, ensuring the appropriate budgetary management procedures are in place when it comes to approvals, and having sufficient data monitoring systems in place.

2
Table of Contents
Executive Summary ................................................................................................................................ 1
Table of Contents .................................................................................................................................... 2
1. Introduction .................................................................................................................................... 3
2. Summary of previous enterprise and labour market Spending Review papers ............................. 5
2.1 What do we know about the Irish enterprise environment? ................................................. 5
2.2 Why does government get involved in enterprise policy? ..................................................... 5
2.3 How does government get involved in enterprise policy? ..................................................... 5
2.4 What do we know about the effectiveness of supports? ....................................................... 5
2.5 Who is availing of enterprise supports? ................................................................................. 6
2.6 What do we know about the composition of enterprises and employment? ....................... 6
3. Methodology and data sources ...................................................................................................... 7
4. Enterprise Agencies and Supports .................................................................................................. 8
4.1 The enterprise agencies .......................................................................................................... 8
4.2 The scale of enterprise agencies ............................................................................................. 9
4.3 Overview of supports provided by enterprise agencies ....................................................... 11
5. Distribution of the enterprise base ............................................................................................... 13
5.1 The distribution of the private enterprise base .................................................................... 13
4.2 The distribution of Agency clients ........................................................................................ 16
6. Distribution of enterprise supports .............................................................................................. 21
6.1 Firm level distribution ........................................................................................................... 21
6.2 Regional level distribution .................................................................................................... 24
6.3 Sectoral level distribution .................................................................................................... 27
6.4 Other supports ...................................................................................................................... 29
7. Policy considerations .................................................................................................................... 31
8. Conclusion ..................................................................................................................................... 32
References ............................................................................................................................................ 33
Appendix ............................................................................................................................................... 34

3
1. Introduction
This paper analyses the distribution of enterprise supports from the enterprise agencies under the
aegis of the Department of Enterprise, Trade and Employment1 for the years 2015-2020. The paper
primarily focuses on Enterprise Ireland, IDA Ireland, and Local Enterprise Offices2. The distribution of
supports is analysed at a firm, regional and sectoral level. For comparison purposes this distribution
of supports will be measured against the distribution of the private enterprise base in Ireland and the
distribution of the agency client base.
The Department of Enterprise received €1.7 billion in expenditure in 2020. In the years 2015-2019
they received an average €857 million per annum. Given the level of expenditure the department
receives and the importance of the department to the economic development of the country, it is of
policy importance to have a clear understanding where this expenditure goes in the economy when it
leaves the department via the selected enterprise agencies3.
It is important to highlight that enterprise supports are only one element of overall Government policy
in the area of economic development and enterprise policy. Other areas such as taxation, skills
development, labour market policy, competitiveness, spatial development and infrastructure are also
important (Kane and O’Callaghan, 2018). In addition, agencies in departments other than Enterprise
(e.g. Fáilte Ireland and Údarás na Gaeltachta) also provide supports that are important for the
economic development of the country and they are not included in this paper.
This paper adds to previous Spending Review papers by giving an account of where supports go in the
economy when they leave the selected enterprise agencies. At a firm level it finds, the number of firms
receiving support decreases with firm size. However, in value terms the larger the firm is the greater
the level of support they receive. Irish owned firms account for a significant percentage of firms
receiving support, but the average payment per firm is much greater for non-Irish owned firms.
This paper further shows how Dublin (32%), Cork (13%) and Galway (8%) are the counties which
receive the greatest level of support across all agencies combined. While these counties account for
the greatest share of support across all agencies, the level of distribution varies. Manufacturing is the
sector which receives most payments across Enterprise Ireland and IDA Ireland (47%). Next is
information and communication (21%) and then finance and insurance (21%). Within manufacturing,
1 Throughout the paper the Department of Enterprise, Trade and Employment will be referred to as the Department of Enterprise as its official name has changed throughout the timeframe being analysed. 2 Intertrade Ireland were not in a position to provide data for this analysis. 3 DETE (2021) looks at the distribution of enterprise expenditure across its various programmes.

4
Enterprise Ireland has a strong focus on food products and beverages. IDA Ireland focuses support on
medical devices and pharmaceuticals.
The results of the paper bring about a number of policy considerations for the Department of
Enterprise and its agencies. These include the need to reflect on the alignment of support provision
and balanced development, ensuring the appropriate budgetary management procedures are in place
when it comes to approvals, and having sufficient data monitoring systems in place.
The rest of the paper is organised in the following way. Section 2 is a summary of previous spending
review papers, section 3 looks at the methodology and data sources, section 4 details who the selected
enterprise agencies are and the supports they offer, section 5 outlines how the enterprise base is
distributed in Ireland, section 6 focuses on how these supports are distributed, and section 7 has a set
of policy considerations.

5
2. Summary of previous enterprise and labour market Spending Review
papers
The Irish economy is found to be highly concentrated at a firm (Papa, 2019) and regional level (Barrett,
2018). At the firm level a small percentage of firms are responsible for a significant portion of
productivity growth, corporation tax receipts, export activity, value added and employment. At a
regional level Dublin is much larger relative to the country as a whole in comparison to similar
countries.
Previous literature has covered both external4 and internal rationales for why governments get
involved in enterprise policy. The external rationale states that the main reason a government would
get involved is to enable growth enhancing structural change that would not have occurred without
intervention (Reidy, 2017). The internal rationale for such involvement includes addressing market
failures5, delivering on policy objectives such as regional development and stimulating additional
economic activity (Kane and O’Callaghan, 2018).
Government gets involved in the enterprise sector through various mechanisms6. Enterprise
expenditure supports are provided through agencies such as IDA Ireland7 (Keogh and Brassil, 2018)
and Enterprise Ireland8 (Reidy, 2017). The area of research, development and innovation is a key focus
for the Department with 42.9% of its budget being allocated here in 2019 (DETE, 2021). Agencies such
as Enterprise Ireland and Local Enterprise Offices also provide supports targeted towards
entrepreneurship and start-ups (Moloney, 2018). Another avenue used by the government is state
supported loan schemes, where usage has been increasing in recent years (Keogh et al., 2020).
The literature published to date give us an indication of the positive impact agency supported firms
have on the Irish economy in terms of employment, resilience, productivity, exports and R&D
expenditure (DBEI, 2019; Kane and O’Callaghan, 2018; Keogh and Brassil, 2018; Reidy, 2017).
However, it has been clearly highlighted that the ability to evaluate the impact of specific supports is
4 External to Irish government or departmental rationale. 5 These market failures include adjusting relative costs; acting as an incentive effect; sharing the burden of risk (particularly related to R&D); and overcoming information asymmetry, coordination failures and capability failures. 6 These include supports through enterprise agencies, taxation, education and infrastructure expenditure. 7 Focus grants on R&D, employment, capital and training. 8 Largest category spend was in the area of R&D, with the largest growth area being in venture capital.

6
constrained by certain limitations such as data availability (DBEI, 2019; DJEI, 2017). When it comes to
loan schemes, the literature has provided us with a clear rationale for their existence and the market
failures they are designed to address (Kirby, 2018; Keogh et al. 2020). Specific policy evaluations have
also been carried out in areas such as the RDI programme (Technopolis and ESRI, 2020; DJEI, 2017),
Seed and Venture Capital Scheme (Moloney, 2018), and the Disruptive Technology Innovation Fund
(DBEI, 2020).
The sectors targeted by agency supports tend to be technology, medical technology, financial services
and pharmaceutical (Keogh and Brassil, 2018; Reidy, 2017). However, when it comes to Irish
enterprises these tend to be in sectors such as food and business services (Kane and O’Callaghan,
2018). The loan schemes are generally targeted towards agriculture and manufacturing (Keogh et al.
2020)9. On a regional basis, Dublin is the region which avails of the supports most, whilst the Midlands
region receives least support (Keogh and Brassil, 2018; Reidy, 2017). There is evidence of demand for
these supports across firms of all sizes, with the average financial support increasing with firm size
(DBEI, 2019). The vast majority of lending under loan schemes has been to micro-enterprises and small
enterprises (Keogh et al. 2020). This spending review paper aims to provide greater clarity in relation
to who is availing of the enterprise supports and this is discussed in Section 6.
The services sector has a dominance when it comes to firms and employment (Kane and O’Callaghan,
2019), and micro firms make up a significant number of overall enterprises in Ireland. However, there
is heterogeneity across sectors and ownership status10 when it comes to firm size (Keogh et al. 2020).
There has also been a shift in occupations towards employment which have higher incomes
(O’Callaghan et al. 2019) and is focused in larger firms and in sectors which feature foreign owned
firms (Keogh et al. 2020).
9 Data in the Department of Enterprise shows that the loans schemes are used across many different sectors. This will be further analysed in an upcoming Spending Review paper by Reidy (2021). 10 Irish owned vs Multinational.

7
3. Methodology and data sources
This paper uses the descriptive analysis technique to gain an understanding into where enterprise
supports are going in the economy when they leave the selected enterprise agencies. Descriptive
Analysis is the type of analysis of data that helps describe, show or summarize data points in a
constructive way.
This paper focuses on the years 2015-2020 and analyses the support recipients at a firm, regional and
sectoral level. For comparison purposes this distribution of supports will be measured against the
distribution of the private enterprise base in Ireland and the distribution of the agency client base.
The inclusion of this comparison is to provide a high-level context to the distribution of support and is
not included as a means of evaluation.
An anonymised list of agency clients (Enterprise Ireland, IDA Ireland, Local Enterprise Offices) for each
of the years 2015-2020 was obtained. That was a list of all firms that were classified as an agency client
during any of these years. This had information on the firm size, firm sector, county location and
whether the client was Irish or non-Irish. The Local Enterprise Offices were not in a position to provide
sectoral level data.
In addition, a data set was received from each of the agencies with the list of clients who received an
approval for each of the years 2015-2020. This had information on the year of approval, name of the
agency, scheme they were approved for, objective of the scheme, client firm size, regional location,
sector they were in, Irish or non-Irish firm, and the amount approved.
Finally, data on the actual payments made during this period was received. This had the same level of
information as the approvals above. For both of these, the Local Enterprise Offices were not in a
position to provide sectoral level data.
Business demography data from the CSO was used to get an understanding of the distribution of the
private enterprise base at a firm, regional and sectoral level. Data for the years 2015 to 2018 was used.
2018 was the most recent time period available. For each of the indicators analysed the average was
used for the years 2015-2018.
8
4. Enterprise Agencies and Supports
It is important to get an understanding of who the selected enterprise agencies are and what were
the priorities of the agencies during the period 2015-2020. To do so key published documents around
this time period are used to identify these priorities. Table 1 details the main priorities for the
enterprise agencies selected in this study.
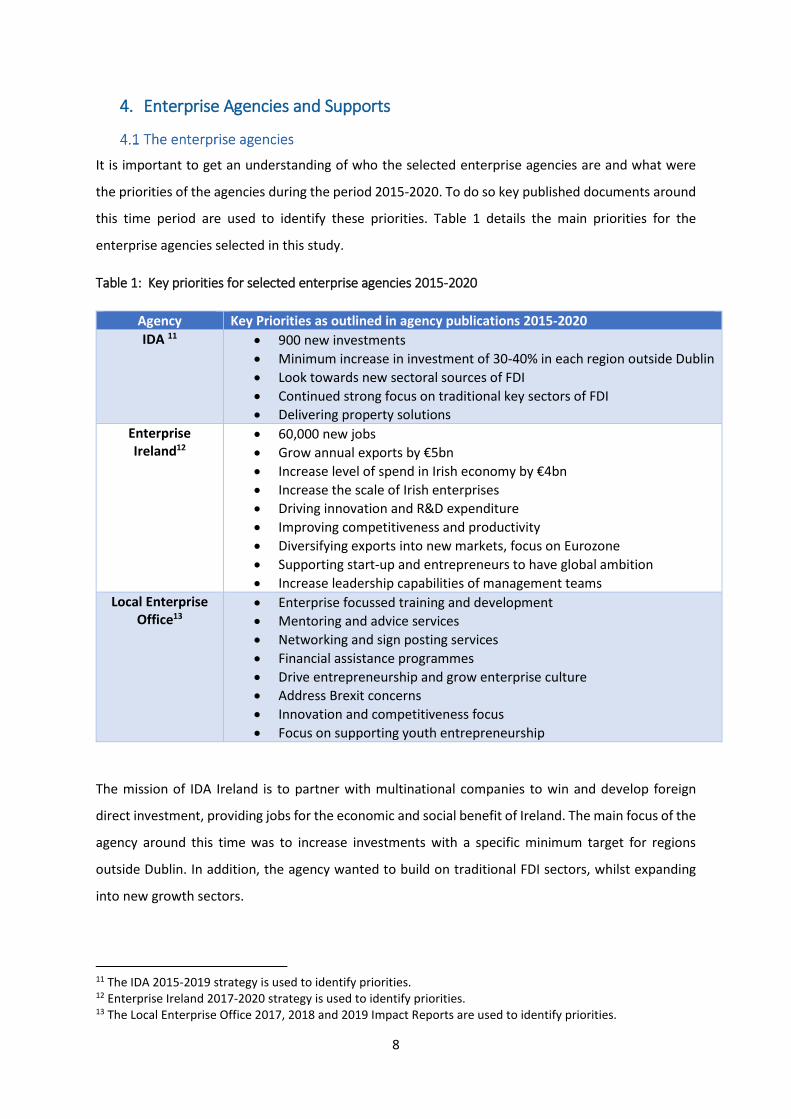
Table 1: Key priorities for selected enterprise agencies 2015-2020
Agency Key Priorities as outlined in agency publications 2015-2020
IDA 11 900 new investments
Minimum increase in investment of 30-40% in each region outside Dublin
Look towards new sectoral sources of FDI
Continued strong focus on traditional key sectors of FDI
Delivering property solutions
Enterprise Ireland12
60,000 new jobs
Grow annual exports by €5bn
Increase level of spend in Irish economy by €4bn
Increase the scale of Irish enterprises
Driving innovation and R&D expenditure
Improving competitiveness and productivity
Diversifying exports into new markets, focus on Eurozone
Supporting start-up and entrepreneurs to have global ambition
Increase leadership capabilities of management teams
Local Enterprise Office13
Enterprise focussed training and development
Mentoring and advice services
Networking and sign posting services
Financial assistance programmes
Drive entrepreneurship and grow enterprise culture
Address Brexit concerns
Innovation and competitiveness focus
Focus on supporting youth entrepreneurship
The mission of IDA Ireland is to partner with multinational companies to win and develop foreign
direct investment, providing jobs for the economic and social benefit of Ireland. The main focus of the
agency around this time was to increase investments with a specific minimum target for regions
outside Dublin. In addition, the agency wanted to build on traditional FDI sectors, whilst expanding
into new growth sectors.
11 The IDA 2015-2019 strategy is used to identify priorities. 12 Enterprise Ireland 2017-2020 strategy is used to identify priorities. 13 The Local Enterprise Office 2017, 2018 and 2019 Impact Reports are used to identify priorities.

9
Enterprise Ireland’s mission is to deliver a major improvement in the international strength of Irish
enterprise across all regions by transforming the innovation and competitive capabilities of Irish
companies. They seek to achieve this by inspiring and supporting ambitious business leaders to
increase the scale of their businesses and expand their reach into new export markets. During this
time period Enterprise Ireland were focused on increasing employment and both increasing and
diversifying exports. Further attention was given to areas such as competitiveness, productivity and
innovation.
Local Enterprise Offices are the ‘first stop shop’ for anyone seeking information and support on
starting or growing a business in Ireland. The main focus for this agency during 2015-2020 was to
provide support and advice aimed at driving entrepreneurship across the country. Supports targeted
at Brexit were also mentioned.
To get an understanding of the scale of each of the selected enterprise agencies, one can look at the
value of approvals and payments that each made during the period 2015-2020. Approvals relate to a
commitment by an agency to support a firm through one of its schemes. A payment is the actual
drawdown of capital for a scheme provided by the agency. It is important to note that not all approvals
translate into payments in the same year and some approvals may never materialise into a payment14.
Therefore, comparing approvals with payments over the same time period is not appropriate and each
should be analysed separately.
Diagram 1 highlights the total value of approvals each of the selected enterprise agencies made during
the years 2015-2020. What is evident is that the scale of approvals being made by both Enterprise
Ireland and IDA Ireland is significantly larger than that of the Local Enterprise Office. Enterprise Ireland
made the largest number of approvals in value terms in the years 2015-2020, which was driven by the
significant increase in approvals during 2020. The large increase in approvals in 2020 can be attributed
to the Covid-19 pandemic and the corresponding increase in enterprise supports. The average annual
value of approvals across the time period for each of the agencies was: Enterprise Ireland (€205m),
IDA (€181m), and Local Enterprise Office (€18m)15.
14 For example an agency may approve funding for a potential project that one of their clients intend to pursue but this project might not materialise and therefore the payment will not be made. 15 The average annual value of approvals has been inflated for Enterprise Ireland in the year 2020, due to Covid. This is not the case for the other agencies. The average value for Enterprise Ireland for the years 2015-2019 was €169m.
10
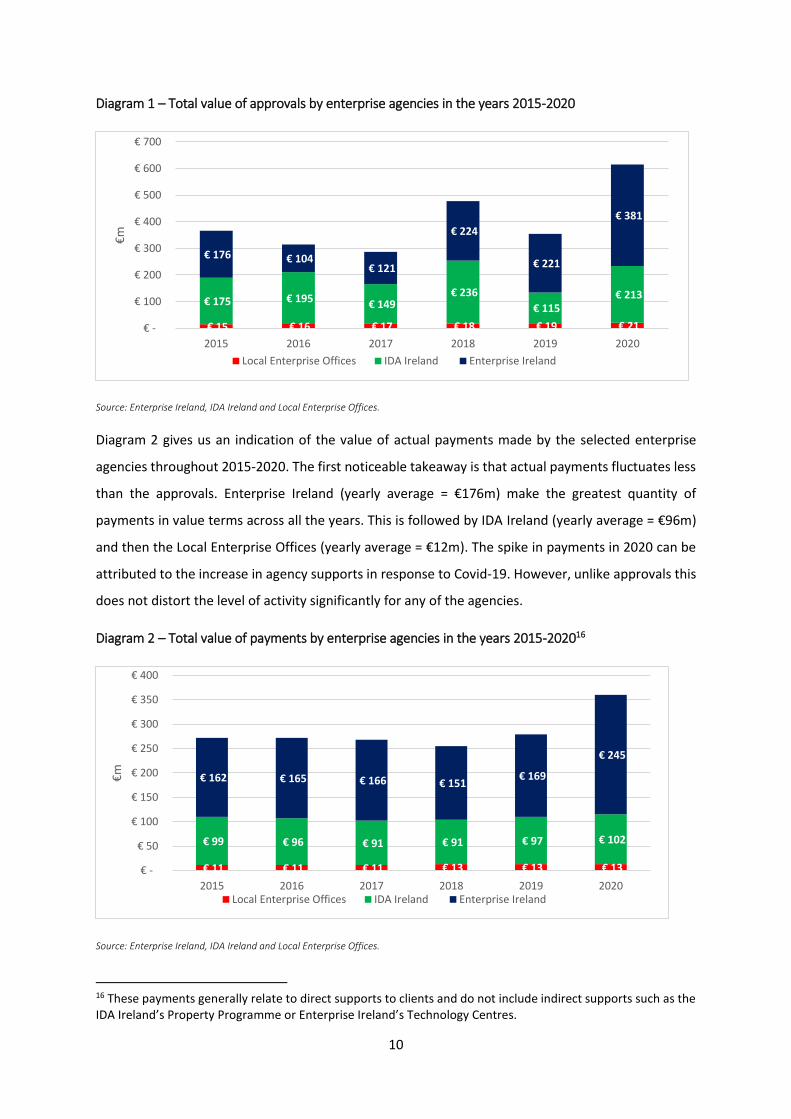
Diagram 1 – Total value of approvals by enterprise agencies in the years 2015-2020
Source: Enterprise Ireland, IDA Ireland and Local Enterprise Offices.
Diagram 2 gives us an indication of the value of actual payments made by the selected enterprise
agencies throughout 2015-2020. The first noticeable takeaway is that actual payments fluctuates less
than the approvals. Enterprise Ireland (yearly average = €176m) make the greatest quantity of
payments in value terms across all the years. This is followed by IDA Ireland (yearly average = €96m)
and then the Local Enterprise Offices (yearly average = €12m). The spike in payments in 2020 can be
attributed to the increase in agency supports in response to Covid-19. However, unlike approvals this
does not distort the level of activity significantly for any of the agencies.
Diagram 2 – Total value of payments by enterprise agencies in the years 2015-202016
Source: Enterprise Ireland, IDA Ireland and Local Enterprise Offices.
16 These payments generally relate to direct supports to clients and do not include indirect supports such as the IDA Ireland’s Property Programme or Enterprise Ireland’s Technology Centres.
€ 15 € 16 € 17 € 18 € 19 € 21
€ 175 € 195 € 149 € 236
€ 115 € 213
€ 176 € 104 € 121
€ 224
€ 221
€ 381
€ -
€ 100
€ 200
€ 300
€ 400
€ 500
€ 600
€ 700
2015 2016 2017 2018 2019 2020
€m
Local Enterprise Offices IDA Ireland Enterprise Ireland
€ 11 € 11 € 11 € 13 € 13 € 13
€ 99 € 96 € 91 € 91 € 97 € 102
€ 162 € 165 € 166 € 151 € 169
€ 245
€ -
€ 50
€ 100
€ 150
€ 200
€ 250
€ 300
€ 350
€ 400
2015 2016 2017 2018 2019 2020
€m
Local Enterprise Offices IDA Ireland Enterprise Ireland

11
Diagrams 3-5 highlight the main supports provided by the selected enterprise agencies. For the IDA
(Diagram 3) the main support is the RD&I Support Programme which made up 39% of payments for
the years 2015-2020. This was followed by the Property Programme (33%). The RD&I Support
Programme is a grant which is focused on sharing the risk associated with investment in R&D and
therefore it aims to help minimise the underinvestment by companies in this area. The Property
Programme encourages and facilitates regional investment by ensuring there are suitable properties
in place to meet the needs of multinational firms.
Diagram 3: Main enterprise supports provided by IDA Ireland 2015-2020
Source: IDA Ireland
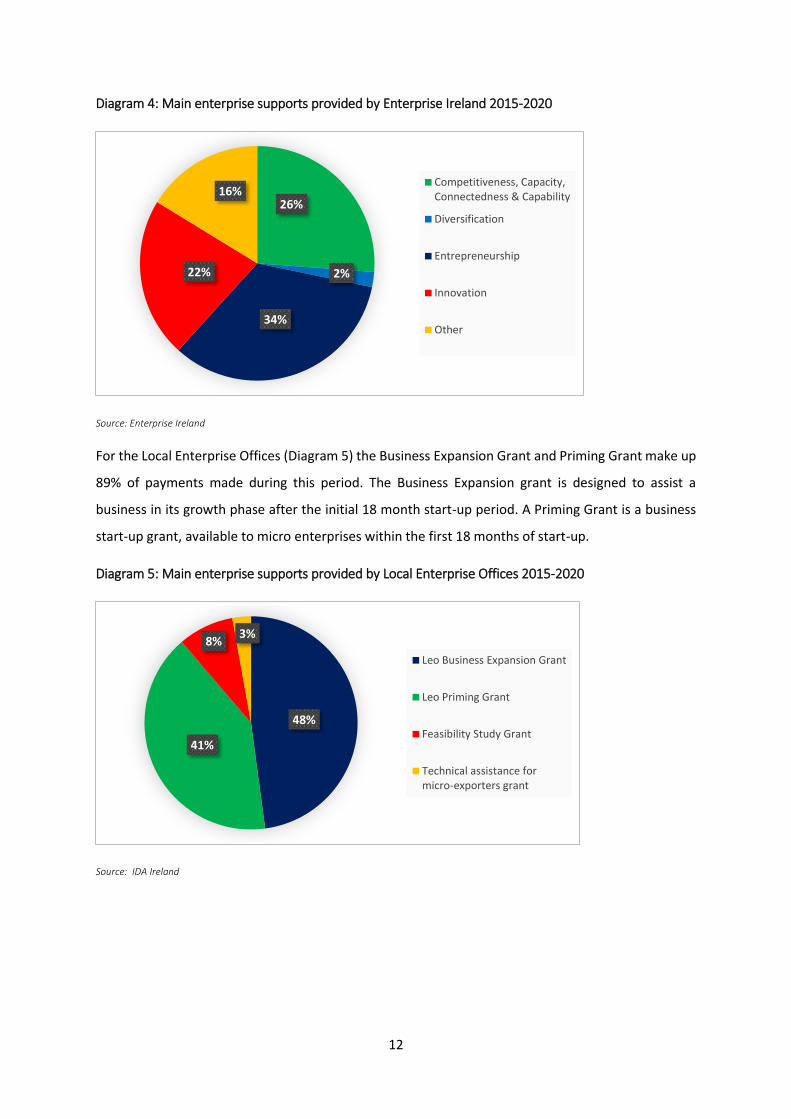
Relative to the other agencies, Enterprise Ireland have a large quantity of schemes. Diagram 4 shows
the breakdown of supports under themes assigned by the agency. Supports targeted at
entrepreneurship were attributable to the highest spend during this period. This was followed by
competiveness, capacity, connectedness & capability, and then innovation. At an individual support
level, the Seed and Venture Capital Fund and the Company Development support are amongst the
most utilised during this period. The Seed and Venture Capital Fund is aimed at stimulating job
creation and support the funding requirements of early-stage innovative Irish companies with global
ambitions. The Company Development support provides tailored support for companies undertaking
ambitious expansion strategy.
39%
33%
11%
9%
8% IDA RD&I SupportProgramme
IDA Property Programme
IDA Capital Grants
IDA Employment Grants
IDA Training
12
Diagram 4: Main enterprise supports provided by Enterprise Ireland 2015-2020
Source: Enterprise Ireland
For the Local Enterprise Offices (Diagram 5) the Business Expansion Grant and Priming Grant make up
89% of payments made during this period. The Business Expansion grant is designed to assist a
business in its growth phase after the initial 18 month start-up period. A Priming Grant is a business
start-up grant, available to micro enterprises within the first 18 months of start-up.
Diagram 5: Main enterprise supports provided by Local Enterprise Offices 2015-2020
Source: IDA Ireland
26%
2%
34%
22%
16%Competitiveness, Capacity,Connectedness & Capability
Diversification
Entrepreneurship
Innovation
Other
48%
41%
8%3%
Leo Business Expansion Grant
Leo Priming Grant
Feasibility Study Grant
Technical assistance formicro-exporters grant

13
5. Distribution of the enterprise base
This section will look at how the overall private enterprise base is distributed in Ireland at a firm,
regional and sectoral level. Diagram 6 displays the distribution of private enterprises across the Irish
economy at a firm size level. To measure this the average number of firms in each size category
between 2015-201817 is used. The key insight from this is that at a national level 92% of private
enterprises in Ireland are micro, 6% are small, 1% are medium, and less than 1% are large.
Diagram 6: The firm size distribution of the private enterprise base
Source: CSO
Diagram 7 displays the distribution of private enterprises across the Irish economy at a regional level.
The average number of enterprises in each county between the years 2015-2018 is used. For
comparison purposes the distribution of enterprises across the country is compared to the distribution
of the population. For the majority of counties the distribution of the population is similar to the
distribution of the total enterprise base. Dublin is found to be an outlier in terms of variance between
the two metrics - 28% of the population is located in Dublin, yet 32% of private enterprises are situated
there.
The concentration in Dublin increases with firm size, which results in 60% of large enterprises being
located in the county. This relationship does not occur for the other Irish cities.
The diagram also shows the distribution of employment across the economy. Again for the majority
of counties the distribution of employment is similar to the distribution of the population. However,
17 2018 is the most recent data available on the CSO.
92%
7%
1%
0%
Micro
Small
Medium
Large

14
Dublin has 47% of employment in comparison to 28% of the population and 32% of the private
enterprise base.
Diagram 7: The regional distribution of the private enterprise base
Source: CSO
Previous research helps one to understand the possible reasoning behind this distribution.
Morgenroth (2018) finds that the uneven distribution of economic activity can be explained by
physical geography (20%), with the remainder being due either to man-made agglomeration
economies18 or to the interaction between man-made agglomeration economies and geography.
Whilst agglomeration economies can bring benefits such as increased productivity, innovation,
entrepreneurship, spillovers, higher incomes and more efficient infrastructure provision, excessive
concentration known as primacy can cause congestion costs such as public services pressure, urban
sprawl, increased commuting time, increases in costs such as housing, and can reduce national
productivity. Barrett (2018) finds that Dublin is much larger in population relative to the country as a
whole in comparison to similar countries.
18 What matters here is the interaction between economic agents among themselves rather than the interaction between agents and nature. Agglomeration advantages might arise because of knowledge and information spillovers, economies of intra-industry specialization, labor market economies or market size effects.
0%
10%
20%
30%
40%
50%
60%
70%
Car
low
Cav
an
Cla
re
Co
rk
Do
neg
al
Du
blin
Gal
way
Ker
ry
Kild
are
Kilk
en
ny
Lao
is
Leit
rim
Lim
eric
k
Lon
gfo
rd
Lou
th
May
o
Mea
th
Mo
nag
han
Off
aly
Ro
sco
mm
on
Slig
o
Tip
per
ary
Wat
erfo
rd
Wes
tme
ath
Wex
ford
Wic
klo
w
%
County
Micro Small Medium Large Total Population Employment
15
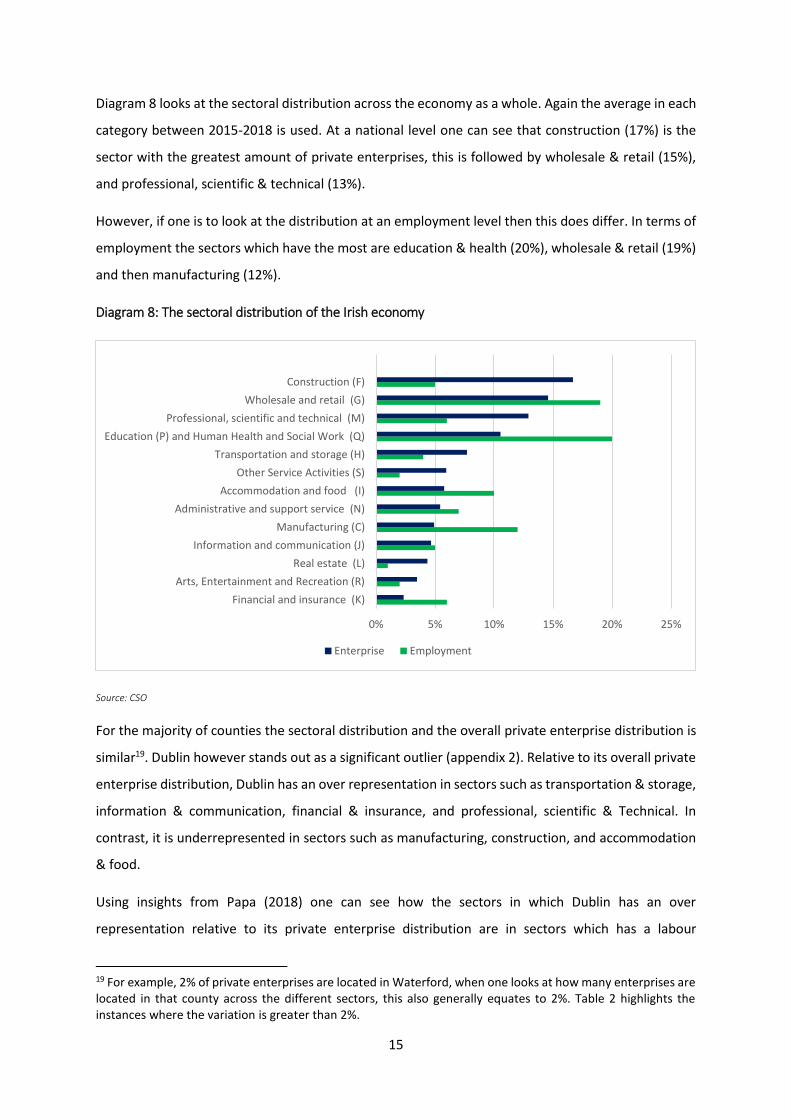
Diagram 8 looks at the sectoral distribution across the economy as a whole. Again the average in each
category between 2015-2018 is used. At a national level one can see that construction (17%) is the
sector with the greatest amount of private enterprises, this is followed by wholesale & retail (15%),
and professional, scientific & technical (13%).
However, if one is to look at the distribution at an employment level then this does differ. In terms of
employment the sectors which have the most are education & health (20%), wholesale & retail (19%)
and then manufacturing (12%).
Diagram 8: The sectoral distribution of the Irish economy
Source: CSO
For the majority of counties the sectoral distribution and the overall private enterprise distribution is
similar19. Dublin however stands out as a significant outlier (appendix 2). Relative to its overall private
enterprise distribution, Dublin has an over representation in sectors such as transportation & storage,
information & communication, financial & insurance, and professional, scientific & Technical. In
contrast, it is underrepresented in sectors such as manufacturing, construction, and accommodation
& food.
Using insights from Papa (2018) one can see how the sectors in which Dublin has an over
representation relative to its private enterprise distribution are in sectors which has a labour
19 For example, 2% of private enterprises are located in Waterford, when one looks at how many enterprises are located in that county across the different sectors, this also generally equates to 2%. Table 2 highlights the instances where the variation is greater than 2%.
0% 5% 10% 15% 20% 25%
Financial and insurance (K)
Arts, Entertainment and Recreation (R)
Real estate (L)
Information and communication (J)
Manufacturing (C)
Administrative and support service (N)
Accommodation and food (I)
Other Service Activities (S)
Transportation and storage (H)
Education (P) and Human Health and Social Work (Q)
Professional, scientific and technical (M)
Wholesale and retail (G)
Construction (F)
Enterprise Employment

16
productivity that is relatively more productive than the industry average and is underrepresented in
some sectors which have a labour productivity that is less productive than the industry average. This
can be explained by the agglomeration theory mentioned previously. In fact, certain service activities
tend to have a particular preference for larger conurbations (Morgenroth, 2018).
Other counties with a variance between their private enterprise distribution and their sectoral
distribution that is greater than 2% are Cork and Kerry (appendix 2). Cork have an under
representation of enterprises in the information and communication sector and financial and
insurance sector, relative to its overall enterprise base. For Kerry, they have a higher proportion of
enterprises in the accommodation and food sector relative to their overall enterprise base.
This section looks at the distribution of agency clients at a firm, regional and sectoral level. Included
in the analysis are any firms who were a client of the agency across any of the years 2015-2020. Firstly,
enterprises which are clients of the selected enterprise agencies are bigger in size relative to the
overall enterprise base. Table 3 shows that 14% of agency clients are either a medium or large firm in
comparison to 1% of the private enterprise base. For the IDA, 48% of their clients are either a medium
or large enterprise. Supports provided by the Local Enterprise Offices are specifically for micro
enterprises and therefore, 100% of their clients are micro.
Table 3: The firm size distribution of agency clients
Agency Micro Small Medium Large Other
Private Enterprise Base 92% 6% 1% 0% 0%
Enterprise Ireland 36% 38% 14% 5% 7%
IDA Ireland 18% 33% 33% 15% 1%
Local Enterprise Offices 100% 0% 0% 0% 0%
Total 62% 21% 10% 4% 3%
Source: Enterprise Ireland, IDA Ireland and Local Enterprise Offices.
Diagrams 9-12 show the percentage distribution of agency clients across the country. For the majority
of counties when you look at the distribution of all the agency clients (Diagram 12) it mirrors the
distribution of the overall private enterprise base discussed in the previous section20. However, when
you look at the distribution across agencies individually you will notice that Dublin stands out as an
outlier relative to their private enterprise base.
20 Dublin has a total agency distribution which is 2% higher than its private enterprise base distribution (34% vs 32%). All other counties have either the same distribution or a 1% difference.

17
In the two biggest enterprise agencies in this study, IDA Ireland (Diagram 10) and Enterprise Ireland
(Diagram 9), Dublin has 55% and 40% of their clients respectively. When it comes to Local Enterprise
Offices (Diagram 11), Dublin is underrepresented relative to its private enterprise base by 11%21. The
other counties with variances greater than 2% include Galway which is underrepresented with Local
Enterprise Office clients relative to its private enterprise base by 3%, and Meath which is under
represented with IDA Ireland clients by 3%. All other counties have a distribution of agency clients
which is similar to its overall private enterprise base.
21 Dublin has 32% of private enterprises while 21% of LEO clients are located there.

18
Diagram 9: The regional distribution of Enterprise Ireland clients (%) Diagram 10: The regional distribution of IDA Ireland clients (%)
Diagram 11: The regional distribution of LEO clients (%) Diagram 12: The regional distribution of all agency clients (%)
19
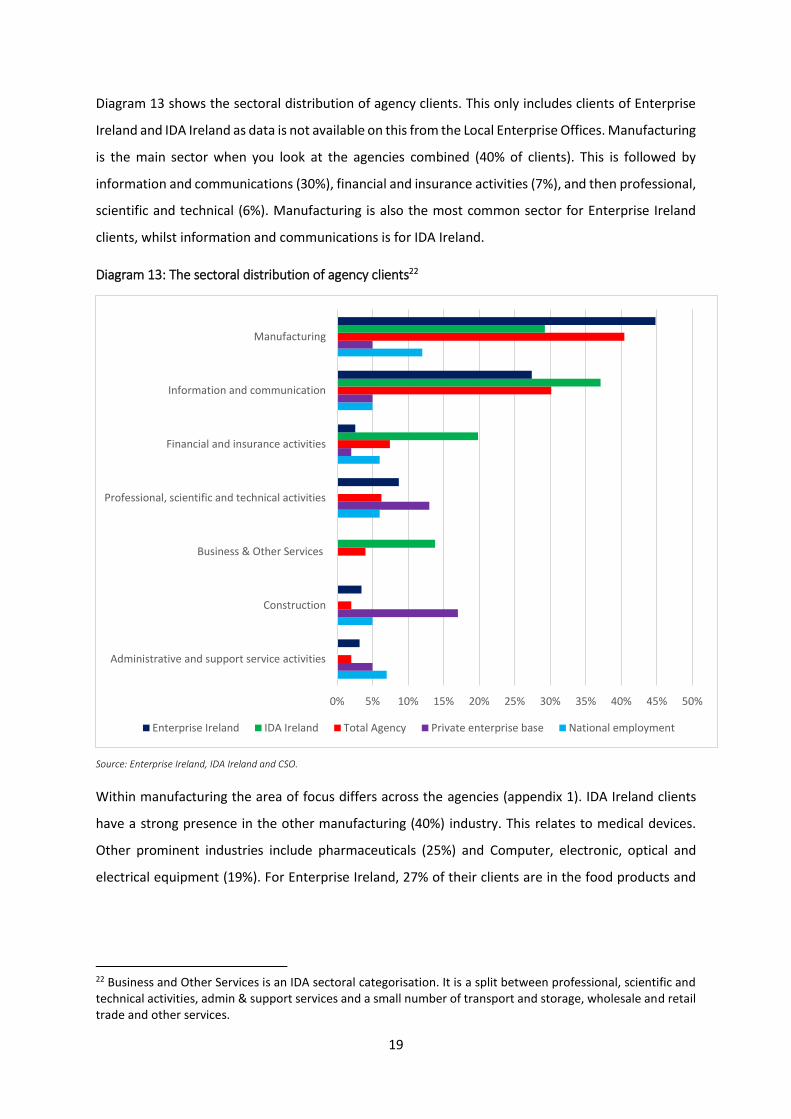
Diagram 13 shows the sectoral distribution of agency clients. This only includes clients of Enterprise
Ireland and IDA Ireland as data is not available on this from the Local Enterprise Offices. Manufacturing
is the main sector when you look at the agencies combined (40% of clients). This is followed by
information and communications (30%), financial and insurance activities (7%), and then professional,
scientific and technical (6%). Manufacturing is also the most common sector for Enterprise Ireland
clients, whilst information and communications is for IDA Ireland.
Diagram 13: The sectoral distribution of agency clients22
Source: Enterprise Ireland, IDA Ireland and CSO.
Within manufacturing the area of focus differs across the agencies (appendix 1). IDA Ireland clients
have a strong presence in the other manufacturing (40%) industry. This relates to medical devices.
Other prominent industries include pharmaceuticals (25%) and Computer, electronic, optical and
electrical equipment (19%). For Enterprise Ireland, 27% of their clients are in the food products and
22 Business and Other Services is an IDA sectoral categorisation. It is a split between professional, scientific and technical activities, admin & support services and a small number of transport and storage, wholesale and retail trade and other services.
0% 5% 10% 15% 20% 25% 30% 35% 40% 45% 50%
Administrative and support service activities
Construction
Business & Other Services
Professional, scientific and technical activities
Financial and insurance activities
Information and communication
Manufacturing
Enterprise Ireland IDA Ireland Total Agency Private enterprise base National employment

20
beverages industry. The next prominent industry for them is Basic metals and fabricated metal
products (13%).
The sectors which are aligned to the selected enterprise agencies are not the sectors which are most
prominent in the Irish economy in terms of the overall private enterprise base and employment
composition. However, using previous research from Kane and O’Callaghan (2019) one can see that
the sectors which are prominent within the selected enterprise agencies are the ones associated with
high earnings (information and communication, and finance and insurance), and high gross value
added (manufacturing).

21
6. Distribution of enterprise supports
The paper analyses the distribution of supports at the firm level using two metrics – size and
ownership nationality. Diagram 14 shows the distribution of approvals across the various firm sizes23
for the period 2015-2020. It does this looking in terms of both the value of approvals and the number
of approvals. It also includes the firm size distribution for agency clients and the private enterprise
base for comparison purposes.
The total value of approvals increases with firm size, with large firms accounting for 28% of approvals
in comparison to 9% for micro enterprises. In total over €2.4bn was approved across approximately
26,000 firms/projects by the agencies over the period 2015-2020. In contrast to the value of approvals,
micro enterprises account for the greatest number of firms who received an approval at 43% and large
firms account for the least number of firms who received an approval at 4%.
Diagram 14: The firm size distribution of enterprise approvals
Source: Enterprise Ireland, IDA Ireland, Local Enterprise Offices and CSO.
Relative to the overall agency distribution discussed above, what we see across agencies is that IDA
Ireland are more likely to approve funding for medium and large firms, Enterprise Ireland have a
23 The “Other” category includes projects such as infrastructural projects and firms who received support but whose size is unknown.
0%
10%
20%
30%
40%
50%
60%
70%
80%
90%
100%
Micro Small Medium Large Other
Value of approvals Number of approvals Agency client distribution Private enterprise distribution

22
spread across micro, small and medium, whilst Local Enterprise Offices focus only on micro businesses.
Enterprise Ireland account for the majority of clients referred to as other and this is due to the firm
size of some recipients being unknown. It is important to note that the recipient of some Enterprise
Ireland supports may not be a client company24.
Diagram 15: The firm size distribution of enterprise payments
Source: Enterprise Ireland, IDA Ireland, Local Enterprise Offices and CSO.
Diagram 15 looks at the same distribution across the payments made by the selected enterprise
agencies during 2015-2020. Payments to the value of €1.6bn were made to approximately 23,000
firms or projects. In value terms the greatest percentage of this funding goes to large firms (32%).
Although a greater number of micro enterprises (43%) avail of particular support payments. Similar to
the approvals, at an agency level IDA Ireland make payments to mainly medium and large firms, whilst
Enterprise Ireland have a spread across micro (32%), small (33%) and medium (16%).
Overall the number of firms getting approved or receiving a payment has a similar size distribution to
the agency client size distribution. One noticeable variance is with micro firms where the number of
firms receiving support (43% of payments) is less relative to the number of micro enterprises who are
24 For example the recent Online Retail Scheme that Enterprise Ireland provided was not exclusive to their client base.
0%
10%
20%
30%
40%
50%
60%
70%
80%
90%
100%
Micro Small Medium Large Other
%
Year
Value of payments Number of payments Agency client distribution Private enterprise distribution

23
a client agency (62% of the agency client base). Also, larger firms have a larger proportional
distribution in terms of the value of approvals and payments. This finding is in line with previous
literature which found that financial support increases with firm size (DBEI, 2019).
Diagram 16: The ownership distribution of enterprise approvals and payments
Source: Enterprise Ireland, IDA Ireland and Local Enterprise Offices.
Diagram 16 shows how supports have been distributed across firm ownership. In terms of both
approvals and payments, the number of firms availing of supports are mainly Irish owned firms (92%
and 89% respectively). However, when it comes to the value of approvals or payments, the differential
between Irish and non-Irish owned firms reduces significantly. Across agencies, we see that both
Enterprise Ireland and Local Enterprise Offices target Irish owned firms (96% and 100% respectively),
whilst IDA Ireland support non-Irish owned firms (100%). Overall, the level of approvals from the
agencies combined in value terms is similar for both Irish and non-Irish owned firms, whilst Irish owned
firms receive a greater value of payments relative to non-Irish owned firms (58% vs 42%).
Diagram 17 highlights why the differential between Irish and non-Irish owned firms closes when you
look at the support distribution in value terms. The average payment going to a non-Irish owned firm
(€240,651) is significantly greater than the average payment going to an Irish owned firm (€35,406).
0%
10%
20%
30%
40%
50%
60%
70%
80%
90%
100%
Irish Non-Irish
%
Ownership
Value of approvals Value of payments Number of approvals
Number of payments Agency client distribution

24
This may be explained by the differing scale of the agencies discussed in section 3. So although there
might be a significantly less amount of non-Irish owned firms getting support, the scale of funding
each recipient receives from IDA Ireland is larger relative to the scale of funding an Irish owned firm
would receive from Enterprise Ireland or Local Enterprise Offices25.
One possible explanation on this, is that foreign owned firms tend to be larger in size relative to the
overall enterprise base in Ireland (Keogh et al. 2020). Therefore, in line with the fact that financial
support increases with firm size, one can explain why non-Irish owned firms tend to receive larger
payments.
Diagram 17: Average value of approval and payment made in the years 2015-2020 by firm
ownership
Source: Enterprise Ireland, IDA Ireland and Local Enterprise Offices.
Diagram 18-21 displays the level of payments in value terms made by the selected enterprise agencies
across the counties for the period 2015-2020. For presentation purposes, only the distribution of
payments is represented. However for the majority of counties the distribution of approvals is
similar.26
25 The average payment a non-Irish owned firm receives from IDA Ireland is €292,568. The average payment an Irish owned firm receives from Enterprise Ireland is €50,291 and from Local Enterprise Offices is €7,423. 26 Dublin has 5% less approvals relative to payments for Enterprise Ireland (33%) and it has 6% more approvals for IDA Ireland (27%). Galway has 3% more approvals relative to payments for Enterprise Ireland (8%). All other counties have an approvals distribution similar to payments (+-2%).
€ 44,772 € 35,406
€ 567,028
€ 240,651
€ -
€ 100,000
€ 200,000
€ 300,000
€ 400,000
€ 500,000
€ 600,000
Average approval Average payment
Irish Non Irish

25
When you combine the agencies (Diagram 21), the distribution of payments is similar for the majority
of counties to how the overall enterprise base and the agency client base is distributed. Dublin (32%),
Cork (13%) and Galway (8%) are the counties which receive the greatest level of support in terms of
payments.
Both Cork and Galway receive a greater proportion of payments relative to their agency and overall
private enterprise distribution. In contrast, payments made to firms in Dublin are below the counties
overall agency client base distribution and Dublin’s private enterprise distribution. Meath is another
example of a county who receives support which is lower relative to the number of agency and private
enterprises located in the county.
However, across agencies variances occur between the distribution of supports and the distribution
of the agency client base. For IDA Ireland (Diagram 19), there is a significant variance in terms of
Dublin. Although Dublin has 55% of IDA Ireland clients located there, it receives 21% of the support
provided by the agency. In contrast, Cork, Galway, Limerick, Tipperary, and Waterford all receive a
greater share of support in value terms from IDA Ireland relative to the proportion of clients located
in the county.
The main variance within Enterprise Ireland (Diagram 18) comes from its enterprises located overseas.
Although they represent less than 1% of its client base, they receive 9% of its payments in value
terms27. The distribution of supports for the Local Enterprise Offices (Diagram 20) is similar to the
distribution of its client base.
27 The majority of this funding goes to overseas funds who then distribute this money back into Irish enterprises.

26
Diagram 18: The regional distribution of Enterprise Ireland supports (%) Diagram 19: The regional distribution of IDA Ireland supports (%)
Diagram 20: The regional distribution of LEO supports (%) Diagram 21: The regional distribution of all agency supports (%)

27
Diagram 22 highlights the sectoral distribution of approvals made during the years 2015-2020. This
only includes clients of Enterprise Ireland and IDA Ireland as data is not available on this from the Local
Enterprise Offices. Manufacturing is the sector which receives most approvals across the agencies with
49% of approvals going there in total. Next is information and communication (23%) and then finance
and insurance (10%).
In comparison to the sectoral distribution of the agency client list discussed in section 5, one can see
that manufacturing receives a greater level of approvals (49%) relative to the proportion of clients
(40%) in that sector. This variance is much more significant for IDA Ireland, where manufacturing
receives 57% of the value of approvals in comparison to 29% of agencies being in that sector. In
contrast, information and communications receives a smaller share of approvals (23%) relative to its
proportion of the client base (30%) across both agencies.
The combined approvals of the financial and insurance sector (10%) is larger relative to the proportion
of firms (7%) in that sector. However, when you look at the agencies separately this differs. For
Enterprise Ireland a higher proportion of approvals (13%) is attributed to this sector relative to the
number of firms (3%) in that sector. In contrast, IDA Ireland has a lower number of approvals (6%)
relative to proportion of clients (20%) in this sector.
Diagram 22: The sectoral distribution of approvals28
Source: Enterprise Ireland and IDA Ireland
28 Business and Other Services is an IDA sectoral categorisation. It is a split between professional, scientific and technical activities, admin & support services and a small number of transport and storage, wholesale and retail trade and other services.
0% 10% 20% 30% 40% 50% 60%
Business & Other Services
Professional, scientific and technical activities
Administrative and support service activities
Financial and insurance activities
Information and communication
Manufacturing
Enterprise Ireland IDA Ireland Agency total

28
The distribution of approvals made by the agencies differs in some instances to the distribution of
payments (Diagram 23). However it is mainly the magnitude that differs rather than the sectoral
ordering. An instance where the sectoral ordering does change in comparison to approvals is for
Enterprise Ireland where the value of payments is greater in the financial and insurance sector than
in the information and communication.
Diagram 23: The sectoral distribution of payments
Source: Enterprise Ireland and IDA Ireland
Manufacturing is a sector which is a key focus for both Enterprise Ireland and IDA Ireland. Diagram 24
looks at which industries within manufacturing the selected enterprise agencies are supporting. For
IDA Ireland the main industry is other manufacturing (which includes medical devices). This accounts
for 50% of the payments made by IDA Ireland. This is followed by chemicals and pharmaceuticals
which has 32% of payments.
For Enterprise Ireland, the food and beverages industry accounts for 47% of payments made during
the years 2015-2020. This compares to 27% of clients being in this industry. Other industries to include
payments include computer, electronic, optical and electrical equipment with 11% and then
machinery and equipment with 10%.
0% 10% 20% 30% 40% 50% 60% 70%
Business & Other Services
Professional, scientific and technical activities
Administrative and support service activities
Financial and insurance activities
Information and communication
Manufacturing
Enterprise Ireland IDA Ireland Agency total

29
Diagram 24: The sectoral distribution of manufacturing payments
Source: Enterprise Ireland and IDA Ireland
The Restart Grant
The Restart Grant29 was a support to micro and small businesses to help with costs associated with
reopening and reemploying workers following COVID-19 closures. The total value of applications
for this support was just under €629m.
As this grant was not designed as a specific or long-term sectoral support but was more of a one-
off or short-term measure due to the effects of the COVID-19 restrictions on business operations,
the level of detail collected on recipients was not at the depth of normal support measures.
In terms of size, the criteria to qualify for support was limited to micro and small enterprises.
However the breakdown across both firm sizes was not recorded. Diagram 24 shows the regional
distribution of the grant. The distribution of the grant across the counties had a similar distribution
to the private enterprise base. Sectoral level data was not recorded.
29 This includes both the Restart Grant and the Restart Grant Plus.
0% 10% 20% 30% 40% 50% 60%
Basic metals and fabricated metal products
Machinery and equipment n.e.c.
Computer, electronic, optical and electrical equipment
Chemicals and pharmaceuticals
Food products and beverages
Other manufacturing
Enterprise Ireland IDA Ireland Agency total

30
Diagram 24: The regional distribution of the Restart Grant
Source: Department of Enterprise, Trade and Employment, and CSO
Liquidity Schemes The use of state supported lending in Ireland has evolved considerably since 2012 (Reidy, 2021).
The onset of the COVID-19 pandemic has seen the increased deployment of state supported lending
in Ireland. There has been over €1bn in approved state guaranteed loans.
90% of firms who are approved for loans are micro or small enterprises (Reidy, 2021). Sectors that
feature prominently in the utilisation of lending include Wholesale and Retail, Manufacturing,
Accommodation and Food, and Construction. These sectors are reflective of the overall Irish
enterprise base. The agricultural sector also features in certain lending schemes.
When looked at in totality lending from the guarantee schemes and Microfinance Ireland has a
strong presence in Dublin, Galway and Cork. However the overall level of approvals going to Dublin
(21%) from the combined guarantee schemes is less than the percentage of private enterprises
located in the county as discussed in Section 5. Also the regional distribution differs across schemes
with schemes such as the Future Growth Loan Scheme having a strong allocation in rural counties
such as Tipperary.
0%
5%
10%
15%
20%
25%
30%
35%
Car
low
Cav
an
Cla
re
Co
rk
Do
neg
al
Du
blin
Gal
way
Ker
ry
Kild
are
Kilk
en
ny
Lao
is
Leit
rim
Lim
eric
k
Lon
gfo
rd
Lou
th
May
o
Mea
th
Mo
nag
han
Off
aly
Ro
sco
mm
on
Slig
o
Tip
per
ary
Wat
erfo
rd
Wes
tme
ath
Wex
ford
Wic
klo
w
Restart Grant Private Enterprise Base

31
7. Policy considerations
1. Delivering on the National Planning Framework
The National Planning Framework (NPF) sets the vision and strategy for the development of the
country to 2040. Its aim is to ensure that as the population grows, that growth is sustainable in
economic, social and environmental terms. The population is projected to grow by 1 million during
this timeframe. Of this growth the NPF plans for 25% in Dublin, 25% across the other four cities
combined, and 50% of growth to occur in key regional centres, towns, villages and rural areas.
The enterprise agencies have a role to play in achieving this balanced development through the
creation of jobs across the counties. This paper outlines where the clients of agencies are currently
located and where the supports they deliver are being distributed. This gives the Department and the
agencies an opportunity to reflect on this distribution and consider if it is appropriate in the context
of the Government’s aim of balanced regional development.
In particular the distribution of supports by Enterprise Ireland shows that just under 50% of all
payments is currently going to clients located in Dublin (38%) or overseas (9%)30. This is also relevant
in the context of the recently revised Regional Aid Guidelines. These guidelines will enter into force
on 1 January 2022, and as part of this Member States must prepare their regional aid maps. Any
changes to these maps may have implications on where monies can flow and this paper gives the
Department and relevant agencies an overview of the current distribution.
2. Budgetary management of the enterprise agencies
This paper has found that the level of annual approvals each agency makes is greater than the level of
payments it makes across the years 2015-2020. This is particularly the case for IDA Ireland, where the
mean annual approval was €181 million in comparison to the mean annual payment of €96 million.
This means that over the time period studied IDA Ireland were making close to double the level of
approvals relative to the level of payments.
The Annual Exchequer Budget is undertaken on a cash accounting basis. Therefore it is important for
the enterprise agencies to ensure that the appropriate budgetary management procedures are in
place when it comes to approvals to avoid any build-up of future liabilities that may exceed the
agencies annual budgetary allocation.
30 The majority of this funding goes to overseas funds who then distribute this money back into Irish enterprises. Details on where the funding goes after it leaves the funds is not covered in this paper.

32
3. Appropriate data monitoring systems
Given the level of support that each of the agencies is providing to enterprises, it would be helpful for
each of them to reflect on the level of data they are collecting on their clients. This would assist with
evaluation. In particular, the Local Enterprise Offices were not in a position to provide sectoral level
data for the recipients of their supports. Maloney (2018) found similar data challenges with the Local
Enterprise Offices and reported that a new Customer Management Relationship System was to be
developed.
8. Conclusion
This paper has looked at the distribution of enterprise supports from Enterprise Ireland, IDA Ireland
and Local Enterprise Offices. It focused on how these supports were distributed at a firm, regional and
sectoral level. Micro and Irish owned firms receive the greatest percentage of supports in terms of the
number of firms who receive an approval or a payment from the combined selected enterprise
agencies. However, when one looks at the approval and payments in value terms, medium and large
firms receive a greater level of support on a proportionate basis, as do firms which are non-Irish.
IDA Ireland are more likely to support medium and large non-Irish owned firms. Enterprise Ireland
have a spread across micro, small and medium firms which are Irish owned and Local Enterprise
Offices focus solely on Irish owned micro businesses. This is aligned to the agency mandates.
At a regional level, the combined distribution of enterprise supports for most counties is similar to
how the overall enterprise base is distributed and how the overall agency client base is distributed.
Dublin, Cork and Galway are the counties which receive the greatest level of support in terms of
approvals and payments. Both Cork and Galway receive a greater proportion of approvals and
payments relative to their overall agency and private enterprise distribution.
Across agencies variances occur between the distribution of supports and the distribution of the
agency client base. For IDA Ireland, there is a significant variance in terms of Dublin. Although Dublin
has 55% of IDA Ireland clients, it receives 21% of the support provided by the agency. In contrast, Cork,
Galway, Limerick, Tipperary, and Waterford all receive a greater share of support in value terms from
IDA Ireland relative to the proportion of clients located in the county. The main variance within
Enterprise Ireland comes from its enterprises located overseas. Although they represent less than 1%
of its client base, they receive 9% of its payments in value terms. These payments mainly go to
overseas funds who then distribute the money to Irish firms.
The manufacturing sector receives the greatest level of support. However, within manufacturing the
targeting of support differs across the agencies. Enterprise Ireland has a strong focus on food products
33
and beverages. IDA Ireland focuses support on medical devices and pharmaceuticals. Other sectors
which benefit from supports are information and communication, and financial and insurance
activities.
The sectoral focus of Enterprise Ireland and IDA Ireland are not the sectors which are most prominent
in the Irish economy in terms of the overall private enterprise base and employment composition.
However, they are ones which are associated with high earnings and high gross value added.
The findings of this paper raise a number of considerations for the Department of Enterprise and the
selected enterprise agencies. These include aligning support provision with the goals of balanced
development, ensuring the appropriate budgetary management procedures are in place when it
comes to approvals, and having sufficient data monitoring systems in place.
References
Barrett, D. (2018) Dominant Cities in Small Advanced Economies: Challenges and Policy Responses.
Department of Business, Enterprise and Innovation. (2020) Review of the Disruptive Technologies
Innovation Fund.
Department of Business, Enterprise and Innovation (2019) Focused Policy Assessment of Capital,
Employment, and Training Supports: 2005/2006 – 2018.
Department of Enterprise, Trade and Employment. (2021) The Research and Development Budget
(R&D) 2019-2020.
Department of Enterprise, Trade and Employment. (2021) Capital Expenditure Review 2006-2020.
Department of Jobs, Enterprise and Innovation (2017) Review of Capital Expenditure on Research,
Development and Innovation (2000-2016).
Kane, F. and O'Callaghan, D. (2019) Enterprise, Employment and Income Framework: Overview of
IGEES Analysis.
Kane, F. and O'Callaghan, D. (2018) Overview of Enterprise Supports and the Labour Market.
Keogh, R., McDermott, C. and Behan, J. (2020) The Composition of Employment in Small and Large
Firms.
Keogh, R., Breen, B. and Gray, A. (2020) State-Supported Loan Schemes.
Keogh, R. and Brassill, C. (2018) Trend Analysis of IDA Ireland Expenditure.
Kirby, A. (2019) State Supported Loan Schemes: A Preliminary Analysis.
Moloney, A. (2018) Focused Policy Assessment of Start Up and Entrepreneurship Expenditure.
Morgenroth, E. (2018) Prospects for Irish regions and counties: scenarios and implications.
O'Callaghan, D., Kane, F. and Phulphager, R. (2019) Quality of Employment: Indicators and Trends.
Papa, J. (2019) What is behind aggregate productivity growth in Ireland? A granular approach.

34
Reidy, J. (2021) State Supported Loan Schemes II.
Reidy, P. (2017) An Assessment of the Rationale, Efficiency and Targeting of Supports in Enterprise
Ireland.
Technopolis and ESRI. (2020) Evaluation of the Enterprise Ireland Research, Development and
Innovation Programme
Appendix
Appendix 1: The manufacturing distribution of agency clients
Source: Enterprise Ireland, IDA Ireland and CSO.
0% 5% 10% 15% 20% 25% 30% 35% 40% 45%
Textiles and wearing apparel
Wood and wood products, except furniture
Rubber and plastic products
Paper and paper products printing and reproduction ofrecorded media
Other non-metallic mineral products
Machinery and equipment n.e.c.
Chemicals and pharmaceuticals
Basic metals and fabricated metal products
Computer, electronic, optical and electrical equipment
Other manufacturing
Food products and beverages
Enterprise Ireland IDA Ireland Agency Total Private enterprise base National employment

35
Appendix 2: Counties who have a variance between the private enterprise distribution and sectoral distribution of > 2% (Variances highlighted in yellow)
County Private Enterprise Distribution
Manufacturing (C)
Construction (F)
Wholesale & retail (G)
Transportation & storage (H)
Accommodation & food (I)
Information & communication (J)
Financial & insurance (K)
Real estate (L)
Professional, scientific & technical (M)
Administrative & support (N)
Education (P) and Health / Social Work (Q)
Arts, Entertainment & Recreation (R)
Other (S)
National 5% 17% 15% 8% 6% 5% 2% 4% 13% 5% 11% 3% 6%
Cork 11% 11% 11% 12% 9% 11% 8% 7% 10% 13% 10% 12% 10% 11%
Dublin 32% 20% 21% 26% 44% 21% 53% 61% 35% 41% 36% 31% 34% 26%
Kerry 3% 3% 4% 3% 2% 6% 2% 1% 3% 2% 3% 3% 4% 4%

36
Quality Assurance process To ensure accuracy and methodological rigour, the author engaged in the following quality assurance process.
Internal/Departmental
Line management
Spending Review Steering group
Other divisions/sections
Peer review (IGEES network, seminars, conferences etc.)
External
Other Government Department
Other Steering group
Quality Assurance Group (QAG)
Peer review (IGEES network, seminars, conferences etc.)
External expert(s)
Other (relevant details)

37
Tithe an Rialtas. Sráid Mhuirfean Uacht,
Baile Átha Cliath 2, D02 R583, Éire
Government Buildings, Upper Merrion Street,
Dublin 2, D02 R583, Ireland
T:+353 1 676 7571
@IRLDeptPer
www.per.gov.ie