spending on health in europe: entering a new era
TRANSCRIPT

Spending on health in Europe: entering a new era

WHO Barcelona Office for Health Systems Financing
© F
oto
: R
ob
ert
Ram
os/
FPH
SP
The WHO Barcelona Office is a centre of excellence in health financing for universal health coverage. It works with Member States across WHO’s European Region to promote evidence-informed policy making.
A key part of the work of the Office is to assess country and regional progress towards universal health coverage by monitoring financial protection – the impact of out-of-pocket payments for health on living standards and poverty. Financial protection is a core dimension of health system performance and an indicator for the Sustainable Development Goals.
The Office supports countries to develop policy, monitor progress and design reforms through health system problem diagnosis, analysis of country-specific policy options, high-level policy dialogue and the sharing of international experience. It is also the home for WHO training courses on health financing and health systems strengthening for better health outcomes.
Established in 1999, the Office is supported by the Government of the Autonomous Community of Catalonia, Spain. It is part of the Division of Country Health Policies and Systems of the WHO Regional Office for Europe.
2

Spending on health in Europe: entering a new era

Spending on health in Europe: entering a new era
ISBN 9789289055079
Address requests about publications of the WHO Regional Office for Europe to:
Publications WHO Regional Office for Europe UN City, Marmorvej 51 DK-2100 Copenhagen Ø, Denmark
Alternatively, complete an online request form for documentation, health information, or for permission to quote or translate, on the Regional Office website (http://www.euro.who.int/pubrequest).
© World Health Organization 2021 Suggested citation. Spending on health in Europe: entering a new era. Copenhagen: WHO Regional Office for Europe; 2021. License: CC BY-NC-SA 3.0 IGO.
All rights reserved. The Regional Office for Europe of the World Health Organization welcomes requests for permission to reproduce or translate its publications, in part or in full.
The designations employed and the presentation of the material in this publication do not imply the expression of any opinion whatsoever on the part of the World Health Organization concerning the legal status of any country, territory, city or area or of its authorities, or concerning the delimitation of its frontiers or boundaries. Dotted lines on maps represent approximate border lines for which there may not yet be full agreement.
The mention of specific companies or of certain manufacturers’ products does not imply that they are endorsed or recommended by the World Health Organization in preference to others of a similar nature that are not mentioned. Errors and omissions excepted, the names of proprietary products are distinguished by initial capital letters.
All reasonable precautions have been taken by the World Health Organization to verify the information contained in this publication. However, the published material is being distributed without warranty of any kind, either express or implied. The responsibility for the interpretation and use of the material lies with the reader. In no event shall the World Health Organization be liable for damages arising from its use. The views expressed by authors, editors, or expert groups do not necessarily represent the decisions or the stated policy of the World Health Organization.
Design and typesetting by Aleix Artigal and Alex Prieto.

This report analyses health spending in 53 countries in the WHO European Region from 2000 to 2018 (the latest year for which internationally comparable data are available). It reviews key patterns and trends in health spending over time and across countries in the following areas: health spending before the COVID-19 pandemic; the priority given to health in government budgets; the adverse effects of out-of-pocket payments on financial protection; compulsory health financing arrangements and their impact on progress towards universal health coverage; spending on primary health care; the implications of COVID-19 for health spending; and the role of public policy in mitigating the negative effects of the pandemic and building health system resilience.
EUROPE GLOBAL HEALTH EXPENDITURE DATABASE HEALTHCARE FINANCING HEALTH EXPENDITURES SYSTEM OF HEALTH ACCOUNTS UNIVERSAL COVERAGE
Abstract & keywords


Contents
Chapter 1. Health spending before the COVID-19 pandemic 1 Chapter 2. Spending on health is a political choice 15 Chapter 3. The evolution of compulsory health financing 29 Chapter 4. Tracking PHC spending and its priority in government budgets 47 Chapter 5. COVID-19: implications for health spending 61 References 81 Annex 1. Country income group classification for 2018 90 Annex 2. Data availability by health care functions in 2018 92
Figures, tables & boxes viiAcknowledgements ixAbbreviations xiForeword xiiiExecutive summary xvIntroduction xxi
v


Figures
Fig. 1.1 Real growth in current spending on health and GDP per person in the European Region by country income group, 2000–2018 6
Fig. 1.2 Current spending on health per person in the European Region, 2018 7
Fig. 1.3 Relationship between current spending on health as a share of GDP and country income level in the European Region, 2018 8
Fig. 1.4 Real growth in public spending on health and out-of-pocket payments per person in the European Region by country income group, 2000–2018 10
Fig. 1.5 Public spending on health and out-of-pocket payments as a share of current spending on health in the European Region, 2000–2018 11
Fig. 1.6 Health spending by source of revenue in the European Region, 2018 12
Fig. 1.7 External funding as a share of current spending on health in selected countries, 2010–2018 13
Fig. 2.1 Cumulative growth in current spending on health and GDP per person in the European Region, 2000–2018 19
Fig. 2.2 Cumulative growth in public spending on health and out-of-pocket payments per person in the European Region, 2000–2018 19
Fig. 2.3 Relationship between public spending on health and government spending as a share of GDP in the European Region, 2018 21
Fig. 2.4 Relationship between public spending on health as a share of government spending on health and government spending as a share of GDP in the European Region, 2000-2018 22
Fig. 2.5 Public spending on health as a share of government spending in the European Region, 2000–2018 23
Fig. 2.6 Public spending on health as a share of government spending in the European Region, 2018 23
Fig. 2.7 Incidence of catastrophic health spending and out-of-pocket payments as a share of current spending on health in the European Region, latest year available 26
Fig. 2.8 Out-of-pocket payments as a share of current spending on health in the European Region, 2018 27
Fig. 2.9 Relationship between public spending on health and out-of-pocket payments in the European Region, 2018 28
Fig. 3.1 Compulsory health spending as a share of current spending on health in the European Region by country income group, 2018 34
Fig. 3.2 Compulsory spending on health in the European Region by type of scheme and country income group, 2000–2018 37
Fig. 3.3 Cumulative growth in compulsory spending on health and out-of-pocket payments per person in the European Region by main compulsory health financing arrangement, 2000–2018 39
Fig. 3.4 Compulsory spending on health in countries in the European Region mainly financed through SHI schemes, and breakdown of SHI scheme revenue into government budget transfers and social insurance contributions, 2018 39
Fig. 3.5 Population coverage in the European Region by main compulsory health financing arrangement, latest year available 41
Fig. 3.6 Service coverage index and the compulsory share of current spending on health in the European Region by main compulsory health financing arrangement, 2018 44
Fig. 3.7 Catastrophic health spending and the compulsory share of current spending on health in the European Region by main compulsory health financing arrangement, 2018 45
vii

Tables
Table 1.1 Key health spending indicators, 2000–2018 5
Table 3.1 Characteristics of compulsory health financing arrangements in the European Region, 2018 33
Table 3.2 Shifts in compulsory health financing arrangements in the European Region 36
Boxes
Box 1.1 What is SHA? 4
Box 1.2 External funding for health in Kyrgyzstan 14
Box 2.1 Financial protection – a core dimension of UHC 24
Box 3.1 Problems that occur when health systems base entitlement to publicly financed health care on payment of contributions rather than on residence 42
Box 5.1 Health system costs associated with service disruption and other factors relating to COVID-19 in the United Kingdom (England) 68
Fig. 4.1 PHC spending as a share of current spending on health in the European Region, 2018 52
Fig. 4.2 Relationship between PHC spending as a share of current spending on health and country income level in the European Region, 2018 53
Fig. 4.3 PHC spending per person in the European Region, 2018 54
Fig. 4.4 Composition of PHC spending in the European Region, 2018 54
Fig. 4.5 Relationship between spending on medicines and medical goods as a share of PHC spending and country income level in the European Region, 2018 55
Fig. 4.6 PHC spending as a share of public spending on health in the European Region, 2018 56
Fig. 4.7 Public spending on PHC as a share of GDP in the European Region, 2018 56
Fig. 4.8 Public spending on PHC as a share of PHC spending in the European Region, 2018 57
Fig. 4.9 Composition of public spending on PHC in the European Region, 2018 58
Fig. 4.10 Public spending as a share of spending on selected PHC categories in the European Region, 2018 58
Fig 4.11 Breakdown of out-of-pocket payments by health service among households with catastrophic health spending in the European Region 59
Fig. 5.1 Actual and projected annual change in GDP in the European Region by country income group 64
Fig. 5.2 Actual and projected unemployment rate in the European Region by country income group 65
Fig. 5.3 Spending on health per person in the European Region by country income group 66
Fig. 5.4 Potential sources of pressure on health budgets in the context of COVID-19 67
Fig. 5.5 Change in GDP, public spending on health and out-of-pocket payments in the European Region 69
Fig. 5.6 Changes in public spending on health and out-of-pocket payments per person in the European Region 71
Fig. 5.7 Change in catastrophic health spending and unmet need for health care due to cost, distance and waiting time in Greece, 2008–2018 75
Fig. 5.8 Out-of-pocket payments as a share of current spending on health in 2018 and estimated GDP growth in 2020 in the European Region 77
viii

Acknowledgements
This report was produced by the WHO Barcelona Office for Health Systems Financing, which is part of the Division of Country Health Policies and Systems in the WHO Regional Office for Europe. It was written by Triin Habicht, Sarah Thomson, Jorge Alejandro García-Ramírez and Baktygul Akkazieva, and produced under the technical leadership of Tamás Evetovits (WHO Barcelona Office).
The authors are grateful to Maria Aranguren Garcia, Julien Dupuy, Natalja Eigo, Joseph Kutzin, Andrew Siroka and Ke Xu (WHO headquarters) and Melitta Jakab (WHO European Centre for Primary Health Care) for their helpful comments and technical guidance.
Thanks are also extended to Jens Wilkens (Health Financing Analyst) and David Gzirishvili (Consulting Group Curatio Sarl) for reviewing an earlier draft of the report and providing valuable feedback.
ix


COVID-19EUFS
GDPHCHF
HPIMFOECD
PHCPHISDGSHASHISWApUHC
coronavirus diseaseEuropean Unioncurrent health spending by revenue of financing schemesgross domestic producthealth care function [classification]current health spending by financing schemeshealth provider [classification]International Monetary FundOrganisation for Economic Co-operation and Developmentprimary health careprivate health insuranceSustainable Development Goalsystem of health accountssocial health insurancesector-wide approachuniversal health coverage
Abbreviations
xi

ALBANDARMAUTAZEBELBIHBLRBULCROCYPCZHDENDEUESTFINFRAGEOGREHUNICEIREISRITAKAZKGZLTULUXLVAMATMDAMKDMNEMONNETNORPOLPORROMRUSSMRSPA
SRBSVKSVNSWESWITJKTKMTURUKRUNKUZB
AlbaniaAndorraArmeniaAustriaAzerbaijanBelgiumBosnia and HerzegovinaBelarusBulgariaCroatiaCyprusCzechiaDenmarkGermanyEstoniaFinlandFranceGeorgiaGreeceHungaryIcelandIrelandIsraelItalyKazakhstanKyrgyzstanLithuaniaLuxembourgLatviaMaltaRepublic of MoldovaNorth MacedoniaMontenegroMonacoNetherlandsNorwayPolandPortugalRomaniaRussian FederationSan MarinoSpain
SerbiaSlovakiaSloveniaSwedenSwitzerlandTajikistanTurkmenistanTurkeyUkraineUnited KingdomUzbekistan
xii
Foreword
This new report on health spending in Europe could not be more timely, coming at a moment when countries across the WHO European Region are making huge efforts to address the health and economic shock of coronavirus disease (COVID-19) and to build their plans for recovery. It is a difficult moment. Although the pandemic has shown us the importance of good health – for people, society and the economy – and the vital role public social spending plays in securing good health, it has added to the budgetary pressure many governments face.
As countries think carefully about the recovery, the report’s analysis – the first to cover health spending in all 53 Member States across nearly two decades – allows us to:
• take stock of regional progress towards universal health coverage (a core priority of WHO’s European Programme of Work, 2020–2025);
• track how much countries in the European Region are spending on primary health care (another first) using a global definition to enable international comparison;
• understand the implications for today of shifts in health spending during and after the economic shock of the 2008 global financial crisis; and
• identify ways in which health financing policy can mitigate the negative effects of COVID-19 and build health system resilience.
Public spending on health in Europe grew steadily before the global financial crisis. During the crisis there was a significant shift away from public spending on health, which was not reversed in the post-crisis period. Austerity in the health sector – budget cuts and coverage restrictions – undermined national and regional progress towards universal health coverage, pushing health care costs onto households, increasing out-of-pocket payments, unmet need and financial hardship, and exacerbating socioeconomic inequalities within and across countries. In 2018 out-of-pocket payments were still the dominant source of health financing in almost all lower-middle-income countries and a third of upper-middle-income countries.
Health systems were not as well equipped to meet the challenges posed by COVID-19 as they might have been in the absence of austerity. To avoid the mistakes of the past, governments will need to invest more publicly in health now and in the years ahead – even as they face growing budgetary pressure – to address the backlog created by disruption to health services,
xiii

mitigate the negative health effects of foregone care, unemployment and poverty, and strengthen preparedness for future shocks. Governments also need to pay attention to how health system resources are used, to avoid any further widening of inequalities.
For many countries in the European Region, the health spending starting point is challenging. Health systems characterized by low levels of public spending on health, high out-of-pocket payments and heavy reliance on employment (social health insurance schemes), without countercyclical mechanisms, are particularly vulnerable to health and economic shocks. The report sets out steps countries can take to build health system resilience. These include broadening the public revenue base for the health system and strengthening automatic stabilizers to make health spending more countercyclical; de-linking access to health services from health insurance status so that people do not lose coverage when they most need it; re-designing co-payment policy to protect people at risk of poverty or social exclusion and people with chronic conditions; reprioritizing the government budget to secure sustained increases in public spending on health; and using priority-setting processes and other instruments to ensure additional public investment in the health system meets equity and efficiency goals.
WHO calls on countries to allocate an extra 1% of gross domestic product to primary health care as a cost-effective way of speeding up progress towards universal health coverage. Public investment in primary health care offers the potential to improve access to services in middle-income countries, to enhance the quality and efficiency of people-centred services in high-income countries and to improve financial protection in all countries, especially if accompanied by efforts to strengthen coverage policy.
The report’s findings underline the importance of making health a political priority, echoing a call to action from the Pan-European Commission on Health and Sustainable Development convened by the WHO Regional Office for Europe. Governments willing to put health and well-being at the heart of the recovery from COVID-19 should find strong support from international financial institutions and the public. Multilateral agencies now recognize the damage austerity caused after the global financial crisis, while survey after survey shows the extent to which people value public investment in health and other social sectors. To achieve this, however, will require a combination of political will, better tax systems and international solidarity.
Hans Henri P. KlugeWHO Regional Director for Europe
Natasha Azzopardi-Muscat Director of the Division of Country Health Policies and Systems WHO Regional Office for Europe
xiv

Executive summary
Health spending before the COVID-19 pandemic
Before the COVID-19 pandemic the health sector was growing faster than the economy. This led to a rise in the health share of gross domestic product (GDP) from 6.4% in 2000 to 7.5% in 2018. In absolute numbers, current spending on health increased from US$ 1.4 trillion to US$ 2.2 trillion (in constant 2018 dollars).
The amount high- and middle-income countries spend on health is converging but large inequalities across countries persist. Spending on health grew at a much faster rate in middle-income than high-income countries. As a result, the difference in health spending per person between high- and lower-middle-income countries fell from 51 times in 2000 to 28 times in 2018.
Although the health sector has grown, many countries still rely heavily on out-of-pocket payments. In 2018 public spending on health accounted for 64% of current health spending in the WHO European Region and out-of-pocket payments for 30%. These shares did not change over time, as out-of-pocket payments per person grew faster than public spending on health in upper-middle-income countries.
Out-of-pocket payments continue to be the dominant source of financing in almost all lower-middle-income and a third of upper-middle-income countries, indicating slow progress towards universal health coverage (UHC). The past 10 years has seen no or very limited change in the pattern of heavy reliance on out-of-pocket payments, making it difficult to realize significant progress towards UHC. Although many countries have increased public spending on health, which is critical for UHC, they also need to pay attention to reducing out-of-pocket payments to counter unmet need for health and dental care and financial hardship for people using health services. Both of these negative outcomes disproportionately affect poorer households and other groups of people in vulnerable situations.
The role of external funding in low- and middle-income countries has decreased, indicating a lower level of international solidarity, but remains important. In 2018 external funding for health totalled US$ 1 billion in the European Region. It plays a more significant role in low- and lower-middle-income countries, where it accounted for 3% of current spending on health in 2018 (down from 6% in 2010).
xv

Spending on health is a political choice
Spending on health has grown faster than the economy in most countries in the European Region. In 11 countries, however, the economy grew at a faster pace than current health spending, suggesting that some countries did not take full advantage of growing economic and fiscal capacity to invest in health.
Public spending on health has grown faster than out-of-pocket spending but mainly in high-income countries. Although current health spending grew in almost all countries, the public share of health spending only increased in 31 out of 52 countries. Public spending on health per person grew at a faster rate than out-of-pocket payments in 29 mainly high-income countries, reflecting cross-country differences in fiscal capacity and in political choices about public spending priorities.
There is large variation in how much of the government budget countries allocate to health. In 2018 the share of the government budget allocated to health ranged from less than 3% in Azerbaijan to 23% in Germany and Ireland. It was less than 12% in all lower-middle-income countries, most upper-middle-income countries and a quarter of high-income countries. The gap between high-income and upper-middle-income countries in the priority given to health when allocating the government budget has increased over time.
High out-of-pocket spending weakens financial protection. The incidence of catastrophic health spending is generally low in countries where out-of-pocket payments account for less than 15% of current spending on health. In 2018 the out-of-pocket payment share was over 15% in 40 out of 53 countries. Across countries, public spending on health is shown to be much more effective in reducing out-of-pocket payments than voluntary health insurance. To strengthen financial protection, improve access to health services and make progress towards UHC and the Sustainable Development Goals (SDGs), countries need to invest more publicly in the health system and pay careful attention to the design of coverage policy.
Spending on health is in large part a political choice reflecting decisions about how much of the government budget to allocate to health and coverage policy designed to reduce out-of-pocket spending. Although fiscal capacity is more limited in middle-income countries, governments in countries in all income groups have choices. Some governments have not sustained or increased the health share of public spending, even as fiscal capacity has increased. Giving greater priority to health in middle-income countries would narrow the gap with high-income countries, allowing the European Region to enter a new era in which public spending on health reflects political priorities not just economic development.
xvi

The evolution of compulsory health financing
Countries in the European Region mainly organize compulsory health financing through government schemes or social health insurance (SHI) schemes. Only two countries have opted to organize compulsory health financing through private health insurance (PHI) schemes.
The type of compulsory health financing scheme in place (government, SHI or compulsory PHI) can be explained historically and has changed over time. Some countries – mainly in western Europe – have moved away from employment-based arrangements to extend health coverage to the whole population. Other countries – all located outside western Europe – re-introduced employment-based schemes in an attempt to secure additional public investment in health or overcome the rigidity of public financial management rules.
The SHI scheme share of compulsory spending on health has fallen in high-income countries and is now highest in upper-middle-income countries. In 2018 the SHI scheme share of compulsory spending on health was highest in upper-middle-income countries and lowest in lower-middle-income countries.
SHI schemes are typically financed through a combination of social insurance contributions and transfers from the government budget. When spending through SHI schemes is broken down by revenue source, it becomes clear that the government budget is a significant source of SHI scheme revenue in many countries in all country income groups.
Gaps in population coverage are larger in countries that are mainly financed through SHI schemes. This clear pattern is a consequence of policy choices. In government schemes entitlement is usually based on residence, whereas SHI schemes generally base entitlement on employment status and payment of contributions, which systematically disadvantages people in vulnerable situations. To make progress towards UHC, some countries with SHI schemes have changed the basis for entitlement from payment of contributions to residence.
There are no systematic differences in UHC as measured through the service coverage index or the share of households with catastrophic health spending between countries with government schemes and SHI schemes. The extent to which a country relies on compulsory spending on health rather than out-of-pocket payments, and the design of coverage policy, have more impact on UHC performance than the way in which compulsory spending on health is financed.
xvii

Conventional distinctions between SHI and tax-financed schemes are no longer meaningful. These classifications do not determine sources of revenue and they mask the fact that all forms of compulsory pre-payment with risk pooling offer people insurance. The key question for policy is how well different health systems do in meeting the UHC goals of universal access to health services with financial protection. By broadening the public revenue base to encompass transfers from the government budget and de-linking entitlement to health care from payment of contributions, some countries have removed the two key features of traditional SHI schemes that limit progress towards UHC. In a new era of health financing for UHC, removing these barriers will be an essential part of health system reforms.
Tracking primary health care spending and its priority in government budgets
Information on primary health care (PHC) spending and how this spending is financed is vital for monitoring country and regional progress towards UHC. Monitoring PHC spending – particularly public spending on PHC – shows the priority countries give to ensuring everyone can use the PHC services they need without financial hardship. Tracking PHC spending in a standard way across countries highlights the patterns and differences in PHC spending and identifies where progress is needed. Nearly 40 countries in the European Region collect data on PHC spending using the System of Health Accounts (SHA) 2011 framework, but there is room for improvement. Eight of these countries also report PHC spending by financing source, allowing them to track public spending on PHC. This analysis demonstrates the diversity of PHC spending in the European Region. It also highlights gaps in reporting by countries and the need for better quality data collection methods that increase international comparability.
PHC accounts for less than half of current spending on health. On average PHC spending accounted for 42% of current spending on health in the 37 countries that report these data, but there is considerable variation across countries. Switzerland spends the most per person (US$ 3923) and Tajikistan the least (US$ 27). The composition of PHC spending also differs across countries. General outpatient care and outpatient medicines account for the largest share of PHC spending.
The priority countries give to PHC when allocating government spending on health varies substantially. Among the eight countries for which PHC spending data are available by financing source, the public share of PHC spending ranges from 42% in Armenia to 12% in Georgia. Public spending on PHC as a share of GDP ranges from 1.2% in the Republic of Moldova and the Russian Federation to 0.3% in Georgia. If these countries invested an additional 1% of GDP in PHC, it would result in an extra US$ 32, US$ 44 and US$ 115 spent publicly per person on PHC in the Republic of Moldova, Georgia and the Russian Federation respectively.
xviii

WHO calls on all countries to invest an additional 1% of GDP in PHC. Spending more publicly on PHC is the most cost-effective way to make progress towards UHC. It offers the potential to improve access to services in middle-income countries, to enhance the quality and efficiency of people-centred services in high-income countries and to improve financial protection in all countries, especially if accompanied by efforts to strengthen coverage policies. By carefully tracking PHC spending and increasing public spending on PHC by an additional 1% of GDP, countries will enter a new era in health financing.
COVID-19: implications for health spending
Failure to control COVID-19 has led to the deepest economic shock in decades. It has not only hit countries harder than the global financial crisis but also affects a much wider group of countries in the European Region. Without urgent and substantial policy intervention, the economic recovery may take longer and be more uneven than forecasts predict, exacerbating socioeconomic inequalities within and between countries.
Countries were quick to mobilize additional funds for the health system in 2020. This higher level of public investment will need to be sustained in the years ahead to treat and prevent COVID-19, address the backlog created by widespread disruption to health services, mitigate the negative health effects of foregone care, unemployment and poverty and strengthen preparedness for future shocks.
Health financing policy is less resilient to economic shocks in countries where levels of public spending on health are low as a share of GDP and out-of-pocket payments are high, implying significant gaps in health coverage. Health systems are also vulnerable to economic shocks if public spending on health relies heavily on employment (SHI schemes), entitlement to health services is linked to health insurance status, and countercyclical mechanisms to mitigate the effects of rising unemployment and falling wages are lacking or weak.
Well-designed public policy can mitigate the negative effects of COVID-19 and build health system resilience. Key steps countries can take include: broadening the public revenue base for the health system; introducing and strengthening automatic stabilizers; de-linking access to health services from health insurance status; re-designing co-payment policy to protect people at risk of poverty or social exclusion and people with chronic conditions; reprioritizing the government budget to ensure sustained increases in public spending on health; and using priority-setting processes and other instruments to ensure additional public investment in the health system meets equity and efficiency goals.
xix

Countries may find it challenging to invest more publicly in health as government revenue falls, but austerity is not a viable option. Austerity in the health sector in response to the global financial crisis slowed public spending on health, undermined progress towards UHC and increased socioeconomic inequalities. Two factors offer support to governments willing to put improving people’s lives and livelihoods at the heart of the recovery from COVID-19. First, international financial institutions strongly encourage countries to continue to invest in health systems now, recognizing the damage austerity has caused and the importance of the health sector to societal well-being, economic development and resilience to future shocks; they should continue to support careful investment in health and well-being in the longer-term. Second, this shift in thinking is closely aligned with public preferences. Survey after survey carried out in the last 10 years has shown the extent to which people value good access to health care.
There is no economic recovery without health security. Health security requires political will, better tax systems and international solidarity. Many of the things people value most in life can only be achieved through the actions of well-resourced governments. All countries will benefit from efforts to reform tax systems so that they are more effective, fairer, better able to redistribute resources and aligned with policies that promote health and well-being. Increased investment in health and other social sectors is unlikely to be possible in all parts of the European Region without greater international solidarity.
xx

This report analyses health spending in 53 countries in the WHO European Region from 2000 to 2018 (the latest year for which internationally comparable data are available), drawing on data from WHO’s Global Health Expenditure Database (WHO, 2020a).
Its aims are to review key patterns and trends in health spending over time and across countries before the COVID-19 pandemic, understand the impact of changes in health spending on progress towards UHC, and identify the implications of COVID-19 for health spending in the medium and longer-term. Moving towards UHC is a Sustainable Development Goal and a core priority of WHO’s European Programme of Work, 2020–2025 (WHO Regional Office for Europe, 2021).
Chapter 1 provides an overview of patterns and trends in health spending before the COVID-19 pandemic. It looks at average annual changes in public and private spending on health and shifts in the breakdown of current health spending by source of revenue across the whole of the European Region, then briefly reviews the role of external funding in low- and middle-income countries.
Chapter 2 looks at cumulative changes in public spending on health and out-of-pocket payments by country. It explores how levels of public spending on health are influenced by political priorities and examines the adverse effects of out-of-pocket payments on financial protection (a core dimension of UHC).
Chapter 3 focuses on compulsory health financing arrangements. The first part of the chapter reviews shifts in compulsory health financing over time, highlighting the role of history – path dependency – in determining current arrangements. The second part of the chapter considers the impact of different compulsory arrangements on indicators of UHC.
Chapter 4 provides an overview of how much countries spend on PHC and the priority given to PHC in government budgets. Information on PHC spending and how this spending is financed is vital for monitoring country and regional progress towards UHC.
Chapter 5 considers the implications of the COVID-19 pandemic for health spending in the medium and longer-term, drawing on changes in health spending during and after the 2008 global financial crisis. It sets out ways in which well-designed public policy can mitigate the negative effects of COVID-19 and build health system resilience.
Introduction
xxi


Chapter 1
Health spending before the COVID-19 pandemic


Summary Before the COVID-19 pandemic the health sector was growing faster than the economy. This led to a rise in the health share of GDP from 6.4% in 2000 to 7.5% in 2018. In absolute numbers, current spending on health1 increased from US$ 1.4 trillion to US$ 2.2 trillion (in constant 2018 dollars).
The amount high- and middle-income countries spend on health is converging but large inequalities across countries persist. Spending on health grew at a much faster rate in middle-income than high-income countries. As a result, the difference in health spending per person between high- and lower-middle-income countries fell from 51 times in 2000 to 28 times in 2018.
Although the health sector has grown, many countries still rely heavily on out-of-pocket payments. In 2018 public spending on health accounted for 64% of current health spending2 in the WHO European Region and out-of-pocket payments for 30%. These shares did not change over time, as out-of-pocket payments per person grew faster than public spending on health in upper-middle-income countries.
Out-of-pocket payments continue to be the dominant source of financing in almost all lower-middle-income and a third of upper-middle-income countries, indicating slow progress towards UHC. The past 10 years has seen no or very limited change in the pattern of heavy reliance on out-of-pocket payments, making it difficult to realize significant progress towards UHC. Although many countries have increased public spending on health, which is critical for UHC, they also need to pay attention to reducing out-of-pocket payments to counter unmet need for health and dental care and financial hardship for people using health services. Both of these negative outcomes disproportionately affect poorer households and other groups of people in vulnerable situations.
The role of external funding in low- and middle-income countries has decreased, indicating a lower level of international solidarity, but remains important. In 2018 external funding for health totalled US$ 1 billion in the European Region. It plays a more significant role in low- and lower-middle-income countries, where it accounted for 3% of current spending on health in 2018 (down from 6% in 2010).
1. This report uses current health spending by revenue of financing schemes (FS) and current health spending by financing schemes (HF) (OECD, Eurostat & WHO, 2011).
2. Current spending on health refers to funds dedicated to health services, excluding capital investment.
Spending on health in Europe: entering a new era 3

Before the COVID-19 pandemic the health sector was growing faster than the economy This chapter explores patterns and trends in health spending from different sources in the WHO European Region using the SHA methodology (Box 1.1).3 Before the COVID-19 pandemic the health sector was growing faster than the economy. As a result, the current health spending share of GDP4 rose from 6.4% in 2000 to 7.5% in 2018 (Table 1.1).
3. Data on small countries should be interpreted with particular caution.
4. GDP is the sum of final consumption, gross capital formation (investment) and net exports. Final consumption includes goods and services used by households or the community to satisfy their individual needs. It includes the final consumption expenditure of households, general government and non-profit institutions serving households.
In 2011 the Organisation for Economic Co-operation and Development (OECD), Eurostat and WHO released an updated manual for the collection of health accounts, A system of health accounts: 2011 edition. The core set of SHA tables addresses three basic questions.
• What kinds of health care goods and services are consumed?
• Which health care providers deliver these goods and services?
• Which financing schemes pay for these goods and services?
Health accounts provide a systematic description of financial flows related to the consumption of health care goods and services. Their basic intent is to describe a health system from a spending perspective.
As more countries implement and institutionalize health accounts, there are increased expectations from analysts, policy-makers and the general public alike for the more sophisticated information that can be gained through the greater volume of health spending data now available. Health accounts are increasingly expected to provide inputs (along with other statistical information) into improved analytical tools to monitor and assess health system performance.
A key priority is to develop reliable and timely data that are comparable across countries and over time. This is indispensable for in depth analysis of trends in health spending and the factors that drive health spending within countries, which can in turn be used to compare health spending across countries and project how it will grow in the future. Health accounts are crucial for all of these uses.
Box 1.1 What is SHA? Source: OECD, Eurostat & WHO (2011).
Spending on health in Europe: entering a new era 4

Across the European Region, current health spending per person grew in real terms by 2.3% a year between 2000 and 2018, while GDP per person grew by 1.5% (Fig. 1.1).5 The increase in current health spending varies by country income group6 and was fastest in lower-middle-income countries, where it rose by 5.7% a year, while GDP grew by 3.9%. In upper-middle-income countries current health spending per person rose by 4.9% a year, while GDP grew by 4.6%. In high-income countries current health spending per person grew by 2.1% and GDP by 1.3%.
5. Average annual growth is calculated as the compound annual rate of growth in constant 2018 US$ per person.
6. Annex 1 shows the 2018 World Bank country income group classification of countries in the European Region (World Bank, 2021). This report includes Tajikistan (a low-income country) in the lower-middle-income group.
Table 1.1 Key health spending indicators, 2000–2018 Note: the table does not include data for Montenegro (a lower-middle-income country).
Source: WHO (2020a).
Indicator Lower-middle-income countries (n=5)
Upper-middle-income countries (n=14)
High-income countries (n=33)
WHO European Region (n=52)
2000 2018 2000 2018 2000 2018 2000 2018
Current spending on health (% of GDP)
4.8 6.7 5.8 6.2 7.0 8.2 6.4 7.5
Current spending on health per person (constant 2018 US$)
50 134 186 443 2 523 3 700 1 656 2 480
Public spending (% of current spending on health)
40.9 42.5 50.7 53.0 72.0 71.9 63.3 64.0
Public spending (% of government spending)
6.7 8.6 9.0 10.0 12.5 14.2 11.0 12.5
Out-of-pocket payments (% of current spending on health)
57.4 54.1 44.0 43.5 21.4 20.0 30.9 29.6
Spending on health in Europe: entering a new era 5

The amount high- and middle-income countries spend on health is converging but large inequalities across countries persist Between 2000 and 2018 the growth in current health spending per person in middle-income countries was more than double the growth in high-income countries (Fig. 1.1). As a result, levels of health spending in high- and middle-income countries are converging: the difference between current health spending per person in high- and lower-middle-income countries has decreased from 51 to 28 times higher in high-income countries.
Still, inequality in health spending across countries persists. In 2018 Switzerland spent US$ 9870 per person on health, which was nearly four times more than the regional average of US$ 2480 (Table 1.1), while Tajikistan spent US$ 60 per person, which was 40 times less than the regional average (Fig 1.2).
WHO European Region
2.3
1.5
HIC
2.1
1.3
Fig. 1.1 Real growth in current spending on health and GDP per person in the European Region by country income group, 2000–2018
Ave
rag
e a
nn
ua
l gro
wth
(%
)
Notes: HIC: high-income countries; LMIC: lower-middle-income countries; UMIC: upper-middle-income countries. No data for Montenegro (UMIC).
Source: WHO (2020a).
GDP
Current health spending
UMIC
4.94.6
LMIC
5.7
3.9
Spending on health in Europe: entering a new era 6

Social and economic context and the priority governments give to the health sector when allocating public resources (see Chapter 2) play a role in influencing how much a country spends on health and the speed at which health spending is growing. Wealthier countries tend to spend a greater share of their GDP on health compared to middle-income countries but there are large variations among countries with similar income levels (Fig. 1.3). For example, Bulgaria spent almost twice as much of its GDP on health than Turkey in 2018, despite having a similar level of GDP per person.
Fig. 1.2 Current spending on health per person in the European Region, 2018
Notes: HIC: high-income countries; LMIC: lower-middle-income countries; UMIC: upper-middle-income countries. Tajikistan (a low-income country) is included in the LMIC group.
Source: WHO (2020a).
UK
RM
DA
KG
ZU
ZB
TJK
MN
EB
UL
RO
MSR
BR
US
BIH
TKM
AR
MM
KD
TUR
BLR
GE
OK
AZ
ALB
AZ
E
SWI
NO
RIC
ELU
XD
EN
SWE
IRE
DE
UA
UT
NE
TB
EL
FRA
FIN
UN
KSM
RIS
RIT
AM
ON
AN
DM
AT
SPA
PO
RSV
NC
YP
CZ
HG
RE
EST
SVK
LTU
LVA
HU
NC
RO
PO
L
0
3 000
10 000
6 000
9 000
7 000
8 000
5 000
4 000
2 000
1 000
LMIC UMIC HIC
US$
per
per
son
Spending on health in Europe: entering a new era 7

Fig. 1.3 Relationship between current spending on health as a share of GDP and country income level in the European Region, 2018
Cu
rren
t sp
end
ing
on
hea
lth
as
a s
ha
re o
f G
DP
(%
)
GDP per person (US$)
0 10 000 20 000 30 000 40 000 50 000 60 000 70 000 80 000 90 000
2
0
4
6
8
10
12
14
Source: WHO (2020a).
SPA MAT
ITA
AND
ISR
FIN
UNK
FRA
DEU
SWE
DEN
SWI
NOR
ICE
IRE
AUT
NET
BEL
SMR
ARM
BIHSRB
MNEUKR
GEO BULTJK
MKDMDA
UZB ALB
AZE
KAZ
TUR
RUSROM
LVA
ESTCYP
LTU
SVK
GRE CZHSVN
POR
POL
HUNCRO
KGZ TKM
BLR
Spending on health in Europe: entering a new era 8

Although the health sector has grown, many countries still rely heavily on out-of-pocket payments Health systems are financed from public, private and external sources. Public sources consist of various forms of tax revenues, including individual income and consumption taxes (Jowett & Kutzin, 2015). SHI contributions are also taxes, typically in the form of payroll taxes, and counted as public revenues. Private revenues come from two main sources: out-of-pocket payments (direct payments by individuals for health services at the point of use of services) and voluntary prepayment for health insurance. Revenues from external sources mainly include development assistance for health, which can flow through government or nongovernment channels (WHO, 2018).
The composition of health financing sources affects health system performance and a country’s ability to progress towards UHC (WHO, 2010). While private sources play a role in all health systems, evidence shows that public, compulsory and prepaid financing helps countries to make progress towards UHC. Low levels of public spending on health are associated with weak financial protection and high levels of unmet need for health services, particularly among poorer households and other people in vulnerable situations (WHO Regional Office for Europe, 2019).
On average the public and private shares of current spending on health did not change much between 2000 and 2018. Despite a growing health sector, public spending7 on health accounted for 63% of current health spending in 2000 and 64% in 2018 (Table 1.1) and private spending8 accounted for 36% and 35% respectively.
Private spending is mainly from out-of-pocket payments. The role of voluntary health insurance in financing health care is marginal in the European Region (and globally), accounting for just 3% of current spending on health throughout the period (WHO, 2020a).
Across the European Region the out-of-pocket payment share of current spending on health fell only slightly over time, from 31% in 2000 to 30% in 2018 (Table 1.1). This stands in contrast to global trends. At global level the out-of-pocket payment share has consistently declined across all country income groups since 2000 (WHO, 2019a).
Between 2000 and 2018 public spending on health per person grew on average by 2.3% a year in the European Region, while out-of-pocket spending per person grew by 2.0% (Fig. 1.4). In high-income countries public spending on health per person (2.2%) grew faster than out-of-pocket spending (1.7%). This was also the case in lower-middle-income countries, with increases of 5.9% and 5.4% respectively, but in upper-middle-income countries out-of-pocket spending per person (5.3%) grew faster than public spending on health (4.9%).
7. Public spending refers to government spending from domestic sources, including transfers from government domestic revenues allocated to health purposes (FS.1) and revenues from social insurance contributions (FS.3).
8. Private spending refers to compulsory prepayments for private insurance (FS.4), voluntary prepayments for private insurance (FS.5) and other domestic revenues including out-of-pocket payments made by households directly at the point of receiving health services (FS.6.1).
Spending on health in Europe: entering a new era 9

Between 2000 and 2018 out-of-pocket spending per person grew from US$ 26 (here and afterwards in constant 2018 dollars) to US$ 67 in lower-middle-income countries (WHO, 2020a), but the out-of-pocket payment share of current health spending decreased from 57% to 54% (Fig. 1.5). The decline in out-of-pocket payments was partly offset by an increase in public spending on health, which accounted for 43% of current health spending in 2018.
In upper-middle-income countries out-of-pocket spending per person increased from US$ 72 in 2000 to US$ 183 in 2018 (WHO, 2020a). The out-of-pocket payment share of current health spending was 44% in 2000 and 2018. The public share of current health spending rose from 51% to 53%.
In high-income countries out-of-pocket spending per person grew from US$ 493 in 2000 to US$ 664 in 2018 (WHO, 2020a). The out-of-pocket payment share of current health spending decreased slightly from 21% in 2000 to 20% in 2018. The public share of current health spending remained the same at 72%.
On average around three quarters of current health spending in the European Region comes from public sources but there is substantial variation across countries, with the public share in 2018 ranging from 86% in Monaco to 12% in Armenia (Fig. 1.6). In 10 countries – Armenia, Azerbaijan, Cyprus, Georgia, Kyrgyzstan, Switzerland,9 Tajikistan, Turkmenistan, Ukraine and Uzbekistan – public spending accounted for less than half of current spending on health.
9. In Switzerland about one third of current health spending is through compulsory prepayments to private insurance companies (FS.4).
Fig. 1.4 Real growth in public spending on health and out-of-pocket payments per person in the European Region by country income group, 2000–2018
Notes: HIC: high-income countries; LMIC: lower-middle-income countries; UMIC: upper-middle-income countries. Public spending on health and out-of-pocket payments per person are in constant 2018 US$. Average annual growth is calculated as the compound annual rate of growth. Public spending includes transfers from government domestic revenues allocated to health (FS.1) and social insurance contributions (FS.3); out-of-pocket spending includes direct payments at the point of receiving health services (FS.6.1). No data for Montenegro (UMIC).
Source: WHO (2020a).
Out-of-pocket payments
Public spending on health
Ave
rag
e a
nn
ua
l gro
wth
(%
)
2.2
1.7
HIC
2.3 2.0
WHO European Region
4.9 5.3
UMIC
5.9 5.4
LMIC
Spending on health in Europe: entering a new era 10

Fig. 1.5 Public spending on health and out-of-pocket payments as a share of current spending on health in the European Region, 2000–2018
Notes: public spending includes transfers from government domestic revenues allocated to health (FS.1) and social insurance contributions (FS.3); out-of-pocket spending includes direct payments at the point of receiving health services (FS.6.1). No data for Montenegro (UMIC).
Source: WHO (2020a).
0
10
20
30
40
50
60
70
80
20
00
20
01
20
02
20
03
20
04
20
05
20
06
20
07
20
08
20
09
20
10
20
11
20
12
20
13
20
14
20
15
20
16
20
17
20
18
Lower-middle-income countries
Cu
rren
t sp
end
ing
on
hea
lth
(%
)
0
10
20
30
40
50
60
70
80
20
00
20
01
20
02
20
03
20
04
20
05
20
06
20
07
20
08
20
09
20
10
20
11
20
12
20
13
20
14
20
15
20
16
20
17
20
18
Upper-middle-income countries
Cu
rren
t sp
end
ing
on
hea
lth
(%
)
0
10
20
30
40
50
60
70
80
20
00
20
01
20
02
20
03
20
04
20
05
20
06
20
07
20
08
20
09
20
10
20
11
20
12
20
13
20
14
20
15
20
16
20
17
20
18
High-income countries
Cu
rren
t sp
end
ing
on
hea
lth
(%
)
Public spending on health
Out-of-pocket payments
Spending on health in Europe: entering a new era 11

Fig. 1.6 Health spending by source of revenue in the European Region, 2018
Notes: HIC: high-income countries; LMIC: lower-middle-income countries; UMIC: upper-middle-income countries. Tajikistan (a low-income country) is included in the LMIC group. Public spending includes transfers from government domestic revenues allocated to health (FS.1) and social insurance contributions (FS.3); out-of-pocket spending includes direct payments at the point of receiving health services (FS.6.1); voluntary health insurance includes voluntary prepayments (FS.5); other spending includes donor funding, compulsory prepayments to private insurance and some other marginal spending.
Source: WHO (2020a).
Voluntary prepayments
MD
AU
KR
KG
ZU
ZB
TJK
RO
MTU
RB
LR BIH
KA
ZM
NE
RU
SSR
BB
UL
MK
DA
LBG
EO
AZ
ETK
MA
RM
MO
NN
OR
SWE
LUX
SMR
DE
NC
RO
CZ
HIC
ESV
KU
NK
FIN
DE
UB
EL
IRE
ITA
EST
FRA
AU
TSV
NP
OL
SPA
HU
NA
ND
LTU
NE
TIS
RM
AT
PO
RLV
AG
RE
CY
PSW
I
0
60
40
20
80
Cu
rren
t sp
end
ing
on
hea
lth
(%
)
100
LMIC UMIC HIC
Out-of-pocket payments
Other spending
Public spending on health
Spending on health in Europe: entering a new era 12

The role of external funding in low- and middle-income countries has decreased, indicating a lower level of international solidarity, but remains important In 2018 external funding for health totalled US$ 1 billion in the European Region. It is mainly mobilized by multilateral and bilateral donors to support low- and lower-middle-income countries, where it constituted 3% of current spending on health on average in 2018 (WHO, 2020a). Most external aid is directed towards supporting disease-specific programmes (for example, for tuberculosis, HIV/AIDS and immunization). Only a few donors provide general budgetary support for health sector strengthening, as in Tajikistan.
Since 2000 external funding has declined in the majority of countries (Fig. 1.7). As countries have become richer, donors have developed different exit strategies to discontinue their financial support. Box 1.2 outlines the role external funding has played in Kyrgyzstan.
Fig. 1.7 External funding as a share of current spending on health in selected countries, 2010–2018
Note: external funding includes transfers distributed by government from foreign origin (FS.2) and direct foreign transfers (FS.7).
Source: WHO (2020a).
TJK
GEO
KGZ
UZB
MDA
UKR
0
2
4
6
8
10
12
14
16
Cu
rren
t sp
end
ing
on
hea
lth
(%
)
20
10
20
11
20
12
20
13
20
14
20
15
20
16
20
17
20
18
Spending on health in Europe: entering a new era 13

Kyrgyzstan has committed itself to UHC and has launched comprehensive reforms to improve the health of its population. These reforms have relied on successful collaboration with international development partners. In 1995 the World Bank, WHO and the United States Agency for International Development initiated a health financing collaboration that worked to the comparative advantages of each organization. The collaboration was initiated as an informal sector-wide approach (SWAp) and carried forward into a formal SWAp, incorporating other development partners over time.
Since 2006, some of the funds from international development agencies for the Kyrgyz health system have been allocated within the framework of a SWAp and integrated into the government budget. External organizations co-financing the SWAp have included the Department for International Development (United Kingdom), the German Development Bank, the Swedish International Development Cooperation Agency, the Swiss Agency for Development and Cooperation and the World Bank. Other external funds for the health system take the form of parallel financing for the implementation of various projects and come from a variety of international organizations. The Ministry of Health has taken the lead in coordinating donor assistance and aligning it with health sector priorities.
Kyrgyzstan has received sustained external support for health system reform over 25 years. Throughout this period donors have maintained close collaborative relationships and coordinated their support. They have been committed to country-led reforms and adopted a pragmatic approach to providing technical and financial support, which has allowed reforms to move forward despite setbacks and changes in the landscape. This level of coordination and length of commitment is rare in the European Region. It has contributed heavily to the success of Kyrgyzstan’s reform efforts.
Box 1.2 External funding for health in Kyrgyzstan Source: Dominis et al. (2018).
Spending on health in Europe: entering a new era 14

Chapter 2
Spending on health is a political choice


Summary Spending on health has grown faster than the economy in most countries in the European Region. In 11 countries, however, the economy grew at a faster pace than current health spending, suggesting that some countries did not take full advantage of growing economic and fiscal capacity to invest in health.
Public spending on health has grown faster than out-of-pocket spending but mainly in high-income countries. Although current health spending grew in almost all countries, the public share of health spending only increased in 31 out of 52 countries. Public spending on health per person grew at a faster rate than out-of-pocket payments in 29 mainly high-income countries, reflecting cross-country differences in fiscal capacity and in political choices about public spending priorities.
There is large variation in how much of the government budget countries allocate to health. In 2018 the share of the government budget allocated to health ranged from less than 3% in Azerbaijan to 23% in Germany and Ireland. It was less than 12% in all lower-middle-income countries, most upper-middle-income countries and a quarter of high-income countries. The gap between high-income and upper-middle-income countries in the priority given to health when allocating the government budget has increased over time.
High out-of-pocket spending weakens financial protection. The incidence of catastrophic health spending is generally low in countries where out-of-pocket payments account for less than 15% of current spending on health. In 2018 the out-of-pocket payment share was over 15% in 40 out of 53 countries. Across countries, public spending on health is shown to be much more effective in reducing out-of-pocket payments than voluntary health insurance. To strengthen financial protection, improve access to health services and make progress towards UHC and the SDGs, countries need to invest more publicly in the health system and pay careful attention to the design of coverage policy.
Spending on health is in large part a political choice reflecting decisions about how much of the government budget to allocate to health and coverage policy designed to reduce out-of-pocket spending. Although fiscal capacity is more limited in middle-income countries, governments in countries in all income groups have choices. Some governments have not sustained or increased the health share of public spending, even as fiscal capacity has increased. Giving greater priority to health in middle-income countries would narrow the gap with high-income countries, allowing the European Region to enter a new era in which public spending on health reflects political priorities not just economic development.
Spending on health in Europe: entering a new era 17

Public spending on health has grown faster than out-of-pocket spending but mainly in high-income countries This chapter explores how levels of public spending on health in countries in the European Region are influenced by political priorities, and how heavy reliance on out-of-pocket payments adversely affects financial protection. A reduction in out-of-pocket payments and an increase in the public share of current spending on health are essential for progress towards UHC and the SDGs (WHO & World Bank, 2020).
Between 2000 and 2018 current spending on health per person grew in real terms in every country except San Marino and it grew faster than real GDP10 per person in most countries in the European Region (Fig. 2.1). This was not the case in 11 countries, however (Albania, Croatia, Georgia, Hungary, Iceland, Kazakhstan, Luxembourg, Monaco, North Macedonia, Turkey and Turkmenistan), suggesting that some countries did not take full advantage of growing economic and fiscal capacity to invest in health. A large body of literature shows that the main factors behind growth in health spending are rising incomes, new medical technologies, increasing prices and volumes, and changing medical practice (Williams et al., 2019; Fan & Savedoff, 2014).
During this period public spending on health per person grew in real terms in every country in the European Region except Greece and was generally larger in lower- and upper-middle-income countries than in high-income countries (Fig. 2.2). The public share of current spending on health grew in only 31 out of 52 countries, however (data not shown). This reflects the fact that out-of-pocket payments grew at a faster rate than public spending on health in 23 out of 52 countries (Fig. 2.2). This faster growth in out-of-pocket payments was particularly evident in Armenia, Azerbaijan, Belarus, Czechia, Estonia, France, Kyrgyzstan, Lithuania, Malta, Portugal, Serbia, Slovakia, Turkmenistan and the Russian Federation.
10. In this report the cumulative growth (CG) of GDP is calculated by using the formula CG = GDP2018/GDP2000. The same formula is used to calculate the cumulative growth of different components of health spending. Real per person values are measured in constant 2018 US$.
Spending on health in Europe: entering a new era 18

Spending on health in Europe: entering a new era 19
Cu
mu
lati
ve g
row
th, 2
00
0=
1
Fig. 2.1 Cumulative growth in current spending on health and GDP per person in the European Region, 2000–2018
0
3
10
6
9
7
8
5
4
2
1
TJK
MD
AU
ZB
KG
ZU
KR
AR
MTK
MA
ZE
RO
MG
EO
BU
LSR
BB
LR BIH
RU
SK
AZ
ALB
TUR
MK
D
LTU
LVA
EST
SVK
PO
LM
AT
CZ
HIR
ESW
EU
NK
HU
NFI
NB
EL
SVN
SPA
NE
TC
YP
SWI
NO
RD
EU
DE
NIS
RIC
EC
RO
AU
TFR
AM
ON
PO
RA
ND
ITA
GR
ELU
XSM
R
LMIC UMIC HIC
11Notes: HIC: high-income countries; LMIC: lower-middle-income countries; UMIC: upper-middle-income countries. Tajikistan (a low-income country) is included in the LMIC group. No data for Montenegro (UMIC). The cumulative growth rate is calculated using current health spending and GDP per person in constant 2018 US$. Base year 2000 = 1.
Source: WHO (2020a).
GDP
Current health spending
Cu
mu
lati
ve g
row
th, 2
00
0=
1
Fig. 2.2 Cumulative growth in public spending on health and out-of-pocket payments per person in the European Region, 2000–2018
0
3
10
6
9
7
8
5
4
2
1
TJK
MD
AU
ZB
UK
RK
GZ
GE
OA
RM
AZ
ER
OM
BIH
BU
LSR
BA
LBB
LRK
AZ
TUR
TKM
RU
SM
KD
LVA
LTU
EST
PO
LSV
KC
ZH
IRE
SWE
MA
TU
NK
SWI
FIN
HU
NC
YP
BE
LSV
NN
OR
SPA
DE
NN
ET
DE
UM
ON
ISR
ICE
FRA
CR
OA
UT
AN
DIT
ASM
RP
OR
LUX
GR
E
LMIC UMIC HIC
11Notes: HIC: high-income countries; LMIC: lower-middle-income countries; UMIC: upper-middle-income countries. Tajikistan (a low-income country) is included in the LMIC group. No data for Montenegro (UMIC). The cumulative growth rate is calculated using public spending on health and out-of-pocket spending per person in constant 2018 US$. Base year 2000 = 1.
Source: WHO (2020a).
Out-of-pocket payments
Public spending on health

There is large variation in how much of the government budget countries allocate to health How much of its GDP a country invests publicly in health depends on two factors.
• Fiscal capacity reflects the size of the public sector relative to the economy and is measured in terms of government spending as a share of GDP (Tandon et al., 2014). The greater the fiscal capacity, the greater is the government’s ability to spend on different sectors, including health. Fiscal capacity is influenced by a country’s ability to collect taxes and its level of economic development.
• Political priority or choice determines how much of the government budget to allocate to health.
Although public spending on health as a share of GDP tends to increase with the fiscal capacity of a country, there is large variation among countries of similar income levels (Fig. 2.3). For example, government spending as a share of GDP is the same in Spain, Slovakia and Ukraine (42%), but Spain spends more publicly on health as a share of GDP than Slovakia and almost twice as much as Ukraine.
This shows the importance of political priority in determining how much public revenue a country allocates to health. While long-term efforts are usually needed to increase fiscal capacity, decisions about what share of the public budget should be allocated to health are taken annually and are amendable in the short run (Jakab et al., 2018).
Increased fiscal capacity does not always result in an increase in the priority given to health when allocating the government budget, as Fig. 2.4 shows. In countries in the right-hand quadrants of the figure, government spending grew faster than GDP. Countries in the upper-right quadrant increased the share of the government budget allocated to health (scenario1) but countries in the lower-right quadrant did not (scenario 3). For example, Georgia and Kyrgyzstan experienced substantial growth in fiscal capacity between 2000 and 2018; in Georgia this led to a large increase in the priority given to health, while in Kyrgyzstan the priority given to health was reduced.
In countries in the left-hand quadrants of Fig. 2.4, government spending did not keep pace with GDP growth but most countries opted to sustain or increase the share of the government budget allocated to health (scenario 2). However, in a few cases (scenario 4), such as North Macedonia and Turkmenistan, the priority given to health decreased.
Spending on health in Europe: entering a new era 20

Fig. 2.3 Relationship between public spending on health and governmentspending as a share of GDP in the European Region, 2018
Source: WHO (2020a).
Pu
bli
c sp
end
ing
on
hea
lth
as
a s
ha
re o
f G
DP
(%
)
Government spending as a share of GDP (%)
0
0 10 20 30 40 50 60
2
1
3
5
7
9
10
8
4
TKM
KAZ
MONARM
UZB
AZE
TJK
GEOALB KGZ
TURRUSMDA
MKD
AND
IRE
SMR
MAT6
SWI
LTU
ROMBUL
BLR
CYP
UKRGRE
HUN
MNE
CROPOR
SVN
ITA
FIN
BEL
FRA
AUT
NORDEU
SWE
UNK
ICE
SPACZH
BIH
NET
DEN
LUX
ISREST
SRB SVK
POL
LVA
Spending on health in Europe: entering a new era 21

Between 2000 and 2018, the priority given to health in government spending increased slightly in all country income groups (Fig. 2.5). However, the health share of government spending has increased the most in high-income countries and the priority given to health in lower-middle-income countries has fallen since 2012, resulting in a widening gap between high- and lower-middle-income countries.
Fig. 2.4 Relationship between public spending on health as a share of government spending on health and government spending as a share of GDP in the European Region, 2000-2018
Notes: changes in health priority correspond to the difference between the three-year average of public spending on health as a share of government spending in 2000–2002 and in 2016–2018. Changes in government spending correspond to the difference between the three-year average of government spending as a share of GDP in 2000–2002 and in 2016–2018. No data for Montenegro.
Source: WHO (2020a).
Scenario 4 :Government spending decreased and health priority decreased
Scenario 2: Government spending decreased and health priority increased
Scenario 1: Government spending increased and health priority increased
Scenario 3: Government spending increased and health priority decreased
Ch
an
ge
in h
ealt
h p
rio
rity
(%
)
Change in government spending as a share of GDP (%)
-5
-15 -10 -5 0 5 10 15 20
-1
-3
-4
0
-2
2
4
6
7
5
1
3
BIHSWE
IRE
ISR
UZB
TUR
SVK
MATDEU
CZH
DEN
NET
ROM
AUTPOL
SVN
SWI
TJK
AZEKGZ
ARMCYP
FIN
NORMDAEST
BEL
SMR
UNK
GEO
SPA
UKRFRA
ITA
LVA
SRBGRE
ICE
RUS
POR
MON
KAZBLR
CROHUN
LTUALB
BUL
MKD
LUX
TKM
Spending on health in Europe: entering a new era 22

The priority given to health in government spending remains low in many middle-income countries. In 2018 public spending on health as a share of the government budget ranged from 3% in Azerbaijan to 23% in San Marino, reflecting significant variation in the European Region (Fig. 2.6). Although there is no universally accepted standard of what share of the government budget should be spent on health, in 2018, 23 out of 53 countries in the Region allocated less than 12% of the government budget to health: all lower-middle-income countries, most upper-middle-income countries and a quarter of high-income countries.
Fig. 2.5 Public spending on health as a share of government spending in the European Region, 2000–2018
Notes: HIC: high-income countries; LMIC: lower-middle-income countries; UMIC: upper-middle-income countries. Data for Montenegro are only available for 2018 (UMIC).
Source: WHO (2020a).
UMIC
LMIC
HIC
0
2
4
6
8
10
12
14
16
20
00
20
01
20
02
20
03
20
04
20
05
20
06
20
07
20
08
20
09
20
10
20
11
20
12
20
13
20
14
20
15
20
16
20
17
20
18
Go
vern
men
t sp
end
ing
(%
)
Fig. 2.6 Public spending on health as a share of government spending in the European Region, 2018
Go
vern
men
t sp
end
ing
(%
)
0
6
12
18
20
14
16
10
8
4
2
MD
AU
KR
KG
ZU
ZB
TJK
BIH
RO
MSR
BM
KD
BU
LB
LRM
NE
GE
OR
US
ALB
TUR
KA
ZTK
MA
RM
AZ
E
SMR
IRE
DE
UU
NK
AN
DSW
EN
OR
DE
NIC
EM
AT
CZ
HA
UT
NE
TSP
AB
EL
FRA
SVN
PO
RFI
NIT
ALT
USV
KE
STC
RO
ISR
SWI
PO
LLU
XH
UN
LVA
GR
EC
YP
MO
N
LMIC UMIC HIC
Notes: HIC: high-income countries; LMIC: lower-middle-income countries; UMIC: upper-middle-income countries. Tajikistan (a low-income country) is included in the LMIC group. The red line indicates public spending on health at 12% of the government budget.
Source: WHO (2020a).
Spending on health in Europe: entering a new era 23

High out-of-pocket spending weakens financial protection Out-of-pocket payments can create a financial barrier to access, resulting in unmet need for health and dental care. They can also lead to financial hardship for people using health services. There is wide variation in the financial hardship associated with household spending on health among countries in the European Region. Where financial protection is relatively weak, catastrophic health spending is mainly driven by out-of-pocket payments for outpatient medicines (for more details see Box 2.1 and WHO Regional Office for Europe, 2019).
Progress towards UHC requires constant effort to ensure that everyone can use the quality health services they need without experiencing financial hardship. Out-of-pocket payments can create a financial barrier to access, resulting in unmet need for health or dental care, and can lead to financial hardship for people using health services. Weak financial protection may force some people to choose between health care and other basic needs such as food and housing. It can lead to or deepen poverty, deteriorate health and widen inequalities.
People pay out of pocket for some health services in all health systems, although not all out-of-pocket spending causes financial hardship. People experience financial hardship when out-of-pocket spending is large compared to their ability to pay, which means that poor people may face financial hardship even when out-of-pocket payments are low.
Financial protection is measured using two widely used indicators.
• Catastrophic health spending measures the share of households with out-of-pocket payments that exceed a predefined share of their ability to pay.
• Impoverishing health spending measures out-of-pocket payments that push a household below or further below the poverty line.
Different metrics can be used for both indicators; metrics vary in the type of poverty line used and in how a household’s ability to pay for health care is defined (Cylus et al., 2018).
The WHO Regional Office for Europe has developed new metrics to measure financial protection in response to concerns that the method used to measure financial protection in the SDGs (SDG indicator 3.8.2), and other global approaches, pose a challenge for equity and have limited relevance for Europe. Building on established methods, the metrics used in the European Region are less likely to underestimate financial hardship among poorer people than the SDG metrics because they account for differences in household capacity to pay for health. The aim is to measure financial protection in a way that is relevant to all countries in Europe, produces actionable evidence for policy and promotes policies to break the link between ill health and poverty (for more details see WHO Regional Office for Europe, 2019; 2020a).
Box 2.1 Financial protection – a core dimension of UHC Sources: Cylus et al. (2018); WHO Regional Office for Europe (2019; 2020a).
Spending on health in Europe: entering a new era 24

Evidence shows a strong positive relationship between the incidence of catastrophic health spending and the out-of-pocket payment share of current spending on health. The higher is the share of out-of-pocket payments, the higher is the incidence of catastrophic spending. When out-of-pocket payments exceed 15% of current health spending, it is difficult to maintain strong financial protection (Fig. 2.7). In 2018 the out-of-pocket payment share was over 15% in 40 out of 53 countries in the European Region, and in six countries it constituted more than half of all spending on health (Fig. 2.8).
The out-of-pocket payment share of current health spending is generally lower in countries that spend relatively more publicly on health (Fig. 2.9), but there are large variations among countries. For instance, Kyrgyzstan, the Russian Federation and Turkey all spend around 3% of GDP on health publicly, but in Turkey the out-of-pocket payment share is 17% compared to 38% in the Russian Federation and 52% in Kyrgyzstan. This indicates that it is not just the level of public spending on health that determines the level of out-of-pocket spending or the ability to provide financial protection. Coverage policy – decisions about who is entitled to publicly financed health care, the scope of service coverage and rules around user charges (co-payments) – also plays a key role (for more details see WHO Regional Office for Europe, 2019).
Spending on health in Europe: entering a new era 25

Fig. 2.7 Incidence of catastrophic health spending and out-of-pocket payments as a share of current spending on health in the European Region, latest year available
Notes: data are not available for all countries. Data on out-of-pocket payments are for the same year as data for catastrophic spending.
Sources: WHO Regional Office for Europe (2019); WHO (2020a).
Ca
tast
rop
hic
inci
den
ce (
%)
Out-of-pocket payments as a share of current spending on health (%)
0
0 10 20 30 40 50 60
4
6
8
10
12
14
16
18
2
SVN 2015
DEU 2013
FRA 2011
CRO 2014
GRE 2018
MDA 2016
SVK 2012
SWE 2012
UNK 2014
AUT 2015
EST 2016
POL 2014
HUN 2015
LVA 2016
CYP 2015
UKR 2015
IRE 2016
KGZ 2014
GEO 2018
ALB 2015
TUR 2014
POR 2015
LTU 2016
CZH 2012
Spending on health in Europe: entering a new era 26

Cu
rren
t sp
end
ing
on
hea
lth
(%
)
Fig. 2.8 Out-of-pocket payments as a share of current spending on health in the European Region, 2018
0
45
90
75
60
30
15
TJK
UZ
BK
GZ
UK
RM
DA
AR
MTK
MA
ZE
GE
OA
LBM
KD
BU
LM
NE
RU
SSR
BK
AZ
BIH
BLR
RO
MTU
R
CY
PLV
AG
RE
MA
TLT
UP
OR
SWI
HU
NE
ST ITA
SPA
ISR
PO
LB
EL
SVK
FIN
AU
TU
NK
ICE
SMR
NO
RC
ZH
SWE
DE
NA
ND
DE
UIR
ESV
NN
ET
CR
OLU
XFR
AM
ON
LMIC UMIC HIC
Notes: HIC: high-income countries; LMIC: lower-middle-income countries; UMIC: upper-middle-income countries. Tajikistan (a low-income country) is included in the LMIC group. The green line indicates out-of-pocket spending at 15% of current spending on health.
Source: WHO (2020a).
Spending on health in Europe: entering a new era 27

Spending on health in Europe: entering a new era 28
Fig. 2.9 Relationship between public spending on health and out-of-pocket payments in the European Region, 2018
Source: WHO (2020a).
Ou
t-o
f-p
ock
et p
aym
ents
as
a s
ha
re o
f cu
rren
t sp
end
ing
on
hea
lth
(%
)
Public spending on health as a share of GDP (%)
0
0 1 2 3 4 5 6 7 8 109
20
10
30
50
70
90
80
40
60
ARM
TKM
AZE
TJK
UZB
KGZ
GEO
ALB
UKR
CYP
KAZRUS
MKD
LVA
BUL MNESRB
MAT
POR
LTU
HUN
ESTSWI
BLR
TUR
LUX
AND
POL
ROM ISRSVK
IRE CRO NET
ICE
FIN AUTBELUNK
FRA
DEN
NOR
DEUSWE
SVN
SMR
CZH
MON
BIH
SPAITA
GRE
MDA

Chapter 3
The evolution of compulsory health financing

Summary Countries in the European Region mainly organize compulsory health financing through government schemes or SHI schemes. Only two countries have opted to organize compulsory health financing through PHI schemes.
The type of compulsory health financing scheme in place (government, SHI or compulsory PHI) can be explained historically and has changed over time. Some countries – mainly in western Europe – have moved away from employment-based arrangements to extend health coverage to the whole population. Other countries – all located outside western Europe – re-introduced employment-based schemes in an attempt to secure additional public investment in health or overcome the rigidity of public financial management rules.
The SHI scheme share of compulsory spending on health has fallen in high-income countries and is now highest in upper-middle-income countries. In 2018 the SHI scheme share of compulsory spending on health was highest in upper-middle-income countries and lowest in lower-middle-income countries.
SHI schemes are typically financed through a combination of social insurance contributions and transfers from the government budget. When spending through SHI schemes is broken down by revenue source, it becomes clear that the government budget is a significant source of SHI scheme revenue in many countries in all country income groups.
Gaps in population coverage are larger in countries that are mainly financed through SHI schemes. This clear pattern is a consequence of policy choices. In government schemes entitlement is usually based on residence, whereas SHI schemes generally base entitlement on employment status and payment of contributions, which systematically disadvantages people in vulnerable situations. To make progress towards UHC, some countries with SHI schemes have changed the basis for entitlement from payment of contributions to residence.
There are no systematic differences in UHC as measured through the service coverage index or the share of households with catastrophic health spending between countries with government schemes and SHI schemes. The extent to which a country relies on compulsory spending on health rather than out-of-pocket payments, and the design of coverage policy, have more impact on UHC performance than the way in which compulsory spending on health is financed.
Conventional distinctions between SHI and tax-financed schemes are no longer meaningful. These classifications do not determine sources of revenue and they mask the fact that all forms of compulsory pre-payment with risk pooling offer people ‘insurance’. The key question for policy is how well different health systems do in meeting the UHC goals of universal access to health services with financial protection. By broadening the public revenue base to encompass transfers from the government budget and de-linking entitlement to health care from payment of
Spending on health in Europe: entering a new era 31
contributions, some countries have removed the two key features of traditional SHI schemes that limit progress towards UHC. In a new era of health financing for UHC, removing these barriers will be an essential part of health system reforms.
Compulsory health financing arrangements differ across countries This chapter focuses on compulsory health financing arrangements in the European Region. As a category, compulsory health financing11 encompasses all elements of public spending on health but also includes elements of private spending on health – notably compulsory PHI. The first part of the chapter reviews shifts in compulsory health financing arrangements over time, highlighting the role of history – path dependency – in determining current arrangements. It also looks at trends in compulsory spending on health from 2000 to 2018. The second part of the chapter considers the impact of different compulsory arrangements on indicators of UHC.
Compulsory health financing involves prepayment mechanisms that are typically channelled through two main types of arrangement – what the SHA refers to as “government schemes” and SHI (OECD, Eurostat & WHO, 2011). A few countries organize health financing through a third arrangement known as “compulsory private health insurance”. A fourth arrangement, “compulsory medical savings accounts”, plays a very limited role globally and does not feature in the European Region.
Table 3.1 sets out the key characteristics of compulsory health financing arrangements in the European Region. Using SHA terminology, it classifies countries according to their main compulsory health financing scheme. Main is defined as the financing scheme accounting for the largest share of current spending on health in 2018.
In 2018 compulsory health financing was mainly organized through government schemes in 23 countries and through SHI schemes in 28 countries (Fig. 3.1). Although three countries reported spending through compulsory PHI (all of them in the high-income country group), it is the main compulsory health financing scheme in two countries only: the Netherlands and Switzerland. Reliance on financing through SHI schemes was lowest in lower-middle-income countries (one out of five) and highest in upper-middle-income countries (nine out of 15).
11. Public spending on health (as discussed in previous chapters) refers to government spending from domestic sources, including transfers from government domestic revenues allocated to health purposes (FS.1), and revenues from social insurance contributions (FS.3). Compulsory spending on health (the focus of this chapter) refers to government health financing schemes (HF.1.1), SHI schemes (HF.1.2.1), compulsory PHI schemes (HF.1.2.2) and compulsory medical savings accounts (HF.1.3).
Spending on health in Europe: entering a new era 32

Table 3.1 Characteristics of compulsory health financing arrangements in the European Region, 2018
Notes: HIC: high-income countries; LMIC: lower-middle-income countries; UMIC: upper-middle-income countries. Tajikistan (a low-income country) is included in the LMIC group. HF.1.1 and HF.1.2.1 are typically counted as public spending in national accounts, but HF.1.2.2 is not. The country classification is based on the characteristics of the main compulsory health financing arrangement. Although Kyrgyzstan has an SHI scheme, financing through the government scheme accounts for a much larger share of current spending on health (see Fig. 3.1). Cyprus and France use wage-based contributions to finance health care, but entitlement is based on residence rather than payment of contributions (see Box 3.1).
Source: adapted from OECD, Eurostat & WHO (2011).
Type of scheme (SHA code)
Government schemes (HF.1.1)
SHI schemes (HF.1.2.1)
Compulsory PHI schemes(HF.1.2.2)
Mode of participation
Automatic for all residents or a specific group of people
Compulsory for all residents or a specific group of people
Compulsory for all residents or a specific group of people
Basis for entitlement
Non-contributory: typically, universal or available for a specific group of people or disease category (e.g., tuberculosis)
Contributory: typically based on payment by or on behalf of the insured person
Contributory: typically based on the purchase of a policy from a health insurance company or other agency
Main method of raising revenue
Government budget Contributions, which are typically linked to earnings or income and do not reflect health risk, may be paid by the government on behalf of some non-contributing groups of people; the government may also provide general subsidies to the scheme
Premiums, which are not linked to earnings or income, may reflect health risk and may be subsidized by government
Countries in which this is the main compulsory health financing scheme
LMIC: Kyrgyzstan, Tajikistan, Ukraine, Uzbekistan UMIC: Armenia, Azerbaijan, Belarus, Georgia, Kazakhstan, Turkmenistan HIC: Cyprus, Denmark, Finland, Iceland, Ireland, Italy, Latvia, Malta, Norway, Portugal, Spain, Sweden, United Kingdom
LMIC: Republic of Moldova UMIC: Albania, Bosnia and Herzegovina, Bulgaria, North Macedonia, Montenegro, Romania, Russian Federation, Serbia, Turkey HIC: Andorra, Austria, Belgium, Croatia, Czechia, Estonia, France, Germany, Greece, Hungary, Israel, Lithuania, Luxembourg, Monaco, Poland, San Marino, Slovakia, Slovenia
HIC: Netherlands (flat-rate premiums in addition to wage-based contributions), Switzerland (risk-rated premiums)
Spending on health in Europe: entering a new era 33

Fig. 3.1 Compulsory health spending as a share of current spending on health in the European Region by country income group, 2018
Cu
rren
t sp
end
ing
on
hea
lth
(%
)
0
40
50
90
70
80
60
30
10
20
MD
ATJ
KU
ZB
KG
ZU
KR
MN
EB
IHSR
BM
KD
ALB
BU
LA
RM
RO
MTK
MR
US
TUR
AZ
EG
EO
KA
ZB
LR
SMR
SVK
SVN
CR
OLU
XFR
AM
ON
NE
TD
EU
LTU
HU
NE
STP
OL
CZ
HA
ND
ISR
BE
LSW
IG
RE
AU
TC
YP
PO
RLV
AFI
NM
AT
SPA
IRE
ITA
UN
KIC
ED
EN
SWE
NO
R
LMIC UMIC HIC
SHI schemes
Government schemes
Compulsory PHI schemes
Notes: HIC: high-income countries; LMIC: lower-middle-income countries; UMIC: upper-middle-income countries. Tajikistan (a low-income country) is included in the LMIC group. Within country income groups, countries are ranked from low to high by spending through government schemes.
Source: WHO (2020a).
Spending on health in Europe: entering a new era 34

There have been major shifts in compulsory health financing arrangements over time Compulsory health financing originated in schemes based on employment and were typically financed through wage-related contributions (Abel-Smith, 1998; Saltman et al., 2004). This is because before the development of modern medicine the financial risk associated with ill health was loss of earnings rather than health care costs – a risk mainly faced by workers and their families. Germany was the first country to institute compulsory arrangements at a national level, beginning in 1883. It was followed by the United Kingdom in 1911 and other countries in the first half of the 20th century.
Employment-based schemes were not designed to be universal. In the wake of the Second World War, some countries wanted to extend health coverage to the whole population, going beyond workers, so they established universal schemes that were financed through the government budget. The United Kingdom took this path in 1946 and Norway in 1967, followed by Denmark, Iceland, Italy, Portugal, Greece and Spain in the 1970s and 1980s (Table 3.2).
Starting in 1990, countries in central and eastern Europe and countries that had formed part of the Soviet Union shifted away from universal schemes financed through the government budget. Many re-introduced employment-based schemes that had been dismantled under the influence of the Soviet Union, partly to try and secure additional public investment in health through earmarked contributions and, in some cases, to overcome the rigidity of public financial management rules (Kutzin et al., 2010). Two of these countries – Kazakhstan and Georgia – subsequently abandoned their SHI schemes (in 1999 and 2005 respectively), although Kazakhstan re-introduced one in 2020.
Spending on health in Europe: entering a new era 35

12. Classified under compulsory prepayment in SHA (FS.4).
13. Classified under social insurance contributions in SHA (FS.3).
14. Classified under compulsory prepayment in SHA (FS.4).
The two countries with compulsory PHI schemes – the Netherlands and Switzerland – have a long history of organizing health financing through multiple private entities (Thomson et al., 2020). In Switzerland health insurance became compulsory for the whole population for the first time in 1996. People pay risk-related premiums12 to non-profit private insurance companies. Local governments subsidize premiums for people with low incomes. In the Netherlands the richest third of the population relied on voluntary substitutive PHI until 2006, when the government extended entitlement to publicly financed coverage to the whole population. The universal scheme established in 2006 is organized through a mix of non-profit and for-profit private entities and financed through wage-based contributions13 and flat-rate premiums.14 The central government subsidizes premiums for people with low incomes.
The SHI scheme share of compulsory spending on health has fallen in high-income countries and is now highest in upper-middle-income countries Across the European Region compulsory spending on health was evenly divided between spending through government schemes and SHI schemes in 2018, but there was significant variation by country income group: the SHI scheme share of compulsory spending on health ranged from 27% in lower-middle-income countries to 51% in high-income countries and 61% in upper-middle-income countries. Between 2000 and 2018, the SHI scheme share of compulsory spending on health grew in lower- and upper-middle-income countries and fell in high-income countries (Fig. 3.2).
Table 3.2 Shifts in compulsory health financing arrangements in the European Region
Source: authors based on European Observatory on Health Systems and Policies (2021), Saltman et al. (2004) and Kutzin et al. (2010).
Historically organized through SHI schemes but shifted to a government scheme
(Re-)introduced SHI schemes, typically during political and economic transition
Introduced then abolished SHI schemes
1946: United Kingdom1967: Norway1973: Denmark1974: Iceland1978: Italy1979: Portugal 1983: Greece (introduced a government scheme but did not abolish its SHI scheme)1986: Spain
1990: Hungary1991: North Macedonia1992: Estonia, Serbia1993: Croatia, Czechia, Montenegro, Russian Federation, Slovakia, Slovenia1995: Albania1997: Kyrgyzstan, Lithuania1999: Bosnia and Herzegovina, Bulgaria, Poland, Romania2004: Republic of Moldova2020: Kazakhstan
1995–2005: Georgia1996–1999: Kazakhstan
Spending on health in Europe: entering a new era 36
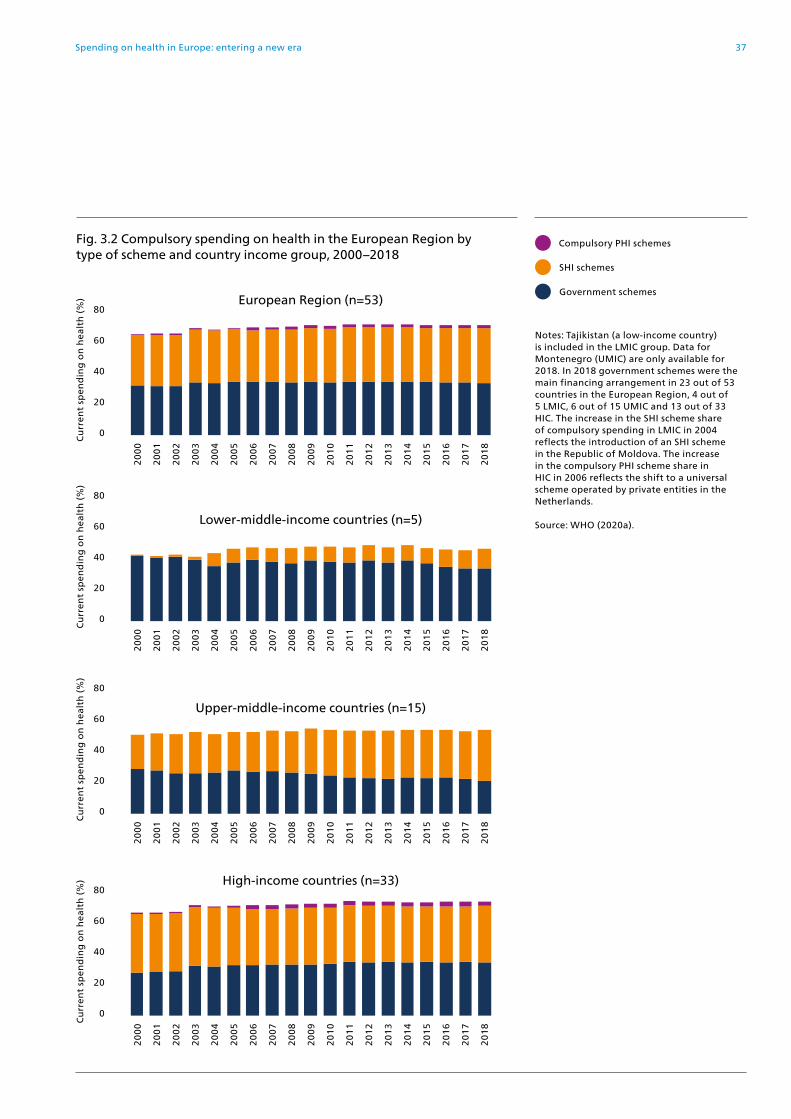
Cu
rren
t sp
end
ing
on
hea
lth
(%
)
Fig. 3.2 Compulsory spending on health in the European Region by type of scheme and country income group, 2000–2018
0
60
80
40
20
Notes: Tajikistan (a low-income country) is included in the LMIC group. Data for Montenegro (UMIC) are only available for 2018. In 2018 government schemes were the main financing arrangement in 23 out of 53 countries in the European Region, 4 out of 5 LMIC, 6 out of 15 UMIC and 13 out of 33 HIC. The increase in the SHI scheme share of compulsory spending in LMIC in 2004 reflects the introduction of an SHI scheme in the Republic of Moldova. The increase in the compulsory PHI scheme share in HIC in 2006 reflects the shift to a universal scheme operated by private entities in the Netherlands.
Source: WHO (2020a).
20
00
20
01
20
02
20
03
20
04
20
05
20
06
20
07
20
08
20
09
20
10
20
11
20
12
20
13
20
14
20
15
20
16
20
17
20
18
European Region (n=53)
SHI schemes
Government schemes
Compulsory PHI schemes
0
60
80
40
20
20
00
20
01
20
02
20
03
20
04
20
05
20
06
20
07
20
08
20
09
20
10
20
11
20
12
20
13
20
14
20
15
20
16
20
17
20
18
Lower-middle-income countries (n=5)
Cu
rren
t sp
end
ing
on
hea
lth
(%
)
0
60
80
40
20
20
00
20
01
20
02
20
03
20
04
20
05
20
06
20
07
20
08
20
09
20
10
20
11
20
12
20
13
20
14
20
15
20
16
20
17
20
18
Upper-middle-income countries (n=15)
Cu
rren
t sp
end
ing
on
hea
lth
(%
)
0
60
80
40
20
20
00
20
01
20
02
20
03
20
04
20
05
20
06
20
07
20
08
20
09
20
10
20
11
20
12
20
13
20
14
20
15
20
16
20
17
20
18
High-income countries (n=33)
Cu
rren
t sp
end
ing
on
hea
lth
(%
)
Spending on health in Europe: entering a new era 37

The increase in the SHI scheme share in lower-middle income countries reflects the introduction of an SHI scheme in the Republic of Moldova in 2004. The fall in the SHI scheme share in high-income countries follows the introduction of a universal compulsory PHI scheme in the Netherlands in 2006.
Compulsory spending on health and out-of-pocket payments have grown at the same rate on average, but growth has varied substantially across countriesOn average, compulsory spending on health and out of-pocket payments per person in the European Region grew by 2.2 times between 2000 and 2018. Growth in compulsory spending on health was generally higher in countries where compulsory health financing is mainly organized through government schemes (2.6 times) than in countries where it is mainly financed through SHI schemes (1.9 times) or compulsory PHI schemes (1.7 times), but this was largely driven by substantial growth in lower-middle-income countries like Georgia and Tajikistan (Fig. 3.3).
The government budget is a significant source of SHI scheme revenue in many countries in all country income groups Most SHI schemes in the European Region benefit from transfers from the government budget in addition to revenue from social insurance contributions. In 2018 government budget transfers were an important supplement to social insurance contributions in many countries (Fig. 3.4). They amounted to around 25–35% of SHI scheme revenue in Belgium, Bulgaria, France, Greece, Lithuania, North Macedonia, Slovakia and Turkey; around 40% in Luxembourg, the Republic of Moldova and the Russian Federation; and over 50% in Albania, Hungary and Israel.
Viewed in this way, the government budget is seen to be a larger source of compulsory health financing in many countries that are mainly financed through SHI schemes, across all country income groups. In 2018, for example, Fig. 3.4 shows that the government budget was the dominant source of compulsory spending on health in Albania, Greece, Hungary, Israel and the Russian Federation. In the same year social insurance contributions accounted for more than 75% of compulsory spending on health in only 11 out of 28 countries mainly financed through SHI schemes.
Spending on health in Europe: entering a new era 38

Spending on health in Europe: entering a new era 39
Cu
mu
lati
ve g
row
th, 2
00
0=
1C
om
pu
lso
ry s
pen
din
g o
n h
ealt
h (
%)
0
60
80
100
40
20
Fig. 3.3 Cumulative growth in compulsory spending on health and out-of-pocket payments per person in the European Region by main compulsory health financing arrangement, 2000–2018
0
3
10
6
9
7
8
5
4
2
1
PO
RIT
AIC
ED
EN
SPA
NO
RC
YP
FIN
UN
KM
AT
SWE
IRE
TKM
KA
ZB
LRU
KR
KG
ZU
ZB
LVA
AZ
EA
RM
TJK
GE
O
GR
ELU
XSM
RM
KD
AN
DC
RO
AU
TFR
AIS
RM
ON
SVN
BE
LD
EU
HU
NC
ZH
RU
STU
RSV
KA
LBP
OL
SRB
EST
LTU
BU
LB
IHR
OM
MD
A
SWI
NE
T
11 Notes: no data for Montenegro. Countries are grouped according to their main compulsory health financing arrangement. The cumulative growth rate is calculated using per person spending in constant 2018 US$. Base year 2000 = 1.
Source: WHO (2020a).
Fig. 3.4 Compulsory spending on health in countries in the European Region mainly financed through SHI schemes, and breakdown of SHI scheme revenue into government budget transfers and social insurance contributions, 2018
Notes: HIC: high-income countries; LMIC: lower-middle-income countries; UMIC: upper-middle-income countries. Countries are ranked from high to low by government budget financing, which is the sum of government schemes (HF.1.1) and government budget transfers to SHI schemes (HF.1.2.1–FS.3).
Source: WHO (2020a).
Government budget transfers to SHI schemes
Government schemes
Social insurance contributions
MD
A
ALB
RU
STU
RB
UL
RO
MM
KD
MN
ESR
BB
IH
HU
NG
RE
ISR
BE
LA
UT
LUX
LTU
CZ
HFR
ASV
KA
ND
CR
OD
EU
EST
PO
LSV
NM
ON
SMR
SHI schemes
Compulsory PHI schemes
Out-of-pocket payments
Government schemes
LMIC UMIC HIC

Implications for UHC The goals of UHC are to ensure that everyone can use the health services they need without experiencing financial hardship. These goals are most likely to be met when:
• the whole population is covered;
• the range and quality of services covered is sufficient to meet everyone’s health needs; and
• health care costs are largely financed through prepayment with risk pooling, so that no one encounters financial barriers to access (resulting in unmet need for health services) or experiences financial hardship (resulting in catastrophic or impoverishing health spending).
Gaps in population coverage are larger in countries that are mainly financed through SHI schemes Ensuring that the whole population is entitled to publicly financed health care is a precondition for UHC. While population coverage on its own is not enough to guarantee that people will not face unmet need or financial hardship, it is not possible for countries to achieve UHC without it.
Around 60% of countries in the European Region report covering the whole population (Fig. 3.5). Most of these countries are mainly financed through government schemes. In contrast, all the countries that report not covering the whole population are mainly financed through SHI schemes (with one exception – Georgia).
This clear pattern is a consequence of policy choices. In government schemes entitlement is usually based on residence status, whereas SHI schemes generally base entitlement on employment status and payment of contributions by or on behalf of the insured person.
As noted at the beginning of this chapter, SHI schemes were originally developed to cover the risk of losing earnings when ill and unable to work. In this context the schemes were designed to cover a subset of the population only – workers – and there was some logic in linking entitlement to payment of contributions.
Today, a key goal of any health system is to protect people against a different type of risk: the risk of having to pay for health care when ill. Because this risk is universal – it is not limited to workers15 – there is no reason why contemporary SHI schemes should continue to insist on linking entitlement to employment or payment of contributions. Instead, they should aim to be universal. Box 3.1 highlights problems that occur when health systems base entitlement on payment of contributions.
15. Loss of earnings due to ill health is a risk that is now covered by other parts of the social protection system.
Spending on health in Europe: entering a new era 40

Regardless of whether the basis for entitlement is residence or payment of contributions, undocumented migrants are likely to be excluded or entitled to a limited set of publicly financed benefits in almost every country in the European Region – even in those that report covering the whole population. Other groups of people likely to be systematically underserved include Roma, homeless people and people with mental health problems.
Pop
ula
tio
n (
%)
0
60
80
100
40
20
AR
MA
ZE
BLR
CR
OC
YP
CZ
HD
EN
FIN
GR
EIC
EIR
EIS
RIT
AK
AZ
KG
ZLV
AM
AT
NE
TN
OR
PO
RSV
NSP
ASW
ESW
ITJ
KTU
RTK
MU
KR
UN
KU
ZB
AU
TFR
AD
EU
BE
LLT
UR
US
SRB
EST
GE
OH
UN
SVK
LUX
PO
LA
ND
MD
AR
OM
MK
DB
IHB
UL
ALB
Fig. 3.5 Population coverage in the European Region by main compulsory health financing arrangement, latest year available
Notes: no data for Monaco, Montenegro and San Marino. Population coverage refers to the share of the population entitled to health services financed through pre-payment and risk pooling. Social health insurance schemes in Greece and Kyrgyzstan do not cover the whole population.
Sources: OECD (2020a) for OECD countries, which is based on self-reporting; Health Systems in Transition reports for non-OECD countries (European Observatory on Health Systems and Policies (2021).
Mainly financed through:
SHI schemes
Government schemes
Compulsory PHI schemes
Countries that report covering the whole population Countries that report not covering the whole population
Spending on health in Europe: entering a new era 41

Linking entitlement to payment of contributions systematically disadvantages people in vulnerable situations. Basing entitlement on payment of contributions automatically excludes people from coverage, leaving a part of the population uninsured. The uninsured are often people who cannot afford to pay contributions because they are in precarious or non-stable work or lack employment. The size of the uninsured population varies across countries. It is generally larger in countries with a high degree of informality in the labour market.
Linking entitlement to payment of contributions in SHI schemes that are supplemented by transfers from the government budget fosters unfairness among taxpayers. Fig 3.4 shows the extent to which SHI schemes in the European Region are financed through the government budget. In 2018 budget transfers accounted for more than 20% of SHI scheme revenue in 15 out of 28 countries (WHO, 2020a). This leads to an unfortunate outcome in which some taxpayers lack entitlement to the SHI scheme even though they are paying for it through taxes on goods, property or income.
Split benefits packages exacerbate inequalities in access to health services. The share of the population not covered by SHI schemes in some countries is substantial. In Albania, Greece and Kyrgyzstan, for example, the SHI scheme does not cover around 20–25% of the population. Although the uninsured are entitled to other publicly financed health services, the scope of these services is limited in comparison to the services covered by the SHI scheme, deepening socioeconomic inequalities in access and financial protection.
Recognizing the threat to UHC posed by linking entitlement to payment of contributions, some countries with SHI schemes are choosing to change the basis for entitlement to residence. France broke the link between entitlement and payment of contributions in 2000, through a new system known as Couverture Universelle Maladie. In 2016 this was replaced by Protection Universelle Maladie, which grants all residents an individual, automatic and continuous right to health care, without the need for administrative formalities when a person’s circumstances change. The new General Health System launched in Cyprus in 2019 changed the basis for entitlement from citizenship, income and payment of contributions to residence, extending publicly financed coverage to the 25% of the population that was previously not covered (Kontemeniotis & Theodorou, 2021).
Box 3.1 Problems that occur when health systems base entitlement to publicly financed health care on payment of contributions rather than on residence
Source: WHO Regional Office for Europe (2019).
Spending on health in Europe: entering a new era 42

There are no systematic differences in service coverage or financial protection between countries mainly financed through government schemes and countries mainly financed through SHI schemes Two sets of indicators are commonly used to measure progress towards UHC. The service coverage index developed as part of the SDGs (SDG indicator 3.8.1)16 aims to capture access to health services. Indicators of financial protection – catastrophic and impoverishing health spending – aim to capture the extent to which people experience financial hardship when they use health services and have to pay out of pocket for them.
In 2018 the European Region had an average service coverage index of 75 (Fig.3.6). On average, countries where health financing is organized mainly through government schemes achieved a slightly higher score on the service coverage index compared to countries where health financing is mainly organized through SHI schemes (76 versus 74), driven largely by differences in high-income countries (80 versus 76). In middle-income countries, the average service coverage index score was very similar across the two types of health financing arrangement.
The incidence of catastrophic spending on health in the European Region does not differ based on the way in which compulsory health financing is arranged (Fig. 3.7). This is also true of impoverishing health spending (data not shown) (WHO Regional Office for Europe, 2019). Catastrophic incidence ranges from 1% to 17% of households in countries mainly financed through government schemes and in countries mainly financed through SHI schemes.
Measured using these two indicators, there are no systematic differences in UHC performance between countries with government schemes, SHI schemes and compulsory PHI schemes. In the European Region the extent to which a country relies on compulsory spending on health rather than on out-of-pocket payments, and the design of coverage policy – decisions about who is entitled to publicly financed health care, the scope of service coverage and rules around user charges (co-payments) – have more impact on UHC than the way in which compulsory spending on health is financed (WHO Regional Office for Europe, 2019).
16. Self-reported unmet need for health and dental care due to cost, distance and waiting is a better indicator of access to health care than the service coverage index (SDG 3.8.1) but comparable data on unmet need are not available in all countries in the European Region.
Spending on health in Europe: entering a new era 43

Spending on health in Europe: entering a new era 44
Fig. 3.6 Service coverage index and the compulsory share of current spending on health in the European Region by main compulsory health financing arrangement, 2018
Notes: service coverage index data are for 2017 and not available for Andorra, Monaco and San Marino. The index combines 16 tracer indicators (reproductive, maternal, newborn and child health; infectious diseases; noncommunicable diseases; and service capacity and access) in a single summary measure.
Sources: WHO (2020a); WHO (2019b).
Mainly financed through:
SHI schemes
Government schemes
Compulsory PHI schemes
Compulsory share of current spending on health (%)
0 10 20 30 40 80 10050 60 70 90
Serv
ice
cove
rag
e in
dex
0
20
10
30
50
70
90
100
80
40
60
ARM TKM
AZE
TJK
GEO
UZB
CYP
KGZ
ALB
MDA
BULMNE
LVA
KAZ
LTU
HUNPOLEST
IREBLR
PORMLT SWI
ISR
SPAITA
SVN AUTFIN
SVKROM
TUR
BEL
UNK NET
ISL
NORSWE
LUX DEUDEN
FRACZE
CRO
BIH
SRB
MKD
GRERUS
UKR

Spending on health in Europe: entering a new era 45
Fig. 3.7 Catastrophic health spending and the compulsory share of current spending on health in the European Region by main compulsory health financing arrangement, 2018
Notes: data on catastrophic incidence are for the latest available year and are not available for all countries. Catastrophic incidence is defined here as the share of households with out-of-pocket payments greater than 40% of capacity to pay for health care. Capacity to pay for health care is defined here as total household consumption minus a standard amount to cover basic needs (food, housing and utilities). Data on compulsory health spending are for the same year as those for catastrophic spending.
Sources: WHO (2020a); WHO Regional Office for Europe (2019).
0 10 20 30 40 80 10050 60 70 90
Ca
tast
rop
hic
inci
den
ce (
%)
Compulsory share of current spending on health (%)
0
4
2
6
10
14
18
16
8
12
Mainly financed through:
SHI schemes
Government schemes
GEOMDA
UKR
KGZALB
LVA LTU
HUN
GRE
ARM
POL
POR EST
TUR
SVK AUT
CRO
DEU
SWE
CZEUNK
FRAIRE
SVN


Chapter 4
Tracking PHC spending and its priority in government budgets


Summary Information on PHC spending and how this spending is financed is vital for monitoring country and regional progress towards UHC. Monitoring PHC spending – particularly public spending on PHC – shows the priority countries give to ensuring everyone can use the PHC services they need without financial hardship. Tracking PHC spending in a standard way across countries17 highlights the patterns and differences in PHC spending and identifies where progress is needed. Nearly 40 countries in the European Region collect data on PHC spending using the SHA 2011 framework, but there is room for improvement. Eight of these countries also report PHC spending by financing source, allowing them to track public spending on PHC. This analysis demonstrates the diversity of PHC spending in the European Region. It also highlights gaps in reporting by countries and the need for better quality collection methods that increase international comparability.
PHC accounts for less than half of current spending on health. On average PHC spending accounted for 42% of current spending on health in the 37 countries covered in this chapter, but there is considerable variation across countries. Switzerland spends the most per person (US$ 3923) and Tajikistan the least (US$ 27). The composition of PHC spending also differs across countries. General outpatient care and outpatient medicines account for the largest share of PHC spending.
The priority countries give to PHC when allocating government spending on health varies substantially. Among the eight countries for which PHC spending data are available by financing source, the public share of PHC spending ranges from 42% in Armenia to 12% in Georgia. Public spending on PHC as a share of GDP ranges from 1.2% in the Republic of Moldova and the Russian Federation to 0.3% in Georgia. If these countries invested an additional 1% of GDP in PHC, it would result in an extra US$ 32, US$ 44 and US$ 115 spent publicly per person on PHC in the Republic of Moldova, Georgia and the Russian Federation respectively.
WHO calls on all countries to invest an additional 1% of GDP in PHC. Spending more publicly on PHC is the most cost-effective way to make progress towards UHC. It offers the potential to improve access to services in middle-income countries, to enhance the quality and efficiency of people-centred services in high-income countries and to improve financial protection in all countries, especially if accompanied by efforts to strengthen coverage policies. By carefully tracking PHC spending and increasing public spending on PHC by an additional 1% of GDP, countries will enter a new era in health financing. Tracking PHC spending is important for progress towards UHC
17. The global definition of PHC spending used in this chapter may not match the PHC definition used at country level.
Spending on health in Europe: entering a new era 49

Tracking PHC spending is important for progress towards UHC This chapter provides for the first time an overview on how much different countries in the European Region spend on PHC and the priority given to PHC in allocating government spending. This analysis demonstrates the diversity of PHC spending in the European Region. It also highlights gaps in reporting by countries and the need for data collection methods that increase comparability.
PHC is the most efficient and equitable way of using available resources to make progress towards UHC, a core priority of WHO’s European Programme of Work for 2020–2025 (WHO Regional Office for Europe, 2021). When PHC performs well, it addresses a wide range of health needs close to people’s homes and communities and ensures people can use the quality services they need without financial hardship, as outlined in the Alma-Ata Declaration in 1978 and confirmed by the Declaration of Astana in 2018 (WHO, 2019b). PHC has played a crucial role during the pandemic, enabling early recognition and referral of people with COVID-19, and providing the coordination and continuity needed to maintain other essential health services (WHO Regional Office for Europe, 2020b). Because of its importance for UHC, WHO recommends that all countries, regardless of income level, allocate an additional 1% of GDP to PHC from public sources (WHO, 2019b).
Monitoring PHC spending – particularly public spending on PHC – shows the priority countries give to ensuring essential health services to all. Tracking PHC spending in a standard way across countries highlights the patterns and differences in PHC spending and identifies where progress is needed.
Until recently, there was no standard method of monitoring PHC spending across countries, partly due to challenges in defining something that is inherently multisectoral and multidimensional, and partly due to data limitations and differences in the way services are delivered in different countries. In 2019 WHO published a first comparative analysis of PHC spending, focusing on low- and middle-income countries globally (Xu et al., 2019). This analysis reflected joint guidelines for a global definition of PHC based on SHA 2011 (OECD, Eurostat & WHO, 2011).
SHA 2011 offers at least three options for constructing PHC spending (OECD, 2019a). The first is to use the health provider (HP) classification, which records health spending by type of service provider – for example, clinics, hospitals and pharmacies. The second is to use the health care function (HC) classification, which records health spending by the primary purpose of each type of health care good or service – for example, curative or preventive. The third is to cross the HP and HC classifications to provide more detailed information on, say, how much a country spends on outpatient services provided by hospitals. After consultation with country representatives, policy-makers, researchers and health accounts experts from around the world, the HC measure was chosen for cross-country comparison (Vande Maele et al., 2019). The HC classification was
Spending on health in Europe: entering a new era 50

selected because it is more comparable than the HP classification. For example, the role of hospitals in providing outpatient care varies widely across countries. Using the HP classification, first contact care provided by hospitals would not be captured, whereas the HC classification captures first contact care regardless of who provides it. The HC classification may not capture all differences in how countries organize service delivery, however, so careful interpretation of the data is needed.
The global definition of PHC spending18 includes the following categories (with HC codes):
• general outpatient curative care (HC.1.3.1)
• dental outpatient curative care (HC.1.3.2)
• curative outpatient care, not elsewhere classified (HC.1.3.nec)
• home-based curative care (HC.1.4)
• outpatient long-term health care (HC.3.3)
• home-based long-term health care (HC.3.4) • preventive care (HC.6)
• a share (80%) of medical goods provided outside health care services (HC.5)
• a share (80%) of health system administration and governance costs (HC.7).
Outpatient over-the-counter and prescription medicines (HC.5) are a fundamental element of PHC but the inclusion of the entire HC.5 category would overestimate PHC spending. The global definition of PHC spending therefore includes 80% of all spending under HC.5. The 80% proportion reflects expert opinion based on individual country case studies.
This chapter reviews data for the 37 countries in the European Region that report all the components necessary to monitor PHC spending.19 Because currently it is not obligatory to report PHC spending by financing sources, just eight of these countries in the European Region report this dimension, which enables analysis of PHC spending by governments and donors.20 Unfortunately, out-of-pocket spending on PHC cannot be tracked due to poor quality or lack of data. Notably, as of today the rest of the countries in the European Region do not yet report any health care services (HC) spending by financing sources and some of them do not report any health care services (HC) spending at all based on SHA 2011 methodology (Annex 2).
18. The global PHC definition excludes inpatient curative care (HC.1.1), day curative care (HC.1.2), specialized outpatient curative care (HC.1.3.3), unspecified curative care (HC.1.nec), rehabilitative care (HC.2), inpatient long-term care (HC.3.1), day long-term care (HC.3.2), unspecified long-term care (HC.3.nec), ancillary services (HC.4) and other health care services not elsewhere classified (HC.9).
19. Armenia, Austria, Belarus, Belgium, Bosnia and Herzegovina, Bulgaria, Croatia, Cyprus, Czechia, Denmark, Estonia, Finland, France, Georgia, Germany, Greece, Hungary, Iceland, Kazakhstan, Latvia, Lithuania, Luxembourg, Malta, Netherlands, North Macedonia, Norway, Poland, the Republic of Moldova, Romania, the Russian Federation, Slovakia, Slovenia, Spain, Sweden, Switzerland, Tajikistan and Uzbekistan.
20. Armenia, Georgia, Kazakhstan, North Macedonia, the Republic of Moldova, the Russian Federation, Tajikistan and Uzbekistan.
Spending on health in Europe: entering a new era 51

PHC accounts for less than half of current spending on health On average PHC spending in the 37 countries accounted for 42% of current spending on health in 2018, ranging from 32% in the Netherlands to 62% in Malta (Fig. 4.1).21 There is no clear relationship between the PHC share of current spending on health and a country’s income level (Fig. 4.2).
In absolute terms, PHC spending varies considerably across countries. In the countries with data available, Switzerland spends the most per person (US$ 3923) and Tajikistan the least (US$ 27) (Fig. 4.3). The causes of variation require analysis beyond the data reported here and range from differences in policy choices to nuances in measurement methodology. The impact of medicine prices could be one reason.
The composition of PHC spending differs between countries. General outpatient care22 and medicines23 absorb the greatest share of PHC spending (Fig. 4.4). The share of spending on medicines is related to income level – the richer is the country, the smaller is the share of medicines in PHC spending (Fig. 4.5). This may reflect the impact of differences in medicines pricing and coverage policies but also overall income level and purchasing power of the country. The share of other components of PHC spending varies by countries but cannot be explained by differences in income levels. Other factors, including differences in measurement methodology, may play a role. For example, the SHA 2011 classification captures prevention spending through explicitly defined programmes but faces difficulties in measuring preventive activities integrated in primary and specialist care consultations.
21. PHC spending in Georgia could be underestimated as it does not include voluntary prepayment schemes’ spending on PHC spending categories, except administration.
22. Dental care is monitored separately from general outpatient care as dental care is already included in the definition of global PHC.
23. In this chapter, medicines refer to medicines and medical supplies provided outside health care services (HC.5 under the SHA 2011 framework). Only a portion of all medicines are included in this analysis – as those delivered at the point of care are already accounted for in the amounts for inpatient care, outpatient care and so on.
Fig. 4.1 PHC spending as a share of current spending on health in the European Region, 2018
Cu
rren
t sp
end
ing
on
hea
lth
(%
)
0
40
50
70
60
30
10
20
MD
A
TJK
UZ
B
KA
Z
AR
M
BU
L
BLR BIH
RU
S
MK
D
GE
O
RO
M
MA
T
DE
U
LTU
SVK
PO
L
FIN
GR
E
EST
FRA
SVN
CY
P
BE
L
HU
N
SWI
LVA
SPA
NO
R
DE
N
SWE
LUX
CR
O
AU
T
ICE
CZ
H
NE
T
LMIC UMIC HIC
Notes: HIC: high-income countries; LMIC: lower-middle-income countries; UMIC: upper-middle-income countries. Tajikistan (a low-income country) is included in the LMIC group. Data not available for all countries.
Source: WHO (2020a).
Spending on health in Europe: entering a new era 52

Fig. 4.2 Relationship between PHC spending as a share of current spending on health and country income level in the European Region, 2018
PH
C s
pen
din
g a
s a
sh
are
of
curr
ent
spen
din
g o
n h
ealt
h (
%)
GDP per person (US$)
0 10 000 20 000 30 000 40 000 50 000 60 000 70 000 80 000 90 000
10
0
20
30
40
50
60
70
Notes: data not available for all countries. Luxembourg is excluded as an outlier.
Source: WHO (2020a).
Spending on health in Europe: entering a new era 53
:
MAT
MDA
DEU
FRA
BEL
NET
AUT
SWE DEN
ICE
NOR SWI
FIN
KAZ
LTU
POL
BUL ARM
TJK
UZB
GEO
MKD
ROM
CRO LVA
HUN
GRE EST
SVN CYP
SPA
CZH
BIH
BLR
RUS
SVK
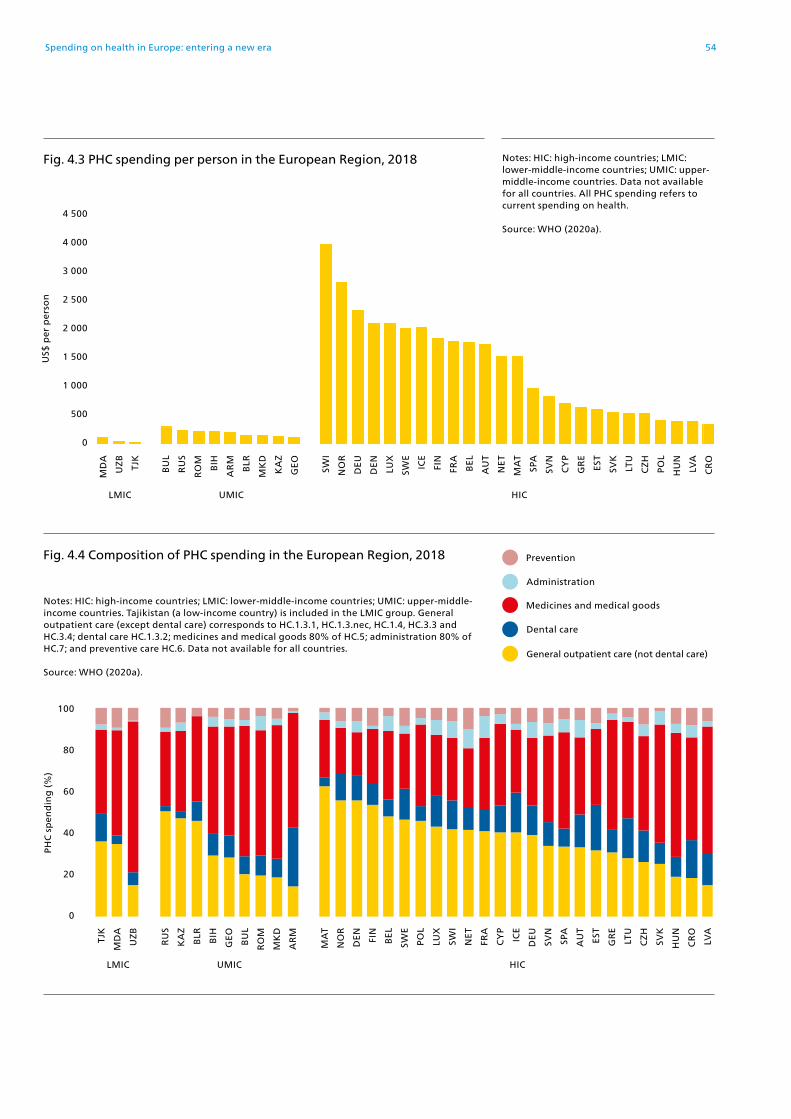
Spending on health in Europe: entering a new era 54
Notes: HIC: high-income countries; LMIC: lower-middle-income countries; UMIC: upper-middle-income countries. Tajikistan (a low-income country) is included in the LMIC group. General outpatient care (except dental care) corresponds to HC.1.3.1, HC.1.3.nec, HC.1.4, HC.3.3 and HC.3.4; dental care HC.1.3.2; medicines and medical goods 80% of HC.5; administration 80% of HC.7; and preventive care HC.6. Data not available for all countries.
Source: WHO (2020a).
Fig. 4.4 Composition of PHC spending in the European Region, 2018
TJK
MD
A
UZ
B
RU
S
KA
Z
BLR BIH
GE
O
BU
L
RO
M
MK
D
AR
M
MA
T
NO
R
DE
N
FIN
BE
L
SWE
PO
L
LUX
SWI
NE
T
FRA
CY
P
ICE
DE
U
SVN
SPA
AU
T
EST
GR
E
LTU
CZ
H
SVK
HU
N
CR
O
LVA
LMIC UMIC HIC
PH
C s
pen
din
g (
%)
0
60
80
100
40
20
Dental care
Administration
General outpatient care (not dental care)
Medicines and medical goods
Prevention
Fig. 4.3 PHC spending per person in the European Region, 2018
0
2 000
2 500
4 000
4 500
3 000
1 500
500
1 000
MD
A
UZ
B
TJK
BU
L
RU
S
RO
M
BIH
AR
M
BLR
MK
D
KA
Z
GE
O
SWI
NO
R
DE
U
DE
N
LUX
SWE
ICE
FIN
FRA
BE
L
AU
T
NE
T
MA
T
SPA
SVN
CY
P
GR
E
EST
SVK
LTU
CZ
H
PO
L
HU
N
LVA
CR
O
LMIC UMIC HIC
Notes: HIC: high-income countries; LMIC: lower-middle-income countries; UMIC: upper-middle-income countries. Data not available for all countries. All PHC spending refers to current spending on health.
Source: WHO (2020a).
US$
per
per
son

Spending on health in Europe: entering a new era 55
The priority given to PHC in allocating public spending varies substantially Among the eight countries for which PHC spending data are available by sources, the public share of PHC spending varies substantially from 42% in Armenia to 12% in Georgia (Fig. 4.6). These large variations reflect different policy choices and the role of donor funding in some countries.
Fig. 4.5 Relationship between spending on medicines and medical goods as a share of PHC spending and country income level in the European Region, 2018
Med
icin
es a
nd
med
ica
l go
od
s a
s a
sh
are
of
curr
ent
spen
din
g o
n P
HC
(%
)
GDP per person (US$)
0 10 000 20 000 30 000 40 000 50 000 60 000 70 000 80 000 90 000
10
0
20
30
40
50
60
70
Notes: data not available for all countries. Luxembourg is excluded as an outlier.
Source: WHO (2020a).
MDABUL
ROM
HUN
LVA
SVK
GRE
SPACZH
LTU
POL SVN
CYP
ESTRUS
KAZ
BLRTJK
MAT
FRABEL
AUT
NET
FIN DEN
ICE SWI
NORSWE
DEU
CRO
ARM
GEO
BIHMDA

Public spending on PHC as a share of GDP also varies widely, ranging from 1.2% in the Republic of Moldova and the Russian Federation to 0.3% in Georgia (Fig. 4.7). The Political Declaration of the High-level Meeting on Universal Health Coverage calls for increased public spending on PHC (United Nations, 2019). WHO recommends that all countries increase their public spending on PHC by an additional 1% of GDP (WHO, 2019b). This additional investment would amount to an extra US$ 32, US$ 44 and US$ 115 spent publicly per person on PHC in the Republic of Moldova, Georgia and the Russian Federation respectively.
Fig. 4.6 PHC spending as a share of public spending on health in the European Region, 2018
Note: data not available for all countries.
Source: WHO (2020a).
42 40
38 36
33
Pu
bli
c sp
end
ing
on
hea
lth
(%
)
30
24
12
ARM KAZ RUS TJK MDA MKD UZB GEO
Fig. 4.7 Public spending on PHC as a share of GDP in the European Region, 2018
Note: data not available for all countries.
Source: WHO (2020a).
GD
P (
%)
MDA RUS MKD KAZ TJK ARM UZB GEO
1.2 1.2 1.1
0.7 0.7
0.5 0.5
0.3
Spending on health in Europe: entering a new era 56

On average, only 31% of PHC spending in the eight countries comes from the government, ranging from 54% in the Russian Federation to 11% in Armenia (Fig. 4.8). Aid is an important additional funding source for PHC in some countries, accounting for 7% of PHC spending in Tajikistan and 4% in the Republic of Moldova (WHO, 2020a). Donor funding is particularly important as a source of funding for prevention. For example, in Tajikistan donor funding comprises about half of all spending on prevention.
The distribution of government spending across PHC components varies greatly across countries (Fig. 4.9). Medicines account for a higher share of public spending on PHC (Fig. 4.9) in countries that spend more publicly on PHC as a share of GDP, like North Macedonia and the Republic of Moldova (Fig. 4.7).
Fig. 4.8 Public spending on PHC as a share of PHC spending in the European Region, 2018
Note: data not available for all countries.
Source: WHO (2020a).
54
45 45
35
22
PH
C s
pen
din
g (
%)
21
1311
RUS KAZ MKD MDA UZB TJK GEO ARM
Spending on health in Europe: entering a new era 57

Medicines and dental care are an important component of PHC services and should therefore be financed by government but in many countries – including many high-income countries – these PHC components are the least likely to be publicly financed and are heavily reliant on out-of-pocket payments (WHO Regional Office for Europe, 2019). In the eight countries highlighted in this chapter, the public share of spending on medicines and medical goods is consistently much lower than the public share of spending on general outpatient care (Fig. 4.10). The public share of spending on dental care is also consistently very low in these countries – 1% in Armenia and 0.1% in Georgia (WHO, 2020a).
Notes: general outpatient care (except dental care) corresponds to HC.1.3.1, HC.1.3.nec, HC.1.4, HC.3.3 and HC.3.4; dental care HC.1.3.2; medicines and medical goods 80% of HC.5; administration 80% of HC.7; and preventive care HC.6. Data not available for all countries.
Source: WHO (2020a).
Fig. 4.9 Composition of public spending on PHC in the European Region, 2018
Dental care
Administration
General outpatient care (except dental care)
Medicines and medical goods
Prevention
RUS KAZ MKD MDA UZB TJK GEO ARM
Pu
bli
c sp
end
ing
on
PH
C (
%)
0
60
80
100
40
20
Fig. 4.10 Public spending as a share of spending on selected PHC categories in the European Region, 2018
Notes: general outpatient care includes only general practitioners and family doctors (HC.1.3.1). Data not available for all countries.
Source: WHO (2020a).
Medicines and medical goods
General outpatient care (except dental care)
MKD UZB RUS ARM MDA KAZ TJK GEO
PH
C c
ate
go
ry (
%)
0
60
80
100
40
20
Spending on health in Europe: entering a new era 58
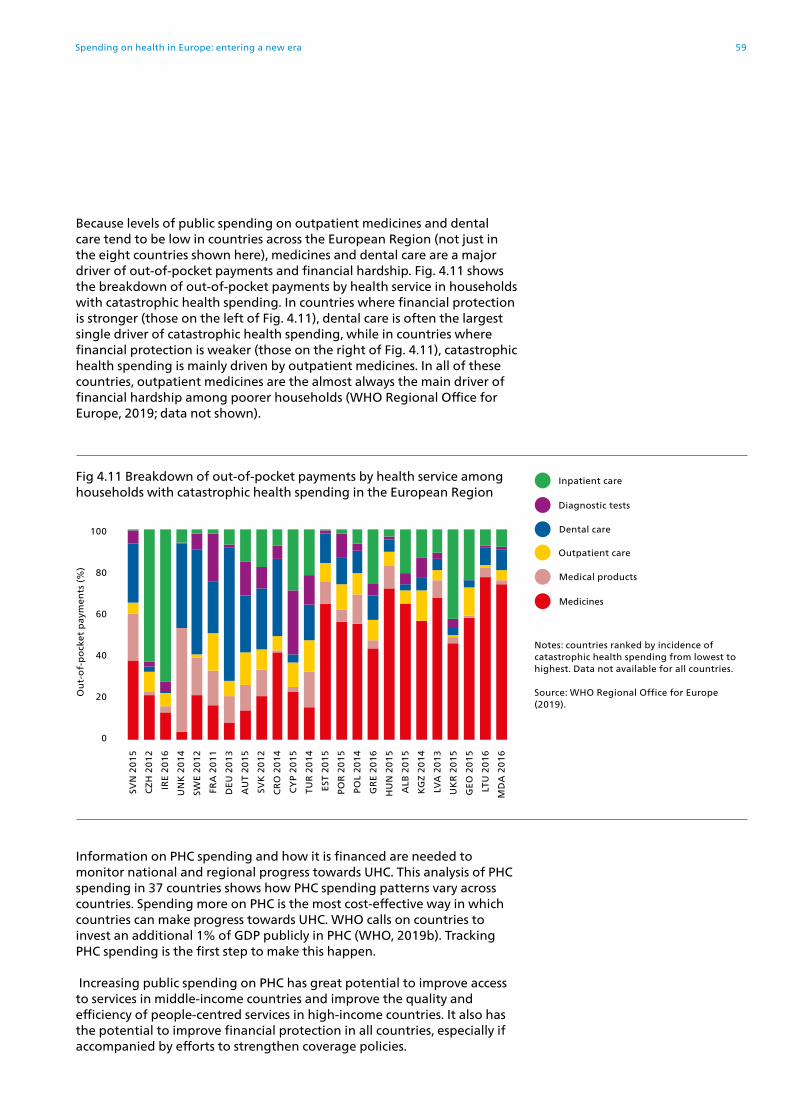
Because levels of public spending on outpatient medicines and dental care tend to be low in countries across the European Region (not just in the eight countries shown here), medicines and dental care are a major driver of out-of-pocket payments and financial hardship. Fig. 4.11 shows the breakdown of out-of-pocket payments by health service in households with catastrophic health spending. In countries where financial protection is stronger (those on the left of Fig. 4.11), dental care is often the largest single driver of catastrophic health spending, while in countries where financial protection is weaker (those on the right of Fig. 4.11), catastrophic health spending is mainly driven by outpatient medicines. In all of these countries, outpatient medicines are the almost always the main driver of financial hardship among poorer households (WHO Regional Office for Europe, 2019; data not shown).
Information on PHC spending and how it is financed are needed to monitor national and regional progress towards UHC. This analysis of PHC spending in 37 countries shows how PHC spending patterns vary across countries. Spending more on PHC is the most cost-effective way in which countries can make progress towards UHC. WHO calls on countries to invest an additional 1% of GDP publicly in PHC (WHO, 2019b). Tracking PHC spending is the first step to make this happen.
Increasing public spending on PHC has great potential to improve access to services in middle-income countries and improve the quality and efficiency of people-centred services in high-income countries. It also has the potential to improve financial protection in all countries, especially if accompanied by efforts to strengthen coverage policies.
Fig 4.11 Breakdown of out-of-pocket payments by health service among households with catastrophic health spending in the European Region
Notes: countries ranked by incidence of catastrophic health spending from lowest to highest. Data not available for all countries.
Source: WHO Regional Office for Europe (2019).
Medical products
Dental care
Medicines
Outpatient care
Diagnostic tests
Inpatient care
Ou
t-o
f-p
ock
et p
aym
ents
(%
)
0
60
80
100
40
20
SVN
20
15
CZ
H 2
01
2
IRE
20
16
UN
K 2
01
4
SWE
20
12
FRA
20
11
DE
U 2
01
3
AU
T 2
01
5
SVK
20
12
CR
O 2
01
4
CY
P 2
01
5
TUR
20
14
EST
20
15
PO
R 2
01
5
PO
L 2
01
4
GR
E 2
01
6
HU
N 2
01
5
ALB
20
15
KG
Z 2
01
4
LVA
20
13
UK
R 2
01
5
GE
O 2
01
5
LTU
20
16
MD
A 2
01
6
Spending on health in Europe: entering a new era 59


Chapter 5
COVID-19: implications for health spending
Spending on health in Europe: entering a new era 61


SummaryFailure to control COVID-19 has led to the deepest economic shock in decades. It has not only hit countries harder than the global financial crisis but also affects a much wider group of countries in the European Region. Without urgent and substantial policy intervention, the economic recovery may take longer and be more uneven than forecasts predict, exacerbating socioeconomic inequalities within and between countries.
Countries were quick to mobilize additional funds for the health system in 2020. This higher level of public investment will need to be sustained in the years ahead to treat and prevent COVID-19, address the backlog created by widespread disruption to health services, mitigate the negative health effects of foregone care, unemployment and poverty and strengthen preparedness for future shocks.
Health financing policy is less resilient to economic shocks in countries where levels of public spending on health are low as a share of GDP and out-of-pocket payments are high, implying significant gaps in health coverage. Health systems are also vulnerable to economic shocks if public spending on health relies heavily on employment (SHI schemes), entitlement to health services is linked to health insurance status, and countercyclical mechanisms to mitigate the effects of rising unemployment and falling wages are lacking or weak.
Well-designed public policy can mitigate the negative effects of COVID-19 and build health system resilience. Key steps countries can take include: broadening the public revenue base for the health system; introducing and strengthening automatic stabilizers; de-linking access to health services from health insurance status; re-designing co-payment policy to protect people at risk of poverty or social exclusion and people with chronic conditions; reprioritizing the government budget to ensure sustained increases in public spending on health; and using priority-setting processes and other instruments to ensure additional public investment in the health system meets equity and efficiency goals.
Countries may find it challenging to invest more publicly in health as government revenue falls, but austerity is not a viable option. Austerity in the health sector in response to the global financial crisis slowed public spending on health, undermined progress towards UHC and increased socioeconomic inequalities. Two factors offer support to governments willing to put improving people’s lives and livelihoods at the heart of the recovery from COVID-19. First, international financial institutions strongly encourage countries to continue to invest in health systems now, recognizing the damage austerity has caused and the importance of the health sector to societal well-being, economic development and resilience to future shocks; they should continue to support careful investment in health and well-being in the longer-term. Second, this shift in thinking is closely aligned with public preferences. Survey after survey carried out in the last 10 years has shown the extent to which people value good access to health care.
Spending on health in Europe: entering a new era 63

There is no economic recovery without health security. Health security requires political will, better tax systems and international solidarity. Many of the things people value most in life can only be achieved through the actions of well-resourced governments. All countries will benefit from efforts to reform tax systems so that they are more effective, fairer, better able to redistribute resources and aligned with policies that promote health and well-being. Increased investment in health and other social sectors is unlikely to be possible in all parts of the European Region without greater international solidarity.
COVID-19 has led to the deepest economic shock in decadesFailure to control COVID-19 has had a profound impact on societies and economies in Europe. Two key economic indicators – GDP and unemployment – suggest that the shock associated with COVID-19 is likely to be greater than the shock caused by the global financial crisis in 2008: it has not only hit countries harder but also affects a much wider group of countries in the European Region.
Data from the International Monetary Fund (IMF) indicate that the reduction in regional GDP in 2020 (–5.9%) was much larger than the regional reduction in 2009 (–3.8%) and more widespread (Fig. 5.1). In 2009 the economic contraction was deepest in high-income countries but in 2020 it was equally large across all country income groups (Fig. 5.1). Similarly, all country income groups experienced a sharp increase in unemployment in 2020 (Fig. 5.2).
Fig. 5.1 Actual and projected annual change in GDP in the European Region by country income group
Notes: HIC: high-income countries; LMIC: lower-middle-income countries; UMIC: upper-middle-income countries. Tajikistan (a low-income country) is included in the LMIC group. No data for Andorra, Monaco, Montenegro, Turkmenistan and Uzbekistan.
Source: IMF (2020).
-8
-4
2
6
10
Ch
an
ge
in G
DP
(%
)
20
00
20
01
20
02
20
03
20
04
20
05
20
06
20
07
20
08
20
09
20
10
20
11
20
12
20
13
20
14
20
15
20
16
20
17
20
18
20
19
20
20
20
21
20
22
20
23
20
24
20
25
UMIC
LMIC
HIC
-6
-2
0
4
8
Spending on health in Europe: entering a new era 64

Fig. 5.2 Actual and projected unemployment rate in the European Region by country income group
Although IMF projections for GDP and unemployment indicate a relatively swift and even recovery across all country income groups (Fig. 5.1 and Fig. 5.2), these forecasts may be overly optimistic for several reasons.
• After the global financial crisis, it took nearly a decade for high-income countries to return to 2008 unemployment levels (Fig. 5.2).
• People in Europe appear to be among those most heavily affected by a reduction in working hours due to the high prevalence of zero-hour contracts, resulting in reduced wages rather than job loss for many workers, especially workers with low incomes (ILO, 2021; IMF, 2020). Countries in southern Europe, the Caucasus and central Asia experienced the highest reduction in working hours in the European Region in 2020 (ILO, 2021). The reduction in working hours has led to a sharp decline in the flow of remittances to countries, which was expected to shrink by 16% in 2020 (World Bank, 2020a).
• The pandemic is exacerbating socioeconomic inequalities within and between countries. People who rely on volatile sources of income such as remittances and wages from zero-hour contracts or informal employment are likely to be at high risk of poverty and social exclusion. This is confirmed by World Bank poverty estimates, which suggest that a large increase in poverty in 2020 will widen inequalities across the European Region (World Bank, 2020b).
• So far, the rollout of COVID-19 vaccination programmes has been much faster in some countries than in others. Without substantially greater international cooperation and solidarity, the uneven availability of vaccines will delay the economic recovery in middle-income countries (OECD, 2021).
Notes: HIC: high-income countries; LMIC: lower-middle-income countries; UMIC: upper-middle-income countries. Tajikistan (a low-income country) is included in the LMIC group. No data for Andorra, Monaco, Montenegro, Turkmenistan and Uzbekistan.
Source: IMF (2020).
0
2
6
10
14
4
8
12
16
Lab
ou
r fo
rce
(%)
20
00
20
01
20
02
20
03
20
04
20
05
20
06
20
07
20
08
20
09
20
10
20
11
20
12
20
13
20
14
20
15
20
16
20
17
20
18
20
19
20
20
20
21
20
22
20
23
20
24
20
25
HIC
LMIC
UMIC
Spending on health in Europe: entering a new era 65

Countries were quick to mobilize additional public funds for the health system in 2020; this higher level of public investment will need to be sustained in the years aheadInternationally comparable data on health spending on COVID-19 are not yet available. Some early evidence suggests that countries in the European Region mobilized significant additional public funds for the health system response in 2020. The magnitude of additional funding was proportionately larger in middle-income countries than in high-income countries, but from a much lower starting point in middle-income countries (Fig. 5.3).
Fig. 5.3 Spending on health per person in the European Region by country income group
LMIC 87
262
2 695
25 (23%)
26 (13%)
165 (8%)
UMIC
HIC
US$ per person
0 500 1 000 1 500 2 000 2 500 3 000
Notes: HIC: high-income countries; LMIC: lower-middle-income countries; UMIC: upper-middle-income countries. No data for Andorra, Kyrgyzstan, Monaco, Montenegro, North Macedonia, San Marino, Tajikistan and Turkmenistan. The LMIC group only includes the Republic of Moldova, Ukraine and Uzbekistan. Public spending on health per person is in constant 2018 US$.
Source: adapted from WHO (2020b).
Budget allocations for the COVID-19 health response, 2020
Public spending on health, 2018
Spending on health in Europe: entering a new era 66

The implications of the pandemic for spending on health in 2021 and beyond depend on a range of factors, which are summarized in Fig. 5.4.
Many countries will need significantly increased public investment in health to continue to treat and prevent COVID-19, address the backlog created by widespread disruption to health services, mitigate the negative health effects of foregone care, unemployment and poverty, and ensure the health system is prepared for future shocks. Evidence from the United Kingdom illustrates why health systems are likely to need substantial extra public funding in the medium and longer term (see Box 5.1).
Even though countries were quick to mobilize additional public funds for the health system response to COVID-19 in 2020, pressure on health budgets will increase as government revenue falls due to economic contraction, unemployment, reduced working hours and lower wages. IMF estimates suggest that government revenue in the European Region fell as a share of GDP by 1.5 percentage points in 2020 and will not revert to its 2019 share before 2026 (IMF, 2020).
As pressure on government budgets grows, governments may be less willing or able to increase public spending on health. Given the evidence highlighted in Box 5.1, however, failing to provide health systems with sustained increases in public investment in the coming years is likely to weaken performance and lower resilience to future shocks.
Fig. 5.4 Potential sources of pressure on health budgets in the context of COVID-19
Higher spending on healthCOVID-19 health response, including vaccine rolloutMaintaining non-COVID-19 health servicesBacklog of delayed or cancelled health servicesForegone care: lower health status, higher health service unit costsUnemployment & poverty: higher demand for publicly financed health servicesPreparedness for future shocks
Lower revenue for healthEconomic contractionRising unemploymentFalling wagesDeclining remittancesIncreasing povertyCuts to external aid
Source: adapted from WHO (2020b).
Spending on health in Europe: entering a new era 67

Substantial reductions in primary care contacts for acute physical and mental conditions occurred following the introduction of lockdown measures in March 2020, with limited recovery by July 2020 (Mansfield et al., 2021).
Elective admissions to hospital and general practitioner referrals to specialist care were around 70% lower in May 2020 than in May 2019 (Kraindler et al., 2020).
By March 2021, the number of people waiting for hospital treatment (4.5 million) was at its highest ever recorded level and the average wait had risen to 12.1 weeks, up from 8.4 weeks in January 2020 (The Health Foundation, 2021).
Without substantial policy intervention, large reductions in new prescriptions for preventive medication and diagnostic tests for heart disease could lead to 12 000 additional heart attacks and strokes in the next five years, as well as many preventable deaths (Patel et al., 2021).
Cancer screening, diagnosis and treatment have been significantly disrupted (Greenwood & Swanton, 2021), which is likely to result in a large increase in preventable deaths from cancer unless there is urgent policy intervention to manage the backlog in diagnostic services (Maringe et al., 2020).
Various studies indicate a deterioration in mental health and well-being among the general population, particularly women, young people and people living with small children (Pierce et al., 2020), health care staff in hospitals (Wanigasooriya et al., 2020) and health and social care workers (McFadden et al., 2021).
There is growing evidence of people experiencing post-COVID-19 conditions, which can seriously affect ability to work or have a social life and mental health (Rajan et al., 2021).
Box 5.1 Health system costs associated with service disruption and other factors relating to COVID-19 in the United Kingdom (England)
Spending on health in Europe: entering a new era 68

Learning from the global financial crisis: austerity slowed public spending on health, undermined progress towards UHC and increased socioeconomic inequalitiesIn the face of uncertainty about the health and economic outlook, it is useful to look at how spending on health in the European Region changed during and after the global financial crisis and understand the implications of these changes for health system performance.
Fig. 5.5 shows changes in GDP, public spending on health and out-of-pocket payments across the European Region in three broad periods: before the global financial crisis (2000–2007), during (2008–2012) and after (2013–2018).24 Between 2000 and 2007, a period of strong economic growth, public spending on health grew faster than the economy and out-of-pocket payments (Fig. 5.5). From 2008 to 2012 GDP declined and out-of-pocket payments grew faster than the economy and public spending on health. Between 2013 and 2018 the economy grew again, but public spending on health did not keep pace with economic growth or, more importantly, with growth in out-of-pocket payments.
24. These periods are somewhat arbitrary because countries were affected at different times and the crisis continued well beyond 2012 in several countries. Changing the years does not change the broad picture, however.
Fig. 5.5 Change in GDP, public spending on health and out-of-pocket payments in the European Region
Ave
rag
e a
nn
ua
l ch
an
ge
(%)
Economic crisis (2008–2012)
Pre-economic crisis (2000–2007)
Post-economic crisis (2013–2018)
2.8
3.6
2.6
-1.2
0.5 0.7
2.3
1.82.1
Notes: the figure is based on data in real values. No data for Montenegro.
Source: WHO (2020a).
Out-of-pocket payments
Public spending on health
GDP
Spending on health in Europe: entering a new era 69

Fig. 5.6 shows changes in public spending on health and out-of-pocket payments across the same three periods by country. The shading in this figure indicates the likely impact of changes in spending on health system performance, ranging from most likely to be positive (darker green) to most likely to be negative (darker red).
The period before the global financial crisis is marked by strong growth in public spending on health across the European Region. Public spending on health grew faster than out-of-pocket payments in all lower-middle-income countries, in two-thirds of high-income countries and in over half of upper-middle-income countries (green shading in the first panel of Fig. 5.6). Public spending on health grew by 10% or more a year in Armenia, Azerbaijan, Georgia, Latvia, the Republic of Moldova, Romania, Serbia, Tajikistan and Ukraine. Out-of-pocket payments grew by 10% or more a year in Armenia, Belarus, Bosnia and Herzegovina, Czechia, the Republic of Moldova, Serbia, Slovakia and Turkmenistan.
Spending on health in Europe: entering a new era 70

Spending on health in Europe: entering a new era 71
Fig. 5.6 Changes in public spending on health and out-of-pocket payments per person in the European Region
Notes: HIC: high-income countries; LMIC: lower-middle-income countries; UMIC: upper-middle-income countries. Tajikistan (a low-income country) is included in the LMIC group. No data for Montenegro. Armenia and Slovakia are excluded from the top panel (2000–2007). Source: WHO (2020a).
HIC
UMIC
LMIC
Public spending on health grew and out-of-pocket payments fell
Public spending on health grew faster than out-of-pocket payments
Out-of-pocket payments grew faster than public spending on health
Public spending on health fell
An
nu
al a
vera
ge
gro
wth
in o
ut-
of-
po
cket
pa
ymen
ts (
%)
Annual average growth in public spending on health (%)
-10 -5 0 5 10 15 20
-10
-5
0
5
10
15
20
TKM
BLR
SRB MDA
GEO
LVAUKR AZE
KAZ
MKD
SMRLUX
NETISR ITA
SWINOR
CYPICE
SPA UNKFIN
CROALB
AND POR
AUT
DEU
FRAMAT
SWE
CZH
SVN
MON
UZBDEN
BELHUN
POL
GRE
IRERUS
BUL
EST
LTU
BIHTJK
ROM
KGZ
TUR
2000–2007

Spending on health in Europe: entering a new era 72
Fig. 5.6 contd
An
nu
al a
vera
ge
gro
wth
in o
ut-
of-
po
cket
pa
ymen
ts (
%)
Annual average growth in public spending on health (%)
-10 -5 0 5 10 15 20
-10
-5
0
5
10
15
20
2008–2012
ARM
AZE
UZB
KGZ
TJKALB
BLRDEUMATPOL
NETRUS
FRA
NORFIN
CZH
ISR MON
AUTDEN
UNKLTU MKD
SPA EST
SRB
SVN
AND
ITAPOR
ICE
LUX
GRE CRO CYP
TUR
SMR
MDALVA
HUN
ROM
SWI
BIH
SWE
GEO
BUL
UKR
IREKAZ
SVK
TKM
During the crisis, from 2008 to 2012, there was a significant shift away from public spending on health. Many countries moved into the red shaded part of the figure, especially the darker red part. Out-of-pocket payments grew faster than public spending on health in two-thirds of upper-middle-income countries and many high-income countries (red shading in the middle panel of Fig. 5.6). In most lower-middle-income countries, however, public spending on health continued to grow faster than out-of-pocket payments. Public spending on health barely grew in Ireland and Serbia and declined in Andorra, Croatia, Estonia, Greece, Hungary, Iceland, Italy, Latvia, Lithuania, Luxembourg, Portugal, Romania, Slovenia and Spain.

Spending on health in Europe: entering a new era 73
Fig. 5.6 contd
An
nu
al a
vera
ge
gro
wth
in o
ut-
of-
po
cket
pa
ymen
ts (
%)
Annual average growth in public spending on health (%)
-10 -5 0 5 10 15 20
-10
-5
0
5
10
15
20
MKD
AZE
KGZGRE
MON
ITA
FIN
NET
UZB
SMR
LUXFRA
SWEAUT
UKRDEN
RUSUNK TUR
ARM CYP
PORSWI
CZH
SPA
DEUSVNHUN
POL
ICE
AND
BUL LTU
ROM
LVAEST
TJKMAT
CRO
ALB
ISR
NORBIH
SRBBEL
IREMDASVK
BLR
GEO
2013–2018
TKM
KAZ
The shift away from public spending on health was not reversed in the post-crisis period. Between 2013 and 2018 out-of-pocket payments grew faster than public spending on health in most lower-middle-income countries and around half of upper-middle-income and high-income countries (red shading in the bottom panel of Fig. 5.6). Public spending on health declined in Azerbaijan, Finland, Greece, Italy, Kyrgyzstan, Monaco, the Netherlands, North Macedonia, San Marino and Uzbekistan. Out-of-pocket payments grew faster than public spending on health between 2008 and 2012 and between 2013 and 2018 in Armenia, Azerbaijan, Croatia, Estonia, Greece, Italy, Kazakhstan, Latvia, North Macedonia, Portugal, the Russian Federation and the United Kingdom.

Analysis of policy responses to the global financial crisis shows how health systems in Europe struggled to cope with a reduction in public investment: unable to do the same with less, many countries cut staff salaries and restricted coverage, often by increasing user charges (co-payments) (Thomson et al., 2015). These austerity measures were sometimes required as part of economic adjustment programmes initiated by the European Union (EU), the European Central Bank and the IMF (known collectively as “the Troika”). In other countries, such as the United Kingdom, austerity was self-imposed.
As a result of austerity in the health sector, several countries in Europe had lower levels of public spending on health per person in 2018 than in previous years (WHO, 2020a). Greece was one of them. Public spending on health per person in Greece fell sharply in real terms between 2009 and 2014, in response to a Troika requirement not just to reduce public spending on health but to keep it below 5% of GDP (Thomson et al., 2015; WHO, 2020a). Out-of-pocket payments per person also fell in real terms between 2008 and 2012, as unemployment and poverty spiked, but grew again from 2013 as cuts and coverage restrictions shifted health care costs onto households (Thomson et al., 2015; Economou et al., 2017; WHO, 2020a). The outcome of austerity in Greece was a prolonged deterioration in access to health services and financial protection, demonstrated by an increase in unmet need for health care and catastrophic health spending (Fig. 5.7), both of which are heavily concentrated among the poorest fifth of the population (disaggregation not shown in Fig. 5.7).
Austerity was accompanied by an increase in unmet need for health and dental care in many countries in Europe and an increase in catastrophic health spending in countries heavily affected by the crisis (Chletsos et al., in press; European Commission, 2016; Eurostat, 2021; Johnston et al. 2020; Kontemeniotis & Theodorou, 2021; Taube et al., 2018). Both of these negative outcomes were consistently more likely to be experienced by people at risk of poverty or social exclusion (WHO Regional Office for Europe, 2019).
The experience of the global financial crisis has important implications for the current situation in Europe.
• Public spending on health slowed at a time when the need for publicly financed health services was growing, creating a gap between the resources health systems needed and the resources available to them. This gap weakened health system performance in many countries, not just in those that were badly affected by the economic crisis.
• Austerity in the health sector shifted health care cost onto households, which undermined national and regional progress towards UHC.
• By failing to put in place measures to protect people at risk of poverty or social exclusion, policy responses to austerity exacerbated socioeconomic inequalities.
• Health systems were not as well equipped to meet the challenges posed by COVID-19 as they might have been in the absence of austerity.
Spending on health in Europe: entering a new era 74

Ho
use
ho
lds
wit
h c
ata
stro
ph
ic s
pen
din
g (
%)
Pop
ula
tio
n w
ith
un
met
nee
d (
%)
As countries recover from the pandemic, investing in health should be a priority for governments, to prevent the emergence of a gap between the resources that health systems require and the resources they are allocated. Governments also need to pay attention to how resources are used, to avoid any further widening of inequalities.
20
08
20
09
20
10
20
11
20
12
20
13
20
14
20
15
20
16
20
17
20
18
Fig. 5.7 Change in catastrophic health spending and unmet need for health care due to cost, distance and waiting time in Greece, 2008–2018
12
10
0
6
8
14
4
2
12
10
0
6
8
14
4
2
Catastrophic health spending
Notes: population refers to people aged 16 years and over.
Sources: adapted from WHO Regional Office for Europe (2019) and Chletsos et al. (in press). Data on unmet need from Eurostat (2021).
Unmet need for health care
Spending on health in Europe: entering a new era 75

Health financing policy is less resilient to economic shocks in some countriesHealth financing policy plays an important role in building health system resilience to shocks (Thomson et al., 2015; Thomas et al., 2020). Health systems are particularly vulnerable to shocks when levels of public spending on health are low as a share of GDP and out-of-pocket payments are high as a share of current spending on health, implying significant gaps in health coverage. In an economic shock, health systems will also be vulnerable if public spending on health relies heavily on employment (SHI schemes) and countercyclical mechanisms to mitigate the effects of rising unemployment and falling wages are lacking or weak.
Chapter 2 showed how low levels of public spending on health generally result in high levels of out-of-pocket payment, which in turn increases the likelihood of unmet need and financial hardship (see Fig. 2.9). It is difficult for countries to provide strong financial protection when out-of-pocket payments account for more than around 15% of current spending on health (see Fig. 2.7). In 2018 three-quarters of the countries in the European Region exceeded this threshold (see Fig. 2.8).
Countries that relied heavily on out-of-pocket payments before COVID-19 – especially if public spending on health was low as a share of GDP – may find it hard to prevent increases in unmet need and financial hardship in the coming years (Fig. 5.8). If out-of-pocket spending slows in the wake of the pandemic, as it did after the global financial crisis (Fig. 5.5), this shift should not be (mis)interpreted as improved financial protection but understood as the likely outcome of foregone care caused by health service disruption and financial barriers to access linked to rising unemployment and poverty. It is clear from the experience of Greece and other countries in Europe that financial hardship can increase even when out-of-pocket spending decreases (WHO Regional Office for Europe, 2019).
Chapter 3 showed how over half of the countries in the European Region (28 in 2018) mainly channel public spending on health through SHI schemes (see Fig. 3.1). Many SHI schemes rely heavily on contributions levied on wages (payroll taxes), which constitute a narrow public revenue base in comparison to the government budget as a whole. The more a health system is financed through wages, the more cyclical it is likely to be: its revenue will automatically shrink when the economy contracts, unless countercyclical mechanisms are in place to prevent this from happening.
Another cyclical design feature commonly associated with SHI schemes is the linking of entitlement to health care to payment of social insurance contributions. This practice has led to gaps in population coverage being systematically larger in countries with SHI schemes (see Fig. 3.5). In the context of an economic downturn, it also means that people are likely to lose health coverage and access to health services just as they need it most.
Spending on health in Europe: entering a new era 76

Spending on health in Europe: entering a new era 77
Fig. 5.8 Out-of-pocket payments as a share of current spending on health in 2018 and estimated GDP growth in 2020 in the European Region
Ou
t-o
f-p
ock
et p
aym
ents
as
a s
ha
re o
f cu
rren
t sp
end
ing
on
hea
lth
(%
)
Estimated GDP growth in 2020 (%)
-14 -12 -10 -8 -6 -4 -2 0 2
15
0
30
45
60
75
90
Note: the figure does not include data for Andorra and Monaco. The orange line indicates out-of-pocket payments at 15% of current spending on health.
Sources: IMF (2020), WHO (2020a).
KGZ
MNE
SPAITA
POR
GRE
MATBIH
SWIEST
ISR
HUN
UNK
CRO
BEL
ALB
UKR
CYP
GEO
MKD
MDA BUL
RUS
SRB
KAZ LTU
BLR
POL
FIN
ROM
TUR
DENSWE
NETLUXSVN
CZH
AUTSVK
ICE DEU
NOR
IRE
LVA
AZE
TKM
TJK
UZB
ARM
FRA
SMR

Public policy can mitigate the negative effects of COVID-19 and build health system resilience The following steps will help countries to tackle cyclicality in the design of health financing policy, ensure that out-of-pocket payments do not result in financial barriers to access or financial hardship, and increase the priority given to health in allocating government spending.
Broaden the public revenue base for the health system. Greater use of government budget transfers can address the problem of cyclicality in SHI schemes (revenue falling as the economy contracts). Almost all SHI schemes in the European Region already benefit from government budget support, but in some countries budget support is low as a share of SHI scheme revenue (see Fig. 3.4) and should be increased. Early evidence suggests several countries quickly moved to increase budget support to prevent a reduction in SHI scheme revenue from wage-based contributions (WHO Regional Office for Europe et al., 2021). Replacing this type of discretionary policy response with automatic stabilizers would help to mitigate uncertainty in the future (Orszag, Rubin & Stiglitz, 2021).
Introduce and strengthen automatic stabilizers. All health systems would benefit from automatic stabilizers – mechanisms that explicitly link the allocation of financial (and human) resources for health to population health needs, enabling resources to increase in line with needs. Some countries in Europe already use formulas to enhance the countercyclicality of government budget transfers to SHI schemes, an example of good practice that should be more widely adopted, alongside other automatic stabilizers.
De-link access to health services from health insurance status. SHI schemes that link entitlement to payment of contributions systematically discriminate against people in relatively vulnerable situations – those who lose jobs or whose wages are falling and can no longer afford to pay contributions. This outcome is also unfair where SHI schemes benefit from government budget support because many people excluded from coverage will have contributed to the government budget through payment of other taxes. De-linking entitlement from payment of contributions, so that people can access health care regardless of health insurance status, will reduce financial barriers to access.
Re-design co-payment policy to protect people at risk of poverty or social exclusion and people with chronic conditions. A large body of evidence indicates that user charges (co-payments) are not a good instrument for guiding health care decision-making, undermine access, financial protection and efficiency, and harm health (Swartz, 2010; Chandra et al., 2021; Chernew et al., 2021). Because there is no economic rationale for user charges, countries should avoid introducing or increasing them. If user charges are already in place, however, they can be re-designed to make them less harmful through exemptions for people at risk of poverty and people with chronic conditions, annual caps on all
Spending on health in Europe: entering a new era 78

co-payments, and the replacement of percentage co-payments with low, fixed co-payments (WHO Regional Office for Europe, 2019). Better co-payment policy helps to reduce financial barriers to access and financial hardship by allowing the health system to target the people most in need of protection.
Reprioritize the government budget to ensure sustained increases in public spending on health. Many health systems in the European Region will need substantial additional public funding in the medium and longer term. Failing to increase public investment is likely to weaken health system performance and lead to negative social and economic outcomes. Increased investment will entail some reprioritization of the government budget in favour of the health system and other sectors that have a significant impact on health, such as social protection and education.
Use priority-setting processes and other instruments to ensure additional public investment in the health system meets equity and efficiency goals. Policy responses to the global financial crisis show how the so-called savings generated by health budget cuts and coverage restrictions were generally likely to undermine efficiency and equity (Thomson et al., 2015). Very few health systems in Europe were able to do the same with less, let alone more with less. New investment, however, can be directed towards meeting equity and efficiency goals – for example, if additional funds are used to strengthen PHC, core public health functions and preparedness for future shocks; target under-resourced parts of the health system and underserved groups of people; and minimize fragmentation and duplication.
Austerity is not an option: there is no economic recovery without health securityFaced with the need for higher public spending on health and the prospect of a reduction in government revenue, countries may find it challenging to think of reprioritizing government spending to favour health, social protection and education. It is clear, however, that austerity is not a viable option. Health budget cuts and coverage restrictions led to negative outcomes after the global financial crisis. They can only undermine health system performance and the recovery from COVID-19 in the months and years ahead.
Two factors offer support to governments willing to put improving people’s lives and livelihoods at the heart of the recovery.
First, international financial institutions strongly encourage countries to invest in health systems and have recently warned against premature withdrawal of government support on the grounds that failing to provide continuing investment would slow the speed of recovery (European Commission, 2021; IMF, 2021; OECD, 2021). Their advice today marks a clear departure from the cuts to public social spending fostered through
Spending on health in Europe: entering a new era 79

earlier economic adjustment programmes. It is a fundamental shift in approach, reflecting on one hand recognition of the damage austerity caused after the global financial crisis (Stuckler et al., 2017; Szczepanski, 2019; Rajmil et al., 2020) and, on the other, the importance of the health sector to societal well-being, economic development and resilience to future shocks.
Second, this shift in thinking among international financial institutions is closely aligned with public preferences. Survey after survey carried out in the last 10 years has shown the extent to which people value access to health care and public investment in health systems and other social sectors (European Bank for Reconstruction and Development, 2011, 2016; OECD, 2019b; United Nations, 2021).
Health security requires political will, better tax systems and international solidarityMany of the things people value most in life can only be achieved through the actions of well-resourced governments. Prompted by need, and with support from international financial institutions and changing public opinion, all countries will benefit from efforts to reform tax systems so that they are more effective, fairer, better able to redistribute resources and aligned with policies that promote health and well-being. Policy options include closing loopholes that allow individuals and corporations to avoid taxes, closing tax havens, removing tax deductions that favour richer people, taxing wealth and making greater use of taxes that penalize activities harmful to human and planetary health – for example, taxes on carbon, tobacco, alcohol and sugary drinks (European Commission, 2020; IMF, 2020; OECD, 2020b). Carbon and other health taxes do not need to be earmarked for health, however, as earmarking has not been shown to be an effective instrument for increasing public investment in health (Cashin et al., 2017). It is not earmarking so much as political commitment to health that is the decisive factor.
Increased investment in health and other social sectors is unlikely to be possible in all parts of the European Region without greater international solidarity (European Commission, 2020; IMF, 2021; OECD, 2021). As this report has shown, health systems in many countries are characterized by low levels of public spending and heavy reliance on out-of-pocket payments, which already limits progress towards UHC and weakens resilience to shocks. Some of these countries have also experienced a reduction in external aid in recent years (see Fig. 1.7). In 2020 the EU strengthened international solidarity by setting up a Recovery and Resilience Facility to offer its Member States grants and loans financed through EU-wide borrowing – another welcome departure from responses to the global financial crisis – but more needs to be done by all international actors for middle-income countries in the European Region. This is also a matter of political will.
Spending on health in Europe: entering a new era 80

References
Abel-Smith B (1988). The rise and decline of the early HMOs: some international experiences. Milbank Q. 66(4): 694-719.
Cashin C, Sparkes S, Bloom D (2017). Earmarking for health: from theory to practice. Geneva: World Health Organization (https://apps.who.int/iris/handle/10665/255004, accessed 19 March 2021).
Chandra A, Flack E, Obermeyer Z (2021). The Health Costs of Cost-Sharing. Cambridge (MA): National Bureau of Economic Research (Working Paper 28439; http://www.nber.org/papers/w28439, accessed 19 March 2021).
Chernew M, Cooper Z, Hallock EL, Morton FS (2021). Physician agency, consumerism, and the consumption of lower-limb MRI scans. J Health Econ. 76:102427. doi:10.1016/j.jhealeco.2021.102427.
Chletsos M, Economou C, O’Donnell O (in press). Can people afford to pay for health care? New evidence on financial protection in Greece. Copenhagen: WHO Regional Office for Europe.
Cylus J, Thomson S, Evetovits T (2018). Catastrophic health spending in Europe: equity and policy implications of different calculation methods. Bull World Health Organ. 96:599–609. doi:10.2471/BLT.18.209031.
Dominis S, Yazbeck AS, Hartel LA (2018). Keys to Health System Strengthening Success: Lessons from 25 Years of Health System Reforms and External Technical Support in Central Asia. Health Syst Reform. 4:160–9. doi:10.1080/23288604.2018.1440348.
Economou C, Kaitelidou D, Karanikolos M, Maresso A (2017). Greece: health system review. Health Systems in Transition. 19(5):1–192 (https://eurohealthobservatory.who.int/publications/i/greece-health-system-review-2017, accessed 19 March 2021).
European Bank for Reconstruction and Development (2011). Life in Transition. After the crisis. London: European Bank for Reconstruction and Development (https://www.ebrd.com/news/publications/special-reports/life-in-transition-survey-ii.html, accessed 19 March 2021).
European Bank for Reconstruction and Development (2016). Life in Transition. A decade of measuring transition. London: European Bank for Reconstruction and Development (https://www.ebrd.com/publications/life-in-transition-iii, accessed 19 March 2021).
European Commission (2016). Report of the Expert Panel on Effective Ways of Investing in Health (EXPH) on access to health services in the European Union – final opinion. Brussels: European Commission (https://ec.europa.eu/health/expert_panel/sites/expertpanel/files/015_access_healthservices_en.pdf, accessed 19 March 2021).
Spending on health in Europe: entering a new era 81
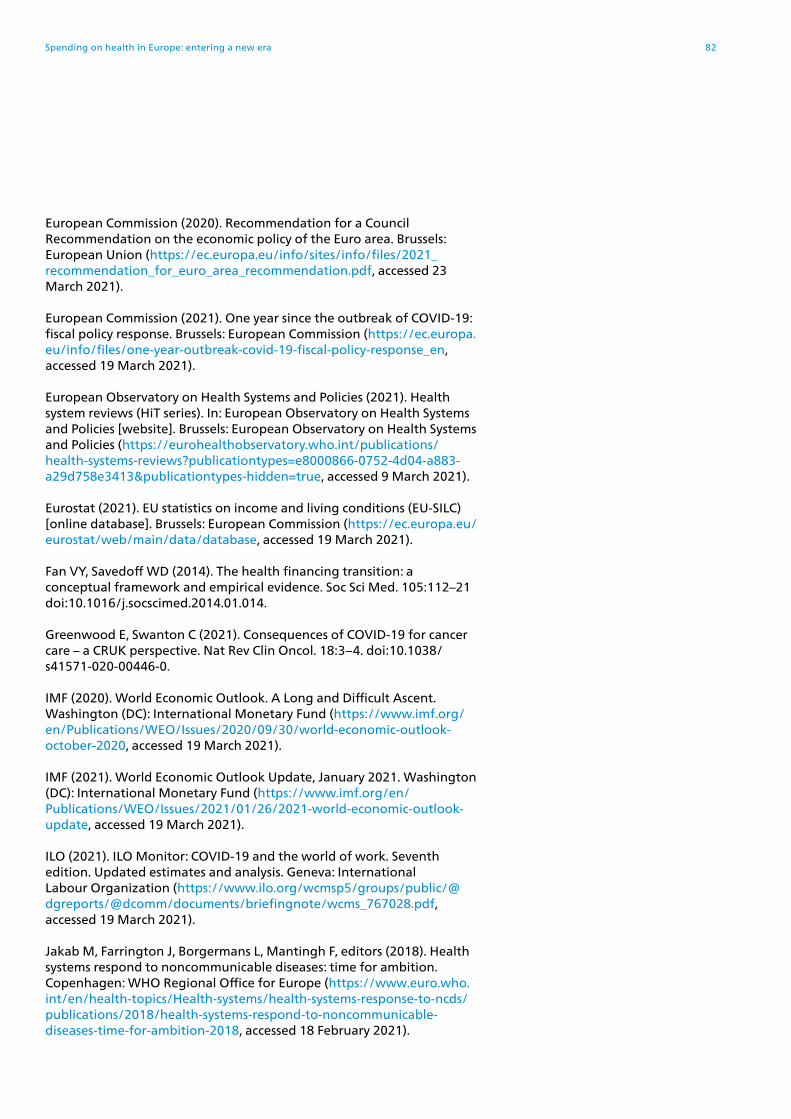
European Commission (2020). Recommendation for a Council Recommendation on the economic policy of the Euro area. Brussels: European Union (https://ec.europa.eu/info/sites/info/files/2021_recommendation_for_euro_area_recommendation.pdf, accessed 23 March 2021).
European Commission (2021). One year since the outbreak of COVID-19: fiscal policy response. Brussels: European Commission (https://ec.europa.eu/info/files/one-year-outbreak-covid-19-fiscal-policy-response_en, accessed 19 March 2021).
European Observatory on Health Systems and Policies (2021). Health system reviews (HiT series). In: European Observatory on Health Systems and Policies [website]. Brussels: European Observatory on Health Systems and Policies (https://eurohealthobservatory.who.int/publications/health-systems-reviews?publicationtypes=e8000866-0752-4d04-a883-a29d758e3413&publicationtypes-hidden=true, accessed 9 March 2021).
Eurostat (2021). EU statistics on income and living conditions (EU-SILC) [online database]. Brussels: European Commission (https://ec.europa.eu/eurostat/web/main/data/database, accessed 19 March 2021).
Fan VY, Savedoff WD (2014). The health financing transition: a conceptual framework and empirical evidence. Soc Sci Med. 105:112–21 doi:10.1016/j.socscimed.2014.01.014.
Greenwood E, Swanton C (2021). Consequences of COVID-19 for cancer care – a CRUK perspective. Nat Rev Clin Oncol. 18:3–4. doi:10.1038/s41571-020-00446-0.
IMF (2020). World Economic Outlook. A Long and Difficult Ascent. Washington (DC): International Monetary Fund (https://www.imf.org/en/Publications/WEO/Issues/2020/09/30/world-economic-outlook-october-2020, accessed 19 March 2021).
IMF (2021). World Economic Outlook Update, January 2021. Washington (DC): International Monetary Fund (https://www.imf.org/en/Publications/WEO/Issues/2021/01/26/2021-world-economic-outlook-update, accessed 19 March 2021).
ILO (2021). ILO Monitor: COVID-19 and the world of work. Seventh edition. Updated estimates and analysis. Geneva: International Labour Organization (https://www.ilo.org/wcmsp5/groups/public/@dgreports/@dcomm/documents/briefingnote/wcms_767028.pdf, accessed 19 March 2021).
Jakab M, Farrington J, Borgermans L, Mantingh F, editors (2018). Health systems respond to noncommunicable diseases: time for ambition. Copenhagen: WHO Regional Office for Europe (https://www.euro.who.int/en/health-topics/Health-systems/health-systems-response-to-ncds/publications/2018/health-systems-respond-to-noncommunicable-diseases-time-for-ambition-2018, accessed 18 February 2021).
Spending on health in Europe: entering a new era 82

Johnston B, Thomas S, Burke S (2020). Can people afford to pay for health care? New evidence on financial protection in Ireland. Copenhagen: WHO Regional Office for Europe (https://apps.who.int/iris/handle/10665/332978, accessed 19 March 2021).
Jowett M, Kutzin J (2015). Raising revenues for health in support of UHC: strategic issues for policy makers. Geneva: World Health Organization (WHO/HIS/HGF/Policy Brief/15.1; (https://apps.who.int/iris/handle/10665/192280, accessed 18 February 2021).
Kontemeniotis A, Theodorou M (2021). Can people afford to pay for health care? New evidence on financial protection in Cyprus. Copenhagen: WHO Regional Office for Europe (https://apps.who.int/iris/handle/10665/339324, accessed 23 February 2021).
Kraindler J, Rocks S, Charlesworth A, Tallack C, Barclay C, Idriss O et al. (2020). Spending Review 2020: Managing uncertainty. London: The Health Foundation (https://www.health.org.uk/publications/long-reads/managing-uncertainty, accessed 19 March 2021).
Kutzin J, Cashin C, Jakab M, editors (2010). Implementing health financing reform: lessons from countries in transition. Copenhagen: WHO Regional Office for Europe on behalf of the European Observatory on Health Systems and Policies (https://apps.who.int/iris/handle/10665/326420, accessed 23 February 2021).
Mansfield K, Mathur R, Tazare J, Henderson A, Mulick A, Carreira H et al. (2021). Indirect acute effects of the COVID-19 pandemic on physical and mental health in the UK: a population-based study. Lancet Digit Health. doi:https://doi.org/10.1016/S2589-7500(21)00017-0.
Maringe C, Spicer J, Morris M, Purushotham A, Nolte E, Sullivan R et al. (2020). The impact of the COVID-19 pandemic on cancer deaths due to delays in diagnosis in England, UK: a national, population-based, modelling study. Lancet Oncol. 21(8):P1023–34. doi:https://doi.org/10.1016/S1470-2045(20)30388-0.
McFadden P, Gillen P, Moriarty J, Mallett J, Schroder H, Ravalier J et al. (2021). Health and social care workers’ quality of working life and coping while working during the COVID-19 pandemic: Findings from a UK Survey. Belfast: Ulster University (https://577ccd37-5004-401d-b378-2a2af66e499d.filesusr.com/ugd/2749ea_80b032cb75ae425991bd2b55a25cbb0b.pdf, accessed 23 March 2021).
OECD (2019a). Deriving preliminary estimates of primary care spending under the SHA 2011 framework. Paris: Organisation for Economic Co-operation and Development (https://www.oecd.org/health/health-systems/Preliminary-Estimates-of-Primary-Care-Spending-under-SHA-2011-Framework.pdf, accessed 10 March 2021).
Spending on health in Europe: entering a new era 83

OECD (2019b). Risks that Matter. Main Findings from the 2018 OECD Risks that Matter Survey. Paris: Organisation for Economic Co-operation and Development (https://www.oecd.org/social/risks-that-matter.htm, accessed 19 March 2021).
OECD (2020a). Social protection: total public and primary private health insurance. In: OECD.Stat [online database]. Paris: Organisation for Economic Co-operation and Development (https://stats.oecd.org, accessed 23 February 2021).
OECD (2020b). Tax and Fiscal Policy in Response to the Coronavirus Crisis: Strengthening Confidence and Resilience. Paris: Organisation for Economic Co-operation and Development (https://www.oecd.org/tax/tax-policy/tax-and-fiscal-policy-in-response-to-the-coronavirus-crisis-strengthening-confidence-and-resilience.htm, accessed 23 March 2021).
OECD (2021). OECD Economic Outlook, Interim Report March 2021. Paris: Organisation for Economic Co-operation and Development (https://doi.org/10.1787/34bfd999-en, accessed 19 March 2021).
OECD, Eurostat, WHO (2011). A system of health accounts: 2011 edition. Paris: Organisation for Economic Co-operation and Development (https://apps.who.int/iris/handle/10665/44775, accessed 18 February 2021).
Orszag P, Rubin R, Stiglitz J (2021). Fiscal resiliency in a deeply uncertain world: The role of semiautonomous discretion. Washington (DC): Peterson Institute for International Economics (Policy Brief 21-2; https://www.piie.com/publications/policy-briefs/fiscal-resiliency-deeply-uncertain-world-role-semiautonomous-discretion, accessed 19 March 2021).
Patel P, Thomas C, Quilter-Pinner H (2021). Without skipping a beat. The case for better cardiovascular care after coronavirus. Manchester: The Progressive Policy Think Tank (https://www.ippr.org/files/2021-03/without-skipping-a-beat.pdf, accessed 19 March 2021).
Pierce M, Hope H, Ford T, Hatch S, Hotopf M, John A et al. (2020). Mental health before and during the COVID-19 pandemic: a longitudinal probability sample survey of the UK population. Lancet Psychiatry. 7:883–92. doi:10.1016/S2215-0366(20)30308-4
Rajan S, Khunti K, Alwan N, Steves C. Greenhalgh T, MacDermott N et al. (2021). In the wake of the pandemic: preparing for Long COVID. Copenhagen: WHO Regional Office for Europe (https://apps.who.int/iris/handle/10665/339629, accessed 19 March 2021).
Rajmil L, Hjern A, Spencer N, Taylor-Robinson D, Gunnlaugsson G, Raat H (2020). Austerity policy and child health in European countries: a systematic literature review. BMC Public Health 20(1):564. doi:10.1186/s12889-020-08732-3.
Spending on health in Europe: entering a new era 84

Saltman RB, Busse R, Figueras J, editors (2004). Social health insurance systems in western Europe. Maidenhead: Open University Press (https://www.euro.who.int/en/about-us/partners/observatory/publications/studies/social-health-insurance-systems-in-western-europe-2005, accessed 18 February 2021).
Stuckler D, Reeves A, Loopstra R, Karanikolos M, McKee M (2017). Austerity and health: the impact in the UK and Europe. Eur J Public Health. 1;27(Suppl_4):18–21. doi:10.1093/eurpub/ckx167.
Swartz K (2010). Cost-sharing: Effects on spending and outcomes. Princeton: Robert Wood Johnson Foundation (Research Synthesis Report No. 20; https://www.rwjf.org/en/library/research/2011/12/cost-sharing--effects-on-spending-and-outcomes.html, accessed 23 March 2021).
Szczepanski M (2019). A decade on from the crisis: Main responses and remaining challenges. Brussels: European Union (https://www.europarl.europa.eu/thinktank/en/document.html?reference=EPRS_BRI(2019)642253, accessed 23 March 2021).
Tandon A, Fleisher L, Li R, Yap WA (2014). Reprioritizing government spending on health: pushing an elephant up the stairs? Washington (DC): World Bank Group (Health, Nutrition, and Population (HNP) discussion paper; https://documents.worldbank.org/en/publication/documents-reports/documentdetail/911331468331765809/reprioritizing-government-spending%20-on-health-pushing-an-elephant-up-the-stairs, accessed 22 February 2021).
Taube M, Vaskis E, Nesterenko O (2018). Can people afford to pay for health care? New evidence on financial protection in Latvia. Copenhagen: WHO Regional Office for Europe (https://apps.who.int/iris/handle/10665/329454, accessed 19 March 2021).
The Health Foundation (2021). Research reveals scale of reduction in hospital treatment for care home residents and warns of backlog of pent-up demand for NHS care. London: The Health Foundation (https://www.health.org.uk/news-and-comment/news/research-reveals-scale-of-reduction-in-hospital-treatment-fo, accessed 19 March 2021).
Thomas S, Sagan A, Larkin J, Cylus J, Figueras J, Karanikolos M, editors (2020). Strengthening health systems resilience. Key concepts and strategies. Copenhagen: WHO Regional Office for Europe (acting as the host organization for, and secretariat of, the European Observatory on Health Systems and Policies) (Policy Brief 36; https://apps.who.int/iris/handle/10665/332441, accessed 24 March 2021)..
Thomson S, Figueras J, Evetovits T, Jowett M, Mladovsky P, Maresso A et al., editors (2015). Economic crisis, health systems and health in Europe: impact and implications for policy. Maidenhead: Open University Press (https://eurohealthobservatory.who.int/publications/m/economic-crisis-health-systems-and-health-in-europe-impact-and-implications-for-policy, accessed 19 March 2021).
Spending on health in Europe: entering a new era 85

Thomson S, Sagan A, Mossialos E, editors (2020). Private health insurance: history, politics and performance. Cambridge: Cambridge University Press (https://eurohealthobservatory.who.int/publications/m/private-health-insurance-history-politics-and-performance, accessed 23 February 2021).
United Nations (2019). Political Declaration of the High-level Meeting on Universal Health Coverage: “Universal health coverage: moving together to build a healthier world”. New York: United Nations (A/RES/74/2; https://undocs.org/en/A/RES/74/2, accessed 10 March 2021).
United Nations (2021). Shaping our future together. Listening to people’s priorities and expectations of international cooperation. New York: United Nations (https://www.un.org/en/un75/finalreport, accessed 19 March 2021).
Vande Maele N, Xu K, Soucat A, Fleisher L, Aranguren M, Wang H (2019). Measuring primary healthcare expenditure in low-income and lower middle-income countries. BMJ Glob Health. 4:e00149. doi:10.1136/bmjgh-2019-001497.
Wanigasooriya K, Palimar P, Naumann D, Ismail K, Fellows J, Logan P et al. (2020). Mental health symptoms in a cohort of hospital healthcare workers following the first peak of the COVID-19 pandemic in the UK. BJPsych Open. 7(1):e24. doi:10.1192/bjo.2020.150.
WHO (2010). The world health report. Health systems financing: the path to universal health coverage. Geneva: World Health Organization (https://apps.who.int/iris/handle/10665/44371, accessed 18 February 2021).
WHO (2018). Public spending on health: a closer look at global trends. Geneva: World Health Organization (WHO/HIS/HGF/HF Working Paper/18.3; https://apps.who.int/iris/handle/10665/276728, accessed 18 February 2021).
WHO (2019a). Global spending on health: a world in transition. Geneva: World Health Organization (WHO/HIS/HGF/HF Working Paper/19.4; https://apps.who.int/iris/handle/10665/330357, accessed 18 February 2021).
WHO (2019b). Primary health care on the road to universal health coverage. Geneva: World Health Organization (https://www.who.int/healthinfo/universal_health_coverage/report/2019/en/, accessed 23 February 2021).
WHO (2020a). Global Health Expenditure Database [online database]. Geneva: World Health Organization (https://apps.who.int/nha/database/, accessed 18 February 2021).
WHO (2020b). Global spending on health 2020: weathering the storm. Geneva: World Health Organization (https://apps.who.int/iris/handle/10665/337859, accessed 22 March 2021).
Spending on health in Europe: entering a new era 86

WHO, World Bank (2020). Global monitoring report on financial protection in health 2019. Geneva: World Health Organization and International Bank for Reconstruction and Development/The World Bank (https://apps.who.int/iris/handle/10665/331748, accessed 22 February 2021).
WHO Regional Office for Europe (2019). Can people afford to pay for health care? New evidence on financial protection in Europe. Copenhagen: WHO Regional Office for Europe (https://apps.who.int/iris/handle/10665/311654, accessed 18 February 2021).
WHO Regional Office for Europe (2020a). Financial protection and the Sustainable Development Goals. Copenhagen: WHO Regional Office for Europe (https://www.euro.who.int/en/health-topics/Health-systems/health-systems-financing/publications/2020/fact-sheet-on-the-sdgs-financial-protection-and-the-sustainable-development-goals-2020, accessed 22 February 2021).
WHO Regional Office for Europe (2020b). Strengthening the health systems response to COVID-19: Adapting primary health care services to more effectively address COVID-19. Technical working guidance #5. Copenhagen: WHO Regional Office for Europe (https://apps.who.int/iris/handle/10665/332783, accessed 10 March 2021).
WHO Regional Office for Europe (2021). European Programme of Work 2020–2025. United Action for Better Health. Copenhagen: WHO Regional Office for Europe (https://www.euro.who.int/en/health-topics/health-policy/european-programme-of-work/about-the-european-programme-of-work/european-programme-of-work-20202025-united-action-for-better-health-in-europe2, accessed 29 March 2021).
WHO Regional Office for Europe, European Commission, European Observatory on Health Systems and Policies (2021). COVID-19 Health System Response Monitor. Copenhagen: WHO Regional Office for Europe (https://www.covid19healthsystem.org/mainpage.aspx, accessed 22 March 2021).
Williams G, Cylus J, Roubal T, Ong P, Barber S (2019). Sustainable health financing with an ageing population: Will population ageing lead to uncontrolled health expenditure growth? Copenhagen: WHO Regional Office for Europe (acting as the host organization for, and secretariat of, the European Observatory on Health Systems and Policies) (https://www.euro.who.int/en/about-us/partners/observatory/publications/policy-briefs-and-summaries/sustainable-health-financing-with-an-ageing-population-will-population-ageing-lead-to-uncontrolled-health-expenditure-growth-2019, accessed 22 February 2021).
World Bank (2020a). COVID-19: Remittance Flows to Shrink 14% by 2021 [press release]. Washington (DC): World Bank (https://www.worldbank.org/en/news/press-release/2020/10/29/covid-19-remittance-flows-to-shrink-14-by-2021, accessed 19 March 2021).
Spending on health in Europe: entering a new era 87

World Bank (2020b). Europe and central Asia Economic Update, Fall 2020: COVID-19 and Human Capital. Washington (DC): World Bank (https://openknowledge.worldbank.org/handle/10986/34518, accessed 19 March 2021).
World Bank (2021). World Bank Country and Lending Groups. In: The World Bank [website]. Washington (DC): World Bank (https://datahelpdesk.worldbank.org/knowledgebase/articles/906519-world-bank-country-and-lending-groups, accessed 9 March 2021).
Xu K, Soucat A, Kutzin J, Brindley C, Vande Maele N, Toure H et al. (2018). Public spending on health: a closer look at global trends. Geneva: World Health Organization (https://apps.who.int/iris/handle/10665/276728, accessed 10 March 2021).
Spending on health in Europe: entering a new era 88


Annex 1Country income group classification for 2018
Country Code Income group
Albania ALB UMIC
Andorra AND HIC
Armenia ARM UMIC
Austria AUT HIC
Azerbaijan AZE UMIC
Belarus BLR UMIC
Belgium BEL HIC
Bosnia and Herzegovina BIH UMIC
Bulgaria BUL UMIC
Croatia CRO HIC
Cyprus CYP HIC
Czechia CZH HIC
Denmark DEN HIC
Estonia EST HIC
Finland FIN HIC
France FRA HIC
Georgia GEO UMIC
Germany DEU HIC
Greece GRE HIC
Hungary HUN HIC
Iceland ICE HIC
Ireland IRE HIC
Israel ISR HIC
Italy ITA HIC
Kazakhstan KAZ UMIC
Kyrgyzstan KGZ LMIC
Latvia LVA HIC
Lithuania LTU HIC
Luxembourg LUX HIC
Malta MAT HIC
Monaco MON HIC
Montenegro MNE UMIC
Netherlands NET HIC
North Macedonia MKD UMIC
Norway NOR HIC
Notes: HIC: high-income countries; LIC: low-income countries; LMIC: lower-middle-income countries; UMIC: upper-middle-income countries. Tajikistan (a low-income country) is included in the LMIC group in this report.
Source: World Bank (2021). World Bank Country and Lending Groups. In: The World Bank [website]. Washington (DC): World Bank (https://datahelpdesk.worldbank.org/knowledgebase/articles/906519-world-bank-country-and-lending-groups, accessed 9 March 2021).
Spending on health in Europe: entering a new era 90

Country Code Income group
Poland POL HIC
Portugal POR HIC
Republic of Moldova MDA LMIC
Romania ROM UMIC
Russian Federation RUS UMIC
San Marino SMR HIC
Serbia SRB UMIC
Slovakia SVK HIC
Slovenia SVN HIC
Spain SPA HIC
Sweden SWE HIC
Switzerland SWI HIC
Tajikistan TJK LIC
Turkey TUR UMIC
Turkmenistan TKM UMIC
Ukraine UKR LMIC
United Kingdom UNK HIC
Uzbekistan UZB LMIC
Spending on health in Europe: entering a new era 91

Annex 2Data availability by health care functions in 2018
Country General outpatient curative care (HC.1.3.1)
Dental outpatient curative care (HC.1.3.2)
Specialized outpatient curative care (HC.1.3.3)
Home-based curative care (HC.1.4)
Outpatient rehabilitative care (HC.2.3)
Home-based rehabilitative care (HC.2.4)
Outpatient long-term care (HC.3.3)
Home-based long-term care (HC.3.4)
Laboratory services (HC.4.1)
Imaging services (HC.4.2)
Patient transportation (HC.4.3)
Medical goods (HC.5)
Preventive care (HC.6)
Governance, and health system and financing administration (HC.7)
ALB – – – – – – – – – – – – – – ALB
AND – – – – – – – – – – – – – – AND
ARM X X X X X X X – X X X X X X ARM
AUT X X X – X X – X X X X X X X AUT
AZE – – – – – – – – – – – – – – AZE
BEL X X X – X X X X X X X X X X BEL
BIH X X X X X X – X X X X X X X BIH
BLR – – – – – – – – – – – – – – BLR
CRO – – – – – – – – – – – – – – CRO
BUL – – – – – – – – – – – – – – BUL
CYP – – – – – – – – – – – – – – CYP
CZH X X X – X X – X X X X X X X CZH
DEN X X X – X X – X X X X X X X DEN
DEU X X X – X X – X X X X X X X DEU
EST X X X – X X X X X X X X X X EST
FIN X X X – X X – X X X X X X X FIN
FRA – – – – X X – X X X X X X X FRA
GEO X X X X X X – – X X X X X X GEO
GRE – X – – – – – X X X X X X X GRE
HUN X X X – X X – X X X X X X X HUN
ICE X X X – X X – X X X X X X X ICE
IRE – – – – – X – X – – – X X X IRE
ISR – – – – – – – – – – – – – ISR
ITA – – – – – X X X – – – X X X ITA
KAZ X X X – – – – – – X X X X X KAZ
KGZ X X X X X X – – X – – X X X KGZ
LTU X X X – X X X X X X X X X X LTU
LUX X X X – X X X X X X X X X X LUX
LVA X X X – X X X X X X X X X X LVA
MAT – – – – – – – – – – – – – – MAT
MDA X X X X X X – – X X X X X X MDA
MKD X X X X X X – – X X X X X X MKD
Note: (–) means no data are available or no data are reported; (x) means data are reported.
Source: adapted from OECD (2020); WHO (2020).
Spending on health in Europe: entering a new era 92

Country General outpatient curative care (HC.1.3.1)
Dental outpatient curative care (HC.1.3.2)
Specialized outpatient curative care (HC.1.3.3)
Home-based curative care (HC.1.4)
Outpatient rehabilitative care (HC.2.3)
Home-based rehabilitative care (HC.2.4)
Outpatient long-term care (HC.3.3)
Home-based long-term care (HC.3.4)
Laboratory services (HC.4.1)
Imaging services (HC.4.2)
Patient transportation (HC.4.3)
Medical goods (HC.5)
Preventive care (HC.6)
Governance, and health system and financing administration (HC.7)
ALB – – – – – – – – – – – – – – ALB
AND – – – – – – – – – – – – – – AND
ARM X X X X X X X – X X X X X X ARM
AUT X X X – X X – X X X X X X X AUT
AZE – – – – – – – – – – – – – – AZE
BEL X X X – X X X X X X X X X X BEL
BIH X X X X X X – X X X X X X X BIH
BLR – – – – – – – – – – – – – – BLR
CRO – – – – – – – – – – – – – – CRO
BUL – – – – – – – – – – – – – – BUL
CYP – – – – – – – – – – – – – – CYP
CZH X X X – X X – X X X X X X X CZH
DEN X X X – X X – X X X X X X X DEN
DEU X X X – X X – X X X X X X X DEU
EST X X X – X X X X X X X X X X EST
FIN X X X – X X – X X X X X X X FIN
FRA – – – – X X – X X X X X X X FRA
GEO X X X X X X – – X X X X X X GEO
GRE – X – – – – – X X X X X X X GRE
HUN X X X – X X – X X X X X X X HUN
ICE X X X – X X – X X X X X X X ICE
IRE – – – – – X – X – – – X X X IRE
ISR – – – – – – – – – – – – – ISR
ITA – – – – – X X X – – – X X X ITA
KAZ X X X – – – – – – X X X X X KAZ
KGZ X X X X X X – – X – – X X X KGZ
LTU X X X – X X X X X X X X X X LTU
LUX X X X – X X X X X X X X X X LUX
LVA X X X – X X X X X X X X X X LVA
MAT – – – – – – – – – – – – – – MAT
MDA X X X X X X – – X X X X X X MDA
MKD X X X X X X – – X X X X X X MKD
Country
Spending on health in Europe: entering a new era 93

Country General outpatient curative care (HC.1.3.1)
Dental outpatient curative care (HC.1.3.2)
Specialized outpatient curative care (HC.1.3.3)
Home-based curative care (HC.1.4)
Outpatient rehabilitative care (HC.2.3)
Home-based rehabilitative care (HC.2.4)
Outpatient long-term care (HC.3.3)
Home-based long-term care (HC.3.4)
Laboratory services (HC.4.1)
Imaging services (HC.4.2)
Patient transportation (HC.4.3)
Medical goods (HC.5)
Preventive care (HC.6)
Governance, and health system and financing administration (HC.7)
MNE – – – – – – – – – – – – – – MNE
MON – – – – – – – – – – – – – – MON
NET X X X – X X X X X X X X X X NET
NOR X X X – – – – X X – X X X X NOR
POL X X X – X X X X X X X X X X POL
POR – – – – X X – X – – – X X X POR
ROM – – – – – – – – – – – – – – ROM
RUS – X – – – X X – X – X X X X RUS
SMR – – – – – – – – – – – – – – SMR
SPA X X X – – X – X X X X X X X SPA
SRB – – – – – – – – – – – – – – SRB
SVK X X X – X – X X X X X X X X SVK
SVN X X X – X X – X X X X X X X SVN
SWE X X X – X X – X X – X X X X SWE
SWI X X X – X – – X X X X X X X SWI
TJK X X X – – X – – X X X X X X TJK
TKM – – – – – – – – – – – – – – TKM
TUR – – – – – – – – – – – – – – TUR
UKR – – – – – – – – – – – – – – UKR
UNK – – – – X X X – – – X X X UNK
UZB X X X – – – – – X X X X X X UZB
Spending on health in Europe: entering a new era 94

Country General outpatient curative care (HC.1.3.1)
Dental outpatient curative care (HC.1.3.2)
Specialized outpatient curative care (HC.1.3.3)
Home-based curative care (HC.1.4)
Outpatient rehabilitative care (HC.2.3)
Home-based rehabilitative care (HC.2.4)
Outpatient long-term care (HC.3.3)
Home-based long-term care (HC.3.4)
Laboratory services (HC.4.1)
Imaging services (HC.4.2)
Patient transportation (HC.4.3)
Medical goods (HC.5)
Preventive care (HC.6)
Governance, and health system and financing administration (HC.7)
MNE – – – – – – – – – – – – – – MNE
MON – – – – – – – – – – – – – – MON
NET X X X – X X X X X X X X X X NET
NOR X X X – – – – X X – X X X X NOR
POL X X X – X X X X X X X X X X POL
POR – – – – X X – X – – – X X X POR
ROM – – – – – – – – – – – – – – ROM
RUS – X – – – X X – X – X X X X RUS
SMR – – – – – – – – – – – – – – SMR
SPA X X X – – X – X X X X X X X SPA
SRB – – – – – – – – – – – – – – SRB
SVK X X X – X – X X X X X X X X SVK
SVN X X X – X X – X X X X X X X SVN
SWE X X X – X X – X X – X X X X SWE
SWI X X X – X – – X X X X X X X SWI
TJK X X X – – X – – X X X X X X TJK
TKM – – – – – – – – – – – – – – TKM
TUR – – – – – – – – – – – – – – TUR
UKR – – – – – – – – – – – – – – UKR
UNK – – – – X X X – – – X X X UNK
UZB X X X – – – – – X X X X X X UZB
Country
Spending on health in Europe: entering a new era 95


The WHO Regional Office for Europe
The World Health Organization (WHO) is a specialized agency of the United Nations created in 1948 with the primary responsibility for international health matters and public health. The WHO Regional Office for Europe is one of six regional offices throughout the world, each with its own programme geared to the particular health conditions of the countries it serves.
World Health Organization Regional Office for Europe
UN City, Marmorvej 51, DK-2100 Copenhagen Ø, DenmarkTel.: +45 45 33 70 00 Fax: +45 45 33 70 01 Email: [email protected]: www.euro.who.int
Member States
AlbaniaAndorraArmeniaAustriaAzerbaijanBelarusBelgiumBosnia and HerzegovinaBulgariaCroatiaCyprusCzechiaDenmarkEstonia
FinlandFranceGeorgiaGermanyGreeceHungaryIcelandIrelandIsraelItalyKazakhstanKyrgyzstanLatviaLithuania
LuxembourgMaltaMonacoMontenegroNetherlandsNorth MacedoniaNorwayPolandPortugalRepublic of MoldovaRomaniaRussian FederationSan MarinoSerbia
SlovakiaSloveniaSpainSwedenSwitzerlandTajikistanTurkeyTurkmenistanUkraineUnited KingdomUzbekistan