spending more and getting less
TRANSCRIPT

1
Elizabeth Bradley, PhDProfessor of Public Health
Yale School of Public [email protected]
Follow @EHBYale
Getting to Better Health: CONNECTing Care and Community
UNIVERSAL HEALTH CAREFoundation of Connecticut
Spending More and Getting Less

Acknowledgements
Robert Wood Johnson FoundationBlue Cross Blue Shield of Massachusetts Foundation
Co-author: Lauren TaylorPresidential Scholar, Harvard Divinity School
Collaborators: Erika Rogan, Maureen Canavan, Kristina Talbert-Slagle, Chima Ndumele, Leslie Curry
2

3
Acknowledgements
Robert Wood Johnson Foundation
Blue Cross Blue Shield of Massachusetts Foundation
Co-author Lauren TaylorPresidential Scholar,
Harvard Divinity School

0
2
4
6
8
10
12
14
16
18
20
Health Care Spending as a % of GDP, 2009
*Turkey is missing health expenditures data for 2009

Knee Replacements
Kidney Transplants
MRIs
Some Very Real Benefits
5

Some Very Enduring Challenges
Out of 34 OECD Countries
25th in maternal mortality
26th in life expectancy
28th in low birth weight

What determines health? SOCIAL,
ENVIRONMENTAL, and BEHAVIORAL
FACTORS(60%)
GENETICS(20%)
HEALTH CARE (20%)

Job training and employment
programs
supportive housing
& rent subsidies
nutritional support & family
assistance
other social services that exclude health
benefits
Social Services

9
France
Swed
en
Denmark
Austria
Finlan
d
German
y
Belgium
Italy
Portuga
l
Netherl
ands
United St
ates
Spain
Norway
Greece
Hungary
United Kingd
omIre
land
OECD
Luxe
mbourg
Slove
niaJap
an
Poland
New Ze
aland
Icelan
d
Canad
a
Czech Rep
ublic
Estonia
Slova
k Rep
ublic
Australi
aIsr
ael
ChileKorea
Mexico
0.00
5.00
10.00
15.00
20.00
25.00
30.00
35.00
40.00Total Investment in Health as a % GDP
Social Service Spending, %GDP
Health Care Spending, %GDP
*Switzerland and Turkey are missing data for 2009

Italy
Hungary
Luxe
mbourg
Poland
Finlan
d
Estonia
Belgium
Austria
Denmark
Spain
Norway
France
Czech Rep
ublic
Swed
en
United Kingd
om
German
y
Greece
Portuga
lJap
an
Irelan
d
Slove
niaOEC
DIsr
ael
Icelan
d
Slova
k Rep
ublic
Australi
a
New Ze
aland
Netherl
ands
Chile
Canad
aKorea
Mexico
United St
ates
0.00
0.50
1.00
1.50
2.00
2.50 Ratio of Social-to-Health Spending, 2009
*Switzerland and Turkey are missing data for 2009
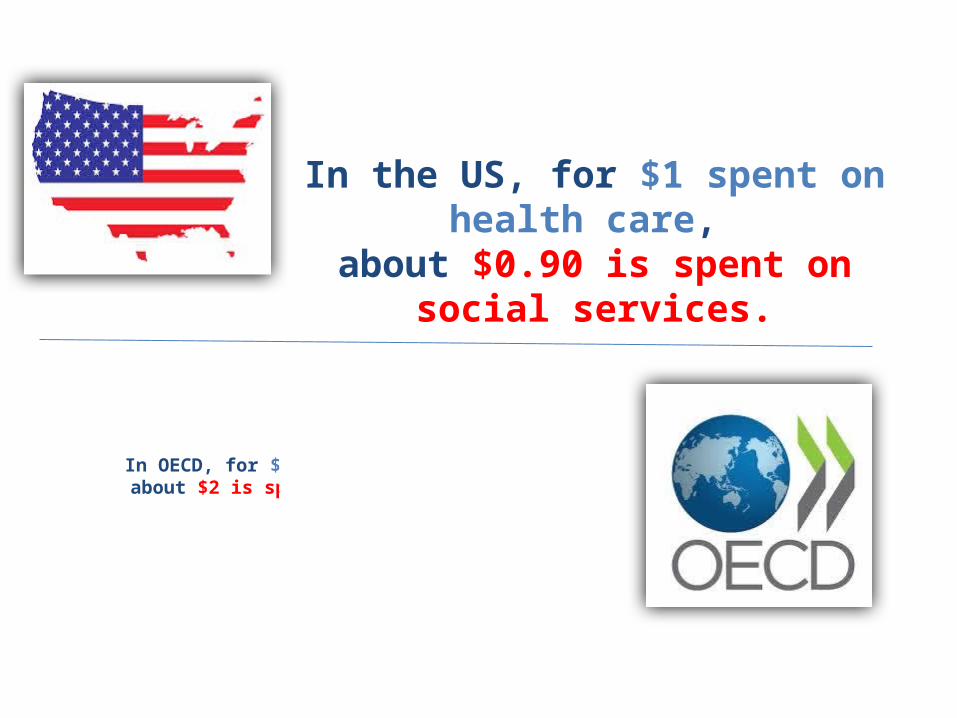
In OECD, for $1 spent on health care, about $2 is spent on social services.
In the US, for $1 spent on health care, about $0.90 is spent on social services.

12
Determinants
SOCIAL, ENVIRONMENTAL, and BEHAVIORAL
FACTORS(60%)
GENETICS(20%)
HEALTH CARE(20%)
HEALTH CARE SPENDING
(65%)
SOCIAL SERVICE SPENDING
(35%)
InvestmentMismatch

Does it matter?
13

Countries with higher ratios of social-to-health spending have statistically better health outcomes.
Lower infant mortality Fewer low birth weight babies
Less premature deathLonger life expectancy
Bradley , Elkins, Herrin, Elbel et al., BMJ Open, 2011

15
What about inside the United States?

All Social _x000d_Services
Education Income _x000d_Support
Transportation Public Safety Environment Housing0.0%
2.0%
4.0%
6.0%
8.0%
10.0%
12.0%
14.0%
16.0%
18.0%
20.0%
16
Social Services Spending by Type of Service (as % of GDP, 2009)
Health ca
re
17
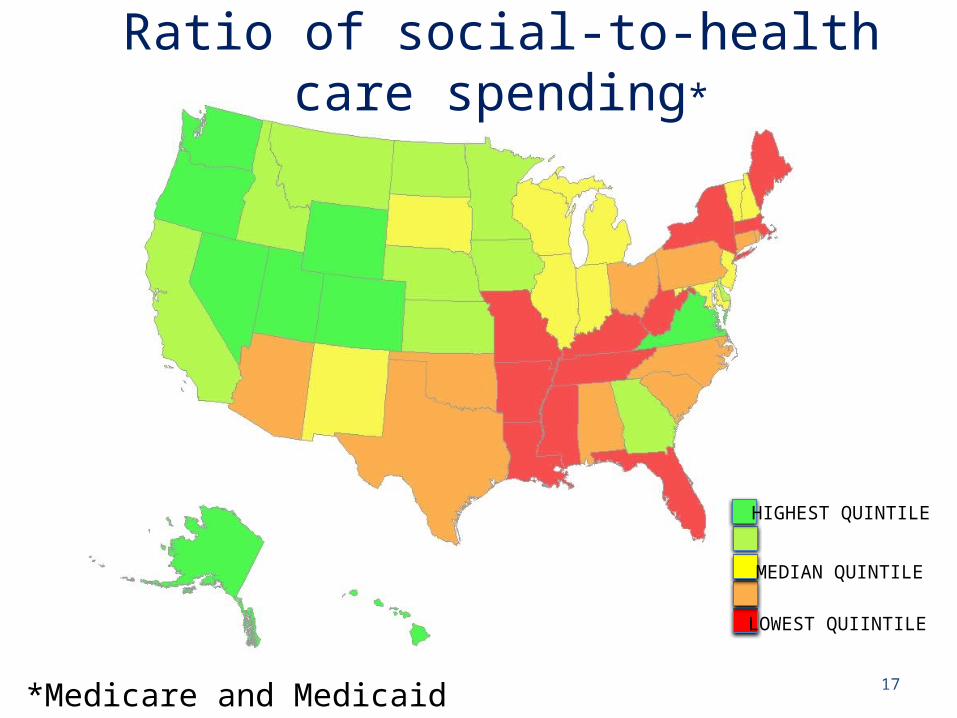
Ratio of social-to-health care spending*
*Medicare and Medicaid spending
LOWEST QUIINTILE
MEDIAN QUINTILE
HIGHEST QUINTILE

18
Ratio social-to-health spending
Percent of population that is obese
LOWEST QUIINTILE
MEDIAN QUINTILE
HIGHEST QUINTILE
HIGHEST QUIINTILE
MEDIAN QUINTILE
LOWEST QUINTILE

States with higher ratios of social-to-health spending have statistically better health outcomes.
Lower mortality among those with lung cancerLower rates of asthma and obesity
Lower rates of limitation in daily activities per monthLower rates of mentally unhealthy days per month
Lower post-neonatal mortality
2000-2009 data, adjusted for region, GDP, and socioeconomic factors Bradley et al., under review 2015

What to do?
Spend more! 28% GDP 35% GDP?
Transfer $$ from health care to social services
20
Taxes? NON-STARTER
Unlikely
Incentivize collaboration on health

Evidence Supports Integrative Models
Health Care SectorCommunity Outreach
Mobile Clinics
Case Management, Patient Navigators, Care
Coordination
Nutrition support
Housing First

Mobilizing collaboration for health nationally
Mitigate financial incentives to medicalize health
Establish common metrics for health and social services- % obese, % depressed…- % on target to finish high school- % employed- % housed
Talk differently about health and health care
22

Health = Health Care

Thank you
Follow @EHBYale@laurentaylorMPH
24

Extra slides for reference
25

Public Health Services DefinedDescription: Provision of services for the conservation and improvement of public health, other than hospital care, and financial support of other governments’ health programs.Included examples: Special Supplemental Nutrition Program for Women, Infants, and Children (WIC), protective inspection services, health related inspections, community health care programs, regulation of air and water quality, rabies and animal control, ambulance and emergency medical services (unless operated by local fire department), and hazardous waste cleanup. Also includes medical appliances, supplies, or services as part of public assistance programs as well as construction and maintenance of nursing homes, homes for the elderly, orphanages, and veterans' homes.
26

Social Services Spending CategoriesEducation (primary, secondary, and higher education)TransportationEnvironmentPublic SafetyHousingCorrectionsIncome Support, including:
– Social Security (Old-Age, Survivors, and Disability Insurance)– Supplemental Security Income (SSI)– Temporary Assistance for Needy Families (TANF)– Supplemental Nutrition Assistance Program (SNAP)
Public Health Programming, including:– Special Supplemental Nutrition Program for Women, Infants, and Children (WIC) – Protective inspection services– Health related inspections– Community health care programs– Regulation of air and water quality– Rabies and animal control– Hazardous waste cleanup

% State GDP
State Variation in Health Care Spending (Medicaid and Medicare) (as % of GDP, 2009)
WV ME KY MI SC FL AL
NM LA OKMA IN NC NH IA IL MD OR TX NE ND HI
VA AK UT DC0
2
4
6
8
10
12

Spending on Social Services
EducationIncome Support, TANF, SSI, Social Security, SNAP
Transportation, Public Safety and EnvironmentCorrections and Housing
Other social services excluding health care
* And public health spending

% State GDPState Variation in Social Services Spending
(as % of GDP, 2009)
WV MS ME VT KY AR MI RI SC NY FL PA AL OH
NM MO LA TN OK AZMA W
I IN MT NC ID NH CT IA MN IL NJMD KS OR CA TX SD NE GA ND
WA HI DE VA NV AK CO UT
WY DC
0
5
10
15
20
25
30

31
Social Services-to-Medicaid & Medicare Spending Ratio, 2009
AK UT CO DC VA ND GA ID MN IA NJMD SD IL MI
OH AZ PA NC CT FL NYMO KY ME MS
0
1
2
3
4
5
6

C-TRAIN (Portland, OR)
32
• Academic medical center• 570-bed facility• 33% of patients are un- or
under-insured
• 501c3 serving Portland• Serving individuals and
families facing homelessness, poverty and addiction
• Affordable housing is primary service, plus health care, recovery services and employment assistance
RCT has found C-TRAIN patients have lower mortality and better quality of care;
hospital is funding expansionEnglander, J Hosp Med, 2012

33
Academic Medical Center2,600 beds
Community Center with childhood asthma rates 3 times national average
Bilingual Community Health Workers provide asthma education and referrals for housing, immigration, and mental health services.
50% decline in emergency visits and hospitalizations; 30% decline in school absenteeism
WIN for Asthma
http://nyp.org/services/acn_outreach_win.html

The 10th Decile Project
Works with hospitals to identify the 10% of homeless people with the highest hospital costs and to find permanent housing with strong medical and mental health support.
34
Healthcare costs decreased by 72%, from $58,962 to $16,474 per person.
http://www.economicrt.org/pub/Getting_Home_2013/Getting_Home_2013.pdf

Opportunity costs
1 Emergency department visit = 1 month’s rent
2 hospitalization = 1 year of child care
20 MRIs = 1 social worker for a year
60 echocardiograms = 1 public school teacher for a year
35SGIM Presidential Speech, Dr. Moran, 2015