speed and safety - rac foundation · speed and safety evidence from published data ... and some...
TRANSCRIPT

Speed and SafetyEvidence from published data
C G B (Kit) Mitchell August 2012

The Parliamentary Advisory Council for Transport Safety (PACTS) is a registered charity and associate Parliamentary group. Its charitable objective is: To protect human life through the promotion of transport safety for the public benefit. It brings together safety practitioners, researchers and politicians to argue for research-based, cost-effective solutions to transport safety issues.
The Royal Automobile Club Foundation for Motoring is a transport policy and research organisation which explores the economic, mobility, safety and environmental issues relating to roads and their users. The Foundation publishes independent and authoritative research with which it promotes informed debate and advocates policy in the interest of the responsible motorist.
RAC Foundation 89–91 Pall Mall London SW1Y 5HS
Tel no: 020 7747 3445 www.racfoundation.org
Registered Charity No. 1002705 August 2012 © Copyright Royal Automobile Club Foundation for Motoring
Although not commissioned by the RAC Foundation, this report has been published to inform wider debate about the issue. The report content reflects the views of the author.

Speed and SafetyEvidence from published data
C G B (Kit) Mitchell August 2012

iSpeed and Safety – Evidence from published data
About the authorDr C G B (Kit) Mitchell worked at RRL/TRRL/Transport Research Laboratory from 1970 to 1994 on public transport, transport planning, the effects of transport policies on different groups of people, and environmental issues. From the early 1980s he also ran TRRL’s research on transport for disabled people, and was co-chair of the US Transportation Research Board’s (TRB) Committee on Accessible Transportation and Mobility 2003–09. Recipient of the William G Bell Award for services to accessible transportation, 2001 and Emeritus Member TRB 2011. Since retirement he has remained active and was editor for the Chartered Institute of Highways and Transportation (CIHT) guidelines ‘Planning for Public Transport in Developments’ and author of the guidelines ‘Moving Freight’. He provides the statistics database for the Institute of Advanced Motorists’ (IAM) ‘Motoring Facts’, and his interest in safety has grown from studies concerned with older drivers and pedestrians. In 2010 he produced a review of research on older drivers for the RAC Foundation, and during 2009–10 assisted the UN Development Programme with a study to improve the accessibility of public transport in Penang State, Malaysia.
About this reportAlthough not commissioned by the RAC Foundation, this report has been published to inform wider debate about the issue. The report content reflects the views of the author.
iiSpeed and Safety – Evidence from published data
ContentsForeword iii
Introduction 1
Speed Limit Offences 1
Speed Compliance 3
Casualties 6
Discussion 13
References 14

iiiSpeed and Safety – Evidence from published data
ForewordFor a number of years, there has been considerable interest in the relationship between speed and crashes, and in the most effective way of encouraging drivers to comply with the posted speed limit. The ultimate aim of any road safety policy must be to improve safety. Part of the improvement will be achieved through increases in compliance.
This paper brings together a number of different sources within Department for Transport and Ministry of Justice data. It begins to set out a compelling story that over the last few years, compliance with the 30 mph limit has improved, casualties have fallen, and the number of drivers receiving penalty points has also reduced. Perhaps at long last, we are beginning to understand that driving slower in urban areas saves lives.
There is also a second interesting narrative: just as the government proposes raising the motorway speed limit to 80 mph, drivers are actually reducing speeds on this part of the network. The demand for higher speeds seems less significant than politicians had thought. And as this piece of work shows, a higher speed limit on motorways is likely to lead to increased accident rates.
Kit Mitchell’s paper gives us plenty to think about. We are grateful to him for putting the data together to challenge our perceptions.
Robert GiffordExecutive Director, PACTS
Stephen GlaisterDirector, RAC Foundation

1. Introduction
2. Speed Limit Offences
Material published by the Department for Transport (DfT) provides clear evidence of changing behaviour by car drivers with respect to speeding, and some indication of possible road safety benefits. This note summarises the information that is available.
There has been a large variation in the number of speed limit offences committed by motorists over recent years in England and Wales (Figure 1). These offences include all findings of guilty at all courts, fixed penalty notices and written warnings in England and Wales. The data comes from Transport Statistics Great Britain (TSGB), most recently TSGB 2011 Table TSGB0811 (also filed as Table RAS61001) (DfT, 2011c), and originally from the Ministry of Justice and the Home Office (Ministry of Justice, 2010; Povey et al., 2010).
1Speed and Safety – Evidence from published data

Figure 1: Speed limit offences by motorists in England and Wales
0.0
0.5
1.0
1.5
2.0
1975 1980 1985 1990 1995 2000 2005
Num
ber o
f offe
nces
(mill
ion)
Source: DfT (2011c)
The number of offences per year started to increase from about 300,000 before 1985 to 680,000 in 1995, 1,001,000 in 1999 and 2,041,000 in 2003. Then, from a peak of 2,087,000 in 2005, the number of offences fell rapidly to 1,270,000 in 2009, the most recent data available. Some will attribute this fall to motorists using global positioning systems (GPS) and maps to warn them of the location of speed enforcement cameras, but the free flow speed data reviewed below shows that, particularly in urban areas, at least some of the reduction in speed limit offences is the result of better speed compliance. Another possible contributor is the introduction of speed awareness courses as alternatives to penalties.
2Speed and Safety – Evidence from published data

Methodology
Data on the speeds at which vehicles have been travelling under free flow conditions has been measured using automatic traffic counters (ATCs) since the late 1990s. This is published by the DfT, most recently in Free Flow Vehicle Speeds in Great Britain 2010 (FFVSGB) (DfT, 2011a), Tables SPE0101 to SPE0104.These statistics provide insight into the speeds at which drivers choose to travel and their compliance with speed limits, but they should not be taken as estimates of actual average speed across the road network.
3. Speed Compliance
The traffic speed data is collected from a sample of 96 ATCs from a national network of around 180 ATCs. This sample was deliberately chosen to include ATCs located where external factors that might affect driver behaviour and restrict speed are not present (including junctions, hills, sharp bends and speed enforcement cameras). The data concerns vehicles of various types (cars, motorcycles, two-axle heavy goods vehicles, and buses and coaches) and are firstly presented as the percentage of that type of vehicle exceeding the speed limit, and exceeding the speed limit plus 5 mph on built-up roads or the speed limit plus 10 mph on non-built-up roads. In addition, data is given on the percentages of vehicles in various speed bands above and below the speed limit.
This note will concentrate on the speeds of cars on 30 mph built-up roads and on motorways. About 26 ATCs are used to measure speeds on 30 mph roads and 27 ATCs on motorways. Only about 10 ATCs are sited to measure speeds on 40 mph roads and 7 ATCs on non built-up dual carriageway roads, so these will not be discussed in this paper.
3Speed and Safety – Evidence from published data

Cars in built-up areas
Figure 2: Percentage of cars exceeding the 30 mph speed limit and the limit plus 5 mph on built-up roads
0%
10%
20%
30%
40%
50%
60%
70%
80%
1998
30 mph limit – % over limit
30 mph limit – % more than 5 mph over limit
2000 2002 2004 2006 2008 2010 2012
Per
cent
age
exce
edin
g sp
eed
limit
Source: DfT (2011a)
Figure 2 shows the percentage of cars on built-up roads that exceed the speed limit and, since 2001, the limit plus 5 mph, on 30 mph roads in free flow conditions. The reduction in cars exceeding the limit on 30 mph roads is most impressive, from 69% in 1998 to 46% in 2010. The percentage exceeding the limit by more than 5 mph is much lower, and has declined even more in proportionate terms, from 32% in 2001 to 16% in 2010. The average speed reduced from 32 mph in 2001 to 29.8 mph in 2010 (about 7%).
4Speed and Safety – Evidence from published data

Cars in non-built-up areas
Figure 3: Percentage of cars exceeding the 70 mph speed limit and the limit plus 10 mph on motorways
0%
10%
20%
30%
40%
50%
60%
1998
Motorways – % over limit
Motorways – % more than 10 mph over limit
26–27 sites on motorways
1998 2000 2002 2004 2006 2008 2010 2012
Per
cent
age
exce
edin
g sp
eed
limit
Source: DfT(2011a) Note: For 2001 and 2010, speed was measured at 26 stations. For all other years (2002 to 2009) it was measured at 27 stations.
Figure 3 shows the percentage of cars on motorways that exceed the speed limit and the limit plus 10 mph. The percentage of cars exceeding the speed limit has declined from 57% in 2003 to 49% in 2010, having been constant at 54% from 1997 to 2002. The percentage exceeding the limit by more than 10 mph has declined from 20% in 2003 to 14% in 2010. The average speed of cars has reduced from 70 mph in 2001 to 69 mph in 2010.
Implications for speed limit offences
The reductions in the percentages of cars exceeding speed limits, on 30 mph roads since 1998 and on motorways since 2003, are not large enough to fully explain the reductions in the numbers of speed limit offences since 2005. While some of the reduction in offences may be a result of motorists being better aware of the locations of enforcement cameras, probably more than half the reduction is a result of real reductions in the speeds of cars in free flowing traffic. This is because the speeds of 35 mph and 80 mph are approximately those at which enforcement action is likely to be taken. The reductions in the percentages of cars exceeding 35 mph and 80 mph since 2005 are about 25%, and this indicates how much real speed reductions should have reduced offences. The actual reduction in offences is 39%, so speed reductions should account for more than 60% of the reduction in offences. The difference between
5Speed and Safety – Evidence from published data

The measures of casualty rates that are likely to be influenced by the reductions in the percentage of cars exceeding speed limits are, on motorways:
• All casualties on motorways per vehicle kilometre on motorways; and
• Car occupant casualties on motorways per car kilometre on motorways.
4. Casualties
And on 30 mph built-up roads:
• All casualties per population on built-up roads;• Car occupant casualties per population on built-up roads;• Car occupant casualties per car kilometre traffic on built-up roads; and• Pedestrian casualties per population on built-up roads.
Data on casualty numbers, from which the rates can be derived, are all available as standard tabulations from Road Accidents/Road Casualties/Reported Road Casualties Great Britain (RAGB, RCGB and RRCGB respectively) since at least 1995, and since 1990 with motorways included with non-built-up roads. The tables of data are RAS30016 in 2010 and Table 24 of RCGB for earlier years (DfT, 2011b). Casualty numbers are available as killed, killed and seriously injured (KSI), and all severities. Pedestrians are included as they are about 40% of all fatalities on built-up roads, and are known to be particularly affected by the speed of vehicles. In 2010, 81% of pedestrians injured in urban areas were hit by cars, as were 68% of pedestrian fatalities (DfT, 2011b, Table RAS40004).
the reduction in speeding offences and the reduction in speeds that would normally trigger offences could be due to an increasing number of drivers taking speed awareness courses instead of having points added to their licence.
6Speed and Safety – Evidence from published data

Built-up roads
Figure 4: The pedestrian fatality rate on built-up roads per million population plotted against the percentage of cars exceeding the 30 mph limit
0
2
4
6
8
10
12
14
30%
R2 = 0.8677
Percentage over speed limit, 30 mph limit roads
35% 40% 45% 50% 55% 60% 65% 75%70%
Fata
lity
rate
on
built
-up
road
s (p
edes
tria
ns
per m
illio
n)
Source: Author’s analysis based on DfT’s FFVSGB (Table SPE0104), RAGB (1997–2001: Table 24), RCGB (2002–9: Table 24), Road Statistics (2008: Table 4.5a), Road Traffic Estimates (2010: TRA0204), RRCGB (2010: Table RAS30016) and TSGB (1992–2003: Table 4.9; 2004–9: Table 7.4)
Figure 4 plots the pedestrian fatality rate on built-up roads per million population against the proportion of cars exceeding the 30 mph limit on built-up roads. The resulting scatter plot can be reasonably fitted by a straight line, and the correlation between pedestrian deaths and cars exceeding the speed limit has a value of the correlation coefficient R2 of 0.87. This means that changes in the percentage of cars exceeding the speed limit is associated with the change in pedestrian fatalities.
The correlation coefficient is a measure of the strength and direction of the linear relationship between two variables. On a graph of one variable plotted against the other, a wide scattering of points about the linear trend line is indicative of low correlation, while a set of points none of which is far from the trend line indicates high correlation. A value of R2 of 1.00 means that the points for one variable lie on a straight line when plotted against the other variable.
Statistical correlation does not necessarily imply cause; both speed and fatality rate could be varying together because of the variation of some other factor, with no causal link between speed and fatality rate. Other research has identified a link between speed and casualties (e.g. Taylor et al., 2002), although this report is particularly concerned with non-built-up single carriageway roads, rather than 30 mph built-up roads. The correlation
7Speed and Safety – Evidence from published data

coefficient between pedestrian deaths and cars exceeding 30 mph is slightly higher than that with cars exceeding 35 mph (0.87 versus 0.78). This may be because there are only 10 observations for 35 mph (2001 to 2010), compared with 13 for 30 mph (1998 to 2010).
Taylor et al. (2002) cite other studies that suggest that on urban roads the percentage change in accident rate is about 2.25 times the percentage change in speed, or 6–9% per 1 mph speed change, while on non-built-up roads the change in accident rate is 2.5 times and the change in KSI casualties 2.6 times the change in speed. Thus the 7% or 2.2 mph change in average speed in 30 mph areas since 2001 should reduce accidents (of all kinds) by 16%, and deaths by a larger percentage, as deaths and serious injuries are more sensitive to speed. The actual reduction in accidents of all severities on 30 mph built-up roads since 2001 is 32% (DfT, 2011b, for 2010 Table RAS10003 and 2005 Table 4).
The correlation coefficient between all fatal casualties in built-up areas and the percentage of cars exceeding 30 mph is lower than that for pedestrians (see Table 1 at end of this section), and that for car occupants lower still. The correlations for the all severity casualty rates are higher than for fatal casualties.
Motorways
Figure 5: The car occupant fatality rate per billion car kilometre plotted against the percentage of cars exceeding 70 mph on motorways
0.0
0.5
1.0
1.5
2.0
2.5
46%
R2 = 0.2974
Percentage over speed limit, motorways
48% 50% 52% 54% 56% 58%
Car
occ
upan
t fat
ality
rate
on
mot
orw
ays
(fata
litie
s pe
r bill
ion
car k
m)
Source: Author’s analysis based on DfT’s Focus on Roads (1998: Table 10.1), FFVSGB 2010 (Table SPE0103), RCGB (2002–9: Table 24), Road Statistics 2008 (Figure 4.5a), Road Traffic Estimates (Table TRA0204), RRCGB (2010: Table RAS30016) and TSGB (1992–2003: Table 4.9; 2004–9: Table 7.4)
8Speed and Safety – Evidence from published data

Figure 6: The car occupant fatality rate per billion car kilometre plotted against the percentage of cars exceeding 80 mph on motorways
0.0
0.5
1.0
1.5
2.0
2.5
12%
R2 = 0.4776
Percentage of cars more than 10 mph over speed limit, motorways
14% 16% 18% 20% 22%
Car
occ
upan
t fat
ality
rate
on
mot
orw
ays
(fata
litie
s pe
r bill
ion
car k
m)
Source: Author’s analysis based on DfT’s Focus on Roads (1998: Table 10.1), FFVSGB 2010 (Table SPE0103), RCGB (2002–9: Table 24), Road Statistics (2008: Figure 4.5a), Road Traffic Estimates (Table TRA0204), RRCGB (2010: Table RAS30016) and TSGB (1992–2003: Table 4.9; 2004–9: Table 7.4)
Turning to motorways, Figures 5 and 6 show the fatal casualty rate for car occupants on motorways per 100 million car kilometres on motorways against the percentages of cars exceeding the speed limit of 70 mph and the speed limit plus 10 mph (80 mph). The correlation coefficient is higher for the percentage of cars exceeding 80 mph than that exceeding 70 mph, and higher still for the rates for car occupant casualties of all severities.
9Speed and Safety – Evidence from published data

Correlations between casualty rates and cars exceeding the speed limit
Table 1: Regression coefficients R2 for various casualty measures and speed
Casualty rate Correlation coefficient with percentage of cars exceeding
30 mph on built-up roads
35 mph on built-up roads
70 mph on motorways
80 mph on motorways
Pedestrians on built-up roads
Fatalities per population 0.868 0.783
All severities per population 0.941 0.883
Car occupants on built-up roads
Fatalities per population 0.378 0.570
All severities per population 0.870 0.828
Fatalities per car km traffic 0.309 0.540
All severities per car km traffic
0.874 0.844
All road users on built-up roads
Fatalities per population 0.620 0.633
All severities per population 0.902 0.862
Car occupants on motorways
Fatalities per car km traffic 0.297 0.478
All severities per car km traffic
0.391 0.700
All road users on motorways
Fatalities per motor vehicle km traffic
0.454 0.661
All severities per motor vehicle km traffic
0.400 0.695
Source: Author’s analysis based on DfT’s Focus on Roads (1998: Table 10.1), FFVSGB (Table SPE0103 & SPE0104), RAGB (1997–2001: Table 24), RCGB (2002–9: Table 24), Road Statistics (2008: Table 4.5a & Figure 4.5a), Road Traffic Estimates (2010: TRA0204), RRCGB (2010: Table RAS30016) and TSGB (1992–2003: Table 4.9; 2004–9: Table 7.4)
10Speed and Safety – Evidence from published data
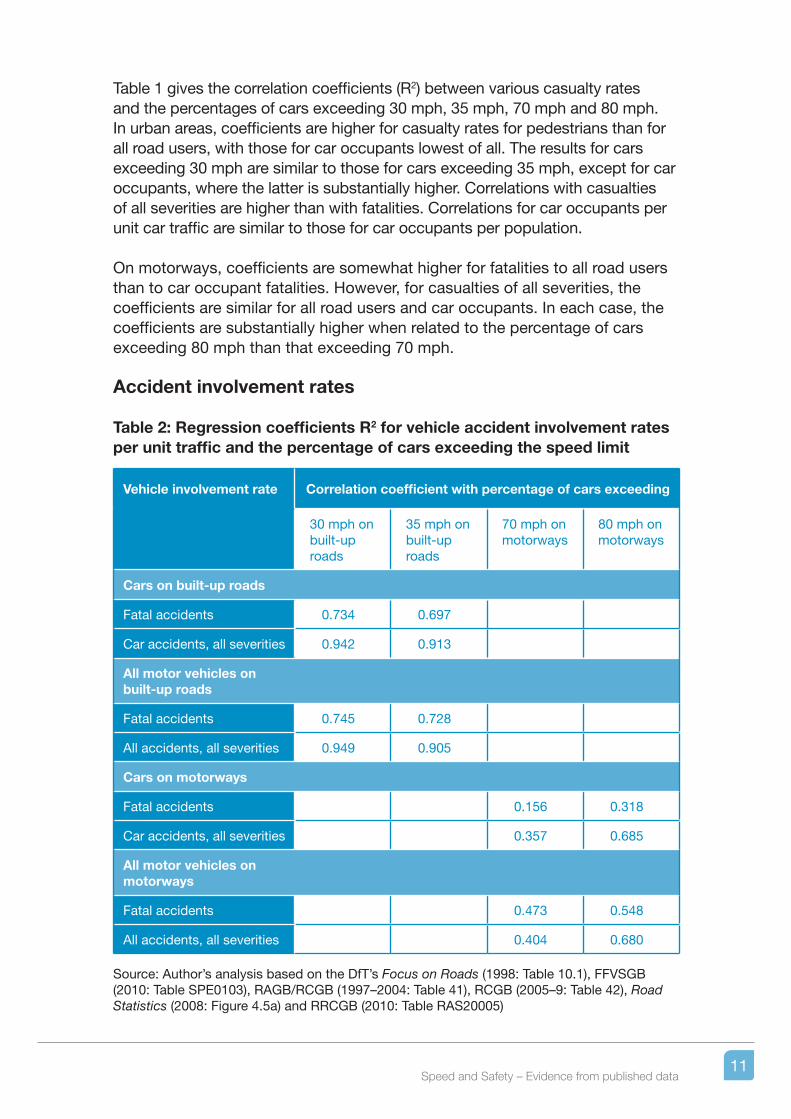
Table 1 gives the correlation coefficients (R2) between various casualty rates and the percentages of cars exceeding 30 mph, 35 mph, 70 mph and 80 mph. In urban areas, coefficients are higher for casualty rates for pedestrians than for all road users, with those for car occupants lowest of all. The results for cars exceeding 30 mph are similar to those for cars exceeding 35 mph, except for car occupants, where the latter is substantially higher. Correlations with casualties of all severities are higher than with fatalities. Correlations for car occupants per unit car traffic are similar to those for car occupants per population.
On motorways, coefficients are somewhat higher for fatalities to all road users than to car occupant fatalities. However, for casualties of all severities, the coefficients are similar for all road users and car occupants. In each case, the coefficients are substantially higher when related to the percentage of cars exceeding 80 mph than that exceeding 70 mph.
Accident involvement rates
Table 2: Regression coefficients R2 for vehicle accident involvement rates per unit traffic and the percentage of cars exceeding the speed limit
Vehicle involvement rate Correlation coefficient with percentage of cars exceeding
30 mph on built-up roads
35 mph on built-up roads
70 mph on motorways
80 mph on motorways
Cars on built-up roads
Fatal accidents 0.734 0.697
Car accidents, all severities 0.942 0.913
All motor vehicles on built-up roads
Fatal accidents 0.745 0.728
All accidents, all severities 0.949 0.905
Cars on motorways
Fatal accidents 0.156 0.318
Car accidents, all severities 0.357 0.685
All motor vehicles on motorways
Fatal accidents 0.473 0.548
All accidents, all severities 0.404 0.680
Source: Author’s analysis based on the DfT’s Focus on Roads (1998: Table 10.1), FFVSGB (2010: Table SPE0103), RAGB/RCGB (1997–2004: Table 41), RCGB (2005–9: Table 42), Road Statistics (2008: Figure 4.5a) and RRCGB (2010: Table RAS20005)
11Speed and Safety – Evidence from published data
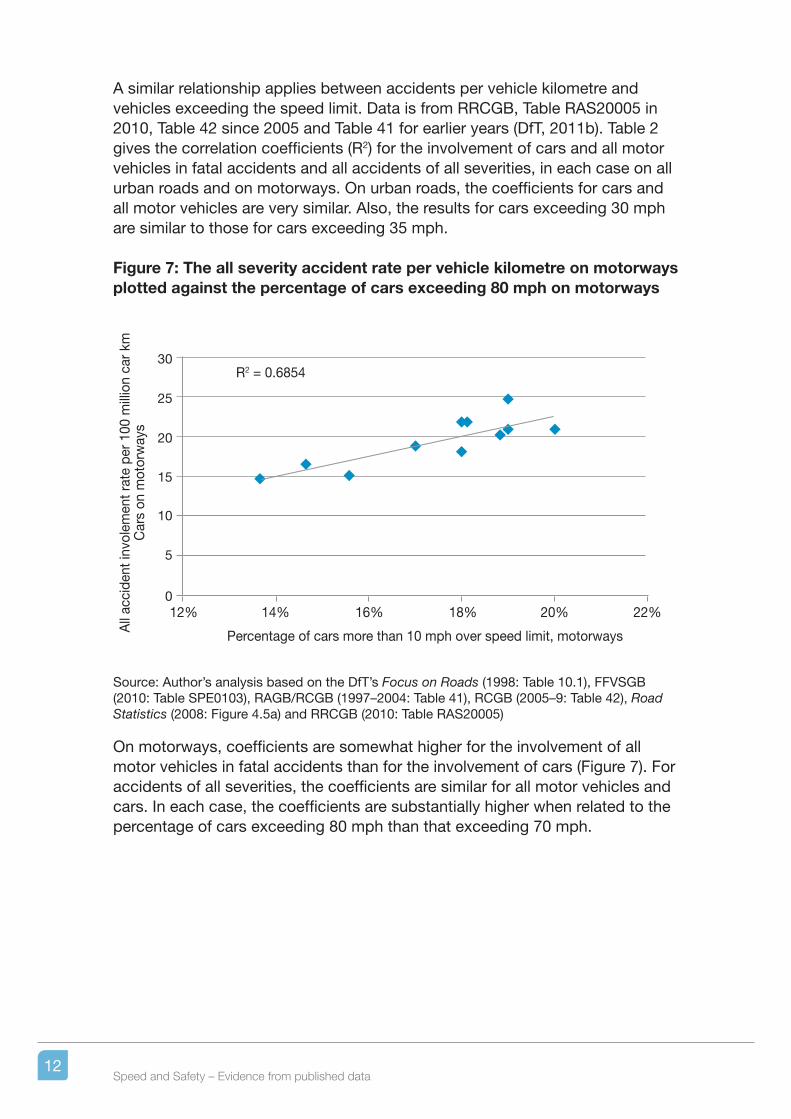
A similar relationship applies between accidents per vehicle kilometre and vehicles exceeding the speed limit. Data is from RRCGB, Table RAS20005 in 2010, Table 42 since 2005 and Table 41 for earlier years (DfT, 2011b). Table 2 gives the correlation coefficients (R2) for the involvement of cars and all motor vehicles in fatal accidents and all accidents of all severities, in each case on all urban roads and on motorways. On urban roads, the coefficients for cars and all motor vehicles are very similar. Also, the results for cars exceeding 30 mph are similar to those for cars exceeding 35 mph.
Figure 7: The all severity accident rate per vehicle kilometre on motorways plotted against the percentage of cars exceeding 80 mph on motorways
0
5
10
15
20
25
30
12%
R2 = 0.6854
Percentage of cars more than 10 mph over speed limit, motorways
14% 16% 18% 20% 22%
All
acci
dent
invo
lem
ent r
ate
per 1
00 m
illio
n ca
r km
C
ars
on m
otor
way
s
Source: Author’s analysis based on the DfT’s Focus on Roads (1998: Table 10.1), FFVSGB (2010: Table SPE0103), RAGB/RCGB (1997–2004: Table 41), RCGB (2005–9: Table 42), Road Statistics (2008: Figure 4.5a) and RRCGB (2010: Table RAS20005)
On motorways, coefficients are somewhat higher for the involvement of all motor vehicles in fatal accidents than for the involvement of cars (Figure 7). For accidents of all severities, the coefficients are similar for all motor vehicles and cars. In each case, the coefficients are substantially higher when related to the percentage of cars exceeding 80 mph than that exceeding 70 mph.
12Speed and Safety – Evidence from published data

The reduction in cars exceeding 35 mph in 30 mph areas is particularly impressive. At least part of the reduction in speed limit offences since 2005 does seem to reflect real reductions in speeding, as well as possibly better awareness of the locations of speed enforcement cameras and the introduction of speed awareness courses in place of penalties.
The high correlation between the fatality and all severity casualty rates for pedestrians on built-up roads and the percentage of cars exceeding the limit in 30 mph areas demonstrates an association between casualties and speeds, though it cannot prove a causal link. The moderately high correlations between car occupant fatalities and the percentage of cars exceeding 80 mph on motorways, and between accidents per vehicle kilometre and the percentage of cars exceeding 80 mph on motorways, reinforces this association. The higher correlations with the percentages of cars exceeding 80 mph than those exceeding 70 mph emphasises that it is the faster vehicles that are associated with accidents and casualties. Other research, such as that reported in Taylor et al. (2002), confirms the relation between speed and accident or casualty rates.
Although the free flow speed measurements have been made at a rather small number of sites, they do indicate clearly the improving compliance with speed limits on built-up roads since 1998 and on motorways since 2003. This suggests that a combination of enforcement and education is gradually changing attitudes to speeding, particularly in urban areas, in the same way that attitudes to drinking and driving were changed in the 1970s and 1980s.
5. Discussion
13Speed and Safety – Evidence from published data

References
14Speed and Safety – Evidence from published data

The Royal Automobile Club Foundation for Motoring is a transport policy and research organisation which explores the economic, mobility, safety and environmental issues relating to roads and their users. The Foundation publishes independent and authoritative research with which it promotes informed debate and advocates policy in the interest of the responsible motorist.
RAC Foundation 89–91 Pall Mall London SW1Y 5HS
Tel no: 020 7747 3445 www.racfoundation.org
Registered Charity No. 1002705 August 2012 © Copyright Royal Automobile Club Foundation for Motoring
Designed and printed by The Javelin Partnership Ltd Tel: 0118 907 3494
Produced on paper from a managed sustainable source, using pulp that is ECF, also FSC certified as containing 50% recycled waste. Printed using vegetable soya based inks.