spectrum of aortic stenosis - american society of...
TRANSCRIPT

Spectrum of Aortic Stenosis: Etiology and Echo Quantification
Martin G. Keane, MD, FASEProfessor of MedicineLewis Katz School of Medicine
at Temple University

Review Question #1
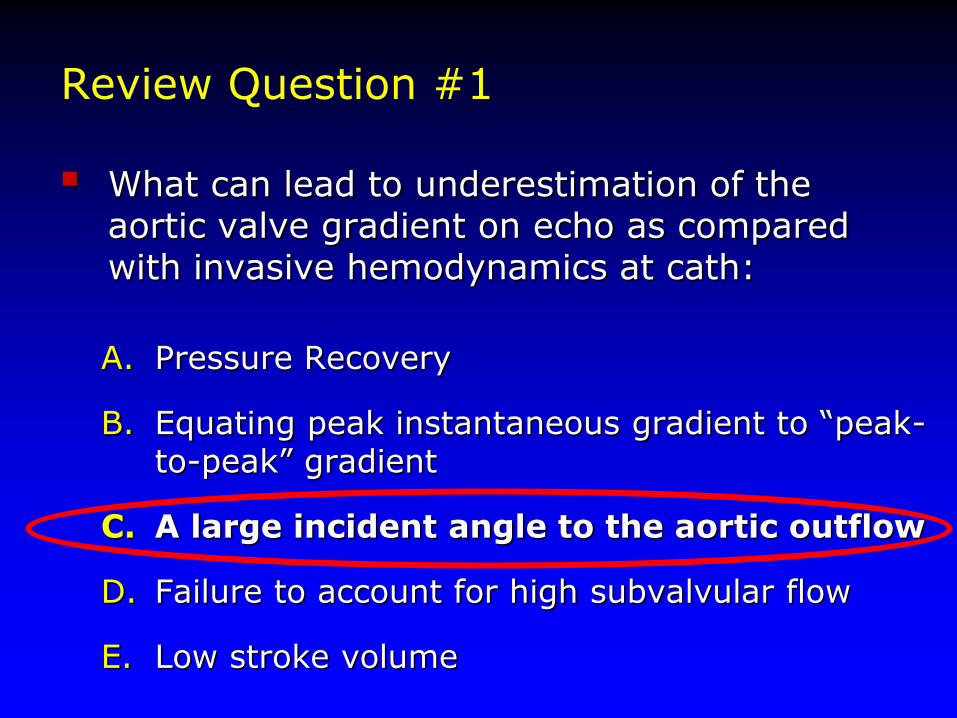
What can lead to underestimation of the aortic valve gradient on echo as compared with invasive hemodynamics at cath:
A. Pressure Recovery
B. Equating peak instantaneous gradient to “peak-to-peak” gradient
C. A large incident angle to the aortic outflow
D. Failure to account for high subvalvular flow
E. Low stroke volume

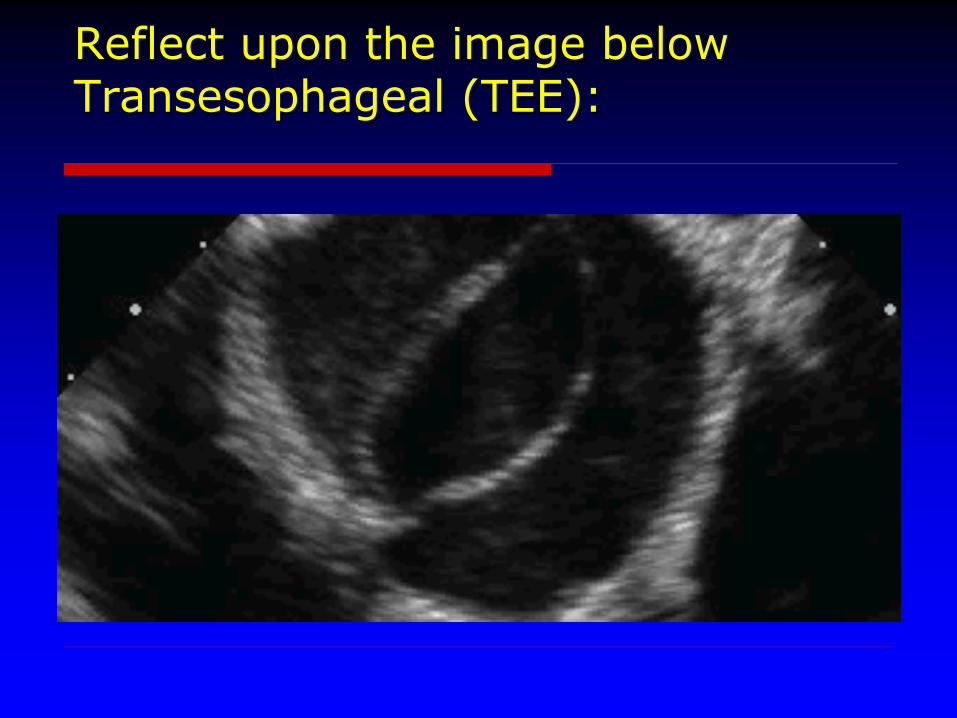
Reflect upon the image belowTransesophageal (TEE):
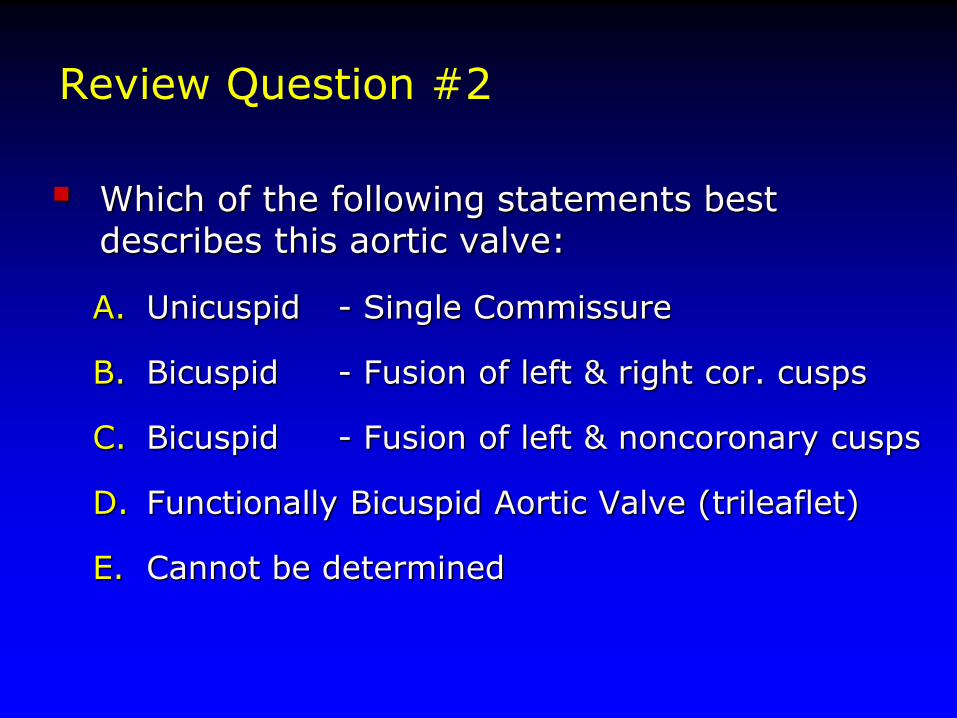
Review Question #2
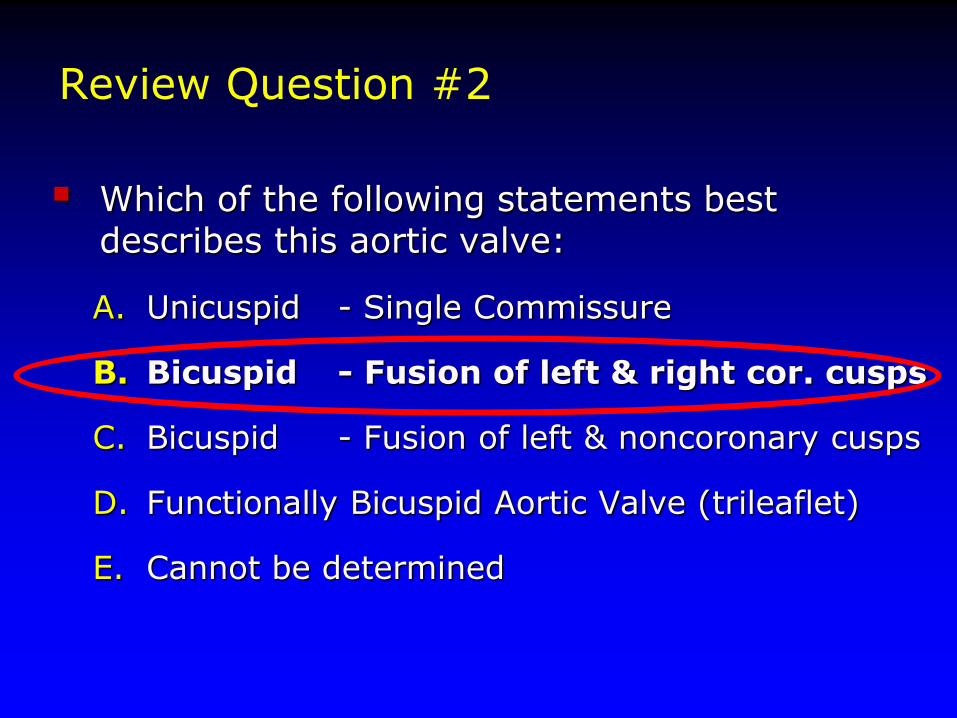
Which of the following statements best describes this aortic valve:
A. Unicuspid - Single Commissure
B. Bicuspid - Fusion of left & right cor. cusps
C. Bicuspid - Fusion of left & noncoronary cusps
D. Functionally Bicuspid Aortic Valve (trileaflet)
E. Cannot be determined

Review Question #3
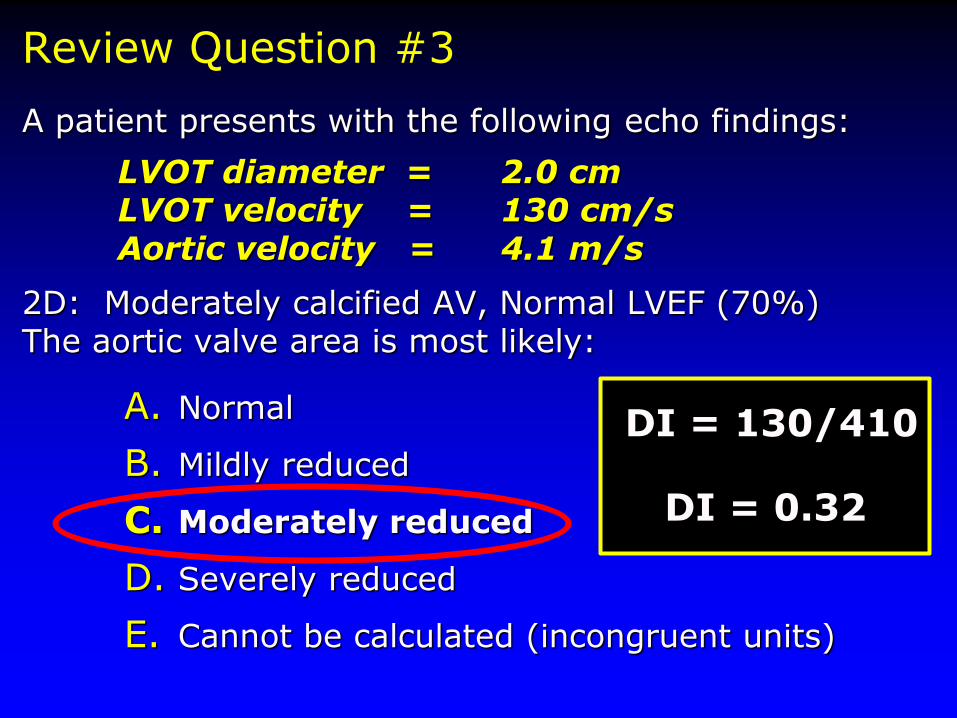
A patient presents with the following echo findings:
LVOT diameter = 2.0 cmLVOT velocity = 130 cm/sAortic velocity = 4.1 m/s
2D: Moderately calcified AV, Normal LVEF (70%) The aortic valve area is most likely:
A. Normal
B. Mildly reduced
C. Moderately reduced
D. Severely reduced
E. Cannot be calculated (incongruent units)
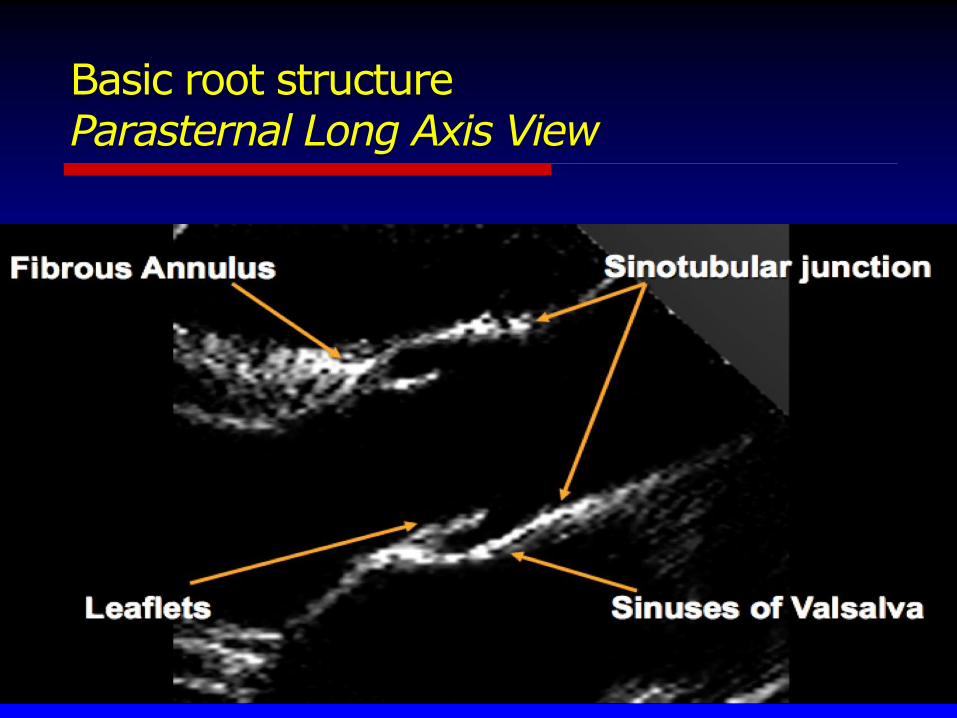
Basic root structureParasternal Long Axis View

Normal AVparasternal color Doppler

Normal AV M-Modecoaptation in center of aortic root

Normal AVorientation and opening
Diastole Systole
N
R
L
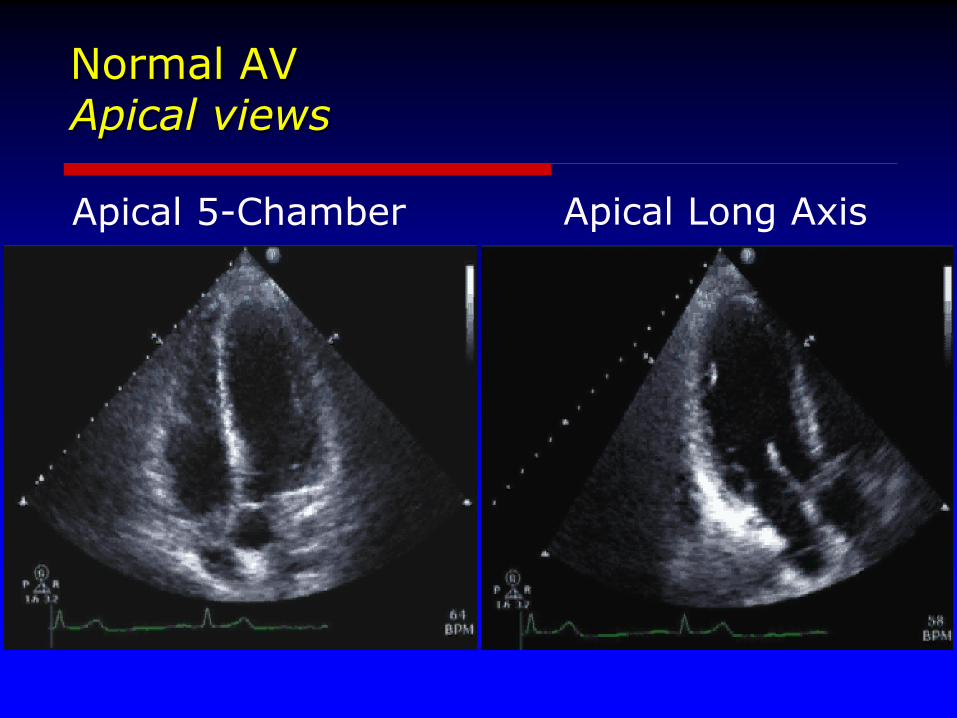
Normal AVApical views
Apical 5-Chamber Apical Long Axis
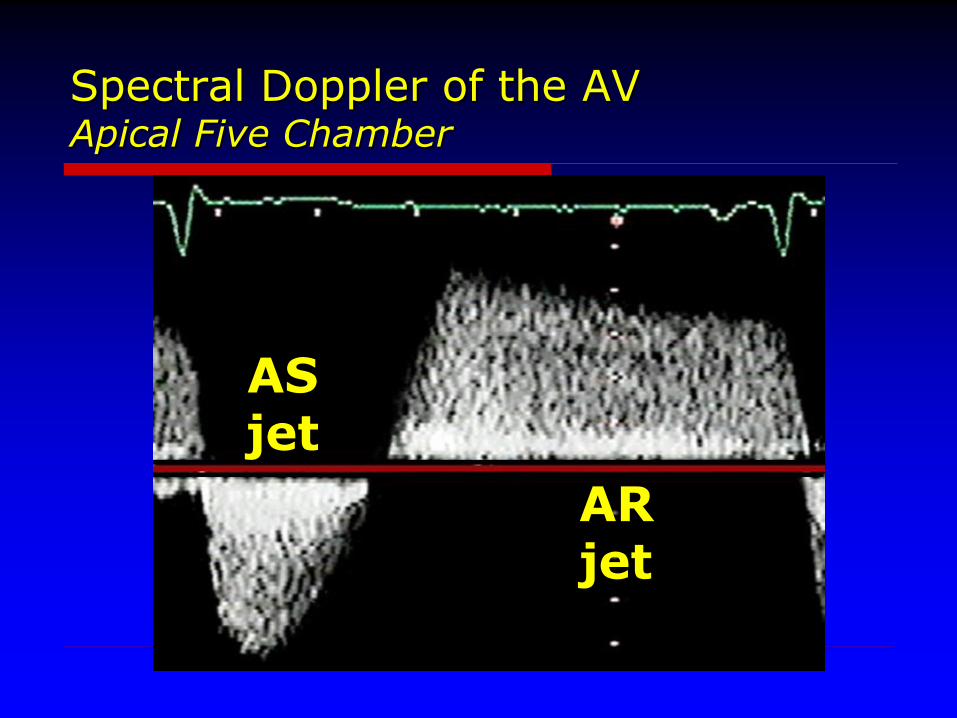
Spectral Doppler of the AVApical Five Chamber
AR jet
AS jet

Bicuspid Aortic Valve
Most common congenital anomaly (1-2%)
Commissure may be horizontal or vertical Horizontal: Anterior and Posterior leaflets
Vertical: Right and Left (coronary) leaflets
Accel. calcification & premature stenosis
Proximal aortopathy (even in normals)
Associated aortic abnormalities

Bicuspid Aortic ValvePLAX View – Doming
Diastole Systole

Bicuspid Aortic ValvePSAX view morphology
Diastole Systole
Systolic ellipsoid orifice identifies as bicuspid.
raphe raphe

Aortic Valve:Other Anomalies associated with AS
Unicuspid AoV Quadracuspid AoV
Aortic StenosisEtiology
Senile/Degenerative Calcific Calcification resembles ectopic bone Risk factors similar to those for atherosclerosis Renal dysfunction may accelerate
Premature Calcific Bicuspid / Congenital
Rheumatic Less common in the United States
Less common Type 2 Hyperlipidemia, SLE, Irradiation, Paget’s Dz
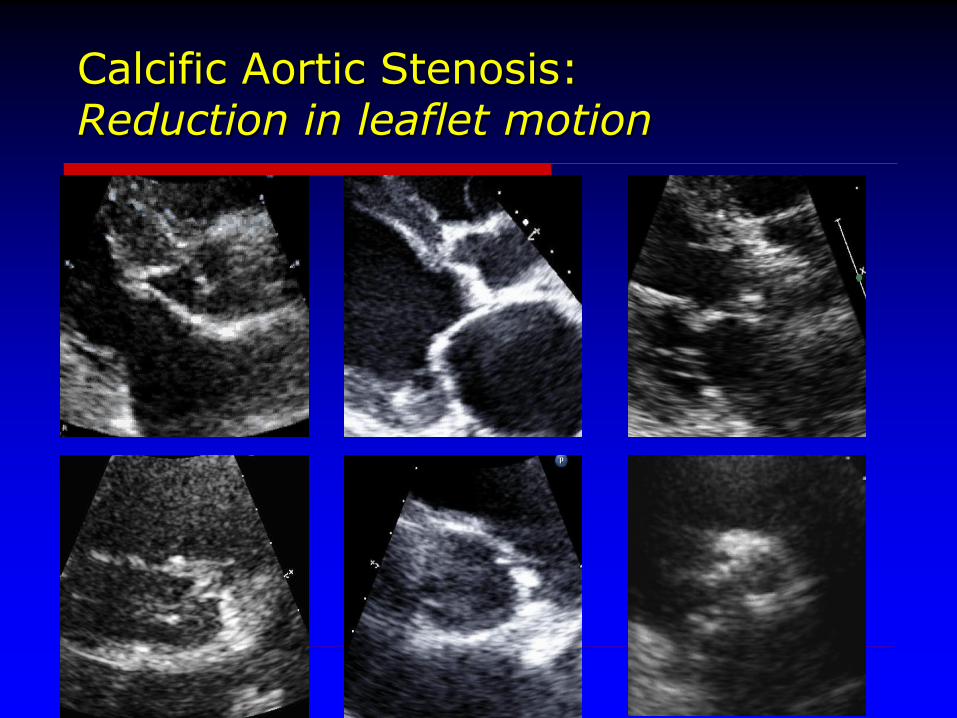
Calcific Aortic Stenosis:Reduction in leaflet motion

Rheumatic Aortic Stenosis:Commissural fusion

Aortic Stenosis:Physiologic Sequelae
Chronic LV pressure overload– Myocardial Hypertrophy - Progressive
– LA dilatation
END STAGE: Limited Cardiac Output Systolic Dysfunction
Diastolic Dysfunction
SYMPTOMS:– Dyspnea and Fatigue (often subtle)
– Typical and Atypical Chest Pressure
– Syncope
– Congestive Heart Failure

Evaluation of AS: Echo Essentials
Valve Anatomy - establish etiology• Exclude other forms of LVOT obstruction
Severity of stenosis
Physiologic sequelae• LV hypertrophy, diastolic fxn, systolic fxn
• LA dilatation, Pulmonary hypertension
Evaluate concurrent disease• Proximal aorta and arch
• Aortic Valve Regurgitation, Mitral Disease

Aortic Stenosis:Assessing Severity
Baumgartner H, et al. JASE (2009) 22:1-23
}ASE / EAE
Recommend
Peak AV Jet Velocity
Mean AV Gradient
Valve Area by continuity equation
Velocity Ratio (“Dynamic Index”)
Planimetry

Aortic Stenosis:Prognosis of Velocity
Variable Rate of Progression
– Avg ~0.3 m/sec/year
High rate of events, even for “asymptomatic” AS
Baseline AoV Peak Jet Velocity, rate of change of velocity and functional status predict clinical outcome
Otto C, et al. Circulation (1997) 95:2262

Aortic Stenosis:Peak Velocity
Continuous Wave (CW) Doppler in Apical 5 Chamber View
Must be parallel to the ejection jet
Confirm – Right Parasternal– Suprasternal also possible
Use highest velocity– Avoid feathery signals at tip
– Piedoff – “non-imaging” probe
– Decrease gains & adjust baseline
24

Aortic stenosisAssessment by Peak Velocity
Mild stenosis: 2.0 – 2.9 m/s
Moderate stenosis: 3.0 – 3.9 m/s
Severe stenosis: > 4.0 m/s
“Very Severe” or“Critical” stenosis: > 5.0 m/s
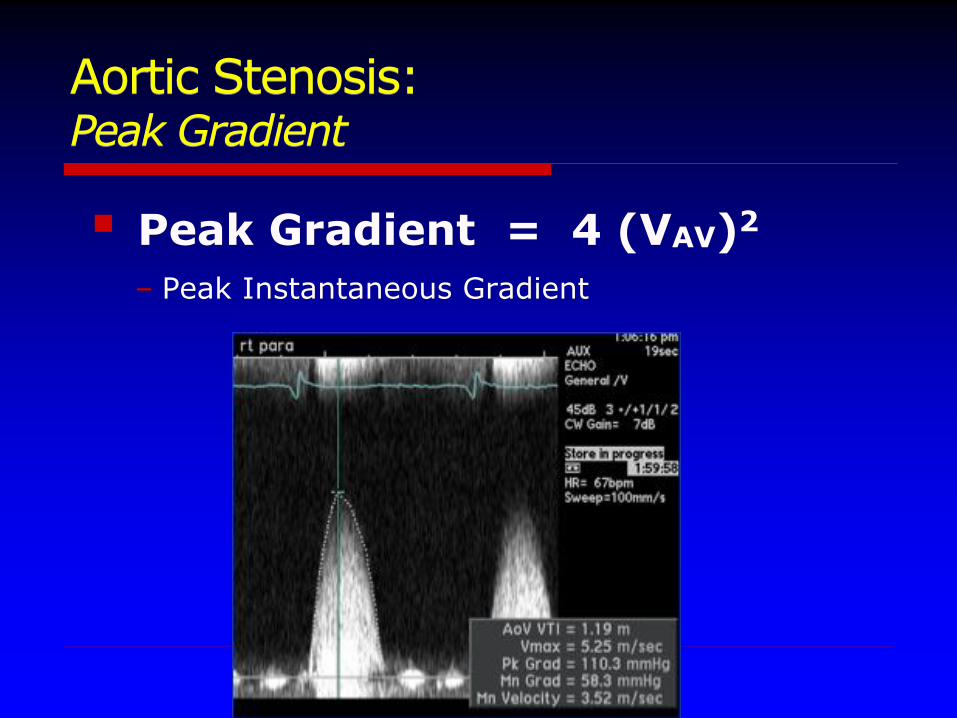
Aortic Stenosis:Peak Gradient
Peak Gradient = 4 (VAV)2
– Peak Instantaneous Gradient

Doppler
Instantaneous Gradient vs. Peak–to–Peak
Echo a more “physiologic” measurement
Doppler peak gradient always higher
Mean gradient and AVA should correlate
Gradients are flow dependent
Cath

Aortic Stenosis:Mean Gradient
Mean Gradient
– Integration of velocity over time
– Estimate – 0.7 * Peak Grad.
– Correlates with cath Peak-to-Peak gradient

Aortic stenosisAssessment by Mean Gradient
Mild stenosis: < 20 mmHg
Moderate stenosis: 20 – 39 mmHg
Severe stenosis: ≥ 40 mmHg
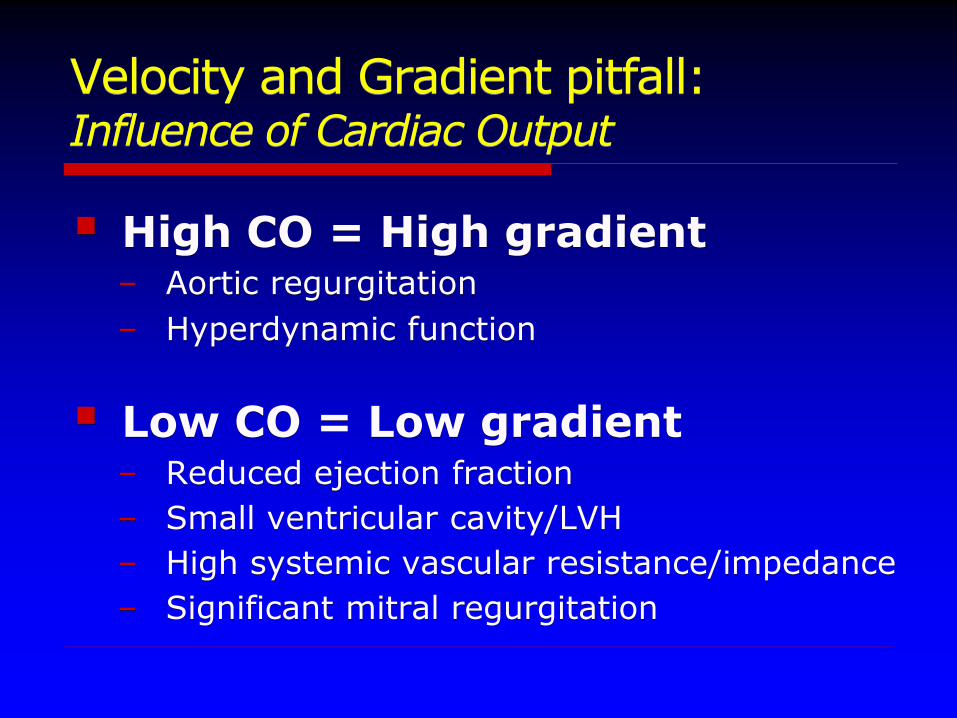
Velocity and Gradient pitfall:Influence of Cardiac Output
High CO = High gradient– Aortic regurgitation
– Hyperdynamic function
Low CO = Low gradient– Reduced ejection fraction
– Small ventricular cavity/LVH
– High systemic vascular resistance/impedance
– Significant mitral regurgitation

Aortic stenosisAssessment of Valve Area
Normal valve area: = 3 - 4 cm2
Mild stenosis: > 1.5 cm2
Moderate stenosis: 1.0 – 1.5 cm2
Severe stenosis: < 1.0 cm2
“Critical” stenosis: < 0.7 cm2

Based on conservation of mass
Flow within LVOT = Flow across AV
LVOT area * VTILVOT = AVA * VTIAV
[π * (LVOTrad)2] * VTILVOT = AVA * VTIAV
[π * (LVOTradius)2] * VTILVOT = AVA
VTIAV
Calculation of AV Area:Continuity Equation

LVOT diameter
2.1 cm
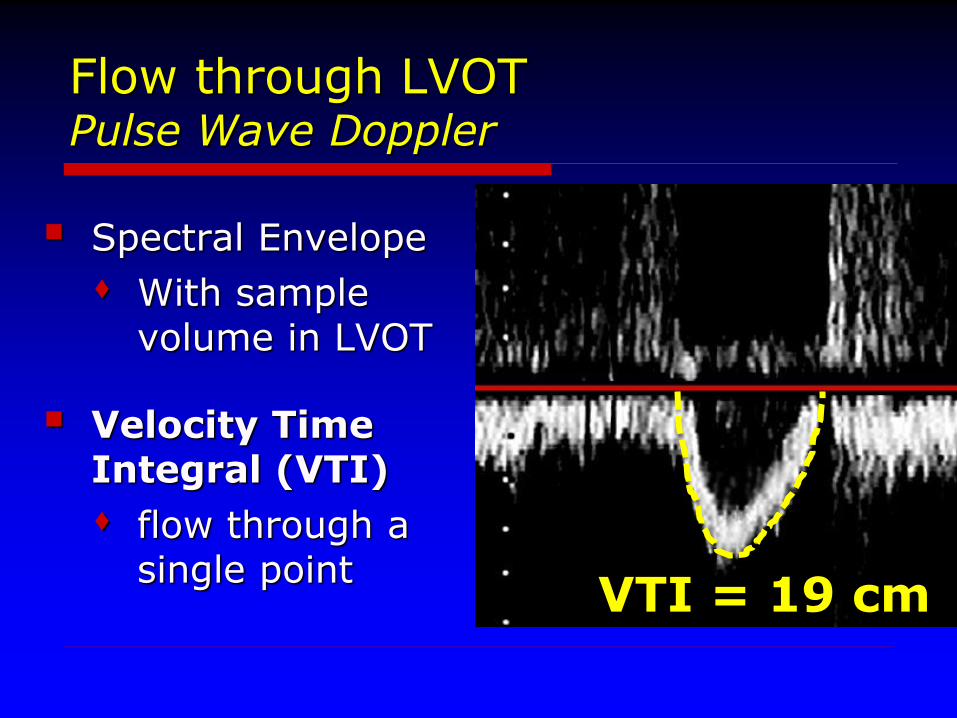
Flow through LVOTPulse Wave Doppler
Spectral Envelope
With samplevolume in LVOT
Velocity TimeIntegral (VTI)
flow through asingle point
VTI = 19 cm
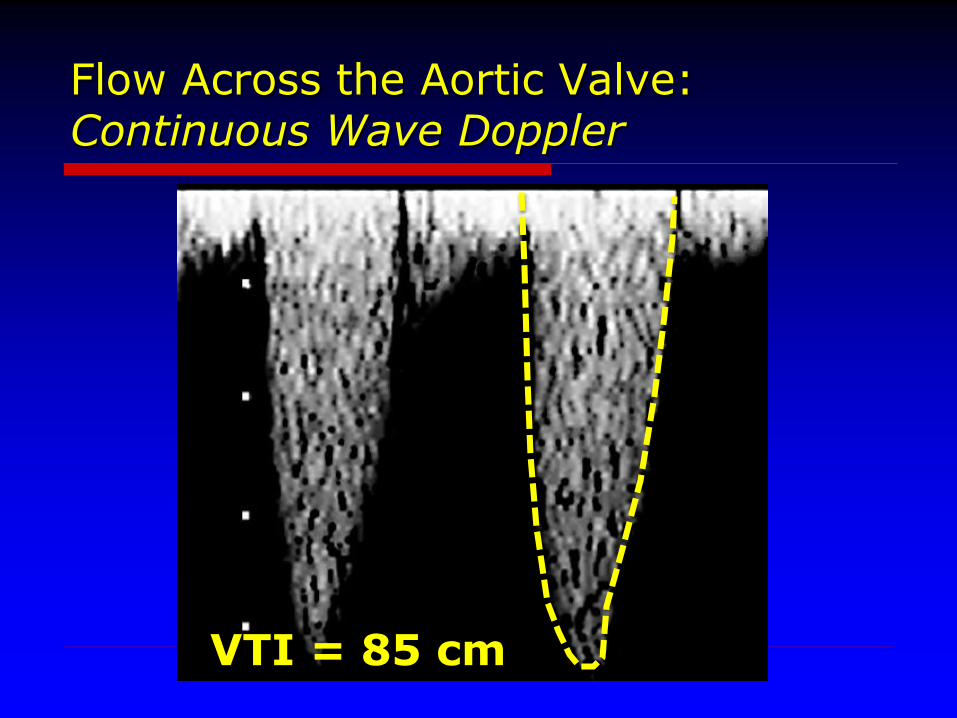
Flow Across the Aortic Valve:Continuous Wave Doppler
VTI = 85 cm

Calculating Aortic Valve Area
AVA = (DiameterLVOT / 2)2 x π x VTILVOT
VTIAV
AVA = (2.1 cm / 2)2 x 3.14 x 19 cm
85 cm
AVA = 0.7 cm2

Pitfalls of the Continuity Equation
LVOT measurement Diameter is squared - can propagate large
error
LVOT velocity
AV velocity Missing the Peak: use multiple sites / Piedoff
Use highest velocity obtained
Beware MR

Doppler Velocity Index
Eliminates errors of LVOT measurement
• DVI = VTILVOT / VTIAV
Criteria for Severe AS:
•DVI < 0.25Relatively
flow-independent measure of stenosis

Planimetry of the Aortic Valve
AVA = 1.1 cm2

Planimetry
Correlates with invasively obtained areas
Flow dependent
Difficult to distinguish decreased opening due to LV failure
TEE superior - use of color flow area
Dense calcification reduces accuracy

Summary
Baumgartner H, et al. JASE (2009) 22:1-23

WHEN SHOULD I OPERATE?
So…
My patient has severe aortic stenosis!
What do I do? Who do I talk to?
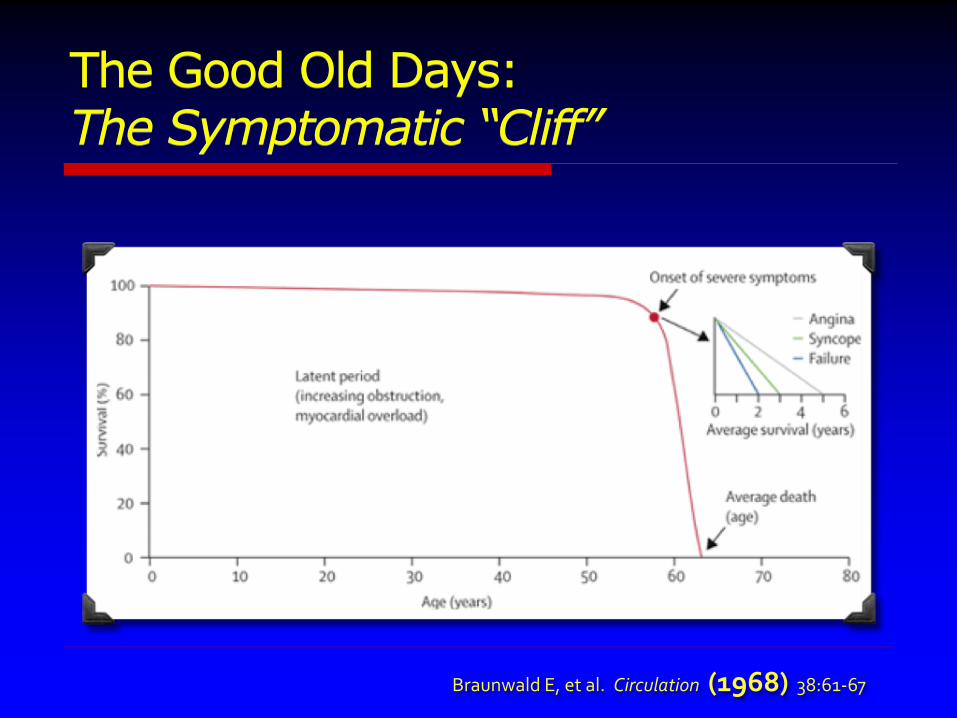
The Good Old Days:The Symptomatic “Cliff”
Braunwald E, et al. Circulation (1968) 38:61-67
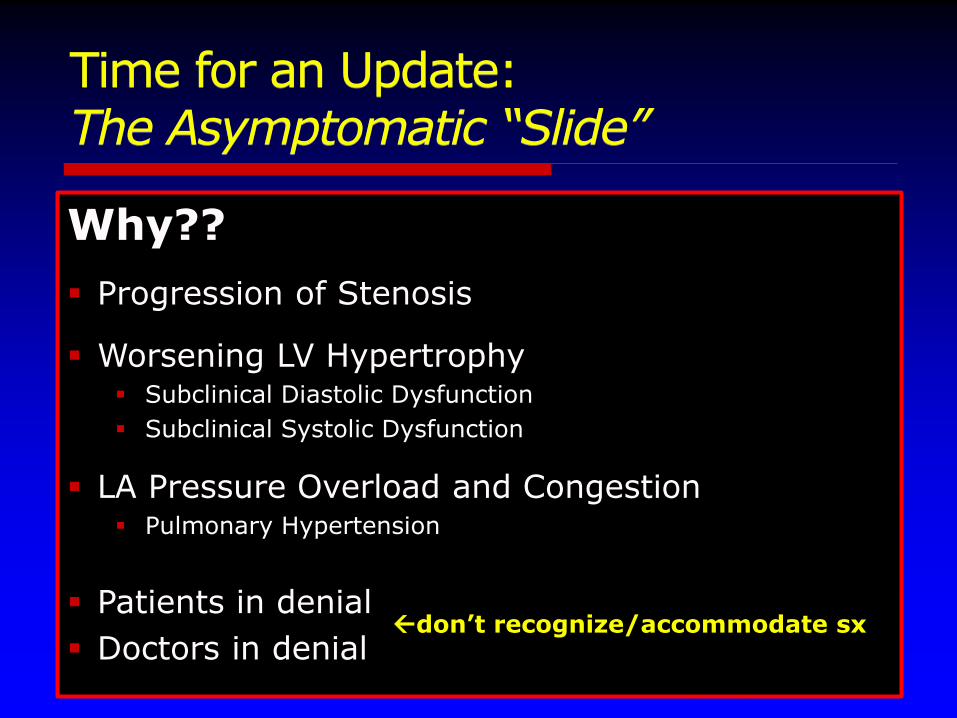
Time for an Update:The Asymptomatic “Slide”
Pellikka PA, et al. Circulation (2005) 111:3290
Why??
Progression of Stenosis
Worsening LV Hypertrophy Subclinical Diastolic Dysfunction
Subclinical Systolic Dysfunction
LA Pressure Overload and Congestion Pulmonary Hypertension
Patients in denial
Doctors in denialdon’t recognize/accommodate sx
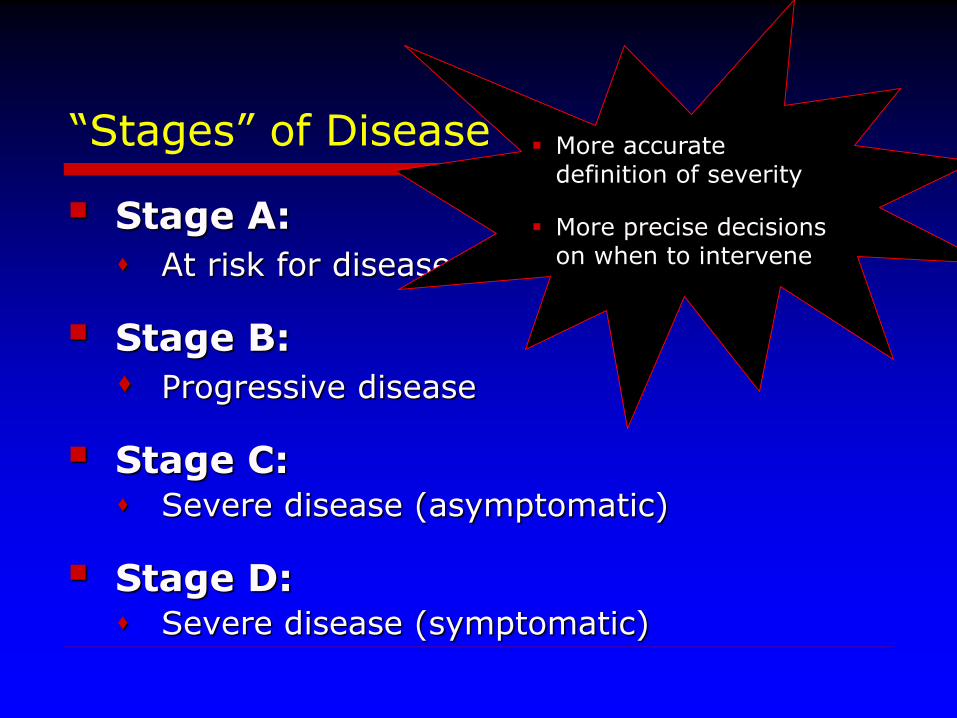
“Stages” of Disease
Stage A:
At risk for disease
Stage B:
Progressive disease
Stage C: Severe disease (asymptomatic)
Stage D: Severe disease (symptomatic)
More accuratedefinition of severity
More precise decisions on when to intervene
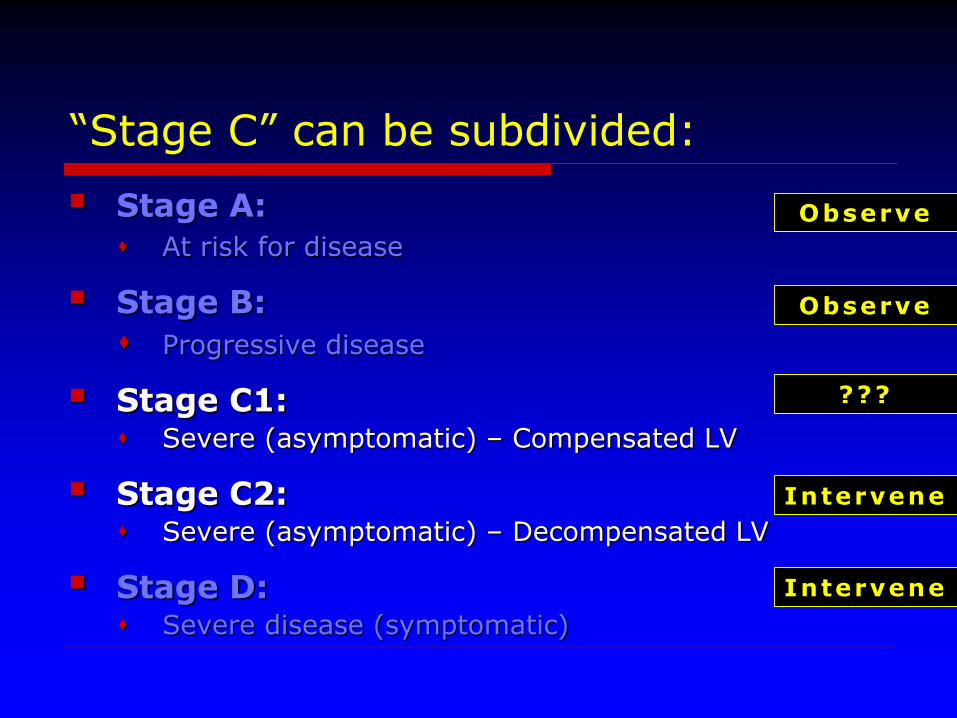
“Stage C” can be subdivided:
Stage A:
At risk for disease
Stage B:
Progressive disease
Stage C1: Severe (asymptomatic) – Compensated LV
Stage C2: Severe (asymptomatic) – Decompensated LV
Stage D: Severe disease (symptomatic)
Observe
Observe
???
Intervene
Intervene

Guidelines Assist in Decision-Making
Calcified/Thickened leaflets
Reduced Systolic Opening
“Asymptomatic”
AVR (IIa) AVR (I) AVR (I) AVR (IIa) AVR (IIb)
Vmax ≥4 m/sVmax ≥5 m/s
+ low AVR risk
EF <50% EF ≥50%
Undergoing other CV Surgery
ETT
BP / ex capacity
Rapid progression
+ low AVR risk

Decreased LV Function:“Low Gradient” Aortic Stenosis
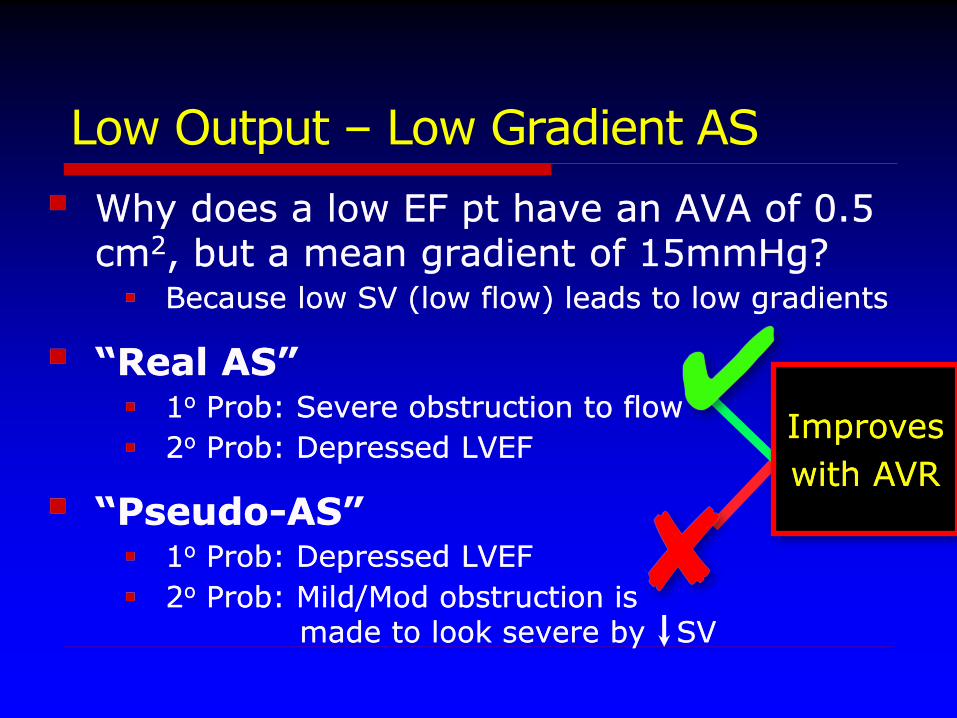
Low Output – Low Gradient AS
Why does a low EF pt have an AVA of 0.5 cm2, but a mean gradient of 15mmHg? Because low SV (low flow) leads to low gradients
“Real AS” 1o Prob: Severe obstruction to flow
2o Prob: Depressed LVEF
“Pseudo-AS” 1o Prob: Depressed LVEF
2o Prob: Mild/Mod obstruction ismade to look severe by SV
✘
✔Improves
with AVR

Low Output – Low Gradient AS
Dobutamine Stress Testing– Increase LV contractility -> Increase Stroke Volume
Increase Stroke Volume by 20% ->– Real AS Peak vel/mean gradient significantly
AVA stays unchanged or slightly
– Pseudo AS Peak vel/mean gradient minimal AVA
What if LV contractility / SV don’t increase?

Low Gradient - Normal EF
EF ≥50%, AVA <1 cm2, mean grad <40mmHg
Whah???...
Still a stroke volume problem!! SVindex ≤35 ml/m2 despite EF
“Typical” patient:
Older, h/o hypertension, women
Concentric LVH, small cavity, impaired filling
Markedly increased vascular impedance
Pibarot P, Dumesnil JG. Heart (2010) 96:1431-33

Guidelines Assist in Decision-Making
Suspected “Low Flow” AS
Symptoms
AVR (IIa)AVR (I) AVR (IIa)
Vmax <4 m/s
EF <50% EF ≥50%
DSEMG≥40mmHg or
Pk Vel≥4 m/s
AVAindex ≤0.6 cm2/m2
and
SVindex <35 ml/m2
AVR
NOT Indicated
No Symptoms
Vmax ≥4 m/s
Rule Out other
causes for Sx!!

Review Question #1
What can lead to underestimation of the aortic valve gradient on echo as compared with invasive hemodynamics at cath:
A. Pressure Recovery
B. Equating peak instantaneous gradient to “peak-to-peak” gradient
C. A large incident angle to the aortic outflow
D. Failure to account for high subvalvular flow
E. Low stroke volume
Reflect upon the image belowTransesophageal (TEE):

Review Question #2
Which of the following statements best describes this aortic valve:
A. Unicuspid - Single Commissure
B. Bicuspid - Fusion of left & right cor. cusps
C. Bicuspid - Fusion of left & noncoronary cusps
D. Functionally Bicuspid Aortic Valve (trileaflet)
E. Cannot be determined
Review Question #2
Which of the following statements best describes this aortic valve:
A. Unicuspid - Single Commissure
B. Bicuspid - Fusion of left & right cor. cusps
C. Bicuspid - Fusion of left & noncoronary cusps
D. Functionally Bicuspid Aortic Valve (trileaflet)
E. Cannot be determined

N
L
R
Short Axis TEE view - AoV

Review Question #3
A patient presents with the following echo findings:
LVOT diameter = 2.0 cmLVOT velocity = 130 cm/sAortic velocity = 4.1 m/s
2D: Moderately calcified AV, Normal LVEF (70%) The aortic valve area is most likely:
A. Normal
B. Mildly reduced
C. Moderately reduced
D. Severely reduced
E. Cannot be calculated (incongruent units)
DI = 130/410
DI = 0.32

Thank You!