spectrum and opacity of co comparison of available databases. · comparison of available databases....
TRANSCRIPT

Spectrum and Opacity of CO2. Comparison of Available Databases.
Richard Freedman1,2 and David Schwenke2
(1) SETI Institute (2) Nasa Ames Research Center
• CO2 is possibly of interest for irradiated, hot Jupiters and for extrasolar terrestrial planets
• Currently there are only a few databases available for high temperature CO2
• New calculations are under way by David Schwenke to produce an improved and expanded version of the CO2 linelist
1

1e-32
1e-30
1e-28
1e-26
1e-24
1e-22
1e-20
1e-18
0 2000 4000 6000 8000 10000 12000 14000 16000 18000
inte
nsity (
cm
/mo
lec)
frequency (1/cm)
CO2 at 296K
"spec.acpf.big""spec.cvtq5zrel297b"
"spec.ht.all"
A comparison of 3 different dipole moment functions for CO2
2

• Hitran intensities are reproduced using the current Hitran database
• Two different dipole moment functions (DMF) are shown for CO2 based on calculations by David Schwenke
• Note that the DMF from Schwenke extends to much higher wavenumbers than the current databases. This reflects the limits of the earlier potential energy surfaces
• A line list is expected by the end of 2008
3
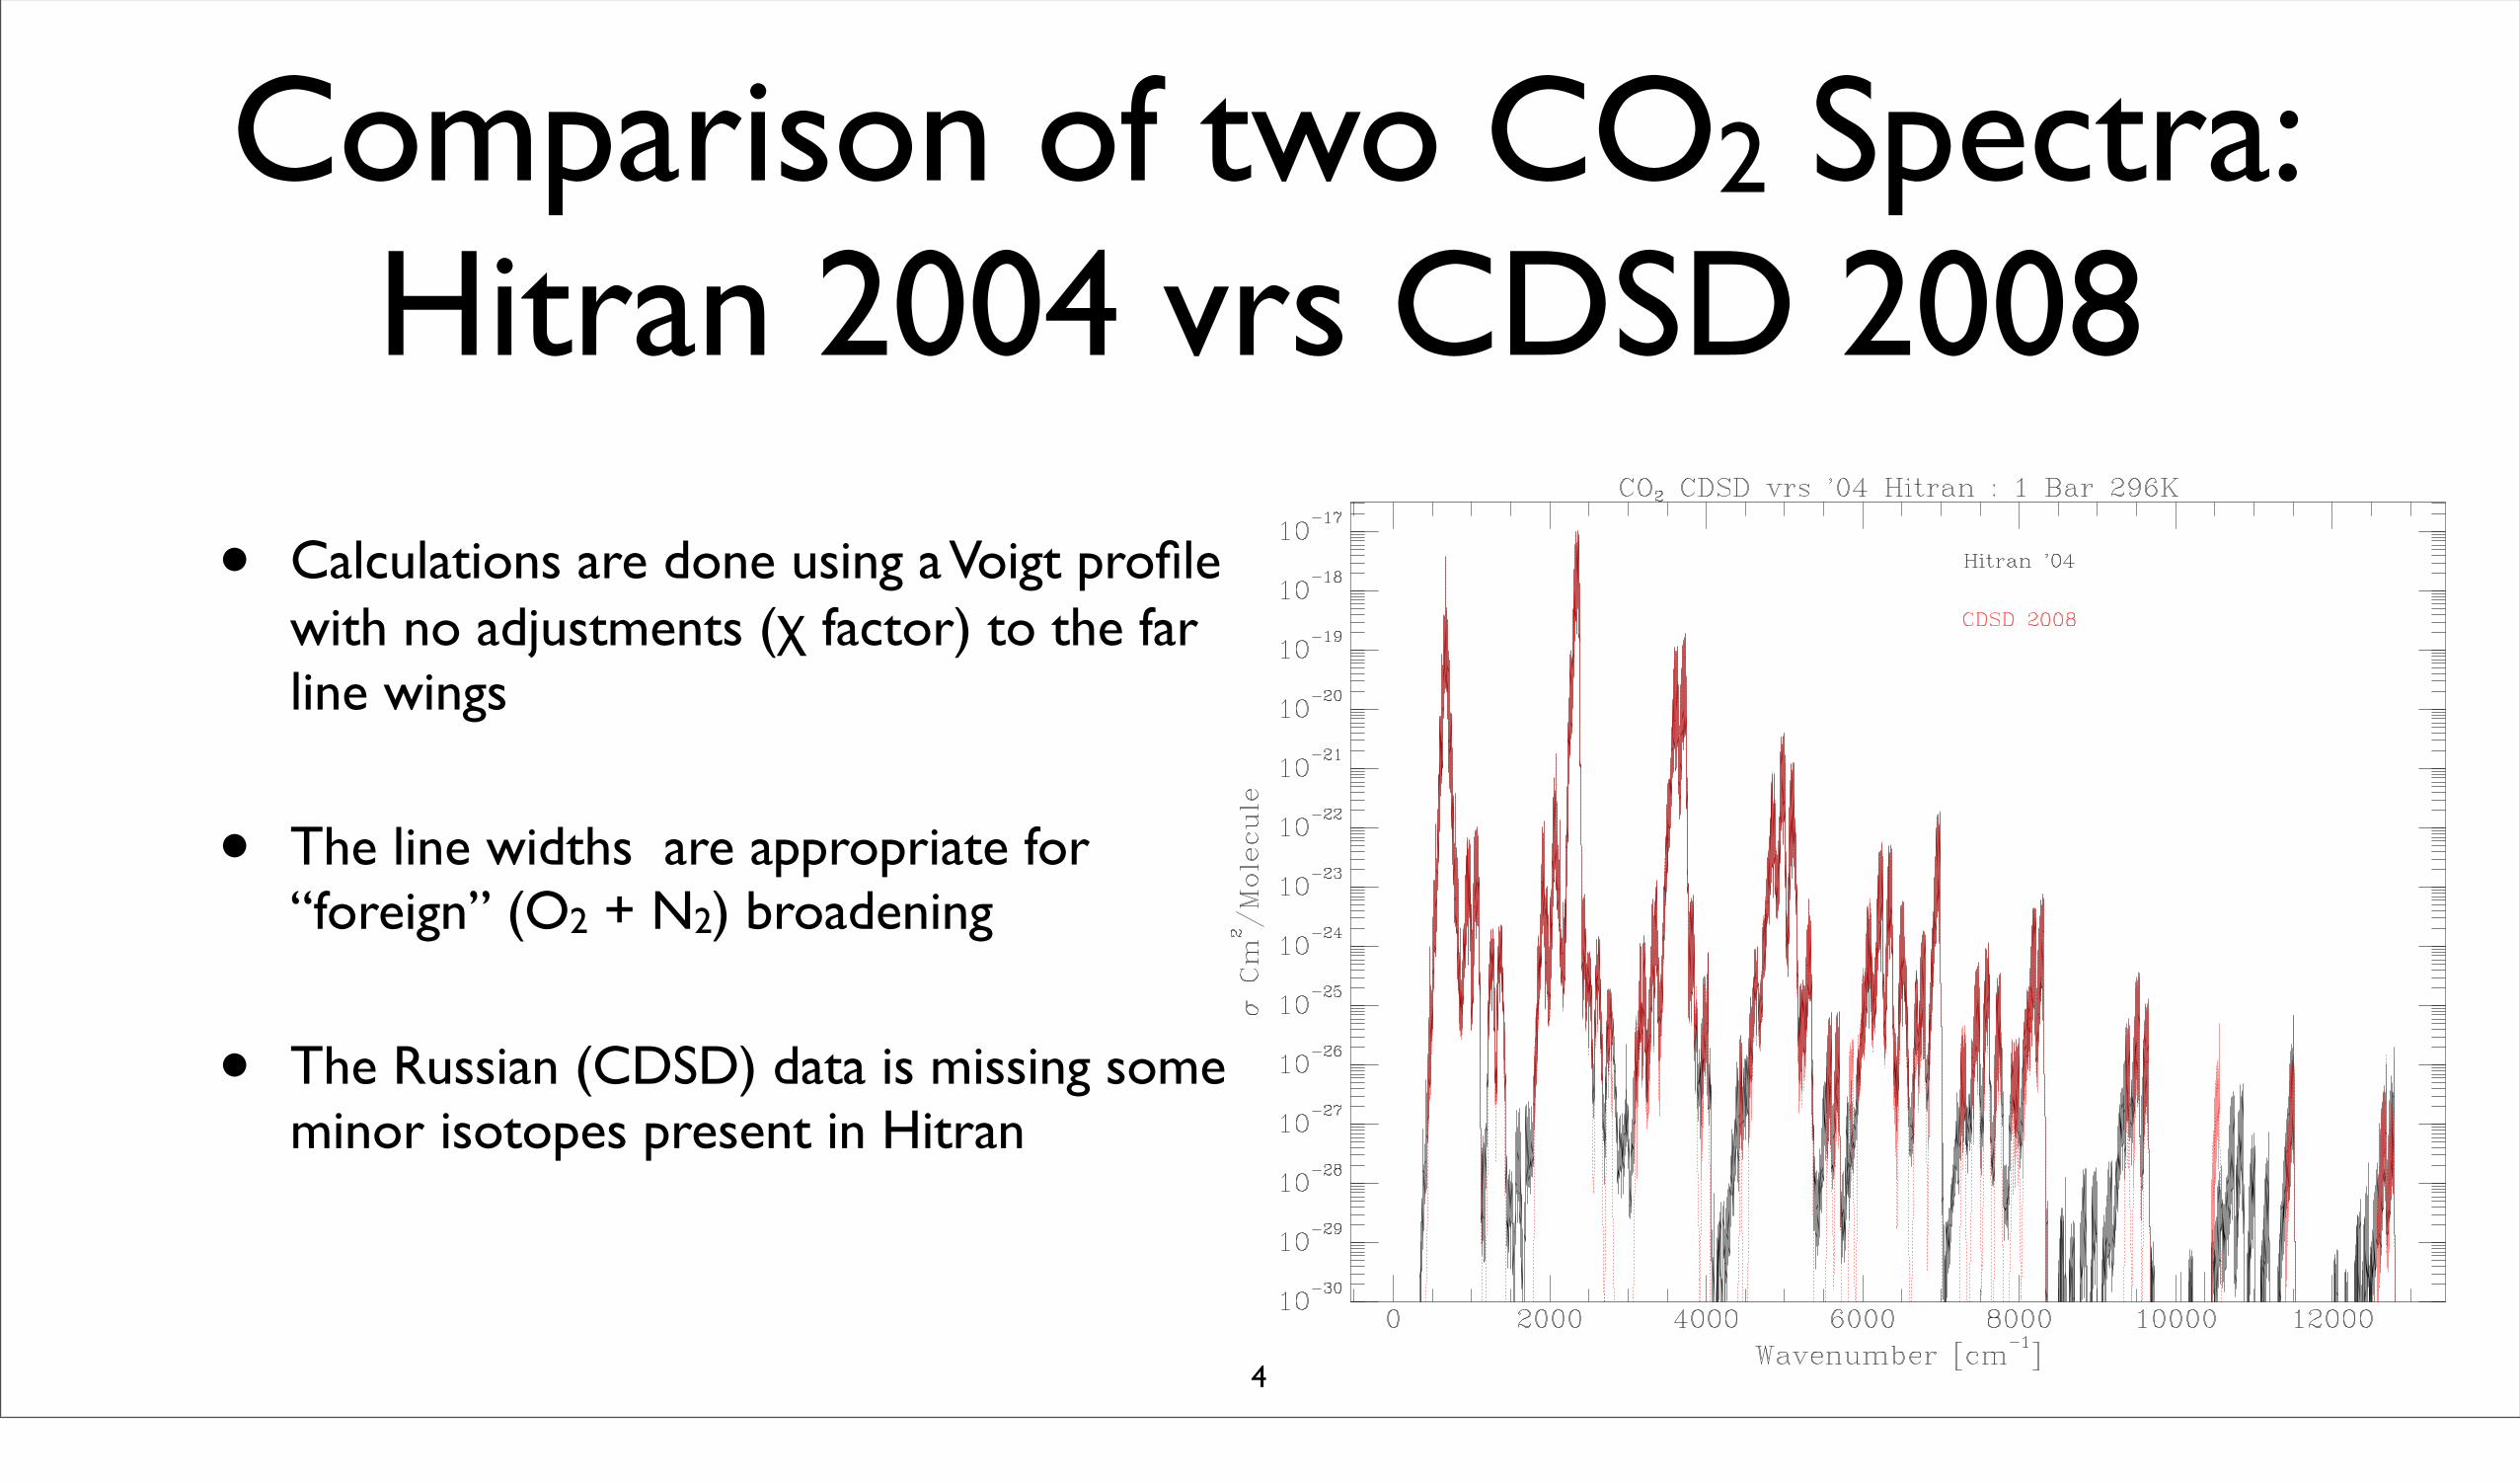
Comparison of two CO2 Spectra: Hitran 2004 vrs CDSD 2008
• Calculations are done using a Voigt profile with no adjustments (χ factor) to the far line wings
• The line widths are appropriate for “foreign” (O2 + N2) broadening
• The Russian (CDSD) data is missing some minor isotopes present in Hitran
4
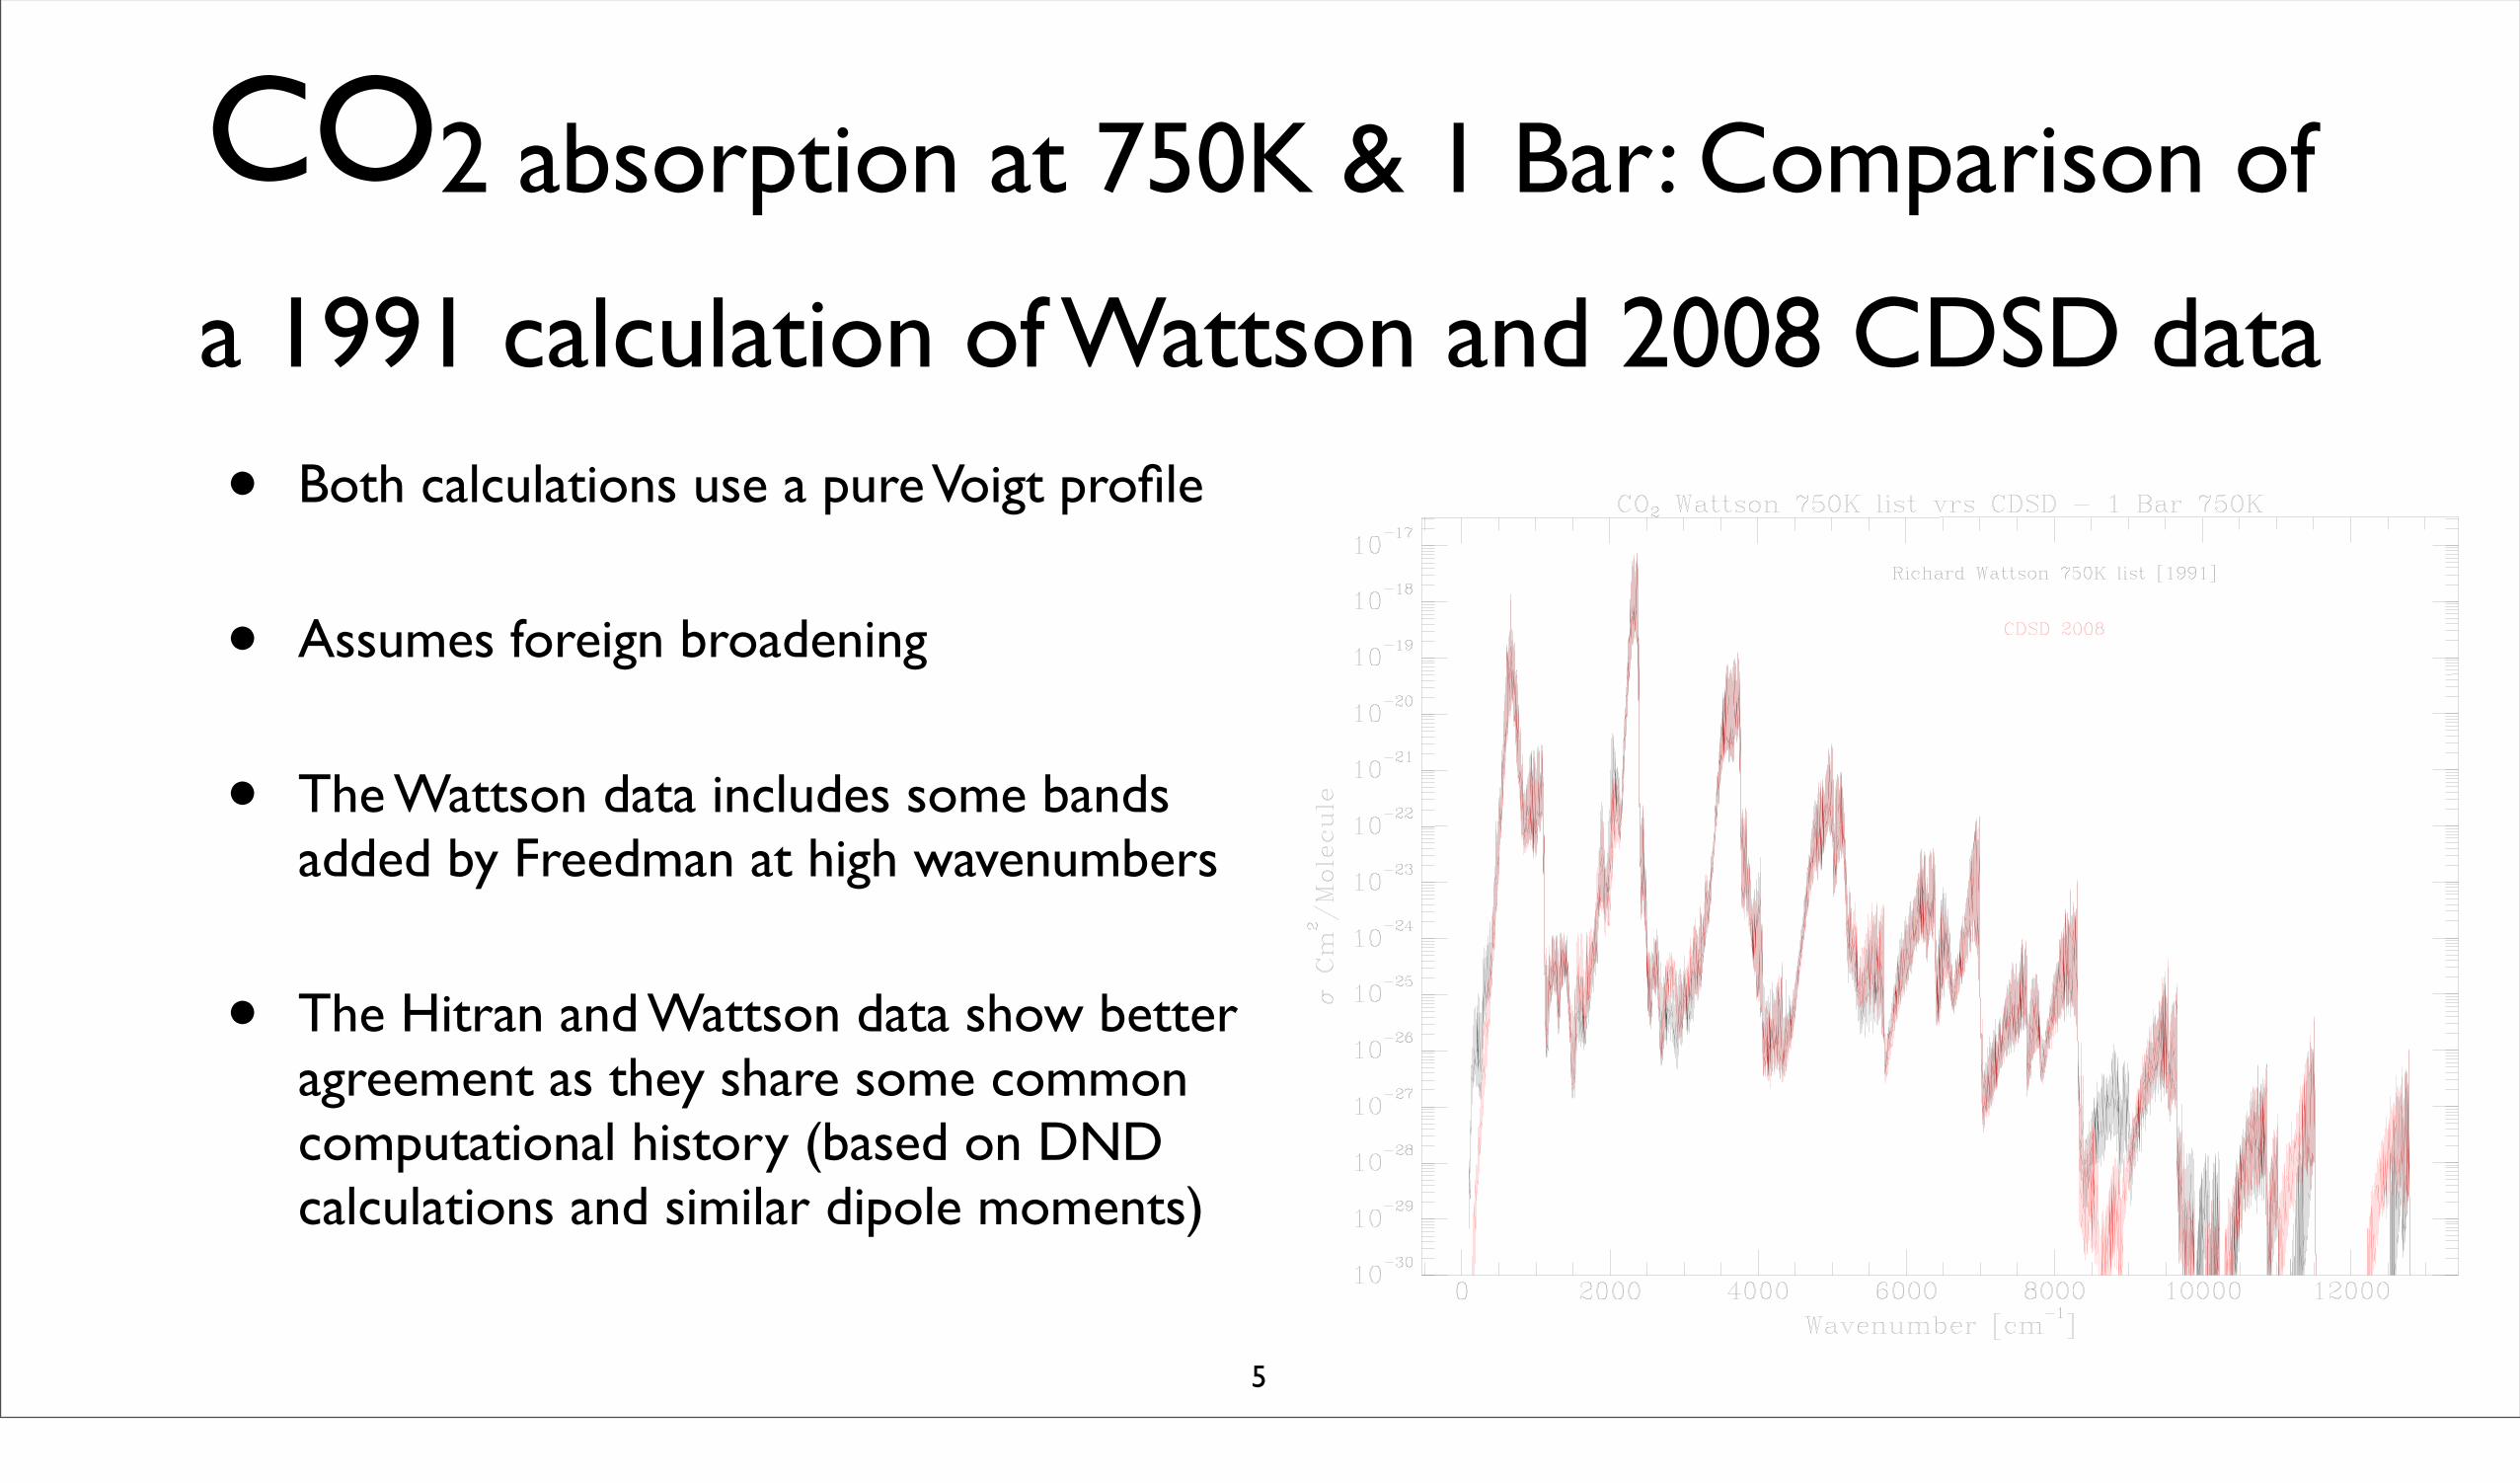
CO2 absorption at 750K & 1 Bar: Comparison of
a 1991 calculation of Wattson and 2008 CDSD data
• Both calculations use a pure Voigt profile
• Assumes foreign broadening
• The Wattson data includes some bands added by Freedman at high wavenumbers
• The Hitran and Wattson data show better agreement as they share some common computational history (based on DND calculations and similar dipole moments)
5

-11
-10
-9
-8
-7
-6
-5
500
1000
1500
2000
2500
3000
3500
4000
1e-021e-01
1e+001e+01
1e+021e+03
1e+041e+05
1e+06
-11
-10
-9
-8
-7
-6
-5
Log Relative Abundance
CO2 Abundance for Solar Composition
T
P [mb]
Log Relative Abundance
Equilibrium abundances of CO2 for an assumed solar composition• In chemical equilibrium the most
significant abundances are at moderate temperatures and low pressures
• For temperatures > ~ 1200K the largest abundances are at the higher pressures
• At high temperatures the abundance is greatest at high pressures
• Non-equilibrium abundances may be quite different in certain P:T regimes
6

Comparison of absorption cross sections for CO2 & H2O
• Cross-sections are shown per molecule without any adjustment for the relative abundance
• The region shown is in the CO2 4.3 μm band
7

Sum of opacities of 10 molecules and alkali atoms + CO2 x 100
• For this test the relative abundance of CO2 has been increased by a factor of 100 from the chemical equilibrium abundance
• This may be appropriate for upper regions of an exoplanet atmosphere affected by UV radiation from the central star
• This shows the raw absorption coefficients unsmoothed
8

Sum file smoothed to simulate an observation - resolution ~ 1200
• This plot shows more clearly the affect that enhanced CO2 abundance can have on the total opacity
• To calculate the total optical depth multiply the absorption cross-section by the total number of particles in the line of sight
• CIA has not been included [H2-H2 and H2-He] as the total pressure is so low
9

Absorption coefficient of CO2 for 4 different temperatures : 100 mb
• Classical Voigt profile was used with no adjustment for sub-Lorenztian wings of CO2
• Only the region around the 4.3 μm band is being considered as that region is also near a minimum of H2O absorption and is therefore suitable for a search for the presence of CO2
10

CO2 in the 4.3 μ band at 4 temperatures
• Note that it is the weaker transitions which originate from excited energy levels that increase the most in a relative sense at high temperatures
• These calculations were applied to the file of the summed opacity of all molecules and the alkali atoms to show the effect of including CO2 at a non-equilibrium abundance
11

• Because the 4.3 μm band is opaque even at the operating altitude of SOFIA, observations from space will be required to observe in the 4.3μm wavelength region
• There is another region at ~ 1.05 μm which is near a minimum in the H2O opacity that could be used to detect CO2 if its abundance were high enough. This region is also relatively transparent in the earth’s atmosphere, however the intrinsic strength of CO2 absorption in this region is not really large enough for a detection unless the abundance greatly exceeds the equilibrium value and is much greater than the 100X case show here.
12

Comparison of the opacity of CO2 and H2O per molecule
• The 4.3μm band of CO2 is the best placed to be detected in relation to the opacity of H2O which is a major source of opacity
• The 4.3μm cannot be observed from the ground because the atmosphere is opaque in this band even at aircraft altitudes
13
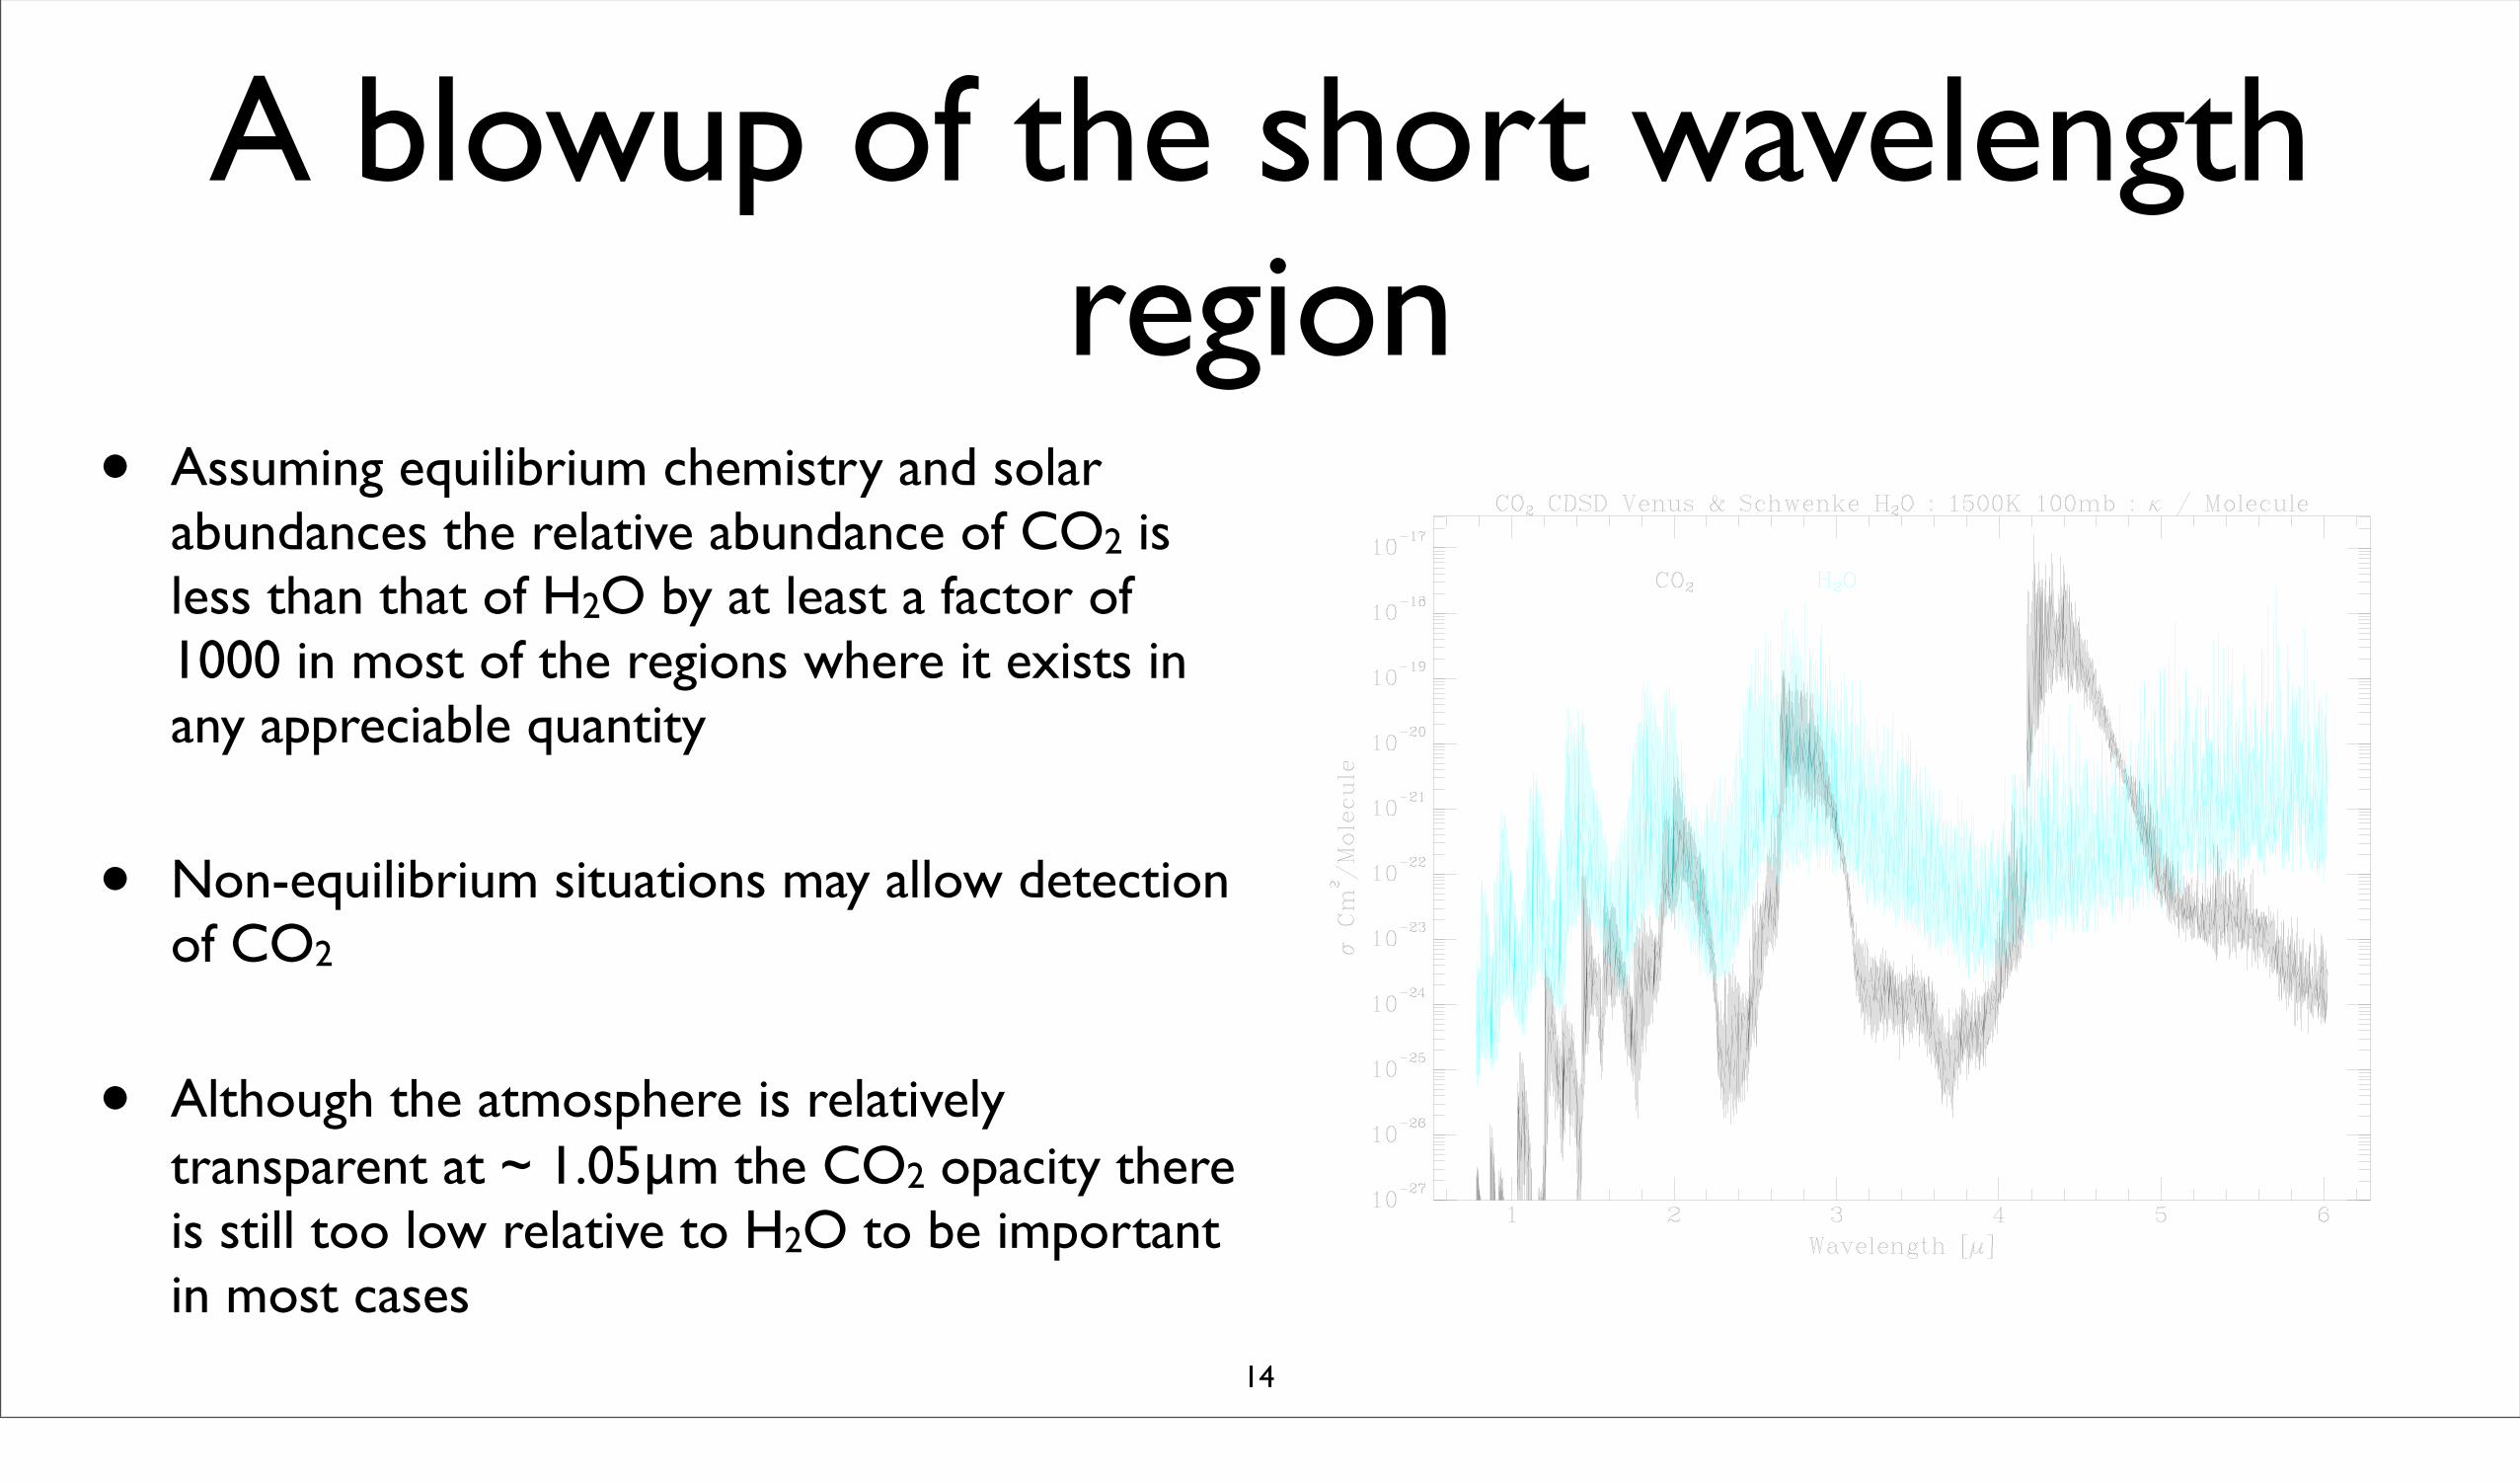
A blowup of the short wavelength region
• Assuming equilibrium chemistry and solar abundances the relative abundance of CO2 is less than that of H2O by at least a factor of 1000 in most of the regions where it exists in any appreciable quantity
• Non-equilibrium situations may allow detection of CO2
• Although the atmosphere is relatively transparent at ~ 1.05μm the CO2 opacity there is still too low relative to H2O to be important in most cases
14

Notes and References
15
• Russian CO2 data: JQSRT 82 (2003) 165-196, CDSD-1000, the high temperature carbon dioxide spectroscopic databank, S.A. Tashkuna, V.I. Perevalova, J-L. Tebob, A.D. Bykova, N.N. Lavrentievaa
• JQSRT 48 (1992) 537-566, Energy levels, intensities, and linewidths of atmospheric carbon dioxide bands, Rothman, L. S. and Hawkins, R.L. and Wattson, R.B. and Gamache, R.R.
• There are other articles about the techniques used by Wattson and Rothman in their calculations as applied to CO2 & H2O

• The technique used by Wattson and Rothman is known as the DND or direct numerical diagonalization technique
• The methods used by D. Schwenke involve techniques closer to ab-initio quantum mechanical techniques
16