spectroscopy: lecture 5 - soestzinin/images/lectures/gg711/... · shiv k. sharma. higp, university...
TRANSCRIPT
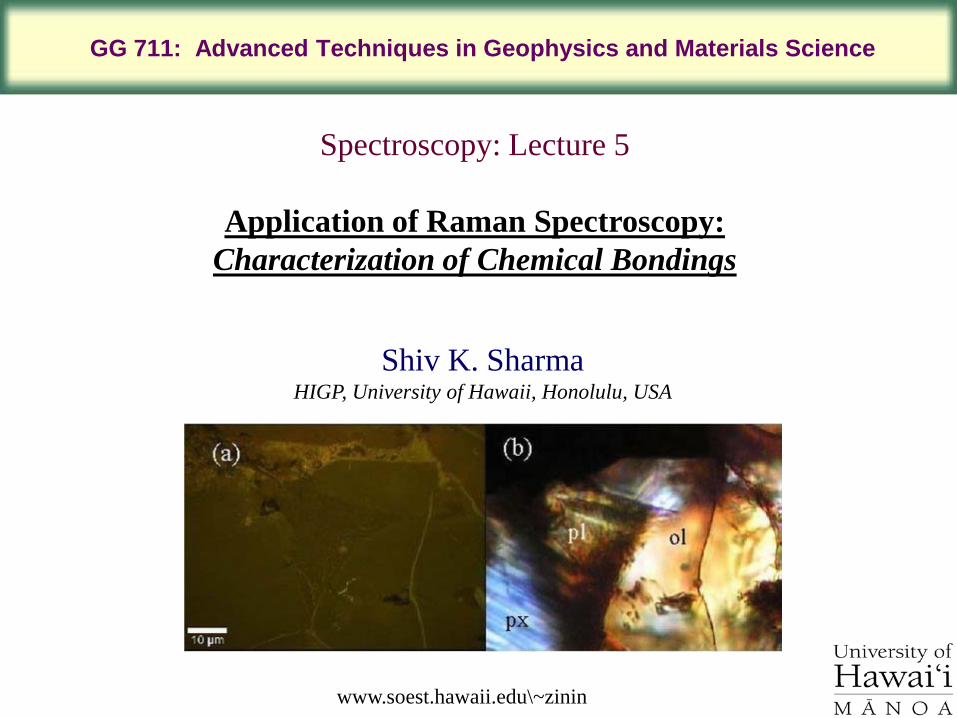
Shiv K. SharmaHIGP, University of Hawaii, Honolulu, USA
Spectroscopy: Lecture 5
Application of Raman Spectroscopy: Characterization of Chemical Bondings
www.soest.hawaii.edu\~zinin
GG 711: Advanced Techniques in Geophysics and Materials Science
Outlines
• History of Raman Effect and Scattering of Light
• Selection Rules of Raman & Infrared spectroscopy
• Depolyrization Ratio of Raman lines
• Molecular Vibrations
• Effect of Isotopes on Vibrational Frequencies
• Micro-Raman Instrumentation within Raman spectroscopy Laboratory within HIGP
• Remote Raman Instrument
• Geological Applications of Raman Spectroscopy
(i) Fluid Inclusions
(ii) Structure of Silicate glasses
(iii) Mineral Identifications in Thin Sections
(iv) Effect of High Pressure on Minerals
Summary

The Raman Effect
First published observation:"A new type of Secondary Radiation”
C. V. Raman and K. S. KrishnanNature, 121, 501, March 31, 1928
Nobel Prize in Physics 1930
Raman
Rayleighohν ohν
)( moh νν ±
frequency of incident beam=oν
vibrational frequency of molecule=mν
A. Smekal, The quantum theory of dispersion, Naturwissenschaften, 11, 873 (1923).
G. Landsberg and L. Mandelstam, A novel effect of light scattering in crystals, Naturwissenschaften, 16, 557 (1928).
Lord Rayleigh (1882-1919)
C. V. Raman (1888-1970)
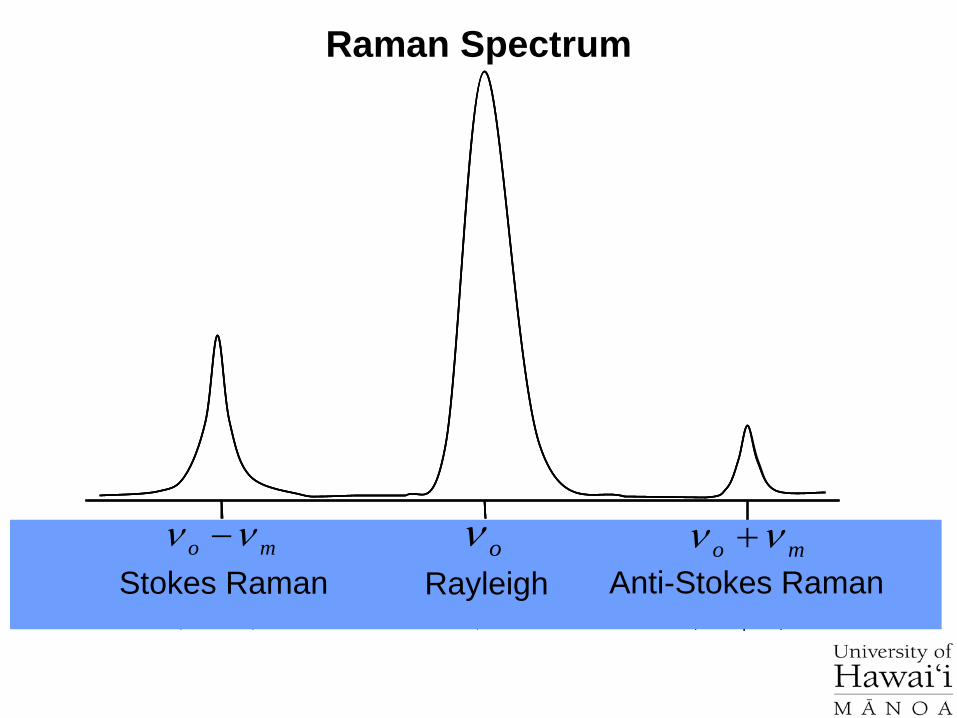
Raman Spectrum
-
ν
o
ν
o
+ ν
vAnti - StokesRayleigh
ν
o
ν
o
+ ν
vAnti - Stokes
ν
o
+ ν
vAnti - Stokes
ν
o
ν
vStokes
ν
o
ν
vStokes Rayleigh
- oν mo νν +mo νν −Stokes Raman Anti-Stokes RamanRayleigh

In the Raman spectra the information about vibrations of molecules is obtained in visible part of the spectrum as a difference from the energy of the visible laser excitation.
Raman spectra is complementary to IR spectra but the selection rules are different. For IR activity requires change in the permanent dipole moment.
Scattering of Light –Energy Diagram
Incident Light
Energy
Stokes and Anti-StokesScattered
(inelastic scattering)
Mie-Rayleigh Scattered Light(elastic scattering)
Normal Raman Scattering• involves polarizability (α) of a molecule (induced dipole)• the electric field of the molecule oscillates at the frequency of the incident wave (emits E.M. Radiation)• if induced dipole is constant, scattering is elastic (Rayleigh-Mie)• if induced dipole is not constant, inelastic (Raman) scattering is allowed
Virtual Levels
IR Absorption
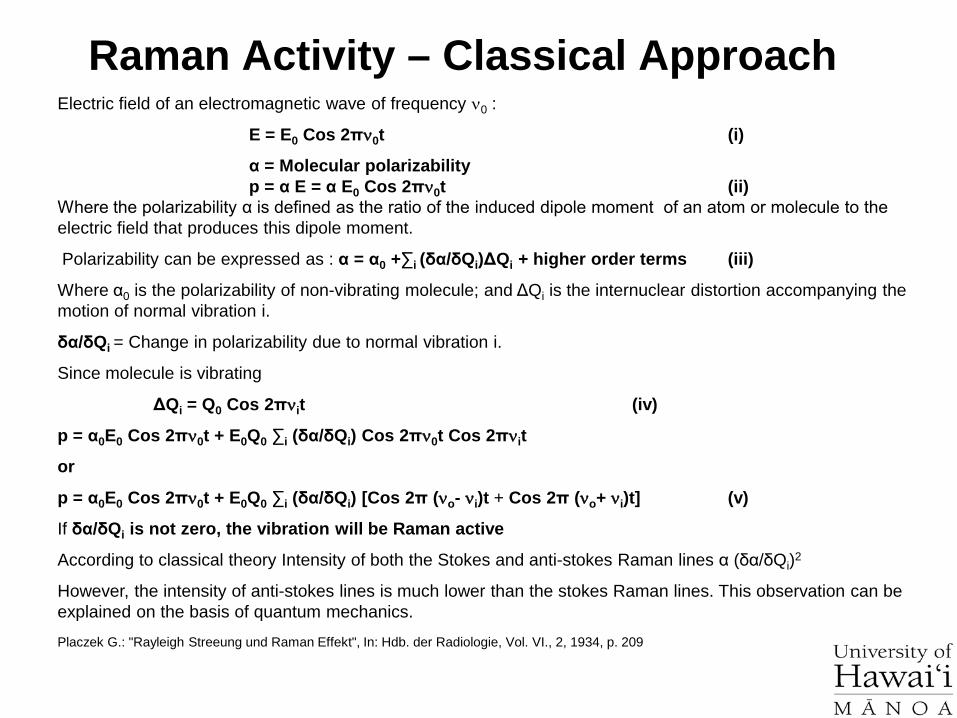
Electric field of an electromagnetic wave of frequency ν0 :
E = E0 Cos 2πν0t (i)
α = Molecular polarizabilityp = α E = α E0 Cos 2πν0t (ii)
Where the polarizability α is defined as the ratio of the induced dipole moment of an atom or molecule to the electric field that produces this dipole moment.
Polarizability can be expressed as : α = α0 +∑i (δα/δQi)ΔQi + higher order terms (iii)
Where α0 is the polarizability of non-vibrating molecule; and ΔQi is the internuclear distortion accompanying the motion of normal vibration i.
δα/δQi = Change in polarizability due to normal vibration i.
Since molecule is vibrating
ΔQi = Q0 Cos 2πνit (iv)
p = α0E0 Cos 2πν0t + E0Q0 ∑i (δα/δQi) Cos 2πν0t Cos 2πνit
or
p = α0E0 Cos 2πν0t + E0Q0 ∑i (δα/δQi) [Cos 2π (νo- νi)t + Cos 2π (νo+ νi)t] (v)
If δα/δQi is not zero, the vibration will be Raman active
According to classical theory Intensity of both the Stokes and anti-stokes Raman lines α (δα/δQi)2
However, the intensity of anti-stokes lines is much lower than the stokes Raman lines. This observation can be explained on the basis of quantum mechanics.
Placzek G.: "Rayleigh Streeung und Raman Effekt", In: Hdb. der Radiologie, Vol. VI., 2, 1934, p. 209
Raman Activity – Classical Approach
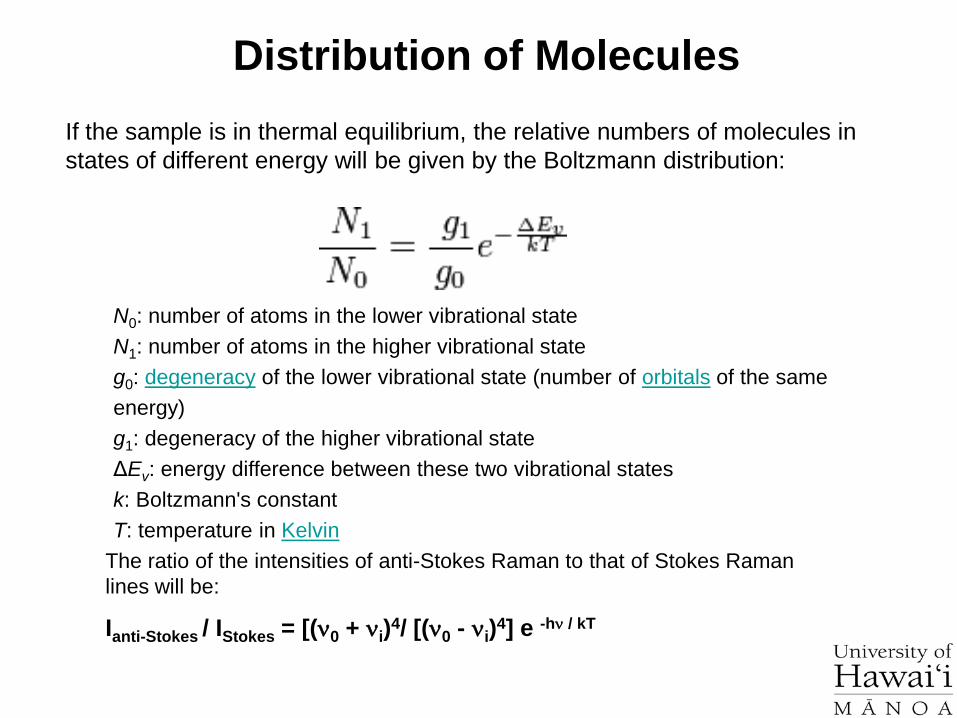
Distribution of MoleculesIf the sample is in thermal equilibrium, the relative numbers of molecules in states of different energy will be given by the Boltzmann distribution:
N0: number of atoms in the lower vibrational state N1: number of atoms in the higher vibrational state g0: degeneracy of the lower vibrational state (number of orbitals of the same energy) g1: degeneracy of the higher vibrational state ΔEv: energy difference between these two vibrational states k: Boltzmann's constant T: temperature in Kelvin
The ratio of the intensities of anti-Stokes Raman to that of Stokes Raman lines will be:
Ianti-Stokes / IStokes = [(ν0 + νi)4/ [(ν0 - νi)4] e -hν / kT
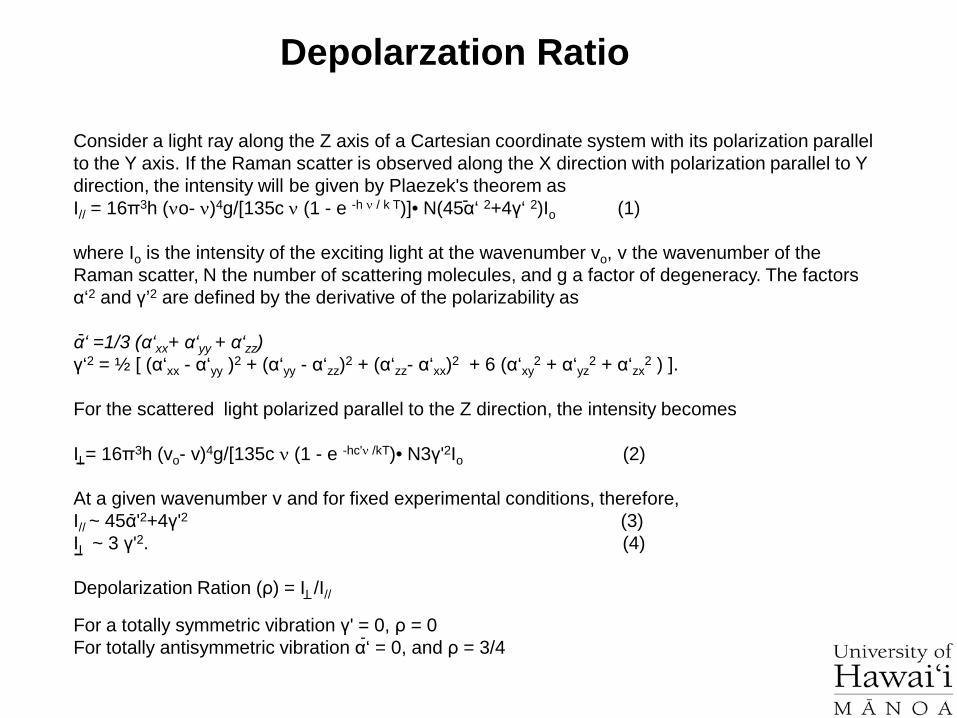
Consider a light ray along the Z axis of a Cartesian coordinate system with its polarization parallel to the Y axis. If the Raman scatter is observed along the X direction with polarization parallel to Y direction, the intensity will be given by Plaezek's theorem asI// = 16π3h (νo- ν)4g/[135c ν (1 - e -h ν / k T)]• N(45α‘ 2+4γ‘ 2)Io (1)
where Io is the intensity of the exciting light at the wavenumber vo, v the wavenumber of the Raman scatter, N the number of scattering molecules, and g a factor of degeneracy. The factors α‘2 and γ’2 are defined by the derivative of the polarizability as
α‘ =1/3 (α‘xx+ α‘yy + α‘zz)γ‘2 = ½ [ (α‘xx - α‘yy )2 + (α‘yy - α‘zz)2 + (α‘zz- α‘xx)2 + 6 (α‘xy
2 + α‘yz2 + α‘zx
2 ) ].
For the scattered light polarized parallel to the Z direction, the intensity becomes
II = 16π3h (vo- v)4g/[135c ν (1 - e -hc'ν /kT)• N3γ'2Io (2)
At a given wavenumber v and for fixed experimental conditions, therefore,I// ~ 45α'2+4γ'2 (3)II ~ 3 γ'2. (4)
Depolarization Ration (ρ) = II /I//
For a totally symmetric vibration γ' = 0, ρ = 0For totally antisymmetric vibration α‘ = 0, and ρ = 3/4
-
-
-
-
Depolarzation Ratio

Vibration of a Diatomic MoleculeNewtonian mechanics
Molecular vibrations can be treated using Newtonian mechanics, to calculate the correct vibration frequencies. The basic assumption is that each vibration can be treated as though it corresponds to a spring. In the harmonic approximation the spring obeys Hooke's law: the force required to extend the spring is proportional to the extension. The proportionality constant is known as a force constant, k.
Q (t) = A Cos (2Πνt) ν = (1/2Π ) (k/μ)1/2
A is the maximum amplitude of the vibration coordinate Q, and μ is the reduced mass of the molecule and is given by
1/ μ = 1/m1 + 1/m2
In the case of isotope substitution in the molecule, the force constant remains the same and the frequency will change because of increase in the mass of the atoms. For example in the case of hydrogen molecule
νH-H = 4160.2 cm-1 and νD-D = 2989.5 cm-1
Isotope substitution is often used for identifying the atoms involved in a vibrational mode of a molecule in the gas phase, liquid, glasses and crystalline solids.
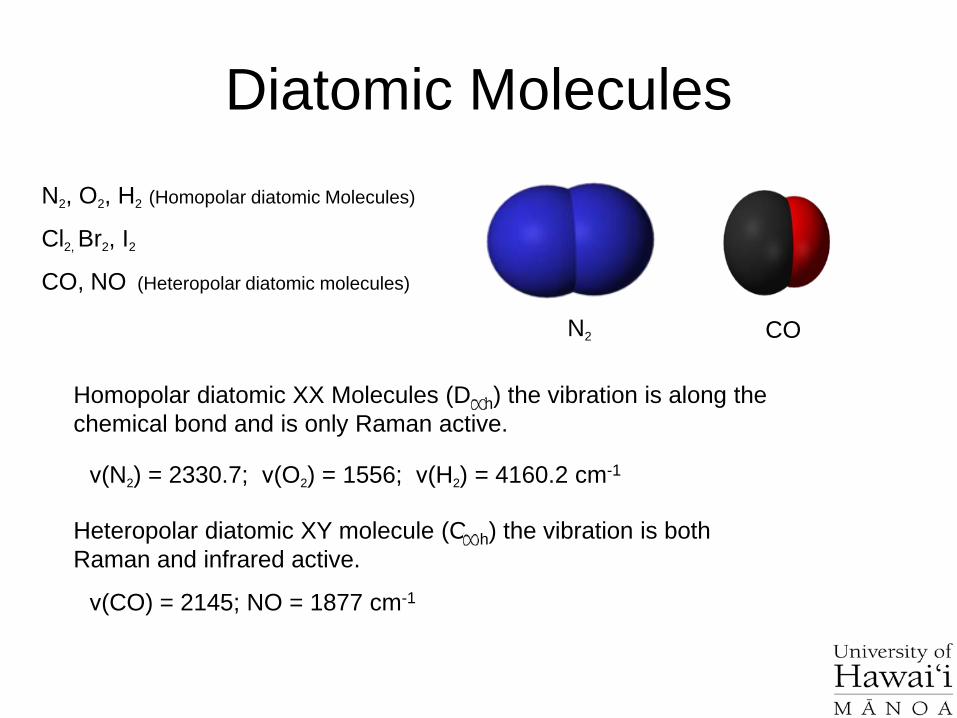
Diatomic MoleculesN2, O2, H2 (Homopolar diatomic Molecules)
Cl2, Br2, I2
CO, NO (Heteropolar diatomic molecules)
N2 CO
Homopolar diatomic XX Molecules (D h) the vibration is along the chemical bond and is only Raman active.
ν(N2) = 2330.7; ν(O2) = 1556; ν(H2) = 4160.2 cm-1
Heteropolar diatomic XY molecule (C h) the vibration is both Raman and infrared active.
ν(CO) = 2145; NO = 1877 cm-1
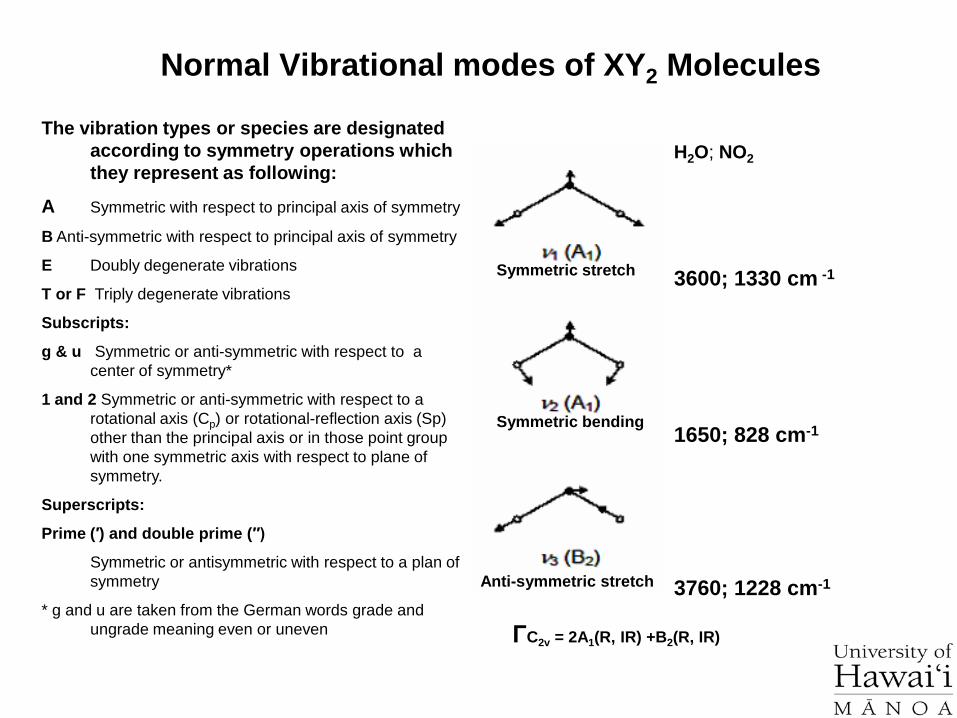
Normal Vibrational modes of XY2 Molecules
H2O; NO2
3600; 1330 cm -1
1650; 828 cm-1
3760; 1228 cm-1
Symmetric stretch
Anti-symmetric stretch
Symmetric bending
ΓC2v = 2A1(R, IR) +B2(R, IR)
The vibration types or species are designated according to symmetry operations which they represent as following:
A Symmetric with respect to principal axis of symmetry
B Anti-symmetric with respect to principal axis of symmetry
E Doubly degenerate vibrations
T or F Triply degenerate vibrations
Subscripts:
g & u Symmetric or anti-symmetric with respect to a center of symmetry*
1 and 2 Symmetric or anti-symmetric with respect to a rotational axis (Cp) or rotational-reflection axis (Sp) other than the principal axis or in those point group with one symmetric axis with respect to plane of symmetry.
Superscripts:
Prime (′) and double prime (′′)
Symmetric or antisymmetric with respect to a plan of symmetry
* g and u are taken from the German words grade and ungrade meaning even or uneven
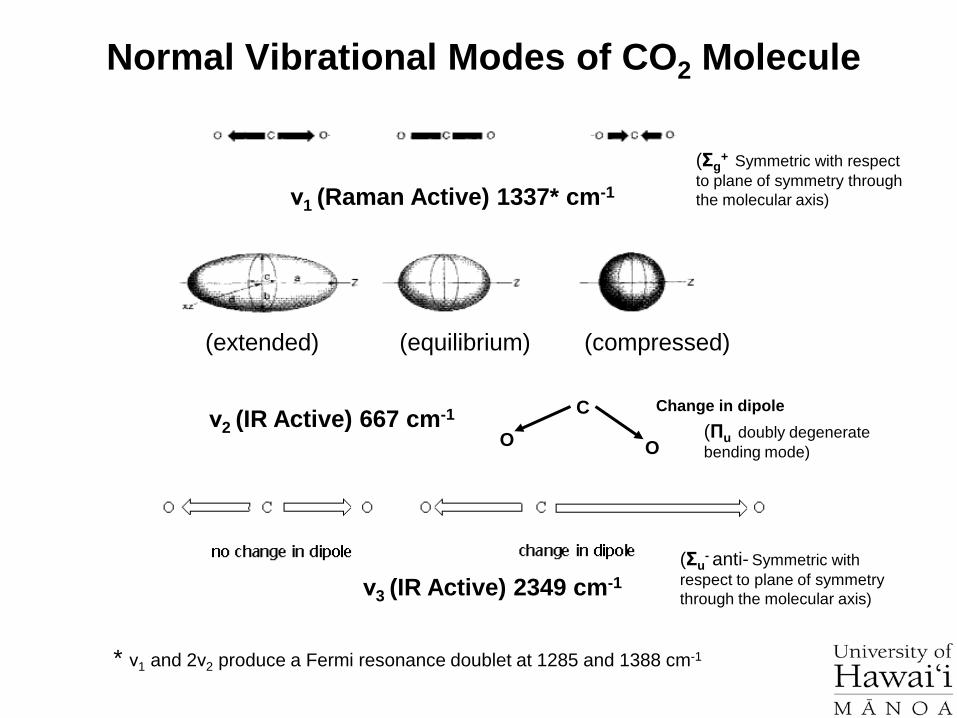
Normal Vibrational Modes of CO2 Molecule
(extended) (equilibrium) (compressed)
ν1 (Raman Active) 1337* cm-1
ν3 (IR Active) 2349 cm-1
C
OOν2 (IR Active) 667 cm-1 Change in dipole
* ν1 and 2ν2 produce a Fermi resonance doublet at 1285 and 1388 cm-1
(Πu doubly degenerate bending mode)
(Σg+ Symmetric with respect
to plane of symmetry through the molecular axis)
(Σu- anti- Symmetric with
respect to plane of symmetry through the molecular axis)
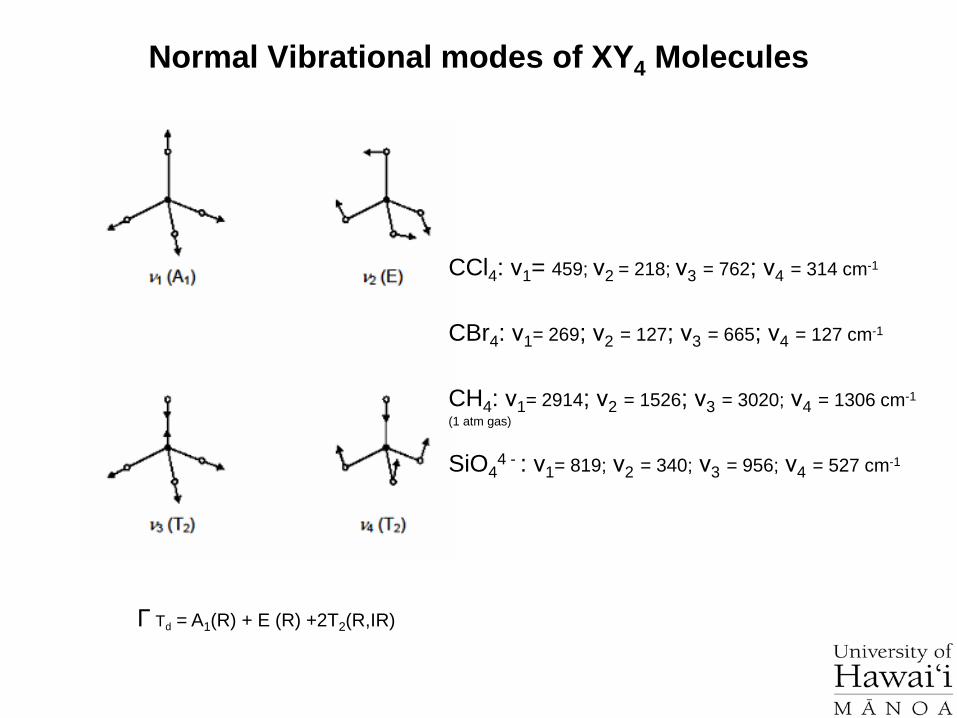
Γ Td = A1(R) + E (R) +2T2(R,IR)
Normal Vibrational modes of XY4 Molecules
CCl4: ν1= 459; ν2 = 218; ν3 = 762; ν4 = 314 cm-1
CBr4: ν1= 269; ν2 = 127; ν3 = 665; ν4 = 127 cm-1
CH4: ν1= 2914; ν2 = 1526; ν3 = 3020; ν4 = 1306 cm-1
(1 atm gas)
SiO44 - : ν1= 819; ν2 = 340; ν3 = 956; ν4 = 527 cm-1
For geological, planetary and materials science research, the Raman spectroscopy Laboratory within SOEST at UH has the following fully Raman spectrographs:
Cofocal Micro-Raman spectrometer with SPEX TRIPLEMATE spectrograph and CCD detector is also available. The SPEX micro-Raman system can use various excitation lines of existing Ar and Kr-ion lasers.
Kaiser RAMAN RXN1™ Microprobe equipped with 785 nm laser excitation. The microscope is also equipped with optical imaging accessories.
Renishaw inVia Raman microscope equipped with 830, 514.5 and 244 nm laser excitation. The microscope is also equipped with optical imaging accessory.
In addition Planetary Science on the 5th Floor of Post building also has
WiTec alpha300 Micro-Raman system equipped with 532 and 632.5 nm lasers
Micro-Raman Spectroscopy Facility within SOEST
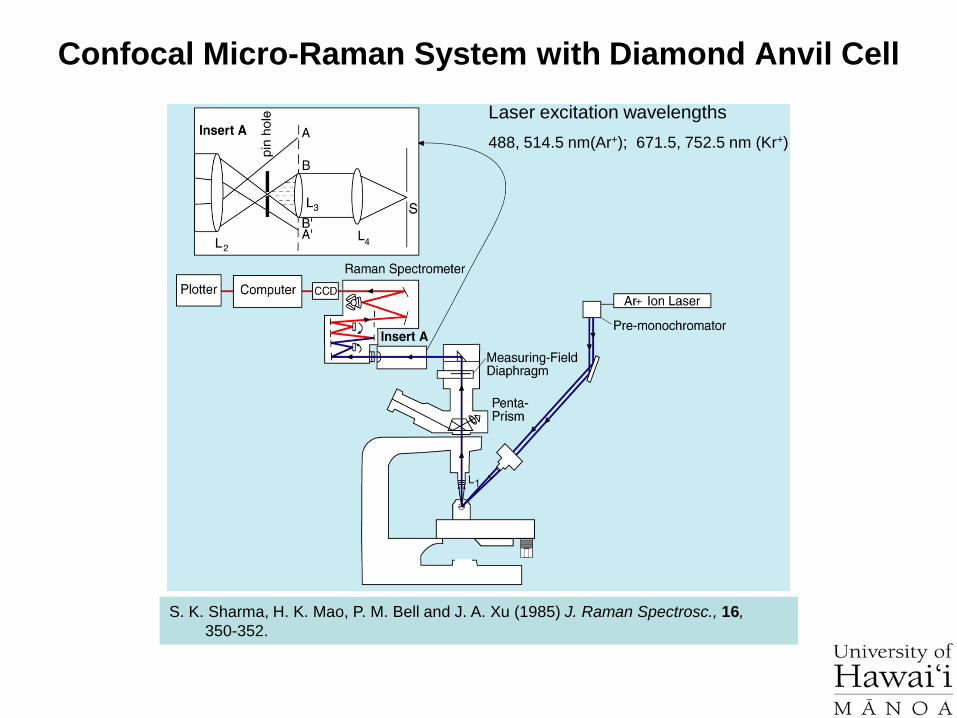
Confocal Micro-Raman System with Diamond Anvil Cell
S. K. Sharma, H. K. Mao, P. M. Bell and J. A. Xu (1985) J. Raman Spectrosc., 16,350-352.
Laser excitation wavelengths488, 514.5 nm(Ar+); 671.5, 752.5 nm (Kr+)
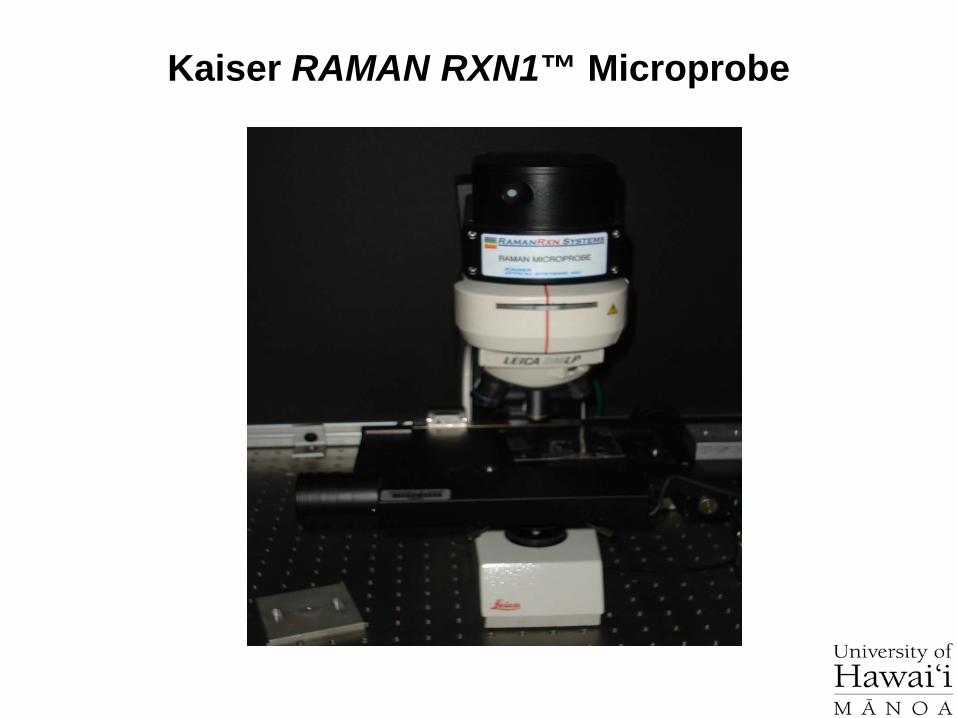
Kaiser RAMAN RXN1™ Microprobe
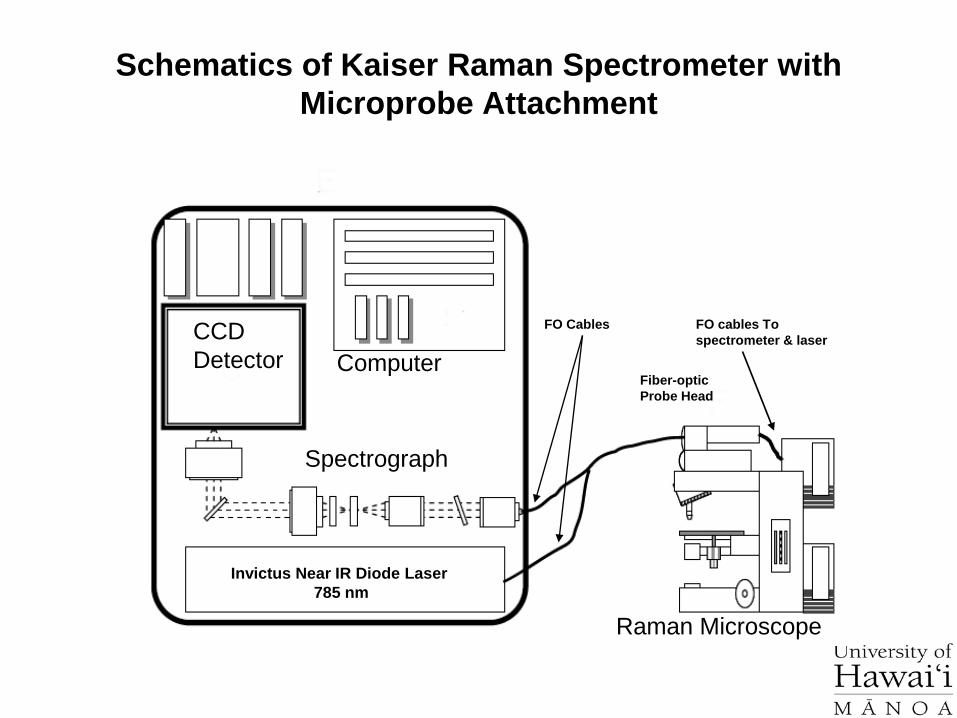
Schematics of Kaiser Raman Spectrometer with Microprobe Attachment
Raman Microscope
Invictus Near IR Diode Laser785 nm
CCD Detector Computer
Spectrograph
Fiber-optic Probe Head
FO cables To spectrometer & laser
FO Cables

Renishaw InVia Micro-Raman system
•Laser Excitation Wavelengths Available244 nm (UV), 514.5 nm (Green) & 830 nm (NIR)

Raman Spectroscopy of Fluid Inclusions
• In synthetic Fe-free basaltic glasses containing CO2, CO fluid inclusions
• In synthetic quartz sample containing CaCl2.xH2O
• CH4 inclusions in olivine crystals
Fluids released from the subducting oceanic lithosphere are generally accepted to cause mantle wedge peridotite meltingthat produces arc magmas. These fluids have long been considered to be dominated by highly oxidized H2O and CO2 asinferred from erupted arc lavas. This inference is also consistent with the geochemistry of peridotite xenoliths in some arcbasalts. We will discuss application of micro-Raman spectroscopy of abundant CH4 + C+H2 fluid inclusions in olivine of afresh orogenic harzburgite in the Early Paleozoic Qilian suture zone in Northwest China.
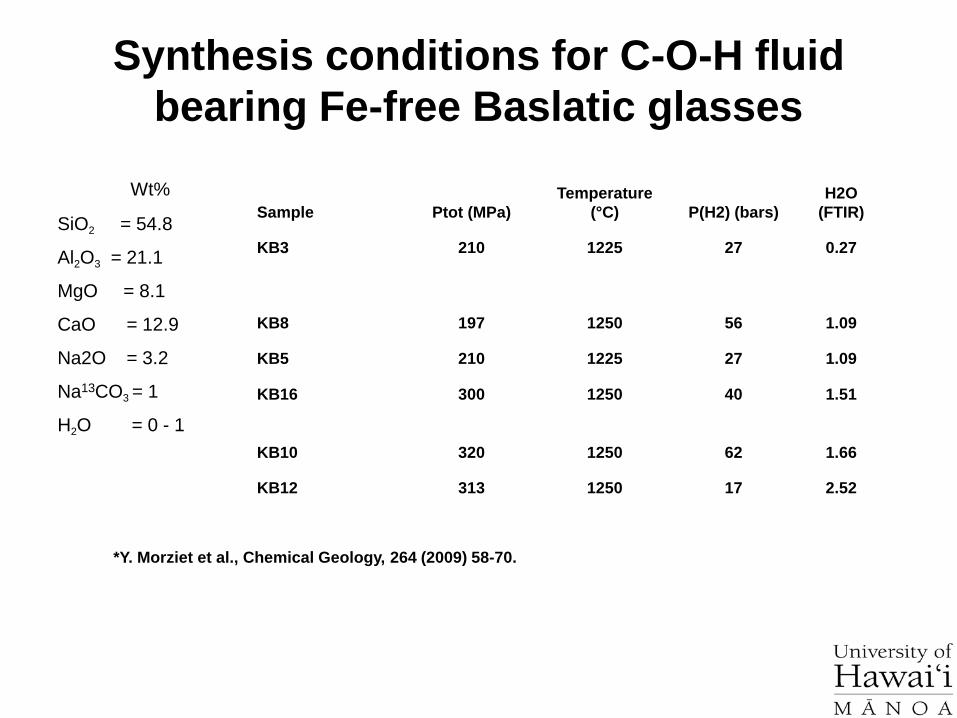
Synthesis conditions for C-O-H fluid bearing Fe-free Baslatic glasses
Sample Ptot (MPa)Temperature
(°C) P(H2) (bars)H2O
(FTIR)
KB3 210 1225 27 0.27
KB8 197 1250 56 1.09
KB5 210 1225 27 1.09
KB16 300 1250 40 1.51
KB10 320 1250 62 1.66
KB12 313 1250 17 2.52
*Y. Morziet et al., Chemical Geology, 264 (2009) 58-70.
Wt%
SiO2 = 54.8
Al2O3 = 21.1
MgO = 8.1
CaO = 12.9
Na2O = 3.2
Na13CO3 = 1
H2O = 0 - 1
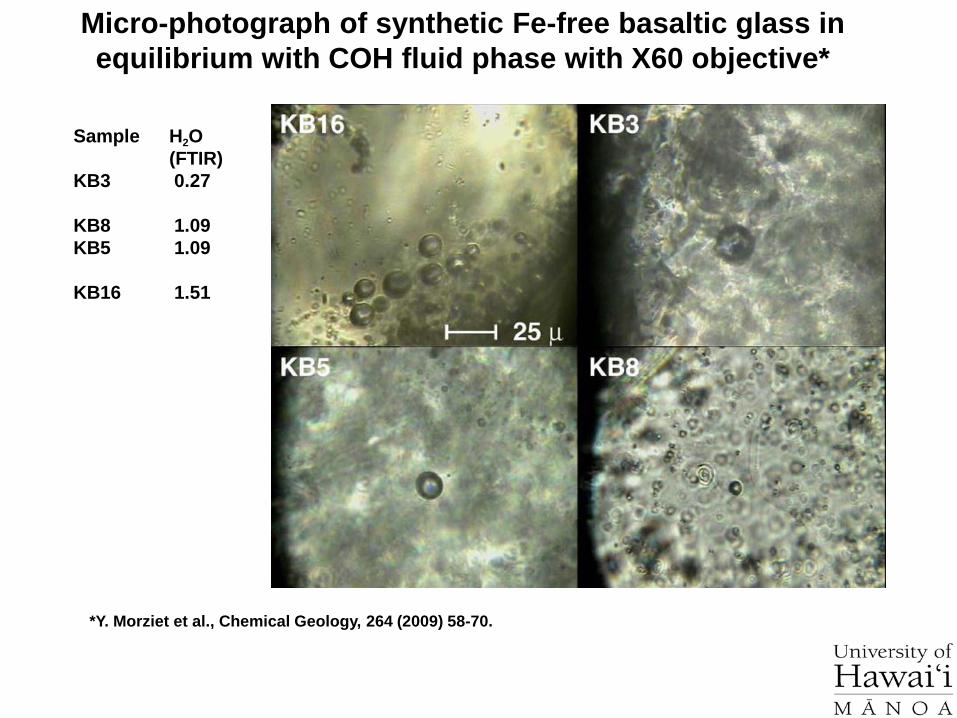
Micro-photograph of synthetic Fe-free basaltic glass in equilibrium with COH fluid phase with X60 objective*
Sample H2O (FTIR)
KB3 0.27
KB8 1.09KB5 1.09
KB16 1.51
*Y. Morziet et al., Chemical Geology, 264 (2009) 58-70.
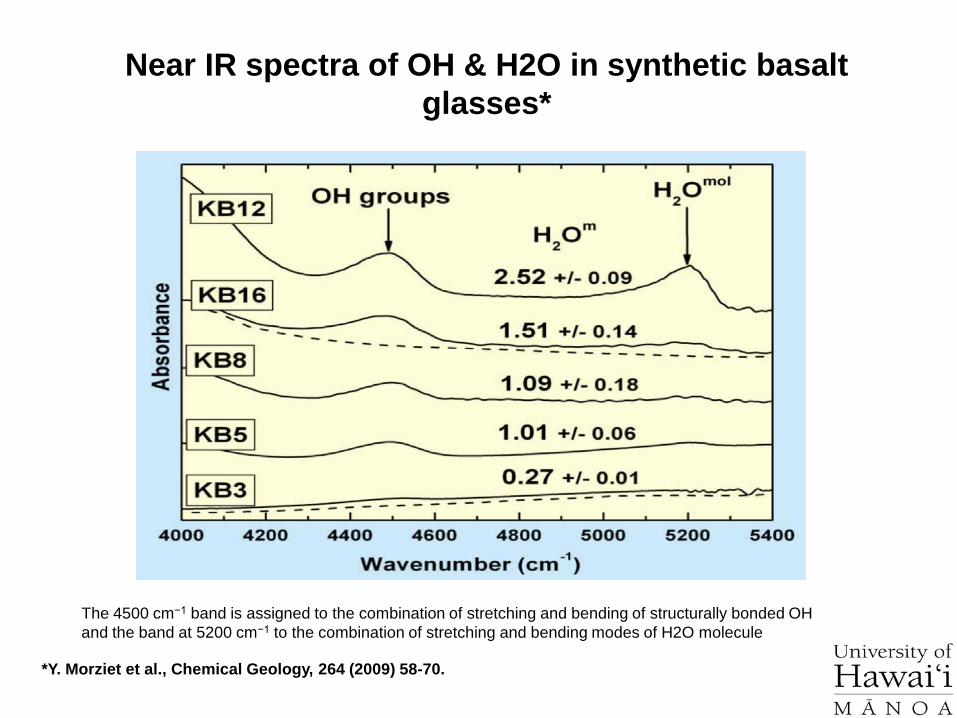
Near IR spectra of OH & H2O in synthetic basalt glasses*
The 4500 cm−1 band is assigned to the combination of stretching and bending of structurally bonded OH and the band at 5200 cm−1 to the combination of stretching and bending modes of H2O molecule
*Y. Morziet et al., Chemical Geology, 264 (2009) 58-70.
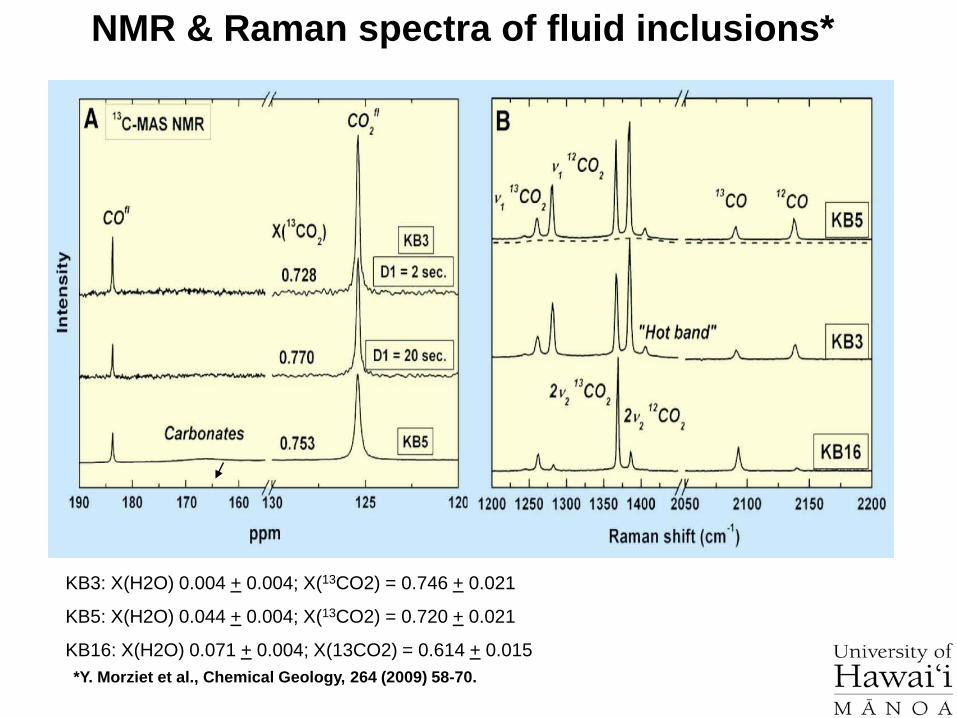
NMR & Raman spectra of fluid inclusions*
KB3: X(H2O) 0.004 + 0.004; X(13CO2) = 0.746 + 0.021
KB5: X(H2O) 0.044 + 0.004; X(13CO2) = 0.720 + 0.021
KB16: X(H2O) 0.071 + 0.004; X(13CO2) = 0.614 + 0.015*Y. Morziet et al., Chemical Geology, 264 (2009) 58-70.

Micro-photograph of fluid inclusion CaCl2.xH2O in Quartz at Various Temperatures
A = Antarcticite (CaCl6.6H2O); L = Liquid; V=VaporM. Baumgartner and R. J. Bakker, Chemical Geology, 206, 335-344 (2009)

Raman spectra of a fluid inclusion CaCl2.xH2O
-190˚ C
-100˚ C
20˚ C
Antarcticite (CaCl6.6H2O)

Raman spectra of fluid inclusions in olivine crystals in Harzburgite from North-West China
Shuguang Song et al., Geochimica et Cosmochimica Acta 73 (2009) 1737–1754.

Confocal micro-Raman spectroscopy of Minerals in Thin Sections
Patricia Fryer1, Toshio Nozaka2, Shiv K. Sharma1, Pavel Zinin1 and the IODP Expeditions 304/305/ Scientific Shipboard Party
1Hawaii Institute of Geophysics and Planetology, University of Hawaii, Honolulu, USA2Okayama University, Okayama, Japan

To study serpentinized mantle peridotite rocks beneath the Mid-Atlantic Ridge
Site 1309D
Site 1309D
Integrated Ocean Drilling Program (IODP) Expedition 305 Objective:
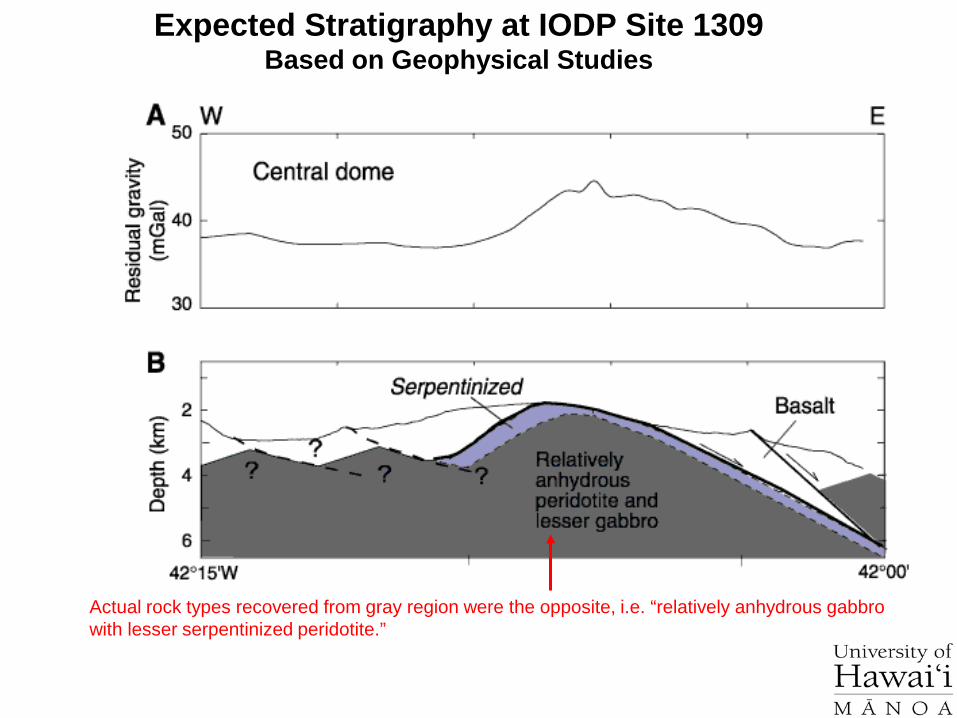
Actual rock types recovered from gray region were the opposite, i.e. “relatively anhydrous gabbro with lesser serpentinized peridotite.”
Expected Stratigraphy at IODP Site 1309Based on Geophysical Studies
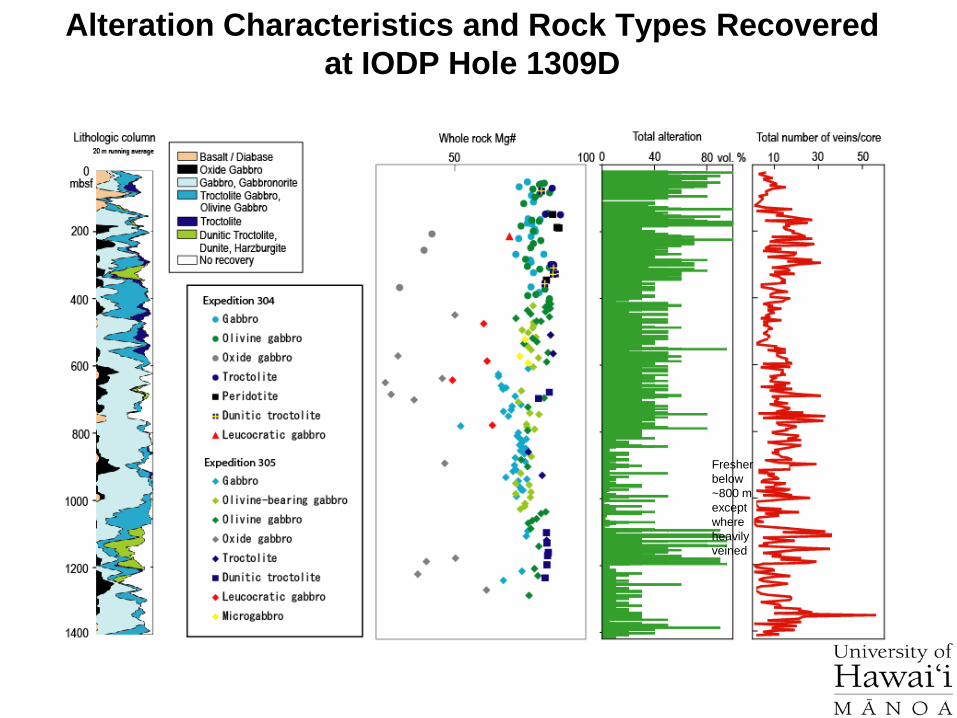
Fresher below ~800 mexceptwhere heavily veined
Alteration Characteristics and Rock Types Recovered at IODP Hole 1309D
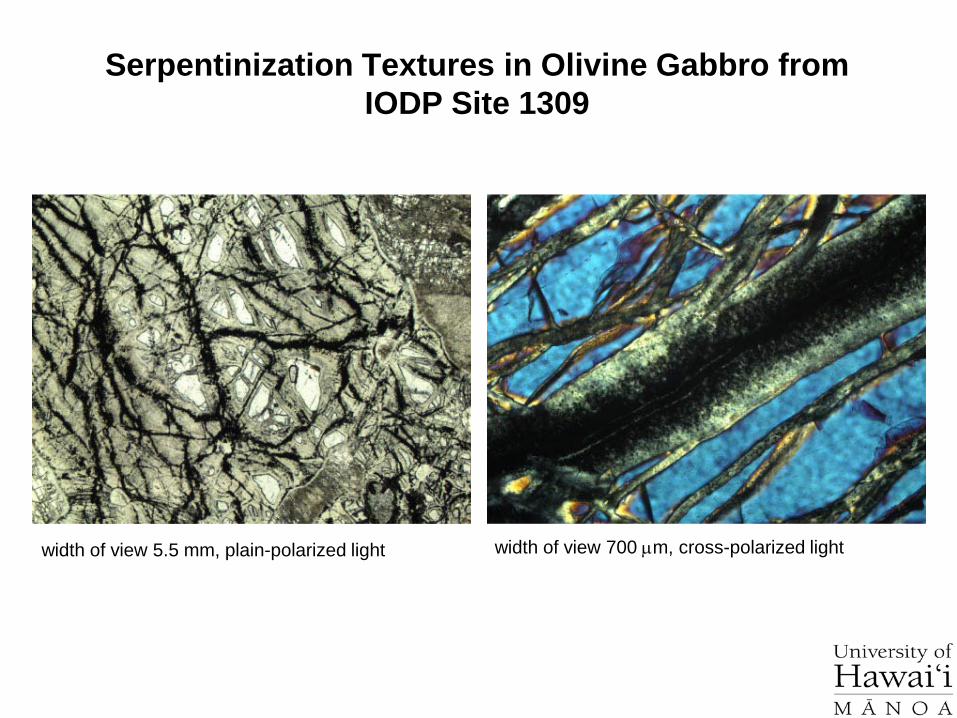
width of view 5.5 mm, plain-polarized light width of view 700 µm, cross-polarized light
Serpentinization Textures in Olivine Gabbro fromIODP Site 1309
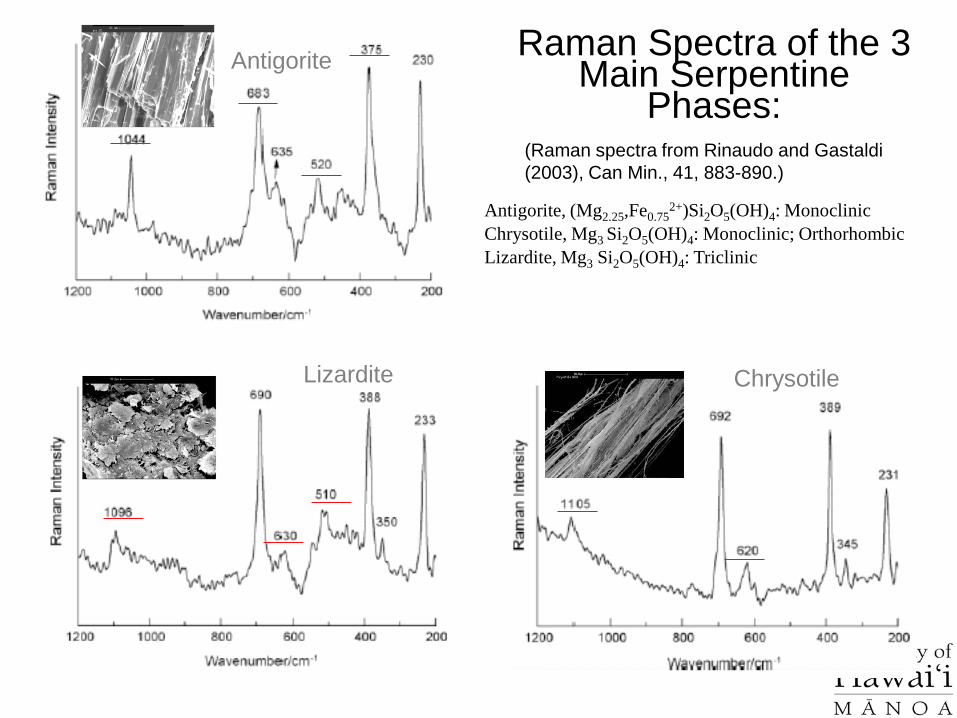
Raman Spectra of the 3 Main Serpentine
Phases:
ChrysotileLizardite
Antigorite
(Raman spectra from Rinaudo and Gastaldi (2003), Can Min., 41, 883-890.)
Antigorite, (Mg2.25,Fe0.752+)Si2O5(OH)4: Monoclinic
Chrysotile, Mg3 Si2O5(OH)4: Monoclinic; OrthorhombicLizardite, Mg3 Si2O5(OH)4: Triclinic

(carbon)
Olivine
Tremolite
(carbon)
Serpentine
Micro-Raman Spectrum of Tremolite Corona in Olivine Gabbro at
IODP Site 1390Thin section #283:
U1309D-80R-1W,110-114cm
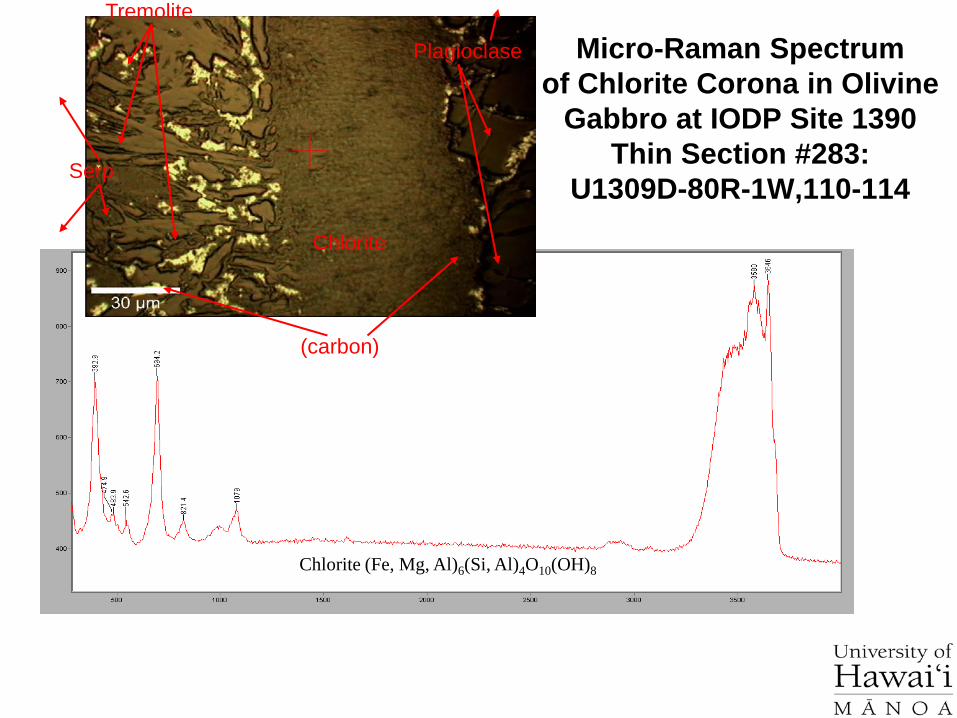
Micro-Raman Spectrum of Chlorite Corona in Olivine
Gabbro at IODP Site 1390Thin Section #283:
U1309D-80R-1W,110-114
Chlorite
Tremolite
(carbon)
Plagioclase
Serp
Chlorite (Fe, Mg, Al)6(Si, Al)4O10(OH)8
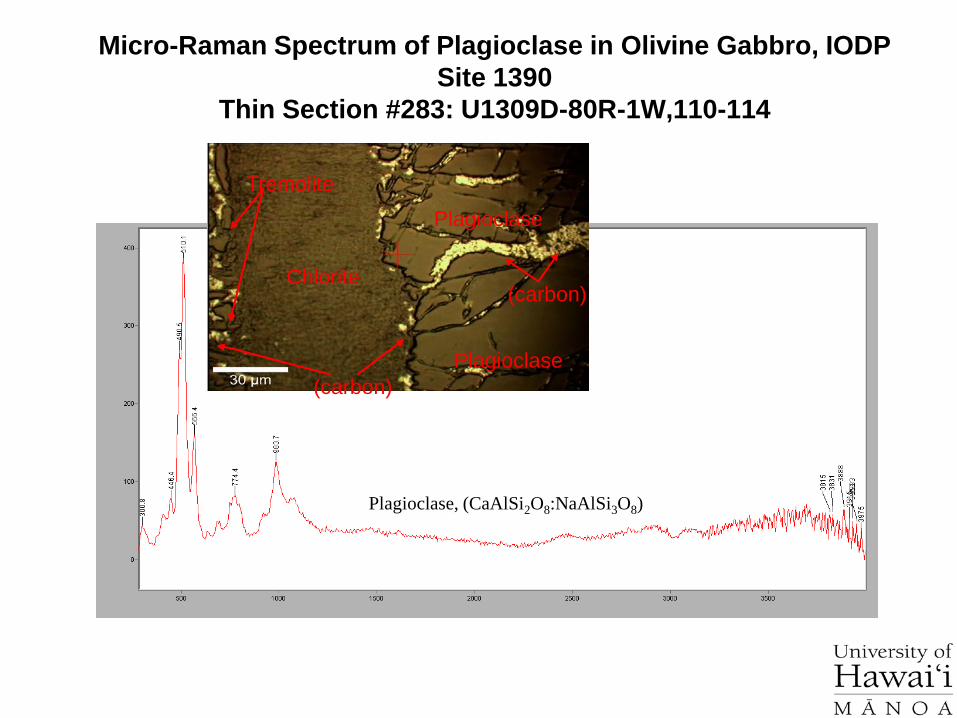
Micro-Raman Spectrum of Plagioclase in Olivine Gabbro, IODP Site 1390
Thin Section #283: U1309D-80R-1W,110-114
Plagioclase
Chlorite
Tremolite
(carbon)
Plagioclase
(carbon)
Plagioclase, (CaAlSi2O8:NaAlSi3O8)
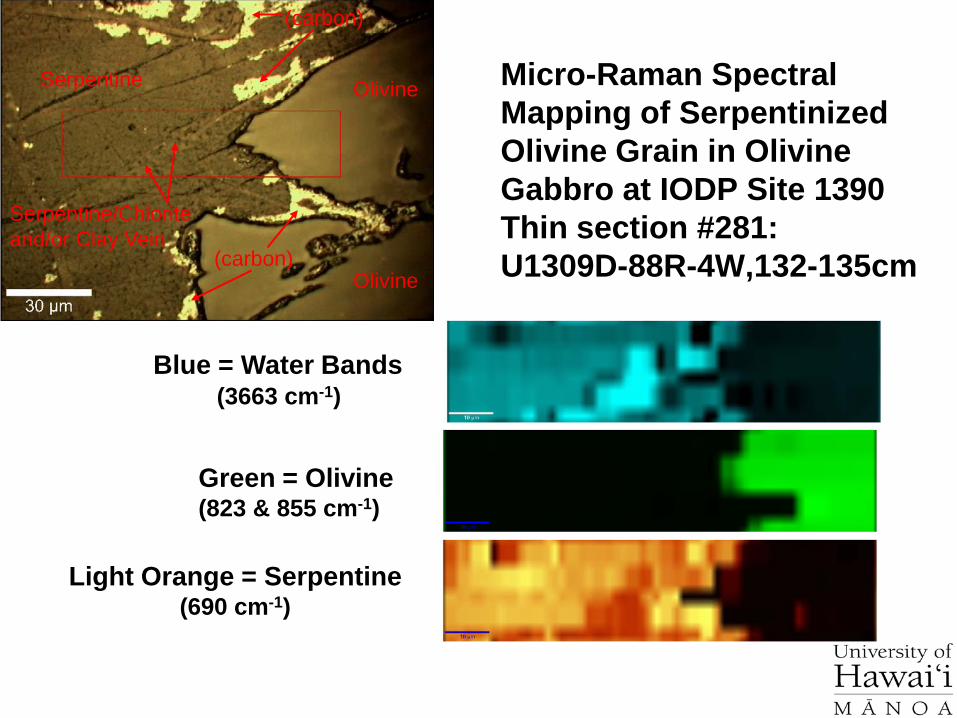
Blue = Water Bands(3663 cm-1)
Green = Olivine(823 & 855 cm-1)
Light Orange = Serpentine(690 cm-1)
OlivineSerpentine
Serpentine/Chlorite and/or Clay Vein
Olivine(carbon)
(carbon)
Micro-Raman Spectral Mapping of Serpentinized Olivine Grain in Olivine Gabbro at IODP Site 1390Thin section #281: U1309D-88R-4W,132-135cm

Raman Spectra of Silicate Minerals & of Isochemical Glasses
• Raman spectra of quartz and silica glass at high temperature• Raman spectra of ortho-silicate M2SiO4 minerals and
isochemical glasses (Where M = Mg, Fe 2+
• Raman spectra of pyro-silicate (melilite) crystals and isochemical glasses
• Raman spectra of pyroxene crystals and isochemical glasses• Raman spectra of glasses along the join M2O-SiO2
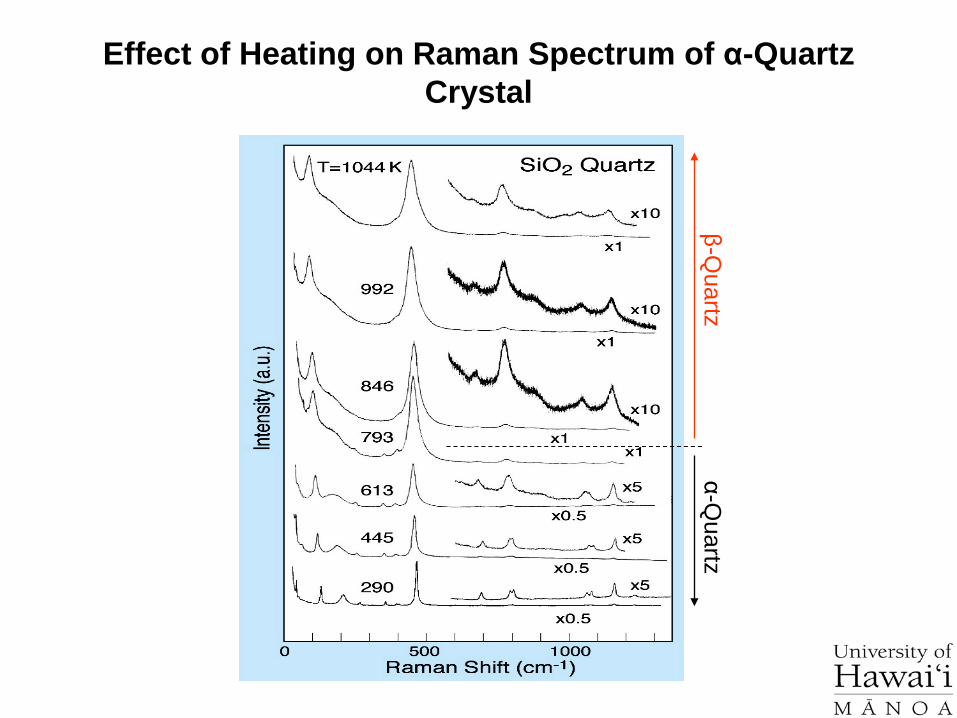
β-Quartz
α-Quartz
Effect of Heating on Raman Spectrum of α-Quartz Crystal
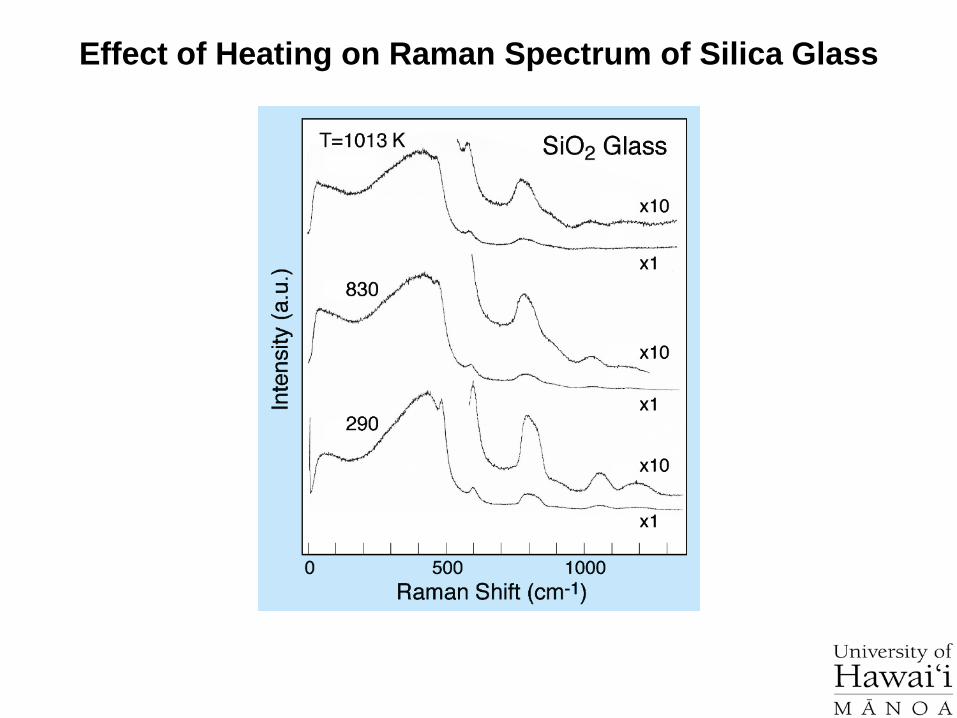
Effect of Heating on Raman Spectrum of Silica Glass
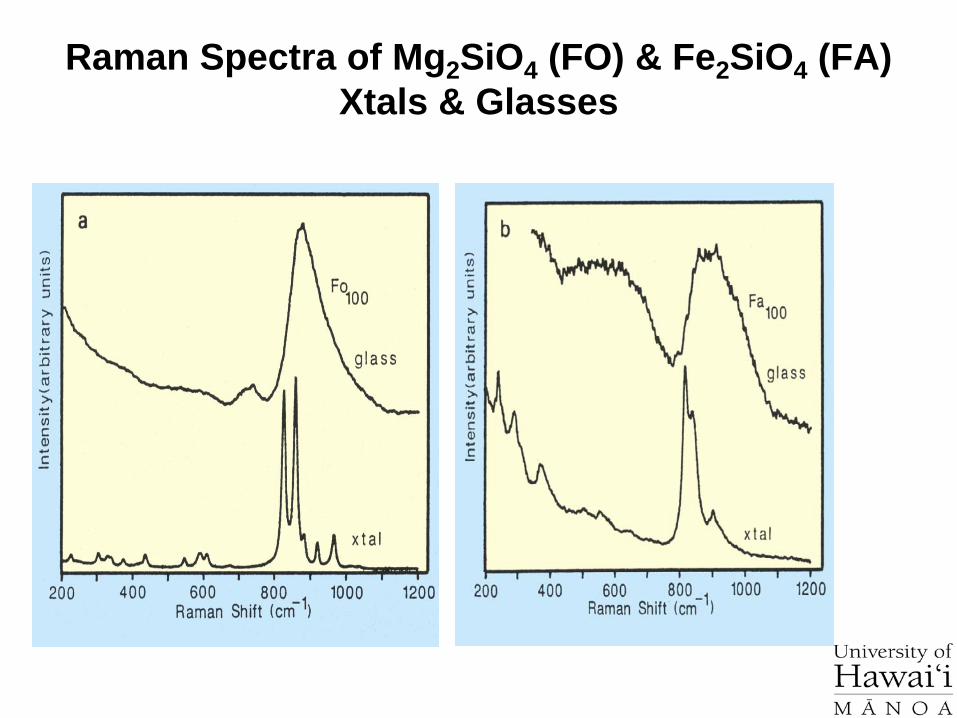
Raman Spectra of Mg2SiO4 (FO) & Fe2SiO4 (FA) Xtals & Glasses

Raman Spectra of Glasses along the JoinFa-Fo
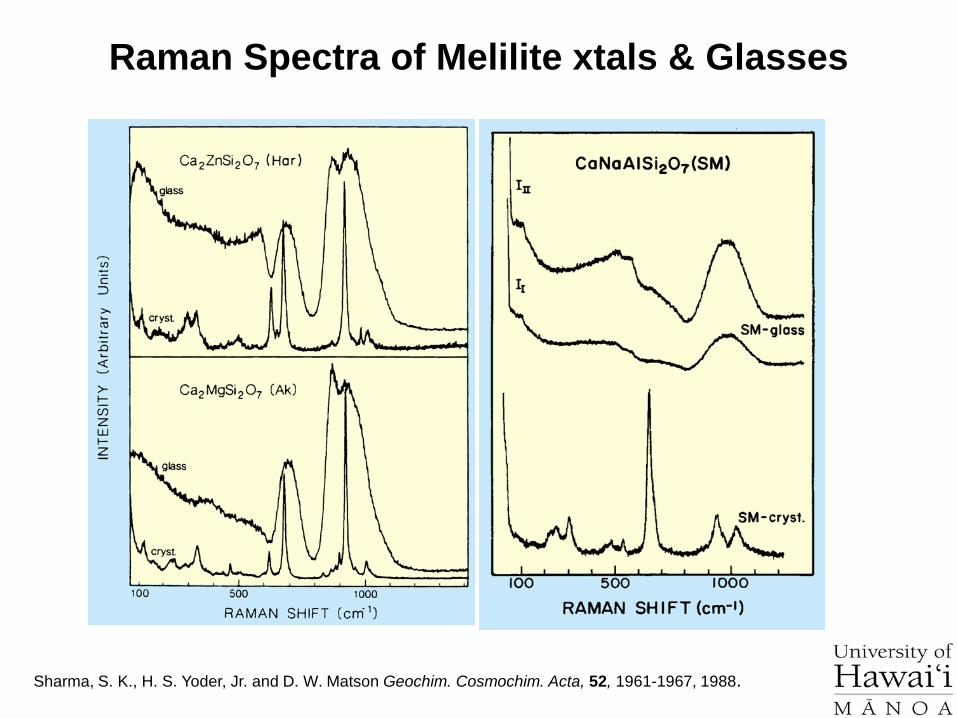
Raman Spectra of Melilite xtals & Glasses
Sharma, S. K., H. S. Yoder, Jr. and D. W. Matson Geochim. Cosmochim. Acta, 52, 1961-1967, 1988.
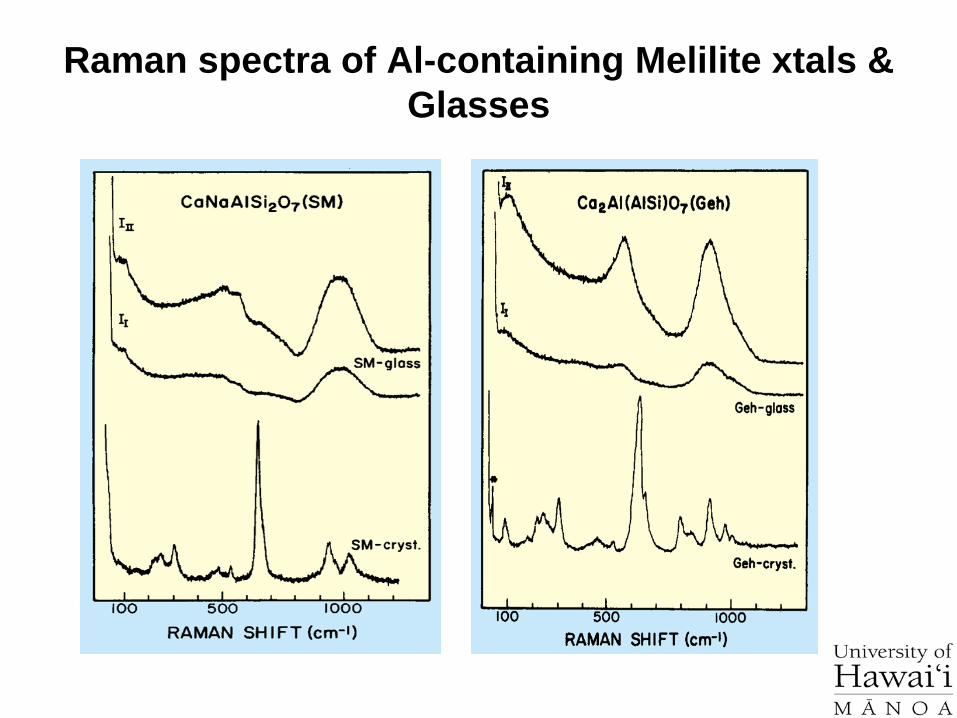
Raman spectra of Al-containing Melilite xtals & Glasses
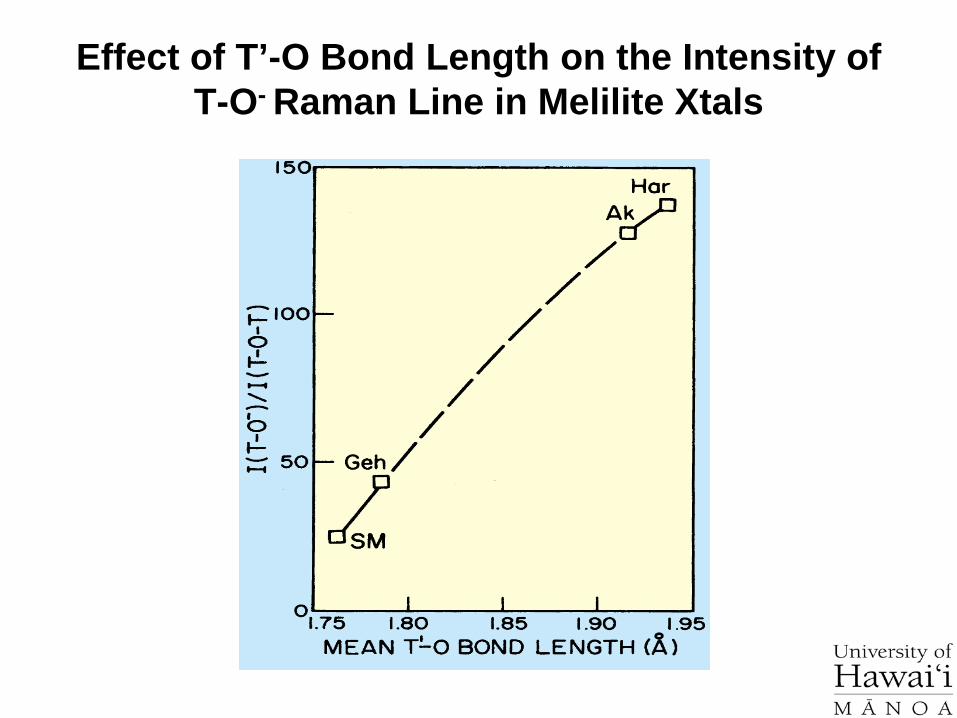
Effect of T’-O Bond Length on the Intensity of T-O- Raman Line in Melilite Xtals

Raman spectra of Pyroxene Xtals & Glasses
Sharma, S. K., D. Virgo and B.O. Mysen, Amer. Mineral., 64, 779-787, 1979.

Raman Spectra of CaFeSi2O6 xtal & Glass
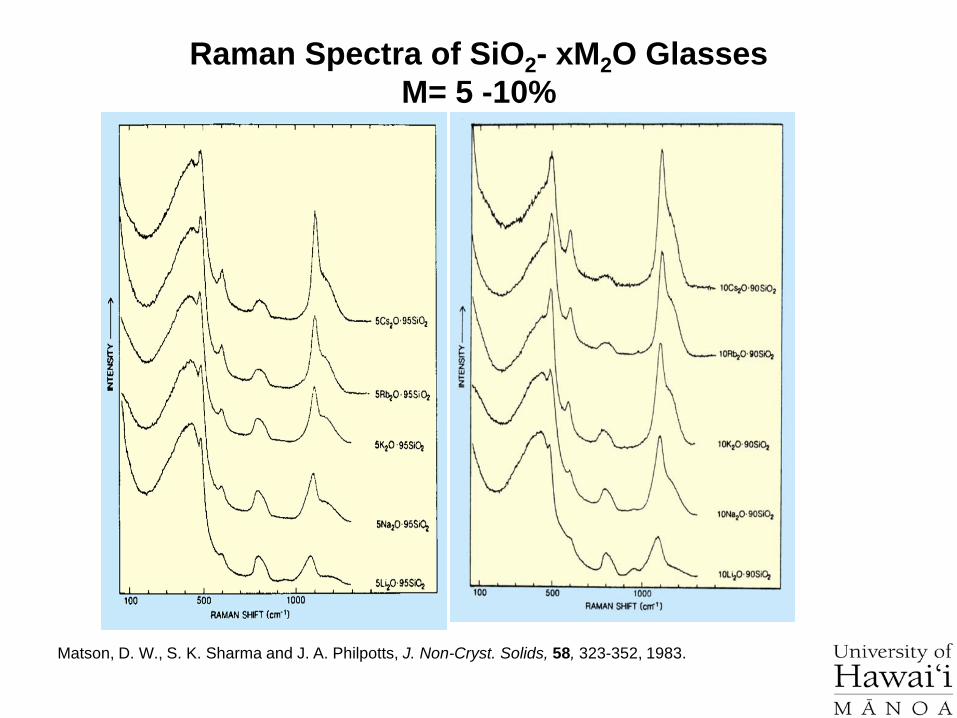
Raman Spectra of SiO2- xM2O GlassesM= 5 -10%
Matson, D. W., S. K. Sharma and J. A. Philpotts, J. Non-Cryst. Solids, 58, 323-352, 1983.
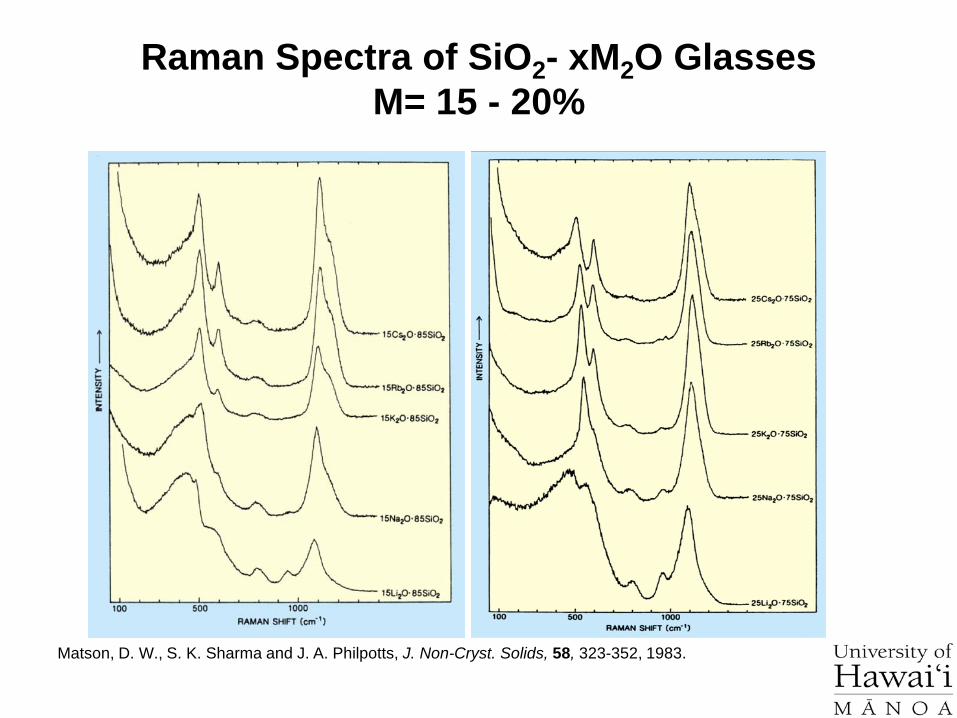
Raman Spectra of SiO2- xM2O GlassesM= 15 - 20%
Matson, D. W., S. K. Sharma and J. A. Philpotts, J. Non-Cryst. Solids, 58, 323-352, 1983.
Summary
Raman spectroscopy can be used to learn about fluid inclusions in synthetic and natural minerals and glasses.
Raman spectra fingerprints of minerals can be used for positively identifying minerals in thin sections as well as for obtaining mineral maps
Raman spectroscopy has been useful in understanding structure of silicate melts and glasses
Reading:• Colthup, Norman B., Daly, L. H., and Wiberley, S. E., Introduction to infrared
and Raman spectroscopy, Boston: Academic Press, 1990. • Nakamoto, Kazuo, Infrared and Raman Spectra of Inorganic and
Coordination Compounds, New York: John Wiley & Sons (1978)• Franc C. Hawthorne (Editor) Spectroscopy Methods in Mineralogy and
Geology. Reviews in Mineralogy, 18, pp.698 (1988)• Raman-IR Mineral Data Bases
http://minerals.gps.caltech.edu/files/raman/ (CalTech)http://rruff.info/ (University of Arizona)
Home Work