spectroscopy group photonics west february 3, 2013 brian c. smith, ph.d.,princeton instruments jason...
TRANSCRIPT
SPECTROSCOPY GROUP
Photonics WestFebruary 3, 2013
Brian C. Smith, Ph.D. ,Princeton Instruments Jason McClure, Ph.D. Princeton Instruments
Dan Heller, Ph.D. Memorial Sloan-Kettering Cancer CenterEd Gooding, Ph.D. Princeton Instruments
An Aberration Free Spectrograph for Improved Imaging and Spectra of Biological Samples
SPECTROSCOPY GROUP
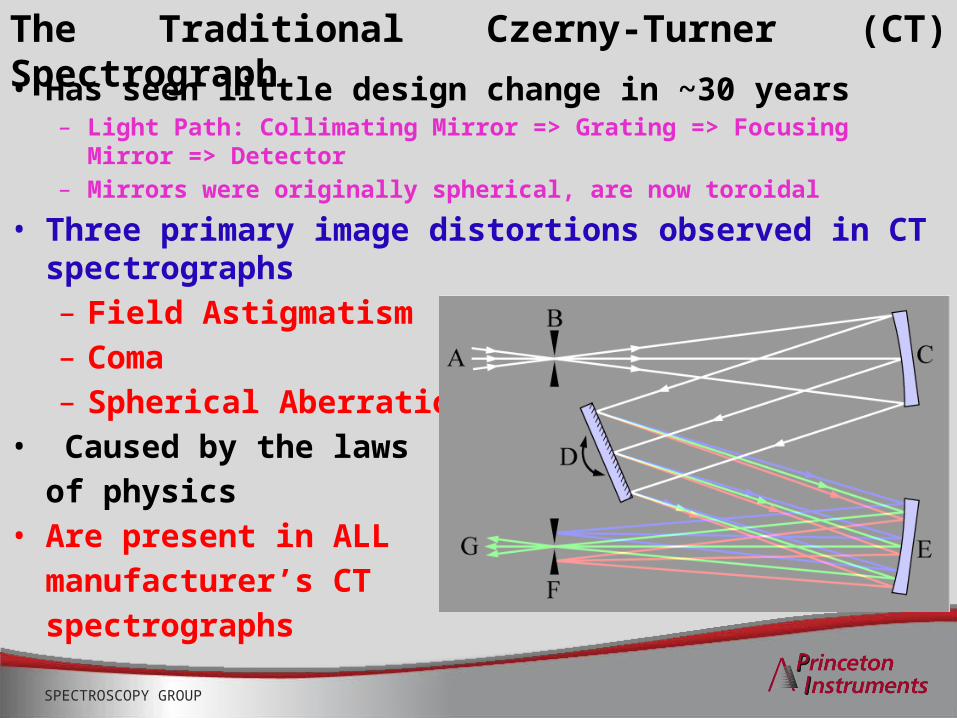
The Traditional Czerny-Turner (CT) Spectrograph
• Has seen little design change in ~30 years– Light Path: Collimating Mirror => Grating => Focusing Mirror
=> Detector– Mirrors were originally spherical, are now toroidal
• Three primary image distortions observed in CT spectrographs – Field Astigmatism– Coma– Spherical Aberration
• Caused by the laws of physics
• Are present in ALLmanufacturer’s CTspectrographs
SPECTROSCOPY GROUP
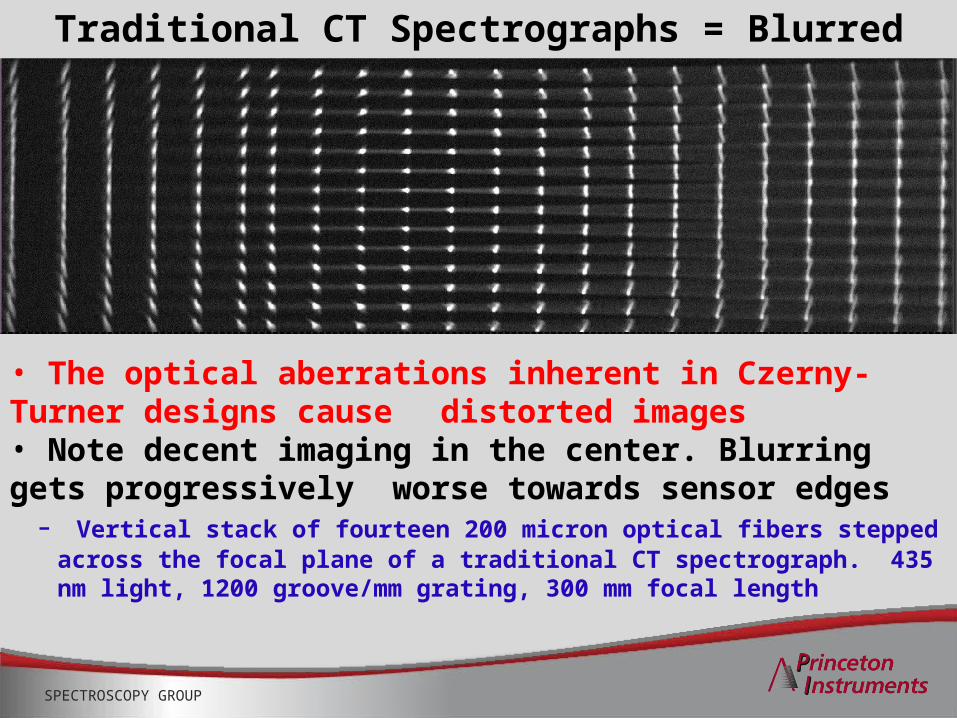
Traditional CT Spectrographs = Blurred Images
• The optical aberrations inherent in Czerny-Turner designs cause distorted images• Note decent imaging in the center. Blurring gets progressively worse towards sensor edges
- Vertical stack of fourteen 200 micron optical fibers stepped across the focal plane of a traditional CT spectrograph. 435 nm light, 1200 groove/mm grating, 300 mm focal length
SPECTROSCOPY GROUP
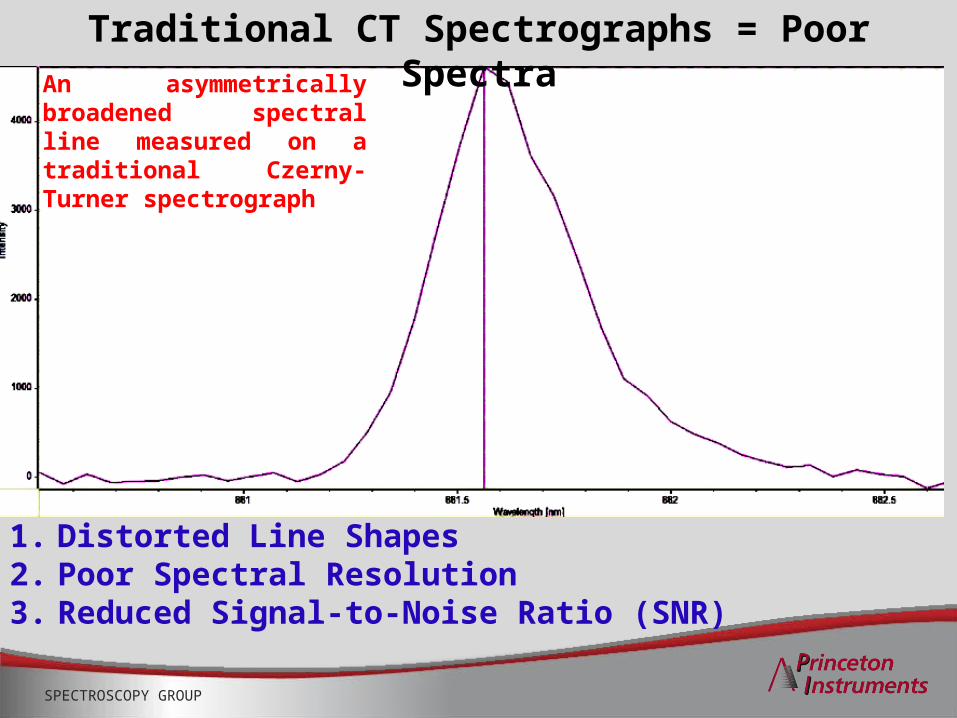
1. Distorted Line Shapes2. Poor Spectral Resolution3. Reduced Signal-to-Noise Ratio (SNR)
Traditional CT Spectrographs = Poor SpectraAn asymmetrically broadened spectral line measured on a traditional Czerny-Turner spectrograph
SPECTROSCOPY GROUP
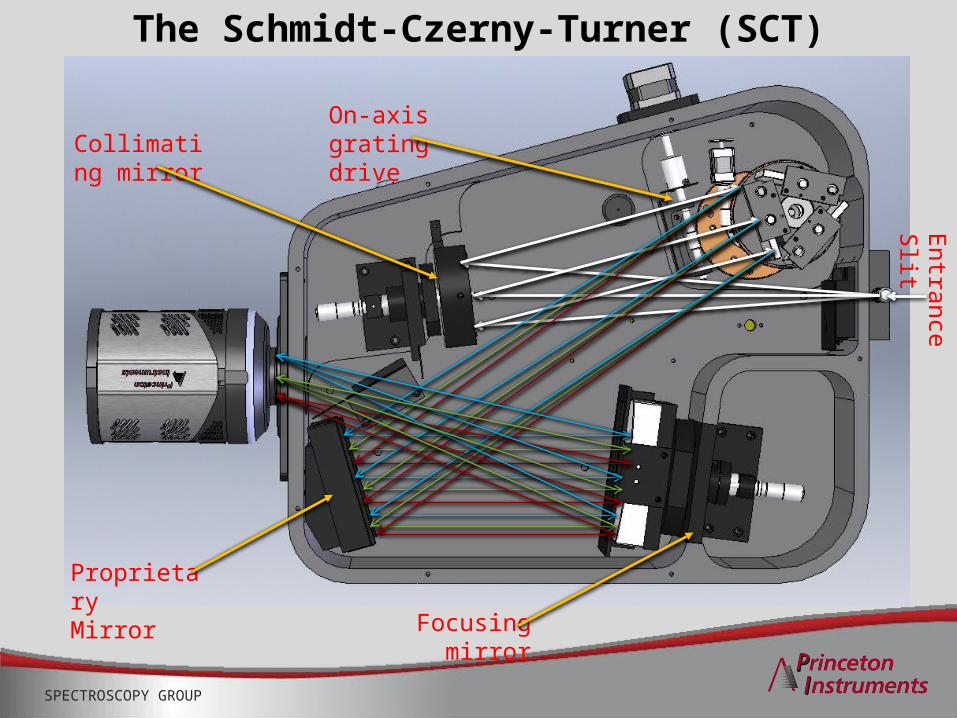
The Schmidt-Czerny-Turner (SCT) Spectrograph
Focusing mirror
Entrance S
lit
On-axis gratingdrive
Collimating mirror
ProprietaryMirror
SPECTROSCOPY GROUP
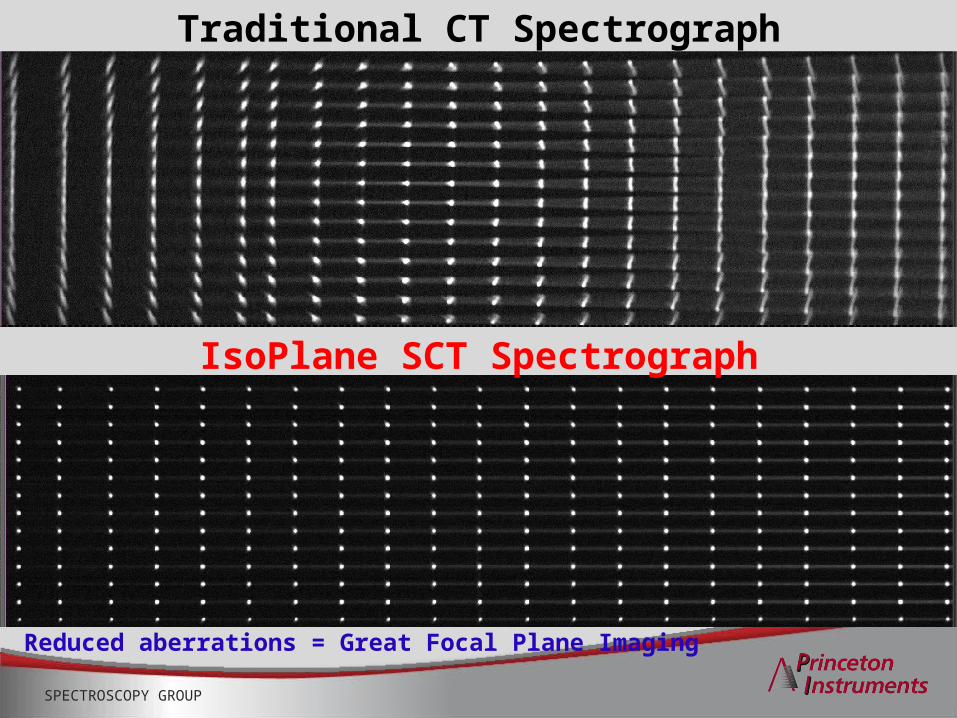
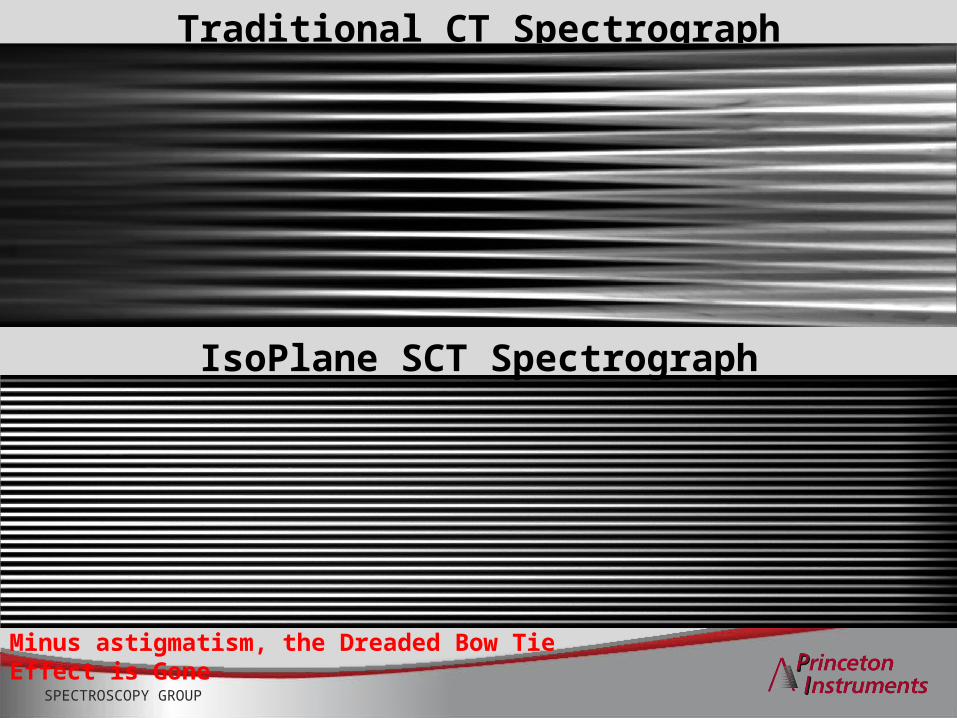
Reduced aberrations = Great Focal Plane Imaging
Traditional CT Spectrograph
IsoPlane SCT Spectrograph
SPECTROSCOPY GROUP
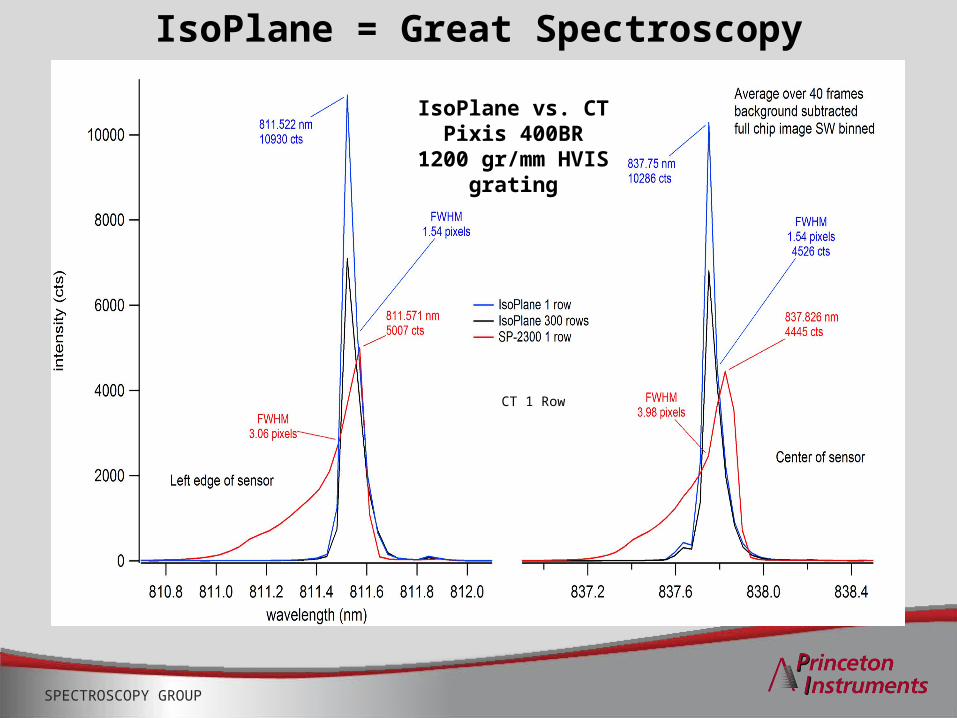
IsoPlane = Great Spectroscopy
IsoPlane vs. CTPixis 400BR
1200 gr/mm HVIS grating
CT 1 Row
SPECTROSCOPY GROUP
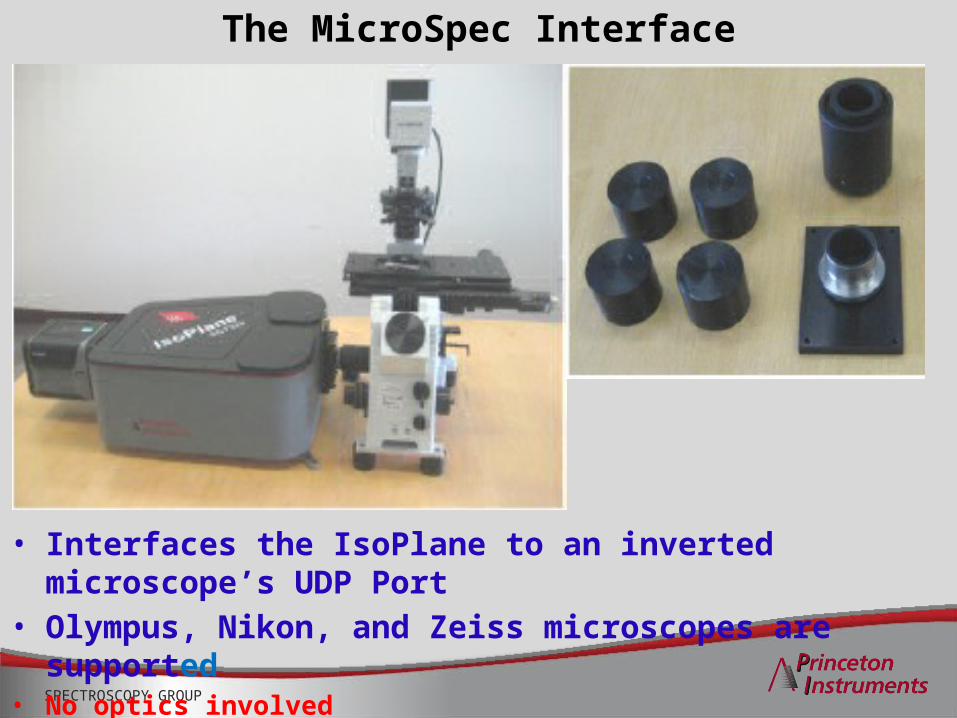
• Interfaces the IsoPlane to an inverted microscope’s UDP Port
• Olympus, Nikon, and Zeiss microscopes are supported
• No optics involved
The MicroSpec Interface

SPECTROSCOPY GROUP
NIR Fluorescence of Carbon Nanotubes
• Single-walled nanotubes 0.6-1.3 nm in diameter• ~100-2000 nm long, averaging ~500nm• Nanotubes are wrapped in a polymer
- Can vary polymer functionality- Proteins and nucleic acids can bind to the polymer
SPECTROSCOPY GROUP
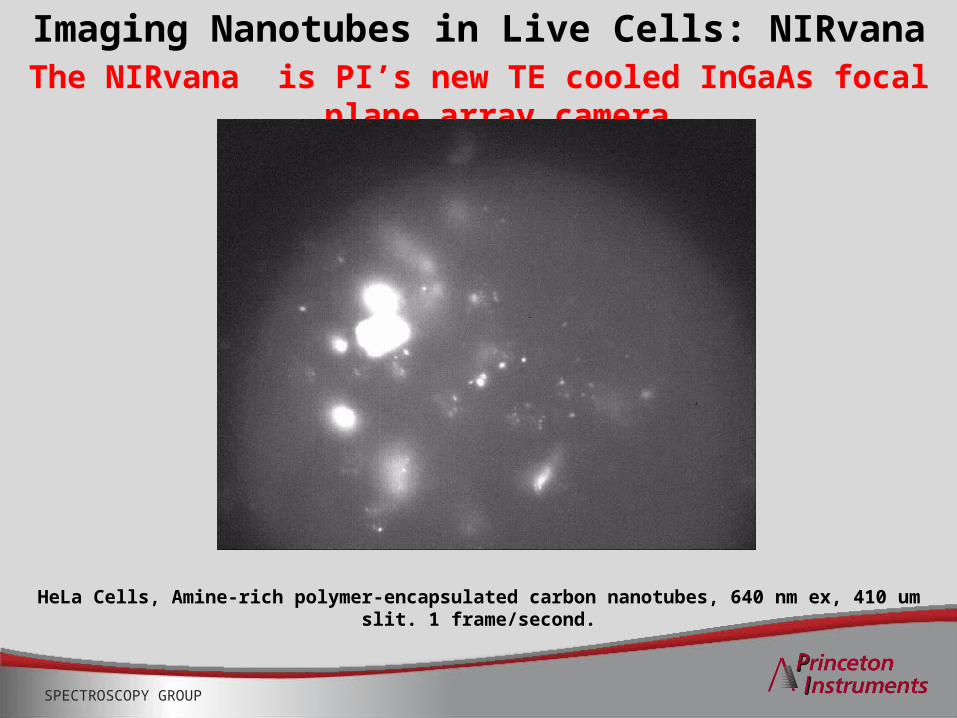
The NIRvana is PI’s new TE cooled InGaAs focal plane array cameraImaging Nanotubes in Live Cells: NIRvana
HeLa Cells, Amine-rich polymer-encapsulated carbon nanotubes, 640 nm ex, 410 um slit. 1 frame/second.
SPECTROSCOPY GROUP
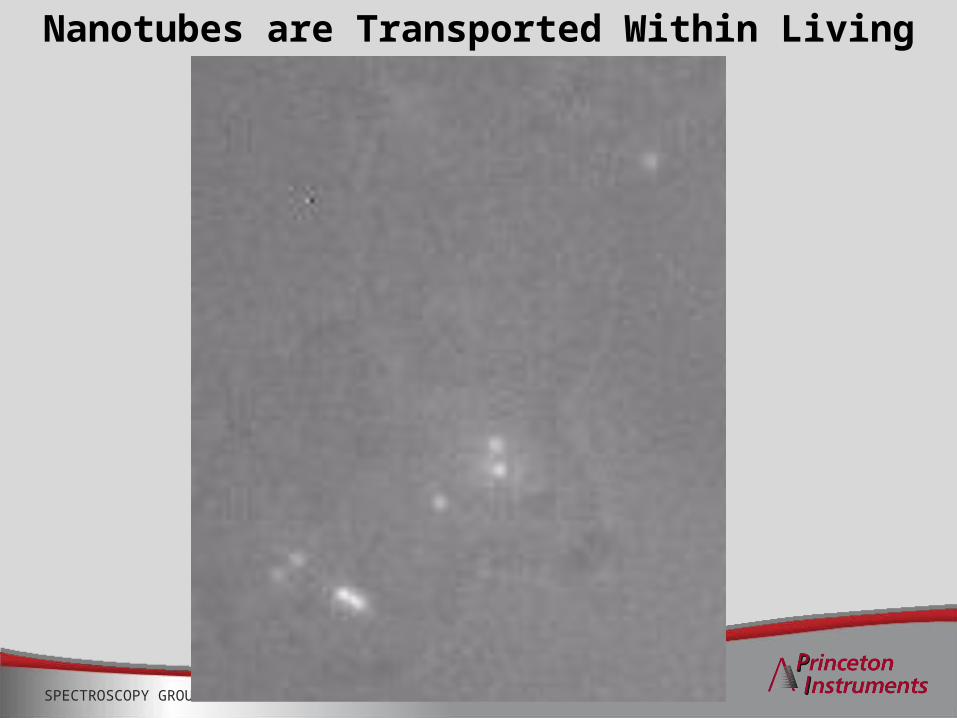
Nanotubes are Transported Within Living Cells
SPECTROSCOPY GROUP
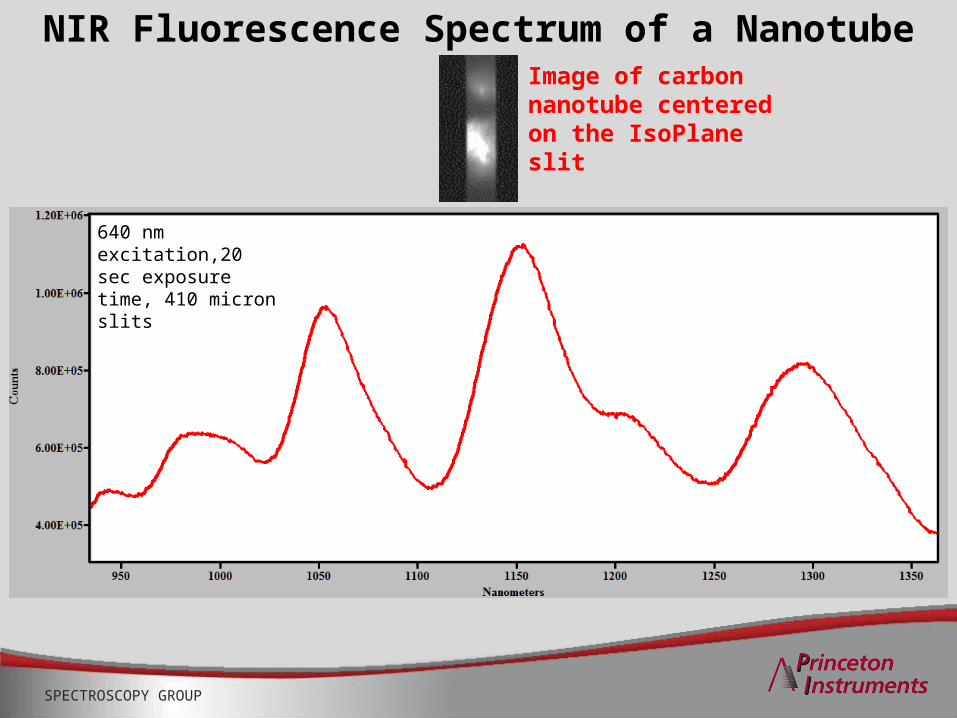
NIR Fluorescence Spectrum of a Nanotube
640 nm excitation,20 sec exposure time, 410 micron slits
Image of carbon nanotube centered on the IsoPlane slit
SPECTROSCOPY GROUP
Acknowledgements
• Trenton Engineering– Bill Asher– Harry Grannis– Bob Bolkus– Bill Hartman
• Acton Engineering• Ed Gooding
– Lloyd Wentzell– Bob Fancy– Mike Case– Paulo Goulart– Bob Jarratt
• Memorial Sloan Kettering Cancer Center– Januka Budhathoki-Uprety
SPECTROSCOPY GROUP
Outline• The Traditional Czerny-Turner (CT) imaging
spectrograph and its limitations
• The Schmidt-Czerny-Turner (SCT) spectrograph: The IsoPlane– Instrumentation– Data showing Reduction or Elimination of image aberrations– Improved imaging– Improved spectroscopy
• Near Infrared Fluorescence of Carbon Nanotubes in Live Cells
SPECTROSCOPY GROUP
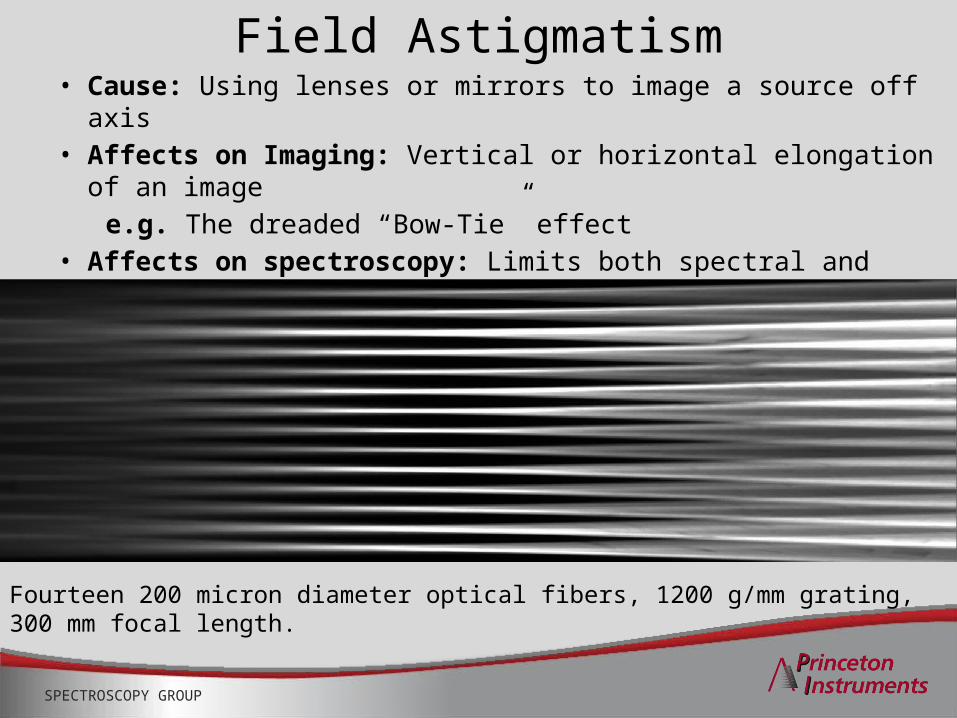
Field Astigmatism• Cause: Using lenses or mirrors to image a source off axis • Affects on Imaging: Vertical or horizontal elongation of an
image e.g. The dreaded “Bow-Tie” effect
• Affects on spectroscopy: Limits both spectral and spatial resolution of a spectrograph. Is completely corrected only at the center of the focal plane.
Fourteen 200 micron diameter optical fibers, 1200 g/mm grating, 300 mm focal length.
SPECTROSCOPY GROUP
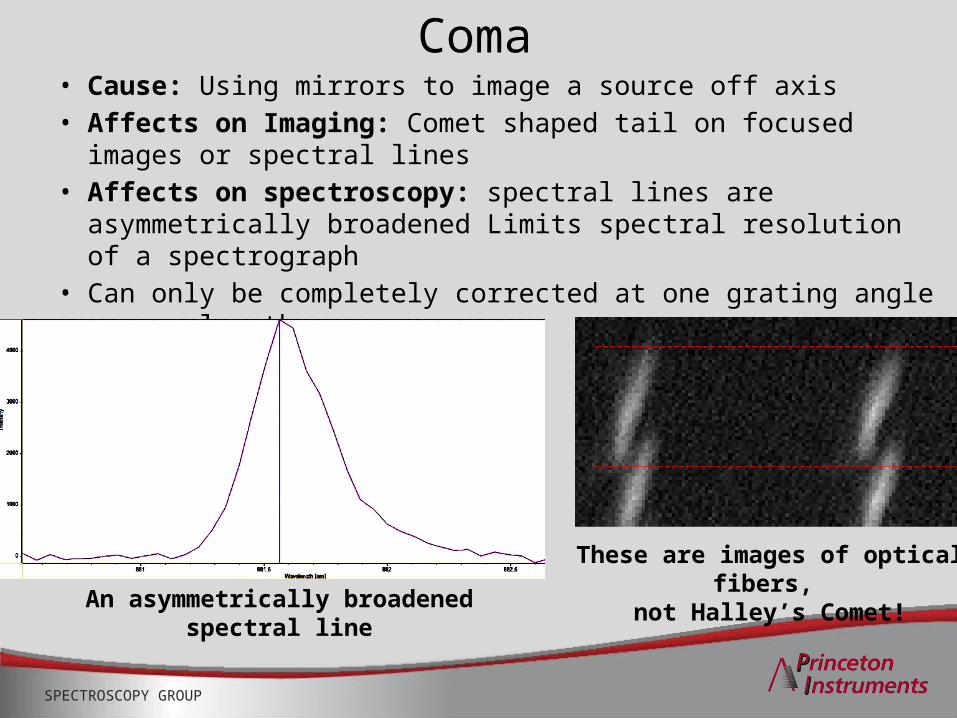
Coma• Cause: Using mirrors to image a source off axis • Affects on Imaging: Comet shaped tail on focused images or
spectral lines• Affects on spectroscopy: spectral lines are asymmetrically
broadened Limits spectral resolution of a spectrograph• Can only be completely corrected at one grating angle or
wavelength
An asymmetrically broadened spectral line
These are images of optical fibers, not Halley’s Comet!
SPECTROSCOPY GROUP
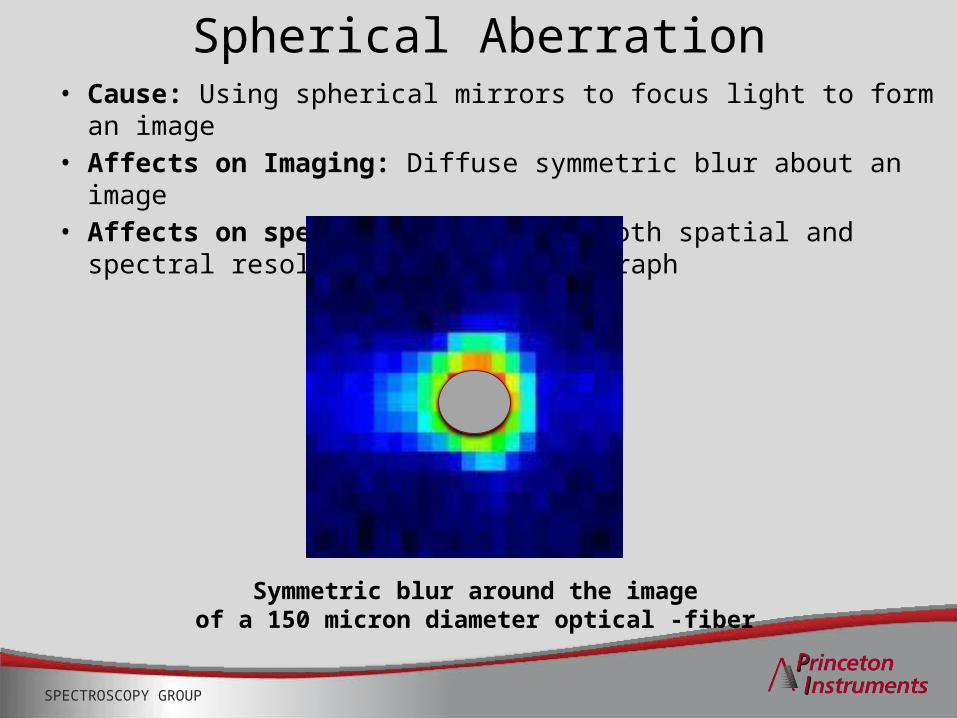
Spherical Aberration• Cause: Using spherical mirrors to focus light to form an image• Affects on Imaging: Diffuse symmetric blur about an image• Affects on spectroscopy: Limits both spatial and spectral
resolution of a spectrograph
Symmetric blur around the imageof a 150 micron diameter optical -fiber
SPECTROSCOPY GROUP
Traditional CT Spectrograph
IsoPlane SCT Spectrograph
Minus astigmatism, the Dreaded Bow Tie Effect is Gone
SPECTROSCOPY GROUP
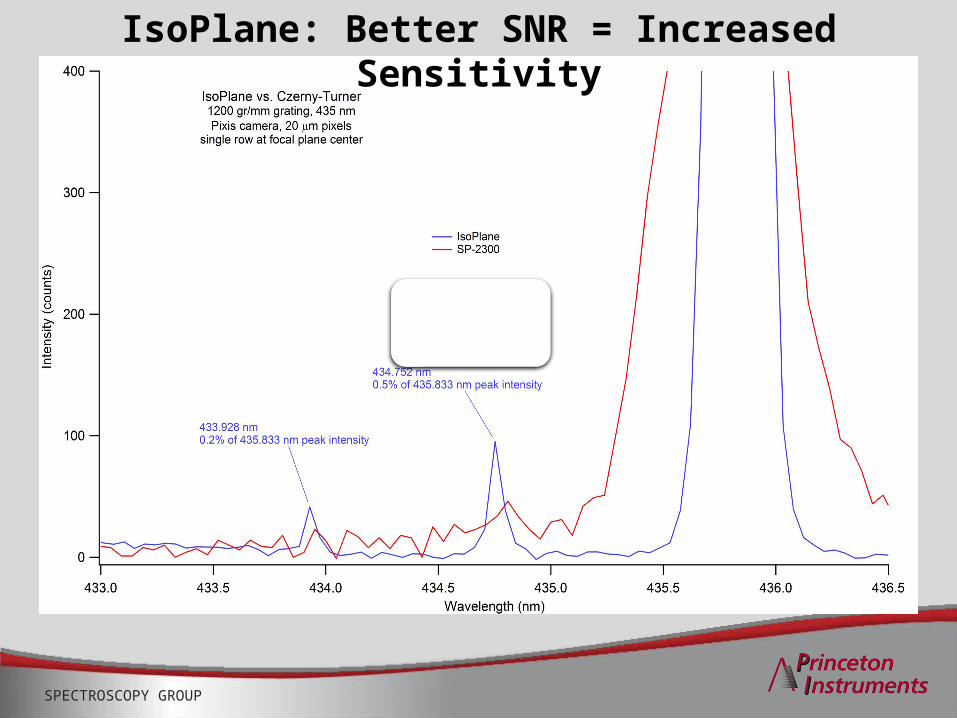
IsoPlane: Better SNR = Increased Sensitivity