spectroscopic diagnosis of cervical intraepithelial neoplasia (cin) in vivo using laser-induced...
TRANSCRIPT

Lasers in Surgery and Medicine 1963-74 (1996)
Spectroscopic Diagnosis of Cervical lntraepithelial Neoplasia (CIN) In Vivo
Using Laser-Induced Fluorescence Spectra at Multiple Excitation Wavlengths
Nirmala Ramanujam, PhD, Michele Follen Mitchell, MD, Anita Mahadevan, MS, Sharon Thomsen, MD, Anais Malpica, MD, Thomas Wright, MD,
Neely Atkinson, PhD, and Rebecca Richards Kortum, PhD
Biomedical Engineering Program, University of Texas, Austin, Texas 78705 (N. R., A. Mah., R. R.K.), Departments of Gynecology (M. F.M.), Pathology (S. T., A. Mal.); and
Biomathematics (N.A.), UT MD Anderson Cancer Center, Houston, Texas; Department of Pafhology, at Columbia University, New York City, New York (T. W.)
Background and Objective: The diagnostic contribution of cervi- cal tissue fluorescence spectra acquired in vivo at 380 and 460 nm excitation were analyzed using a general multivariate statistical algorithm. Materials and Methods: The primary steps of the algorithm are to: (1) preprocess data to reduce interpatient and intrapatient variation of tissue spectra from the same diagnostic category, without a priori information, (2) dimensionally reduce the pre- processed spectral data using Principal Component Analysis, and (3) develop a probability based classification scheme based on logistic discrimination using the diagnostically useful princi- pal components. The algorithm was tested on cervical tissue spectra acquired from 165 sites at 380 nm excitation and from 147 sites at 460 nm excitation. A retrospective and propsective esti- mate of the algorithm’s performance was determined. Results: At 460 nm excitation, (1) SILs can be differentiated from normal squamous tissues with an average sensitivity and speci- ficity of 91% f 1.3 and 75.5% f 1, respectively; furthermore, (2) high grade SILs can be differentiated from low grade SILs with an average sensitivity and specificity of 80% f 4 and 76% f 5, respectively. In addition, using tissue spectra at 380 n m excita- tion, SILs can be differentiated from normal columnar epithelia and inflammation with an average sensitivity and specificity of 77% f 1 and 72% f 9, respectively. Conclusions: Fluorescence spectra at multiple excitation wave- lengths are essential for the detection and differential diagnosis of SILS at ~olposcopy. o 1 s Wiley-Liss, Inc.
Key words: cervix, in vivo diagnosis, laser-induced fluorescence, neoplasia, squamous intraepithelial lesion (SIL)
INTRODUCTION
There has been a significant decline in the mortality rate of invasive cervical cancer over the last 40 years, primarily due to early detection of its precursor, cervical intraepithelial neoplasia (CIN) [ll. Women are initially screened for CIN and cervical cancer with the Pap smear. Patients with an abnormal Pap smear are followed up by a
0 1996 Wiley-Liss, Inc.
diagnostic procedure called colposcopy. However, both the Pap smear and colposcopy are suscepti- ble to error. The Pap smear has been reported to
Accepted for publication October 4, 1995. Address reprint requests to Dr. Rebecca Richards-Kortum, Department of Electrical and Computer Engineering, Uni- versity of Texas, ENS 610, Austin, TX, 78705.

64 Ramanyjam et al. have a false-negative error rate of 15-40% 121. Colposcopy requires extensive training and its ac- curacy for diagnosis is variable and limited even in the hands of expert practitioners [31. Unless improvements are made in current detection pro- grams, it is estimated that the mortality of cervi- cal cancer will rise by 20% in the next decade [41. Laser-induced fluorescence spectroscopy is a tech- nique that has the potential to improve the pre- dictive ability of current detection methods for CIN and cervical cancer. It has an advantage over current detection methods for cervical diseases in that it can quantitatively detect changes in cellu- lar chemistry and tissue morphology associated with progression of disease in a fast and nonde- structive manner.
In a companion report 151, we described a gen- eral multivariate statistical algorithm that can be used to analyze the diagnostic content of cervical tissue spectra acquired in vivo. We illustrated this method using cervical tissue fluorescence ac- quired in vivo at 337 nm excitation and demon- strated that squamous intraepithelial lesions (SILs) (Human Papilloma Viral (HPV) infection, CIN I, CIN 11, CIN 111, CIS) can be differentiated from normal squamous tissue and inflammation with an average sensitivity and specificity of 88% 2 1.4 and 70% k 1.4, respectively. This algorithm has a similar sensitivity and significantly im- proved specificity relative to colposcopy in expert hands [41. However, at this excitation wavelength, spectra of normal columnar epithelia and inflam- mation are indistinguishable from that of SILs; furthermore, the algorithm cannot discriminate between high grade (CIN 11, CIN 111, CIS) and low grade SILs (HPV, CIN I) [41. These limitations must be addressed before this technique can be implemented clinically.
In vitro studies indicate that fluorescence emission spectra of cervical tissue at multiple excitation wavelengths contain information that can enhance the diagnostic content of tissue spectra at a single excitation wavelength [6]. The goal of this report is to evaluate the diagnostic potential of spectral information obtained in vivo at 380 and 460 nm excitation, to determine if spectra at these excitation wavelengths can address the limitations of the algorithm re- ported at 337 nm excitation 151. The selection of these additional excitation wavelengths was based on the results of an in vitro study that indicated that differences in fluorescence spectra of histologically diseased and nondiseased tissues are greatest near 340, 380, and 460 nm excita-
tion, with maximal differences at 340 nm excita- tion [61.
In this report, tissue spectra at 380 and 460 nm excitation are analyzed using the newly de- veloped multivariate statistical algorithm [51. First, the algorithm is optimized using the spec- tral data set at each excitation wavelength. It is then retrospectively tested on the same data set used to optimize it. Unbiased estimates of algo- rithm performance (sensitivity and specificity) are then obtained using cross-validation [71. The results of this analysis are used to contrast the diagnostic contribution of tissue spectra at 380 and 460 nm excitation to that at 337 nm excita- tion [51, to determine whether information at ad- ditional excitation wavelengths can overcome the limitations of spectra at 337 nm excitation and to select optimal excitation wavelengths for the dif- ferential diagnosis of SILs in vivo.
MATERIALS AND METHODS Fluorescence Measurements of the Cervix at Colposcopy
Fluorescence spectra were obtained in vivo from the intact cervix of patients referred for fol- low up colposcopy for suspected CIN as described in [51. On average, spectra from two abnormal sites, two normal squamous sites, and one normal columnar site (if colposcopically visible) were ob- tained from each patient. Biopsies were obtained only from abnormal sites analyzed by the probe. Histologic examination of the biopsies was per- formed by three board certified pathologists using the Bethesda classification system [ l l . Samples were classified as normal squamous, normal co- lumnar, inflammation, low grade SIL (HPV, CIN I), or high grade SIL (CIN 11, CIN 111, CIS). Sam- ples with multiple diagnoses were classified into the most severe pathologic category.
Spectra were collected in the visible region of the electromagnetic spectrum with a resolution of 10 nm (full width at half maximum) and a signal- to-noise ratio of 30:l at the fluorescence maxi- mum at each excitation wavelength. All spectra were corrected for the nonuniform spectral re- sponse of the detection system using correction factors obtained by recording the spectrum of an N.1.S.T traceable calibration tungsten ribbon fil- ament lamp. Spectra from each cervical site at each excitation wavelength were averaged and normalized to the peak fluorescence intensity of a rhodamine calibration standard at the corre- sponding excitation wavelength for that patient as described in [5].

Spectroscopic Diagnosis of GIN 65
TABLE 1. Histopathologic Classification of Cervical Tissue Spectra Acquired In Vivo From 40 Patients at 337 and 380 nm Excitation and From 24 Patients at 337 and 460 nm Excitation
337 and 380 nm 337 and 460 nm excitation excitation
Classification (40 patients) (24 patients) Normal squamous 82 76 Normal columnar 20 24 Inflammation 10 11 Low grade SIL 28 14 High made SIL 15 22
Sixty-four patients participated in this study; in 40 patients, emission spectra were ac- quired at 337 and 380 nm excitation; in 24 pa- tients, spectra were acquired at 337 nm and 460 nm excitation (Table 1). These 64 patients are a subset of the 92 patients from which spectra were acquired at 337 nm excitation as reported in [51. This work presents an analysis of tissue spectra acquired at 380 and 460 nm excitation using the multivariate statistical method of algorithm de- velopment described in [51 to determine the diag- nostic content of spectra at these additional exci- tation wavelengths.
Multivariate Analysis of Cervical Tissue Spectra at 380 and 460 nm Excitation
The multivariate statistical algorithm devel- opment [5] can be characterized by five steps: (1) preprocessing the spectra to reduce interpatient and intrapatient variation of spectra from a di- agnostic category, (2) dimension reduction of the preprocessed spectra using Principal Component Analysis (PCA), (3) selection of diagnostically im- portant principal components using a one-sided unpaired student’s t-test, (4) development of a probability based classification algorithm using logistic discrimination, and (5) retrospective and prospective evaluation of the algorithm’s accu- racy.
Three methods of preprocessing were in- voked on the spectral data at each excitation wavelength: (1) normalization, (2) mean-scaling, and (3) a combination of normalization and mean- scaling [51. Each type of preprocessed spectral data at each excitation wavelength was then eval- uated using PCA and logistic discrimination. The objective was to identify preprocessing methods that provide discrimination between SILs and nondiseased tissues (normal squamous and co- lumnar epithelia and inflammation), as well as between low grade and high grade SILs, using the
spectral data set at each excitation wavelength. The spectral data were independently analyzed at each excitation wavelength.
PCA [61 was used dimensionally to reduce each preprocessed data matrix into a smaller or- thogonal set of linear combinations of the original variables that account for most of the variance of the original data set. Prior to PCA, the input data matrix, D (r x c) was created so each row of the matrix corresponded to the preprocessed flu- orescence spectrum of a sample and each column corresponded to the preprocessed fluorescence in- tensity at each emission wavelength. PCA was carried out as described in [5] and principal com- ponent scores were then calculated.
Average values of principal component scores were calculated for each principal compo- nent for each tissue type. A one-sided unpaired student’s t-test [7] was employed to determine the diagnostic contribution of each principal compo- nent; the hypothesis that the means of the prin- cipal component scores of two tissue categories are different were tested for (1) normal squamous epithelia and SILs, (2) normal columnar epithelia and SILs, and (3) inflammation and SILs. The t-test was extended a step further to determine if there are any statistically significant differences between the means of the principal component scores of high grade SILs and low grade SILs. Principal components for which the hypothesis stated above was statistically significant were retained for further analysis.
Next, a statistical classification algorithm was developed to calculate the posterior probabil- ity that an unknown sample belongs to each of the possible tissue categories identified in the algo- rithm. The posterior probability of an unknown sample belonging to each tissue type was calcu- lated using logistic discrimination [8]. The prior probability for each tissue type was determined by calculating the observed proportion of cases in each group. The total number of cases in each group can serve as estimates of the prior proba- bilities if the sample is considered representative of the population. The spectral data sets at 380 and 460 nm excitation are considered to be repre- sentative of the sample population. This assump- tion is based on our analysis of spectral data ac- quired from previous clinical studies at 337 nm excitation. In an initial clinical study, we ac- quired spectra at 337 nm excitation from -25 pa- tients. In a second clinical study, we examined spectra from - 100 patients at the same excitation wavelength. A comparison of the observed propor-

66 Ramanujam et al. tion of cases in each diagnostic category between the large and small data sets indicated that they are very similar. Therefore, in the current clinical study, we assumed that spectral data from 40 pa- tients at 380 nm excitation and from 24 patients at 460 nm excitation are adequate to represent the sample population as a whole.
The cost of misclassification of the tissue type under consideration was varied from 0 to 1 in 0.05 increments, and the optimal cost was iden- tified when the total number of misclassified samples in the data set was a minimum. The con- ditional joint probabilities were developed by mod- eling the probability distribution of each prin- cipal component for each tissue type using the normal probability density function [7], which is characterized by two parameters, p, (mean) and (T
(standard deviation). The best fit of the normal probability density function to the probability dis- tribution of each principal component (score) for each tissue type was obtained in the least-squares sense, using as p, and u as free parameters of the fit. The normal probability density function was then used to calculate the conditional joint prob- ability that an unknown sample, given that it is from tissue type i, will exhibit the principal com- ponent scores, x.
Finally, the performance of the diagnostic al- gorithm developed was evaluated in an unbiased manner. Conventionally (see [51), the complete data set is split into two; one subsample set is used to construct the diagnostic algorithm and the other is used to obtain an unbiased estimate of the algorithm’s performance. However, this method requires a large sample size. In the ab- sence of a large data set, an alternate method called cross-validation [61 can be used to estimate the misclassification rate in an unbiased manner. In the cross-validation method, one observation is held out from the data set and the algorithm is constructed and optimized using the remaining data. The optimized algorithm is then used to classify the held-out observation. This process is repeated until all observations are classified. The cross-validation method is considered to be pro- spective because each sample that is classified is not included in the data set that was used to op- timize the algorithm.
To implement cross-validation at each exci- tation wavelength here, one observation was ini- tially held out from the preprocessed data set and all steps beginning with PCA were carried out. Then, the preprocessed fluorescence spec- trum of the held-out observation was multiplied
by the eigenvectors generated from the other ob- servations (corresponding to the diagnostically important principal components) to obtain its principal component scores. The principal compo- nent scores of the held-out observation were then entered into the classification algorithm to calcu- late the posterior probability that this sample be- longs to each of the possible diagnostic categories identified. This was repeated until all samples in the data set were classified in an unbiased man- ner.
Finally, to determine the diagnostic contri- bution of spectra at a combination of excitation wavelengths, preprocessed spectra at pairs of ex- citation wavelengths (337, 380 nm) and (337,460 nm) were evaluated using the algorithm. Prepro- cessed spectra at each excitation wavelength from a pair were placed in series in the original data matrix and all steps of the algorithm beginning with PCA were carried out. The results from this analysis were contrasted to the diagnostic contri- bution of spectra at a single excitation wave- length.
RESULTS Typical Spectra
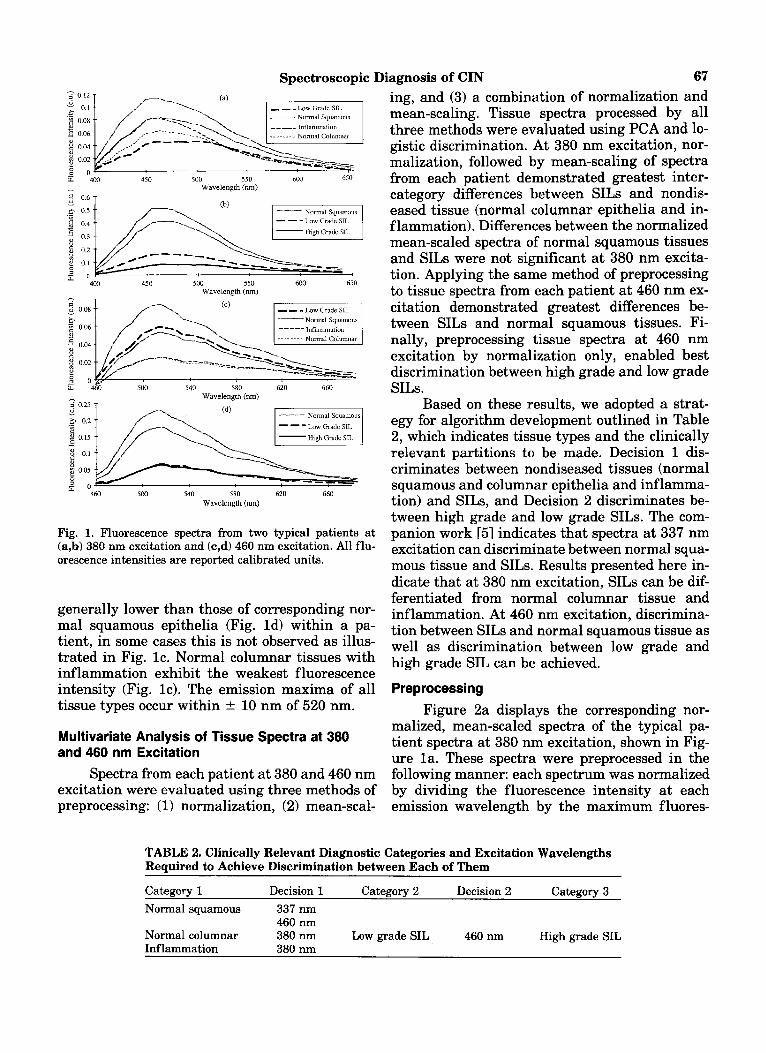
Figure la-d illustrates average spectra per site acquired from cervical sites in two typical pa- tients at 380 and 460 nm excitation. All fluores- cence intensities are reported in the same set of calibrated units. Figure la-b indicates that at 380 nm excitation, the fluorescence intensities of normal squamous epithelia vary by more than a factor of four from patient to patient, whereas within a single patient, the variation is within 20%. The fluorescence intensity of SILs are lower than those of normal squamous and columnar ep- ithelia and inflammation (Fig. la), within a pa- tient, with high grade SILs exhibiting the weak- est fluorescence intensity (Fig. lb). The peak emission wavelength of spectra of normal squa- mous and columnar tissue and inflammation oc- cur within 2 10 nm of 460 nm. The emission max- ima of SILs are broad (40 nm wide) relative to that of nondiseased tissues and have peak emis- sion wavelengths that range from 460-500 nm.
Figure lc-d illustrates two typical patient spectra at 460 nm excitation. The fluorescence intensities of normal squamous epithelia vary by more than a factor of two from patient to patient; within a patient, the variation is generally within 20%, but can vary as much as 40% (Fig. lc). Al- though the fluorescence intensities of SILs are
Spectroscopic Diagnosis of CIN 67
6: 4W 450 500 550 6W 6SO Wavelength (nm)
- - -Low Grade SIL
Wavelength (nm)
Fig. 1. Fluorescence spectra from two typical patients at (a,b) 380 nm excitation and (c,d) 460 nm excitation. All flu- orescence intensities are reported calibrated units.
generally lower than those of corresponding nor- mal squamous epithelia (Fig. Id) within a pa- tient, in some cases this is not observed as illus- trated in Fig. lc . Normal columnar tissues with inflammation exhibit the weakest fluorescence intensity (Fig. lc). The emission maxima of all tissue types occur within k 10 nm of 520 nm.
Multivariate Analysis of Tissue Spectra at 380 and 460 nm Excitation
Spectra from each patient at 380 and 460 nm excitation were evaluated using three methods of preprocessing: (1) normalization, (2) mean-scal-
ing, and (3) a combination of normalization and mean-scaling. Tissue spectra processed by all three methods were evaluated using PCA and lo- gistic discrimination. At 380 nm excitation, nor- malization, followed by mean-scaling of spectra from each patient demonstrated greatest inter- category differences between SILs and nondis- eased tissue (normal columnar epithelia and in- f lammation). Differences between the normalized mean-scaled spectra of normal squamous tissues and SILs were not significant at 380 nm excita- tion. Applying the same method of preprocessing to tissue spectra from each patient at 460 nm ex- citation demonstrated greatest differences be- tween SILs and normal squamous tissues. Fi- nally, preprocessing tissue spectra at 460 nm excitation by normalization only, enabled best discrimination between high grade and low grade SILs.
Based on these results, we adopted a strat- egy for algorithm development outlined in Table 2, which indicates tissue types and the clinically relevant partitions to be made. Decision 1 dis- criminates between nondiseased tissues (normal squamous and columnar epithelia and inf lamma- tion) and SILs, and Decision 2 discriminates be- tween high grade and low grade SILs. The com- panion work [51 indicates that spectra at 337 nm excitation can discriminate between normal squa- mous tissue and SILs. Results presented here in- dicate that at 380 nm excitation, SILs can be dif- ferentiated from normal columnar tissue and inflammation. At 460 nm excitation, discrimina- tion between SILs and normal squamous tissue as well as discrimination between low grade and high grade SIL can be achieved.
Preprocessing
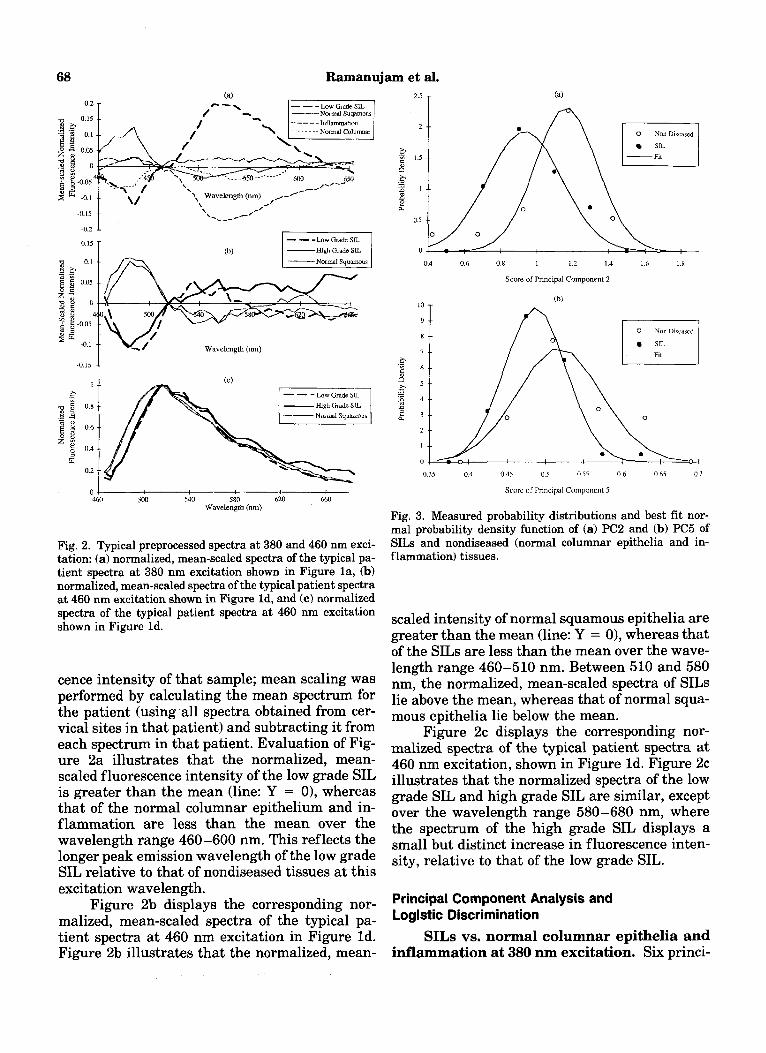
Figure 2a displays the corresponding nor- malized, mean-scaled spectra of the typical pa- tient spectra at 380 nm excitation, shown in Fig- ure la. These spectra were preprocessed in the following manner: each spectrum was normalized by dividing the fluorescence intensity at each emission wavelength by the maximum fluores-
TABLE 2. Clinically Relevant Diagnostic Categories and Excitation Wavelengths Required to Achieve Discrimination between Each of Them
Category 1 Decision 1 Category 2 Decision 2 Category 3 Normal squamous 337 nm
460 nm Normal columnar 380 nm Low grade SIL 460 nm High grade SIL Inflammation 380 nm
68 Ramanujam et al.
Wavelength (nm) ,-
I -Nannal Squa~naus I
Wavelength (nm)
-0.15 1
464 5m 540 580 620 660 Wavelength (nm)
Fig. 2. Typical preprocessed spectra at 380 and 460 nm exci- tation: (a) normalized, mean-scaled spectra of the typical pa- tient spectra at 380 nm excitation shown in Figure la, (b) normalized, mean-scaled spectra of the typical patient spectra at 460 nm excitation shown in Figure Id, and (c) normalized spectra of the typical patient spectra at 460 nm excitation shown in Figure Id.
cence intensity of that sample; mean scaling was performed by calculating the mean spectrum for the patient (using all spectra obtained from cer- vical sites in that patient) and subtracting it from each spectrum in that patient. Evaluation of Fig- ure 2a illustrates that the normalized, mean- scaled fluorescence intensity of the low grade SIL is greater than the mean (line: Y = 01, whereas that of the normal columnar epithelium and in- flammation are less than the mean over the wavelength range 460-600 nm. This reflects the longer peak emission wavelength of the low grade SIL relative to that of nondiseased tissues at this excitation wavelength.
Figure 2b displays the corresponding nor- malized, mean-scaled spectra of the typical pa- tient spectra at 460 nm excitation in Figure Id. Figure 2b illustrates that the normalized, mean-
0 Non Discascd
SIL -Rt
0
1 1.2 1 4 1 6 1.8 0.4 0.6 0.8
Score of Principal Component 2
0 Nor) Dircascd
S I L
03.5 04 045 n 5 0.55 06 0.65 0 7
S c u x of Principal Component 5
Fig. 3. Measured probability distributions and best fit nor- mal probability density function of (4 PC2 and (b) PC5 of SILs and nondiseased (normal columnar epithelia and in- flammation) tissues.
scaled intensity of normal squamous epithelia are greater than the mean (line: Y = 0), whereas that of the SILs are less than the mean over the wave- length range 460-510 nm. Between 510 and 580 nm, the normalized, mean-scaled spectra of SILs lie above the mean, whereas that of normal squa- mous epithelia lie below the mean.
Figure 2c displays the corresponding nor- malized spectra of the typical patient spectra at 460 nm excitation, shown in Figure Id. Figure 2c illustrates that the normalized spectra of the low grade SIL and high grade SIL are similar, except over the wavelength range 580-680 nm, where the spectrum of the high grade SIL displays a small but distinct increase in fluorescence inten- sity, relative to that of the low grade SIL.
Principal Component Analysis and Logistic Discrimination
SILs vs. normal columnar epithelia and inflammation at 380 nm excitation. Six princi-

Spectroscopic Diagnosis of CIN . . . . . . . . . . . . . . . . . . . . . . o . . . . . . A . . . ' . . . . . . . .A&. . . ... . . . *..
O 0 0 A A A A A A
A a. A . . . . . . . . . . . . . . . . . . . . . . . . . . . . . . .
A A .
0
A. o...
A A
d ............................... 0
z a 'rl
. . . . . . . . . . P.. P.. - - ~. b-. a " ! 0 0
O D 0
69
A Low Grade SIL
High Grade SIL
0 Columnar Normal
O Inflammation
Fig. 4. The posterior probability of belonging to the SIL category of all SILs, normal colum- nar epithelia and samples with inflammation in the preprocessed data set containing nor- malized mean-scaled fluorescence spectra at 380 nm excitation.
pal components which account for 99% of the total variance of the preprocessed data matrix contain- ing normalized, mean-scaled spectra at 380 nm excitation, could be used to differentiate SILs from nondiseased tissues (normal columnar epi- thelia and inflammation). A one-sided, unpaired t-test indicated that only principal component 2 (PC2) and principal component 5 (PC5) demon- strate statistically significant differences (P I 0.05) between SILs and nondiseased tissues. The P values of the remaining principal component scores were not statistically significant (P > 0.13) Therefore, further analysis was performed using these two principal components that account col- lectively for 30% of the total variance. PC 2 ac- counts for 28% of the total variance and PC 5 accounts for 2% of the total variance.
Figure 3a-b illustrates the measured proba- bility distribution and the best fit of the normal probability density function to PC2 and PC5 of nondiseased tissues and SILs. There is reasonable agreement between the measured and calculated probability distribution for each case. Prior prob- abilities were determined by calculating the per- centage of each tissue type in the data set: 41% nondiseased tissues and 59% SILs. The cost of misclassification of SIL was optimized to mini- mize the total number of misclassified samples in the data set. The optimal cost of misclassification of SILs was equal to 0.5%. Posterior probabilities of belonging to each tissue type were calculated
for all samples in the data set, using the known prior probabilities, cost of misclassification, and the conditional joint probabilities calculated from the normal probability density function. Figure 4 illustrates the retrospective performance of the diagnostic algorithm on the same data set used to optimize it. The posterior probability of being classified into the SIL category is plotted for all samples evaluated. Figure 4 indicates that 78% of SILs have a posterior probability B0.5, 78% of normal columnar tissues have a posterior proba- bility C0.5, and 60% of samples with inflamma- tion have a posterior probability <0.5.
In Table 3, the retrospective performance of the diagnostic algorithm on the data set used to optimize it (a) is compared to a prospective esti- mate of the algorithm's performance using cross- validation (b). The unbiased estimate of the algo- rithm's performance (Table 3b) indicates that there is no change in the percentage of correctly classified SILs and approximately only a 10% de- crease in the proportion of correctly classified nor- mal columnar samples. Note, however, a 30% de- crease in the proportion of correctly classified samples with inflammation. Due to the small number of samples (10) examined in this cate- gory, these results are inconclusive.
Normal squamous tissue vs. SILs at 460 nm excitation. Seven principal components that account for 99% of the total variance of the pre- processed data matrix containing normalized,

70 Ramanujam et al. TABLE 3. Retrospective and Prospective Estimate of Multivariate Statistical Algorithm’s Performance Using Normalized Mean-scaled Spectra at 380 nm Excitation to Differentiate SILs from Nondiseased Tissues (normal columnar epithelia and inflammation)
(a) Retrospective Classification Normal columnar Inflammation Low grade SIL High grade SIL Nondiseased 78% 60% 21% 26% SILs 22% 40% 79% 74%
(b) Prospective Classification Normal columnar Inflammation Low grade SIL High grade SIL Nondiseased 65% 30% 22% 26% SILs 35% 70% 78% 74%
mean-scaled spectra at 460 nm excitation could be used to differentiate SILs from normal squamous tissues. Principal components 1 (PC1) and 2 (PC2) demonstrated statistically significant differences (P I 0.05) between SILs and normal squamous tissues. The P values of the remaining principal component scores were not statistically signifi- cant (P > 0.06). Therefore, further analysis was performed using these two principal components which account collectively for 75% of the total variance. PC1 and PC2 account for 57% and 18% of the total variance, respectively.
Figure 5a,b illustrates the measured proba- bility distribution and the best fit of the normal probability density function to the scores of PC1 and PC2 of normal squamous tissues and SILs. There is reasonable agreement between the mea- sured and calculated probability distribution for each case. The prior probabilities were deter- mined to be 67% normal squamous tissues and 33% SILs. The optimized cost of misclassification of SILs was equal to 0.55%. Next, posterior prob- abilities of belonging to each tissue type were cal- culated for all samples in the data set. Figure 6 illustrates the retrospective performance of the diagnostic algorithm on the same data set used to optimize it. The posterior probability of being classified into the SIL category is plotted for all samples evaluated. Figure 6 indicates that 92% of SILs have a posterior probability >0.5, and 76% of normal squamous tissues have a posterior prob- ability <0.5.
A prospective estimate of the algorithm’s performance was obtained using cross-validation. In Table 4, the retrospective performance of the algorithm on the data set used to optimize it (a) is compared to the prospective estimate of the algo- rithm’s performance using cross-validation (b). The unbiased estimate of the algorithm’s perfor-
2 s .-
2 .- i, m
ti 1 5 . -
$ 1
x
s -
--
t 0 5 ~-
0 1
0 4 0.6 0.8 1 1 2 1.4 1.6 1.8
Score of Principal Component 1
/ \ I
0 6 O R 1 1 2 1 4 1 6
Score uf Principal Component 2
Fig. 5. Measured probability distributions and best fit nor- mal probability density function of (a) PC1 and (b) PC2 of SILs and normal squamous epithelia.
mance (Table 4b) indicates that there is no change in the percentage of correctly classified high grade SILs or normal squamous tissue; there is a 7% decrease in the proportion of correctly classi- fied low grade SILs.
Low grade SILs vs. high grade SILs at 460 nm excitation. Eight principal components that account for 99% of the total variance of the preprocessed data matrix containing normalized

Spectroscopic Diagnosis of CIN 0
0 $" A~ T "
A Low Grade SIL
High Grade SIL
71
I 0 0
0
. B 0
00
0
0
0 0
. . . . . . . . .
0 0
G 0
A m 0 0 6 3 0 A
0
A A
a
a ?. . . . . . .
0
a m a.
. . . . . . . . .
A . . . . . . . . . . . . . . . . .
0
Sample Number
Fig. 6. The posterior probability of belonging to the SIL category of samples in the prepro- cessed data set containing normalized, mean-scaled fluorescence spectra at 460 nm excita- tion.
TABLE 4. Retrospective and Prospective Estimate of Multivariate Statistical Algorithm's Performance Using Normalized Mean-scaled Spectra at 460 nm Excitation to Differentiate SILs from Normal Sauamous Tissues
(a) Retrospective Classification Normal squamous Low grade SIL High grade SIL normal squamous 76% 7% 9% SIL 24% 93% 91%
(b) Prospective Classification Normal squamous Low grade SIL High grade SIL normal squamous 75% 14% 9% SIL 25% 86% 91%
spectra at 460 nm excitation could be used to dif- ferentiate high grade SILs from low grade SILs. Principal component 4 (PC4) and PC 7 demon- strated the statistically most significant differ- ences (P < 0.05) between high grade SILs and low grade SILs. The P values of the remaining prin- cipal component scores were not statistically sig- nificant (P > 0.09). Therefore, further analysis was performed using these two principal compo- nents that account collectively for 8% of the total variance. PC4 and PC7 account for 7.5% and 0.5% of the total variance, respectively.
Figure 7a,b illustrates the measured proba- bility distribution and the best fit of the normal probability density function to PC4 and PC7 of low grade SILs and high grade SILs. There is rea- sonable agreement between the measured and calculated probability distribution, for each case.
The prior probability was determined to be 39% low grade SILs and 61% high grade SILs. The optimal cost of misclassification of high grade SILs was equal to 0.65%. Posterior probabilities of belonging to each tissue type were calculated. Figure 8 illustrates the retrospective performance of the diagnostic algorithm on the same data set used to optimize it. The posterior probability of being classified into the SIL category is plotted for all samples evaluated. Figure 8 indicates that 82% of high grade SILs have a posterior probabil- ity >0.5, and 78% of low grade SILs have a pos- terior probability <0.5.
A prospective estimate of the algorithm's performance was obtained using cross-validation. In Table 5, the retrospective performance of the algorithm on the data set used to optimize it (a) is compared to the unbiased estimate of the algo-

Ramanujam et al.
0 Low Grade Sll.
HighGradeSU
0 5 0 7 0.9 I 1 1 3 1.5 17
Score of Principal Component 4
0.4 0.44 0.48 0 52 0.56 0.6
Scare of Principal Component I
Fig. 7. Measured probability distributions and best fit nor- mal probability density function of (a) PC4 and (b) PC7 of low grade SILs and high grade SILs.
rithm’s performance using cross-validation (b). The unbiased estimate of the algorithm’s perfor- mance (Table 5b) indicates that there is a 5% de- crease in the percentage of correctly classified high grade SILs and low grade SILs.
When the algorithms were developed using emission spectra at two excitation wavelengths ((337 nm / 380 nm) or (337 nm / 460 nm)), classi- fication accuracy was essentially similar to that achieved using spectra at a single excitation wavelength. For example, combining spectra at 337 and 460 nm excitation resulted in only a small increase in the sensitivity of an algorithm to differentiate SILs from normal squamous epi- thelia relative to that of an algorithm which uses either spectra at 337 or 460 nm excitation.
DISCUSSION AND CONCLUSIONS
The purpose of this study was to evaluate the diagnostic potential of in vivo cervical tissue spec-
tra acquired at 380 and 460 nm excitation. This study demonstrates that using a multivariate sta- tistical algorithm, fluorescence spectra at two ex- citation wavelengths can be used to differentially diagnose SILs. At 460 nm excitation, SILs can be differentiated from normal squamous tissues with an average sensitivity and specificity of 91% * 1.3 and 75.5% 2 1, respectively, and high grade SILs can be differentiated from low grade SILs with an average sensitivity and specificity of 80% t 4 and 76% 5 5, respectively. Table 6 compares the sensitivity and specificity of the multivariate statistical algorithm to that of colposcopy in ex- pert hands [5]. The results presented for the algo- rithm represent a similar sensitivity and a signif- icantly improved specificity relative to colposcopy in expert hands [41. In addition, using tissue spec- tra at 380 nm excitation, SILs can be differenti- ated from normal columnar epithelia and inflam- mation with an average sensitivity and specificity of 77% +- 1 and 72% ? 9, respectively. Hence, the diagnostic content of spectral information at 380 nm excitation could play an important clinical role in endocervical sampling. This study indi- cates that it is spectoscopically difficult to dis- criminate samples with inflammation from SILs at 380 nm excitation. However, due to the small number of samples with inflammation examined at this excitation wavelength, analysis of a larger sample size is required to confirm these findings.
The analysis of tissue spectra acquired in this clinical study at 337 nm excitation using the multivariate statistical algorithm [5] indicates that tissue spectra at this excitation wavelength can be used to differentiate SILs from normal squamous tissues with an average sensitivity and specificity of 91% +- 6 and 82% t 1, respectively. Analysis of tissue spectra at 460 nm excitation indicates that using the same method of prepro- cessing followed by PCA and logistic discrimina- tion, SILs can be differentiated from normal squa- mous tissue with a very similar sensitivity and specificity. However, unlike spectra at 337 nm ex- citation, spectra at 460 nm excitation also can be used to discriminate between high grade and low grade SILs. As there is no additional significant diagnostic contribution at 337 nm excitation (compared to that at 460 nm excitation), it can be speculated that future algorithm development on a larger data set can be performed using spectra at 380 and 460 nm excitation only: a combination of spectral data at 380 and 460 nm excitation can be used to differentiate SILs from nondiseased tis- sues (normal squamous and columnar epithelia

Spectroscopic Diagnosis of CIN 73
=! I v, 1
2 0.75
0
A
. . . . . . . . . . . . . a- - - A
8
A
. . . . . . . . . . A
A A
A 0
0 . 0 0 0
0 0 .
0
a. . . . . . . . . . . . . .
High Grade S L
8 0.25 1 . . . . . . . . . . . . . . . . . . . . . . . . . . . . . . . . . . . . . . . . . . . . . . . . . . . . . . . 'c: j 24 g 1
A
a A
A A A A 0 0 0 1 u
Sample Number
Fig. 8. "he posterior probability of belonging to the high grade SIL category of SILs in the preprocessed data set containing normalized fluorescence spectra at 460 nm excitation.
TABLE 5. Retrospective and Prospective Estimate of Multivariate Statistical Algorithm's Performance Using Normalized Spectra at 460 nm Excitation to Differentiate High Grade from Low Grade SILs
(a) Retrospective Classification Low made SIL High made SIL Low grade SIL 79% High grade SIL 21%
18% 82%
(b) Prospective Classification Low grade SIL High grade SIL Low grade SIL 72% 27% High grade SIL 21% 77%
and inflammation) and tissue spectra at 460 nm excitation alone can be used to discriminate be- tween high grade and low grade SILs. The advan- tage realized in eliminating acquisition of tissue spectra at 337 nm excitation (ultraviolet wave- length) is that it can dramatically reduce the cost of developing a system to measure in vivo tissue spectra and remove any concerns of cell mutage- nicity due to ultraviolet excitation [lo, 111.
Although statistical methods such as PCA and logistic discrimination can be employed to provide identification of clinically important di- agnostic categories using spectra at 380 and 460 nm excitation, these methods do not provide in- sight into the physical mechanisms that lead to changes in the autofluorescence observed in neo- plasia. In order to appreciate the basis for the
spectral discrimination, tissue constituents that contribute to the total fluorescence quantum effi- ciency in the spectral regions of interest will be identified from optically thin frozen sections of cervical tissue using a combination of fluores- cence and light microscopy. Fluorescence spectra of these microscopic structures will be recorded using a spectrograph coupled to an intensified di- ode array. Mathematical models will be developed to relate the fluorescence spectra of the individ- ual microscopic tissue constituents to the macro- scopic turbid tissue spectra acquired in vivo, to gain a more comprehensive understanding of the morphologic and chemical composition of the var- ious disease states of cervical tissue.
In summary, the results of the study re- ported here demonstrate that fluorescence spec- tra at multiple excitation wavelengths are essen- tial for the detection and differential diagnosis of SILs at colposcopy. This has important clinical implications in the advancement of current detec- tion methods for cervical pre-cancer. In addition to having an improved predictive ability relative to colposcopy in expert hands, the algorithms pre- sented here can be implemented in software, hence placing automated, fast and non invasive pre-cancer and cancer detection in the hands of less experienced practitioners. Therefore, the uti- lization of a diagnostic method based on fluores- cence spectroscopy could potentially allow more effective wide-scale diagnosis, and help reduce the mortality associated with cervical cancer.

74 Ramanujam et al. TABLE 6. Comparison of Average Sensitivity and Specificity of Multivariate Statistical Algorithm at 480 nm Excitation to Average Sensitivity and Specificity of Colposcopy in Expert Hands
Algorithm (460 nm excitation) Colposcopy in expert hands Classification Sensitivity Specificity Sensitivity Specificity Disease vs. nondiseased 91% +- 3 76% f 1 94% f 6 48% * 23 High grade SIL vs. low grade SIL 80% +- 4 76% f 5 79% f 23 66% +- 18
REFERENCES
1.
2.
3.
4.
5.
6.
Wright TC, Kurman RJ, Ferenczy A. Cervical intraepi- thelial neoplasia. In: Blaustein A, ed. “Pathology of the Female Genital Tract.” New York: Springer-Verlag.
Koss LG. The Papanicolau test for cervical cancer detec- tion. J A M A 1989; 261:737-743. Mitchell MF. Accuracy of colposcopy. Consultations in Obstetrics and Gynecology 1994; 6(1): 70-73. Beral V. Prediction of cervical cancer incidence and mor- tality in England and Wales. Lancet 1986; i:495. Ramanujam N, Mitchell MF, Mahadevan A, Thomsen S, Malpica A, Wright T, Atkinson N, Richards-Kortum RR. Development of a multivariate statistical algorithm to analyze human cervical tissue fluorescence spectra ac- quired In Vivo. Lasers Surg Med, 1996; 19:46-62. Mahadevan A, Mitchell MF, Silva E, Thomsen S, Rich- ards-Kortum RR. Study of the fluorescence properties of
1994, pp 156-177.
normal and neoplastic human cervical tissues. Lasers Surg Med 1993; 13:647-655.
7. Dillon RW, Goldstein M. “Multivariate Analysis: Meth- ods and Applications.” New York: John Wiley & Sons, 1984.
8. Devore JL. ‘Robability and Statistics for Engineering and the Science.” Pacific Grove, CA: BrooksJCole, 1992.
9. Albert A, Harris EK. “Multivariate Interpretation of Clinical Laboratory Data.” New York: Marcel Dekker, 1987.
10. Andley UP, Lewis RM, Reddan JR, Kochevar IE. Action spectrum for cytotoxicity in the UVA- and UVB-wave- length region in the cultured lens epithelial cells. Inves- tigative Opthalmol Vis Sci 1994; 35(2), 367-373.
11. Matsunaga T, Hieda K, Nikaido 0. Wavelength depen- dent formation of thymine dimers and (6-4) phtoproducts in DNA by monochromatic ultraviolet light ranging from 150 to 365 nm. Photochem Photobiol 1991; 54(3), 403- 410.