spectrophotometry. spectrophotometry determines concentration of a substance in solution –measures...
TRANSCRIPT

SPECTROPHOTOMETRY

Spectrophotometry
• Determines concentration of a substance in solution– Measures light absorbed by solution at a
specific wavelength

Spectrophotometry
• One of the simplest and most widely used methods to determine the amount of protein or nucleic acid present in a given solution

Spectrophotometry
• Proteins do not absorb in visible wavelength region unless they have a prosthetic group (e.g., Fe2+), or an unnatural amino acid

Spectrophotometry
• The amino acids tryptophan, tyrosine & cytosine absorb light in the UV wavelength
• Aromatic rings in the bases of nucleic acids also absorb light in the UV range

Spectrophotometry
• Visible region: low energy electronic transition due to:a. Compounds containing transition metals
b. Large aromatic structures & conjugated double bond systems (vitamin A, retinal, heme)
• UV region (200-400 nm): a. Small conjugated ring systems (Phe, Tyr, Trp)
Spectrophotometry
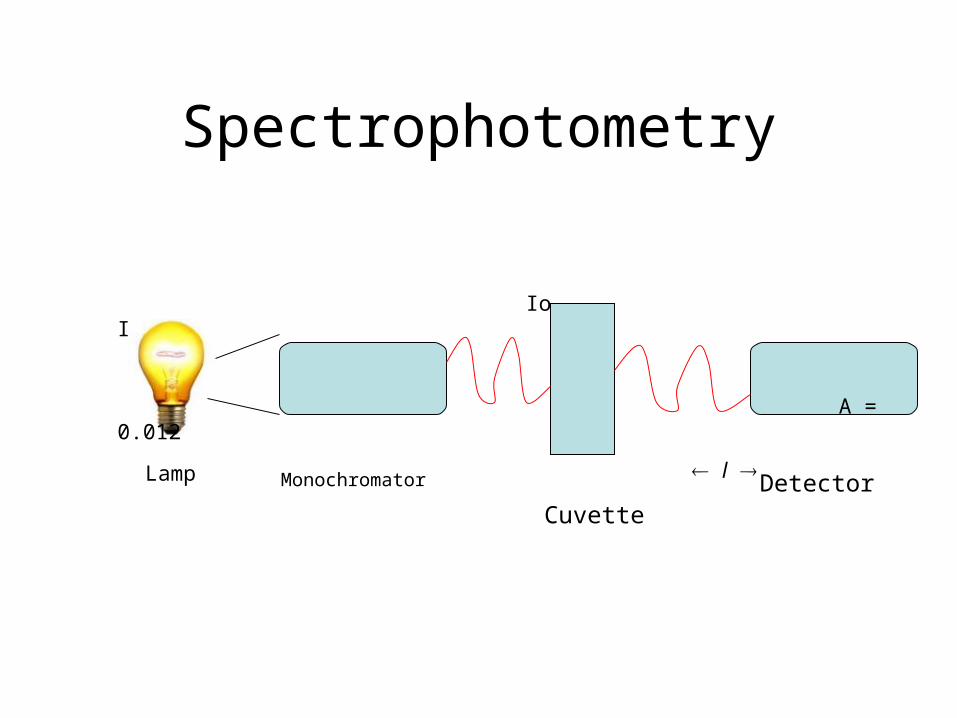
Lamp
Io I
A = 0.012
l
Monochromator
CuvetteDetector

Spectrophotometers
• Light source (Lamp)
• Optical filters or prism
• Tube or cuvette
• Photocell or photomultiplier tube

Light source (Lamp)
• Visible region = tungsten or tungsten-halogen
• UV light = deuterium or hydrogen lamp

Optical filters/prisms
• To limit light to a certain wavelength
• Monochromator can isolate a specific wavelength of white light and allow it to pass through the solution being analyzed

Tubes or cuvettes
• Visible range = glass cuvette
• UV range = quartz cuvette

Photocell
• To detect transmitted light
Spectrophotometry
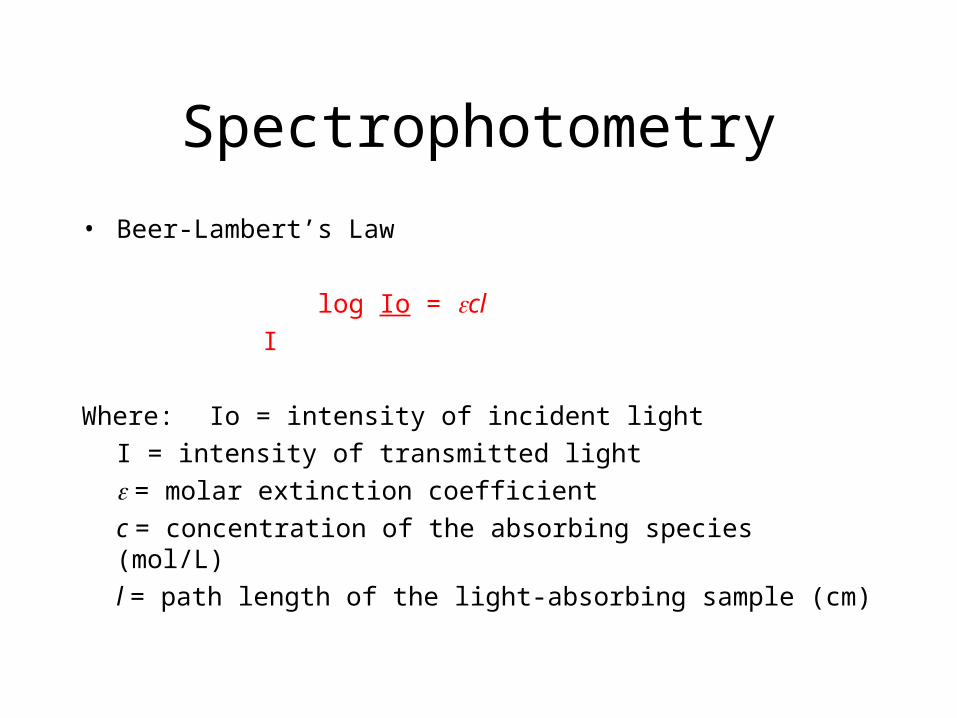
• Beer-Lambert’s Law
log Io = cl
I
Where: Io = intensity of incident light
I = intensity of transmitted light
= molar extinction coefficient
c = concentration of the absorbing species (mol/L)
l = path length of the light-absorbing sample (cm)

Beer-Lambert’s Law
• The fraction of the incident light absorbed by a solution at a given wavelength is related to
a. thickness of the absorbing layer (path length) and
b. concentration of the absorbing species

Visible region wavelengthColor Wavelength (nm)
Ultraviolet 400 and under
Violet 400 - 450
Blue 450 - 500
Green 500 - 570
Yellow 570 - 590
Orange 590 - 620
Red 620 - 650
Infrared 750 & over

Beer-Lambert’s Law
• Concentration amount of light absorbed
A = abc = log(100/%T)
Where A = absorbance a = absorptivity of the compound under
standard conditionsb = light path of the solutionc = concentration of the compound%T = percent transmittance

Beer-Lambert’s Law
• Absorbance
A = K x C = Log10Io I
Where: Io = amount of light absorbed by the solution expressed as absorbance or optical density
K = constant C = concentration of the substance

Transmittance
• Defined as the ratio of the intensity of light emerging from the solution (I) to that of incident light entering (Io)
T = I
Io Io I

Transmittance
• Inversely related to the concentration of the solution and is expressed in %
% T = 1 x 100
Io

Transmittance
• 100% transmittance means no light is absorbed by the solution so that incident light is 100% transmitted

Absorbance & Transmittance
• Absorbance concentration
• Transmittance 1/ to concentration and absorbance

Sample Problem
• Cytosine has a molar extinction coefficient of 6 x 10³ mol-1 cm-1 at 270 nm at pH 7. Calculate absorbance of
1 x 10⁻³ M cytosine solution in 1mm cell at 270 nm
A = Log I0 = lc
I

Sample Problem
• Solution:
1. A = lc = (6 x 103)x (0.1) x (1 x 10-3)
= 6 x 10-1
= 0.6 (O.D.)
O.D. between 0.1 and 2 are most reliable

Spectrophotometry
• Clinical applications:
1. Aromatic amino acids have characteristic strong absorbance of light at a wavelength of 280 nm ex. Tryptophan & tyrosine


Calculation
Cu = Cs x A(u) x D
A(s)
Where: Cs = concentration of standard
Cu = concentration of unknown
A(s) = absorbance of standard
A(u) = absorbance of unknown
D = dilution factor

Calibration Curve
Glucose Standard Calibration Curve
0
0.2
0.4
0.6
0.8
1
1.2
60 120 180 200
Mg% glucose
Abso
rban
ce
Linear ( )
Glucose Std. Concn.
Absorbance
60 mg% 0.2
120 mg% 0.4
U 0.5
180 mg% 0.6

Colorimetric determination of reducing sugars
• Dinitrosalicylate
• Potassium ferric hexacyanid (Prussian blue)
• Nelson-Somogyi (molybdenum blue)

DNS method
• Developed by Sumner & Sisler (1944) and modified by Miller (1959)
• Based on reduction of sugars by DNS under alkaline conditions to yield 3-amino-5-nitrosalicylate (brown color)

DNS method
• Measured at 540 nm
• Quantity of reducing sugar is extrapolated from a calibration curve prepared with D-glucose
• Amylase-catalyzed reactions are typically buffered at pH5 using acetate or citrate

DNS method
• Amylase-catalyzed reactions are typically buffered at pH 5 using acetate or citrate
• Citrate may interfere with DNS color development

Principle
• Carbohydrates are essentially aldehydes or ketones that contain multiple hydroxyl (-OH) groups
• Monosaccharides can be aldoses (glucose) or ketoses (fructose

Principle
• Both aldoses & ketoses occur in equilibrium between the open-chain forms and cyclic forms (chain lengths of C4)
• These are generated by bond formation between one of the (-OH) groups of the sugar chain with the C of the aldehyde or keto group to form a hemiacetal bond.

Principle

Principle

Principle

Principle
• When salivary amylase is added to starch, a hydrolysis reaction is initiated in which water breaks bonds, releasing maltose

Principle
• DNS tests for the presence of free carbonyl groups (C=O), the so-called reducing sugars
• Involves oxidation of the aldehyde functional groups in glucose and the ketone functional groups in fructose

Principle
• Simultaneously, 3,5 DNS is reduced to 3-amino, 5 nitrosalicylic acid under alkaline conditions
• As hydrolysis proceeds, more reducing sugar will be available to react with the 3,5 DNS

Principle
Aldehyde group carboxyl group
3,5 Dinitrosalicylic 3-amino, 5 nitrosalicylic
oxidation
reduction

Standard Absorbance Curve
• Done by reacting know concentration of glucose with DNS then determining absorbance at 540 nm
• Plot absorbance vs. glucose concentration
Absorbance
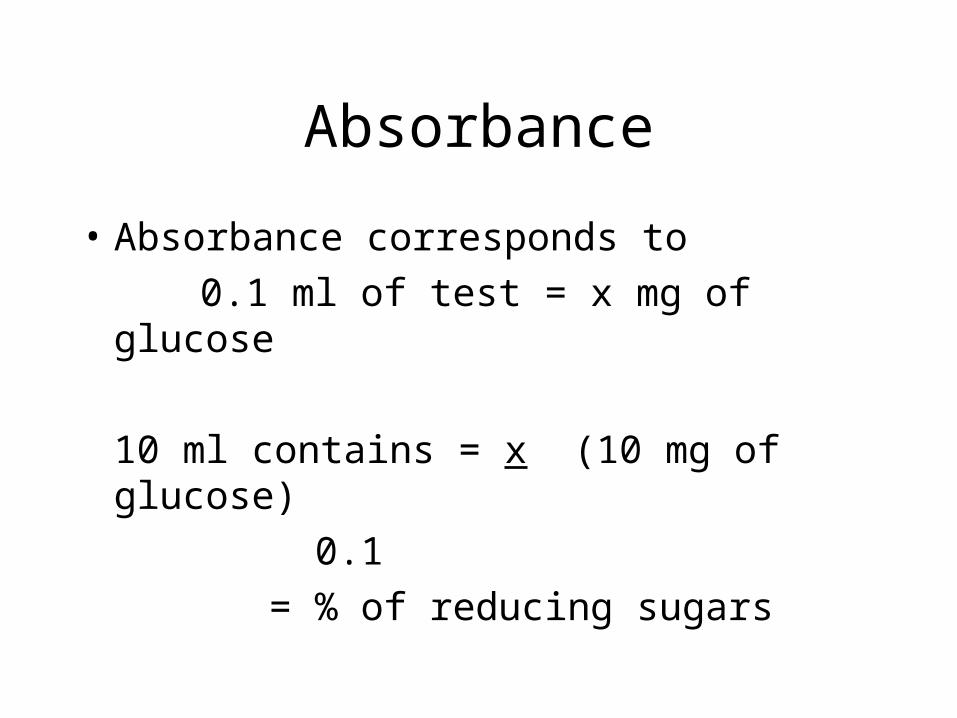
• Absorbance corresponds to
0.1 ml of test = x mg of glucose
10 ml contains = x (10 mg of glucose)
0.1
= % of reducing sugars